-
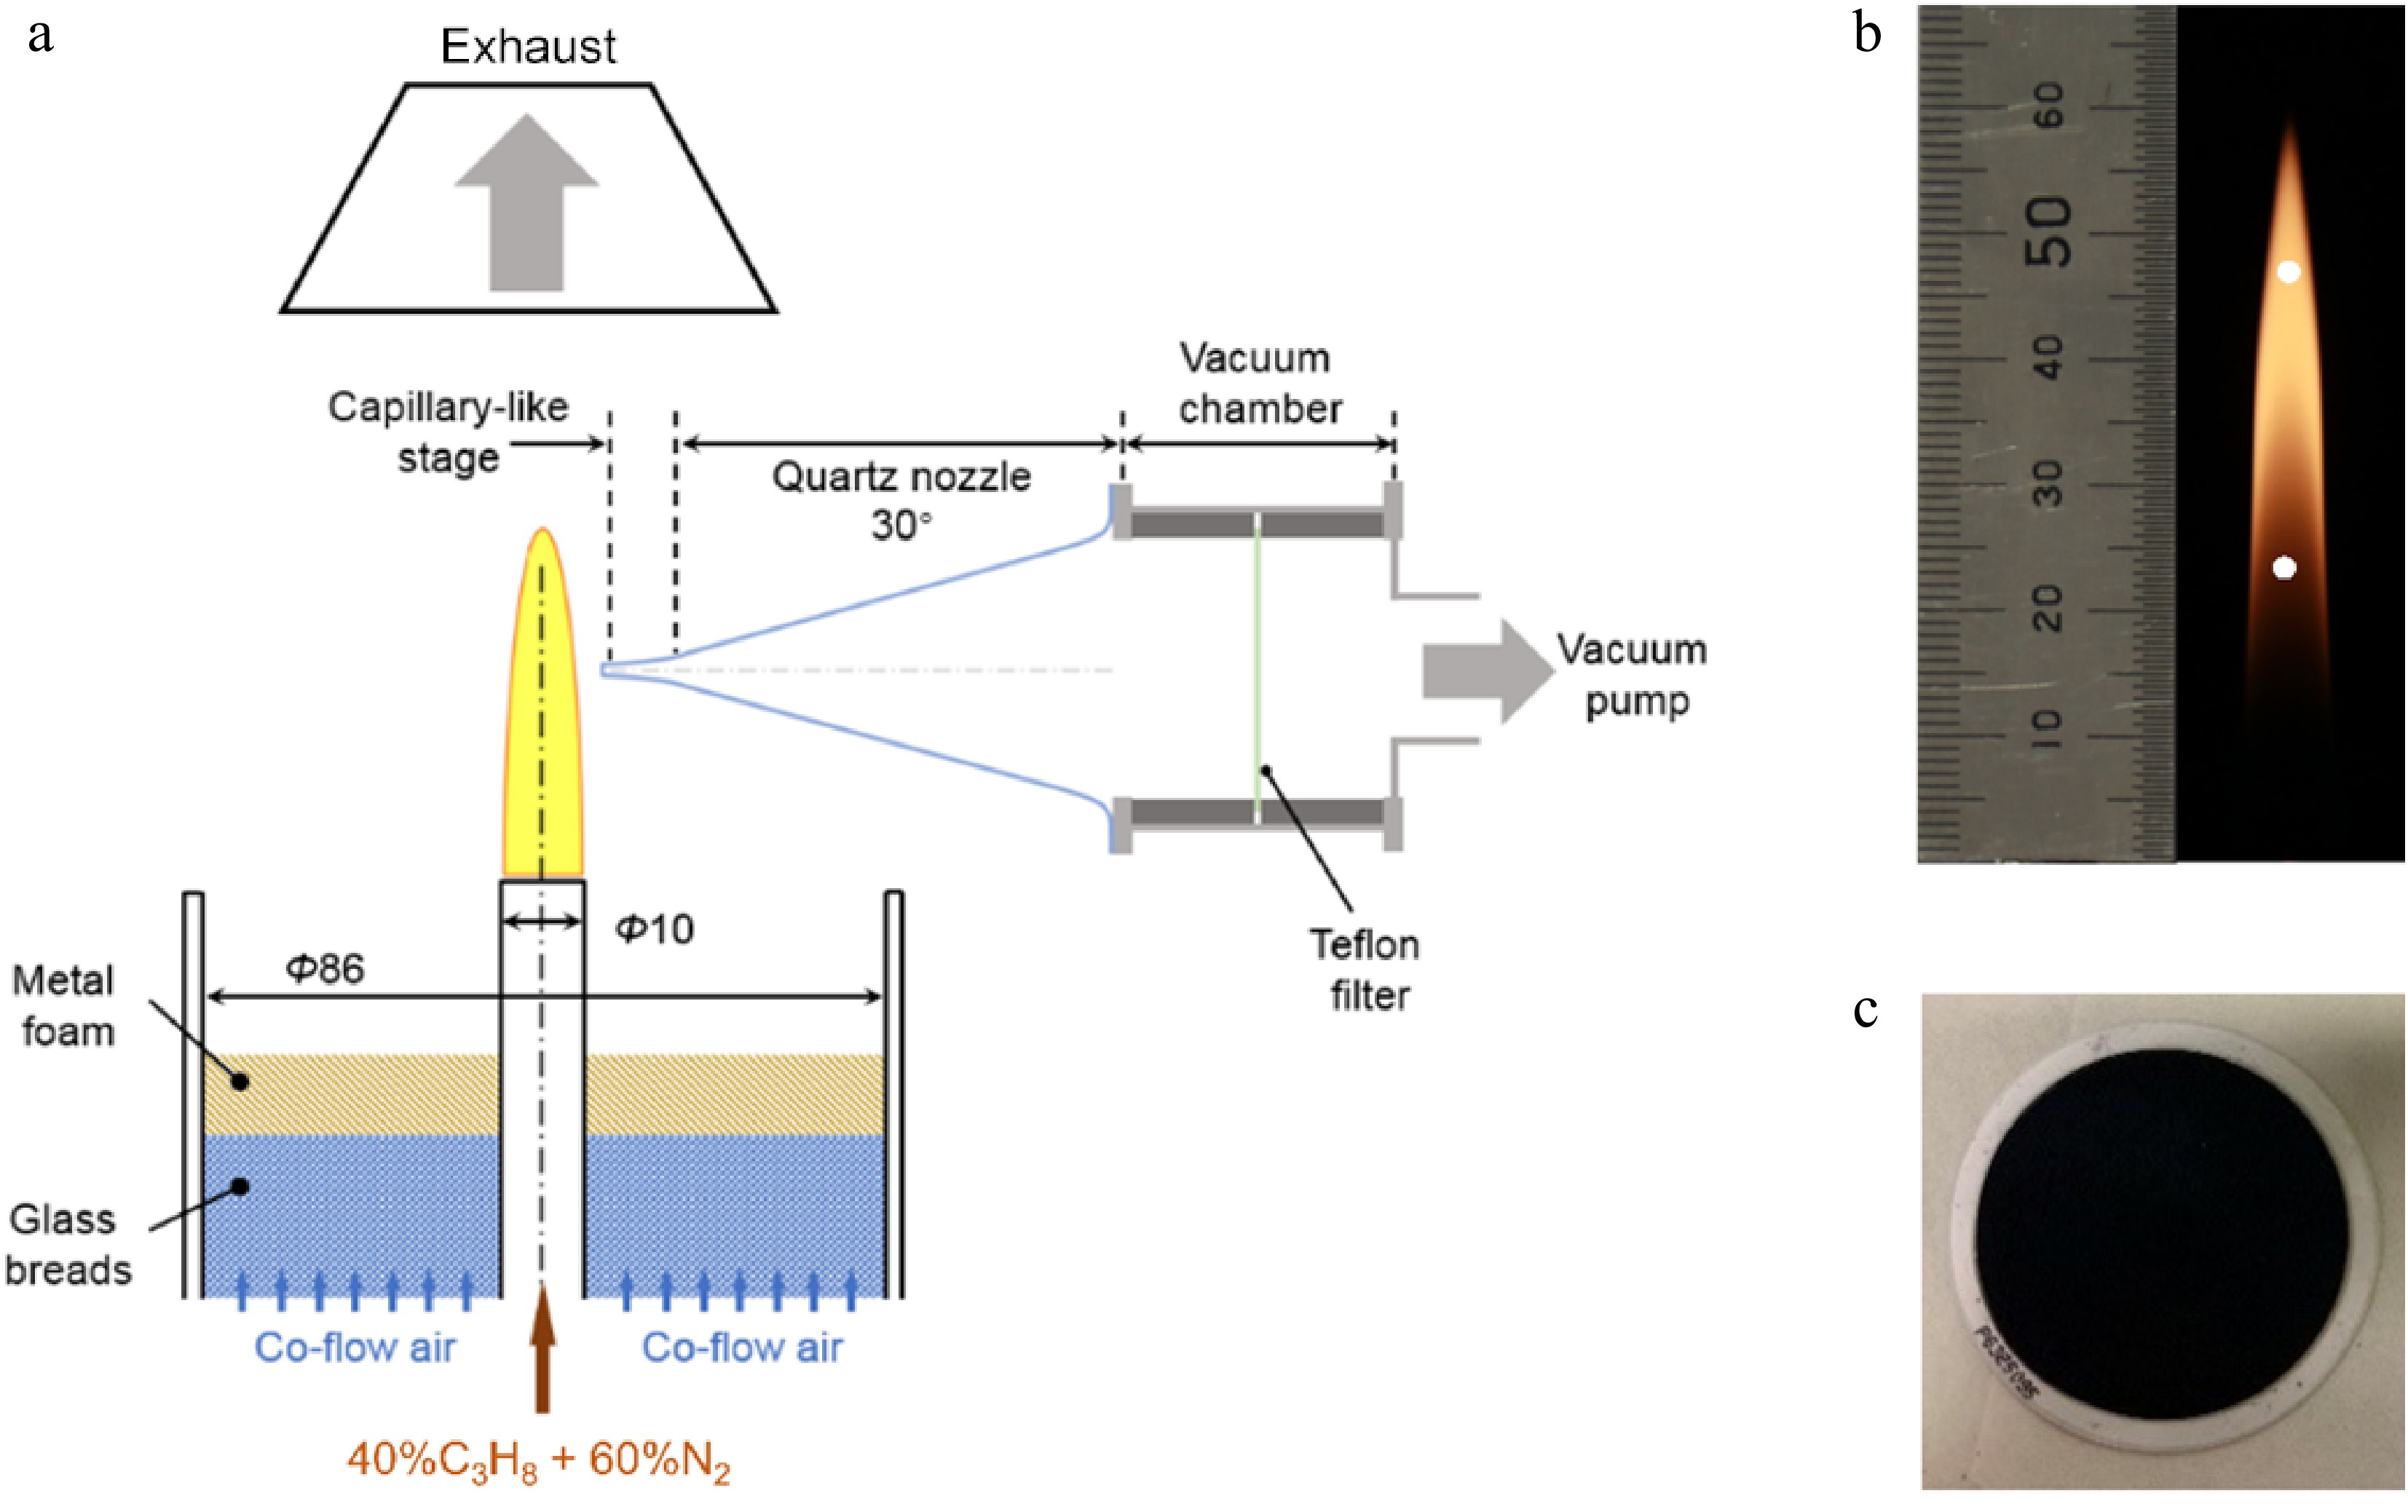
Figure 1.
(a) Schematic diagram of the experimental apparatus. (b) The propane co-flow diffusion flame with the sampling positions hinted by white circles. (c) Teflon filter (white) after sampling, showing that the cross-section area is completely covered by soot (black).
-
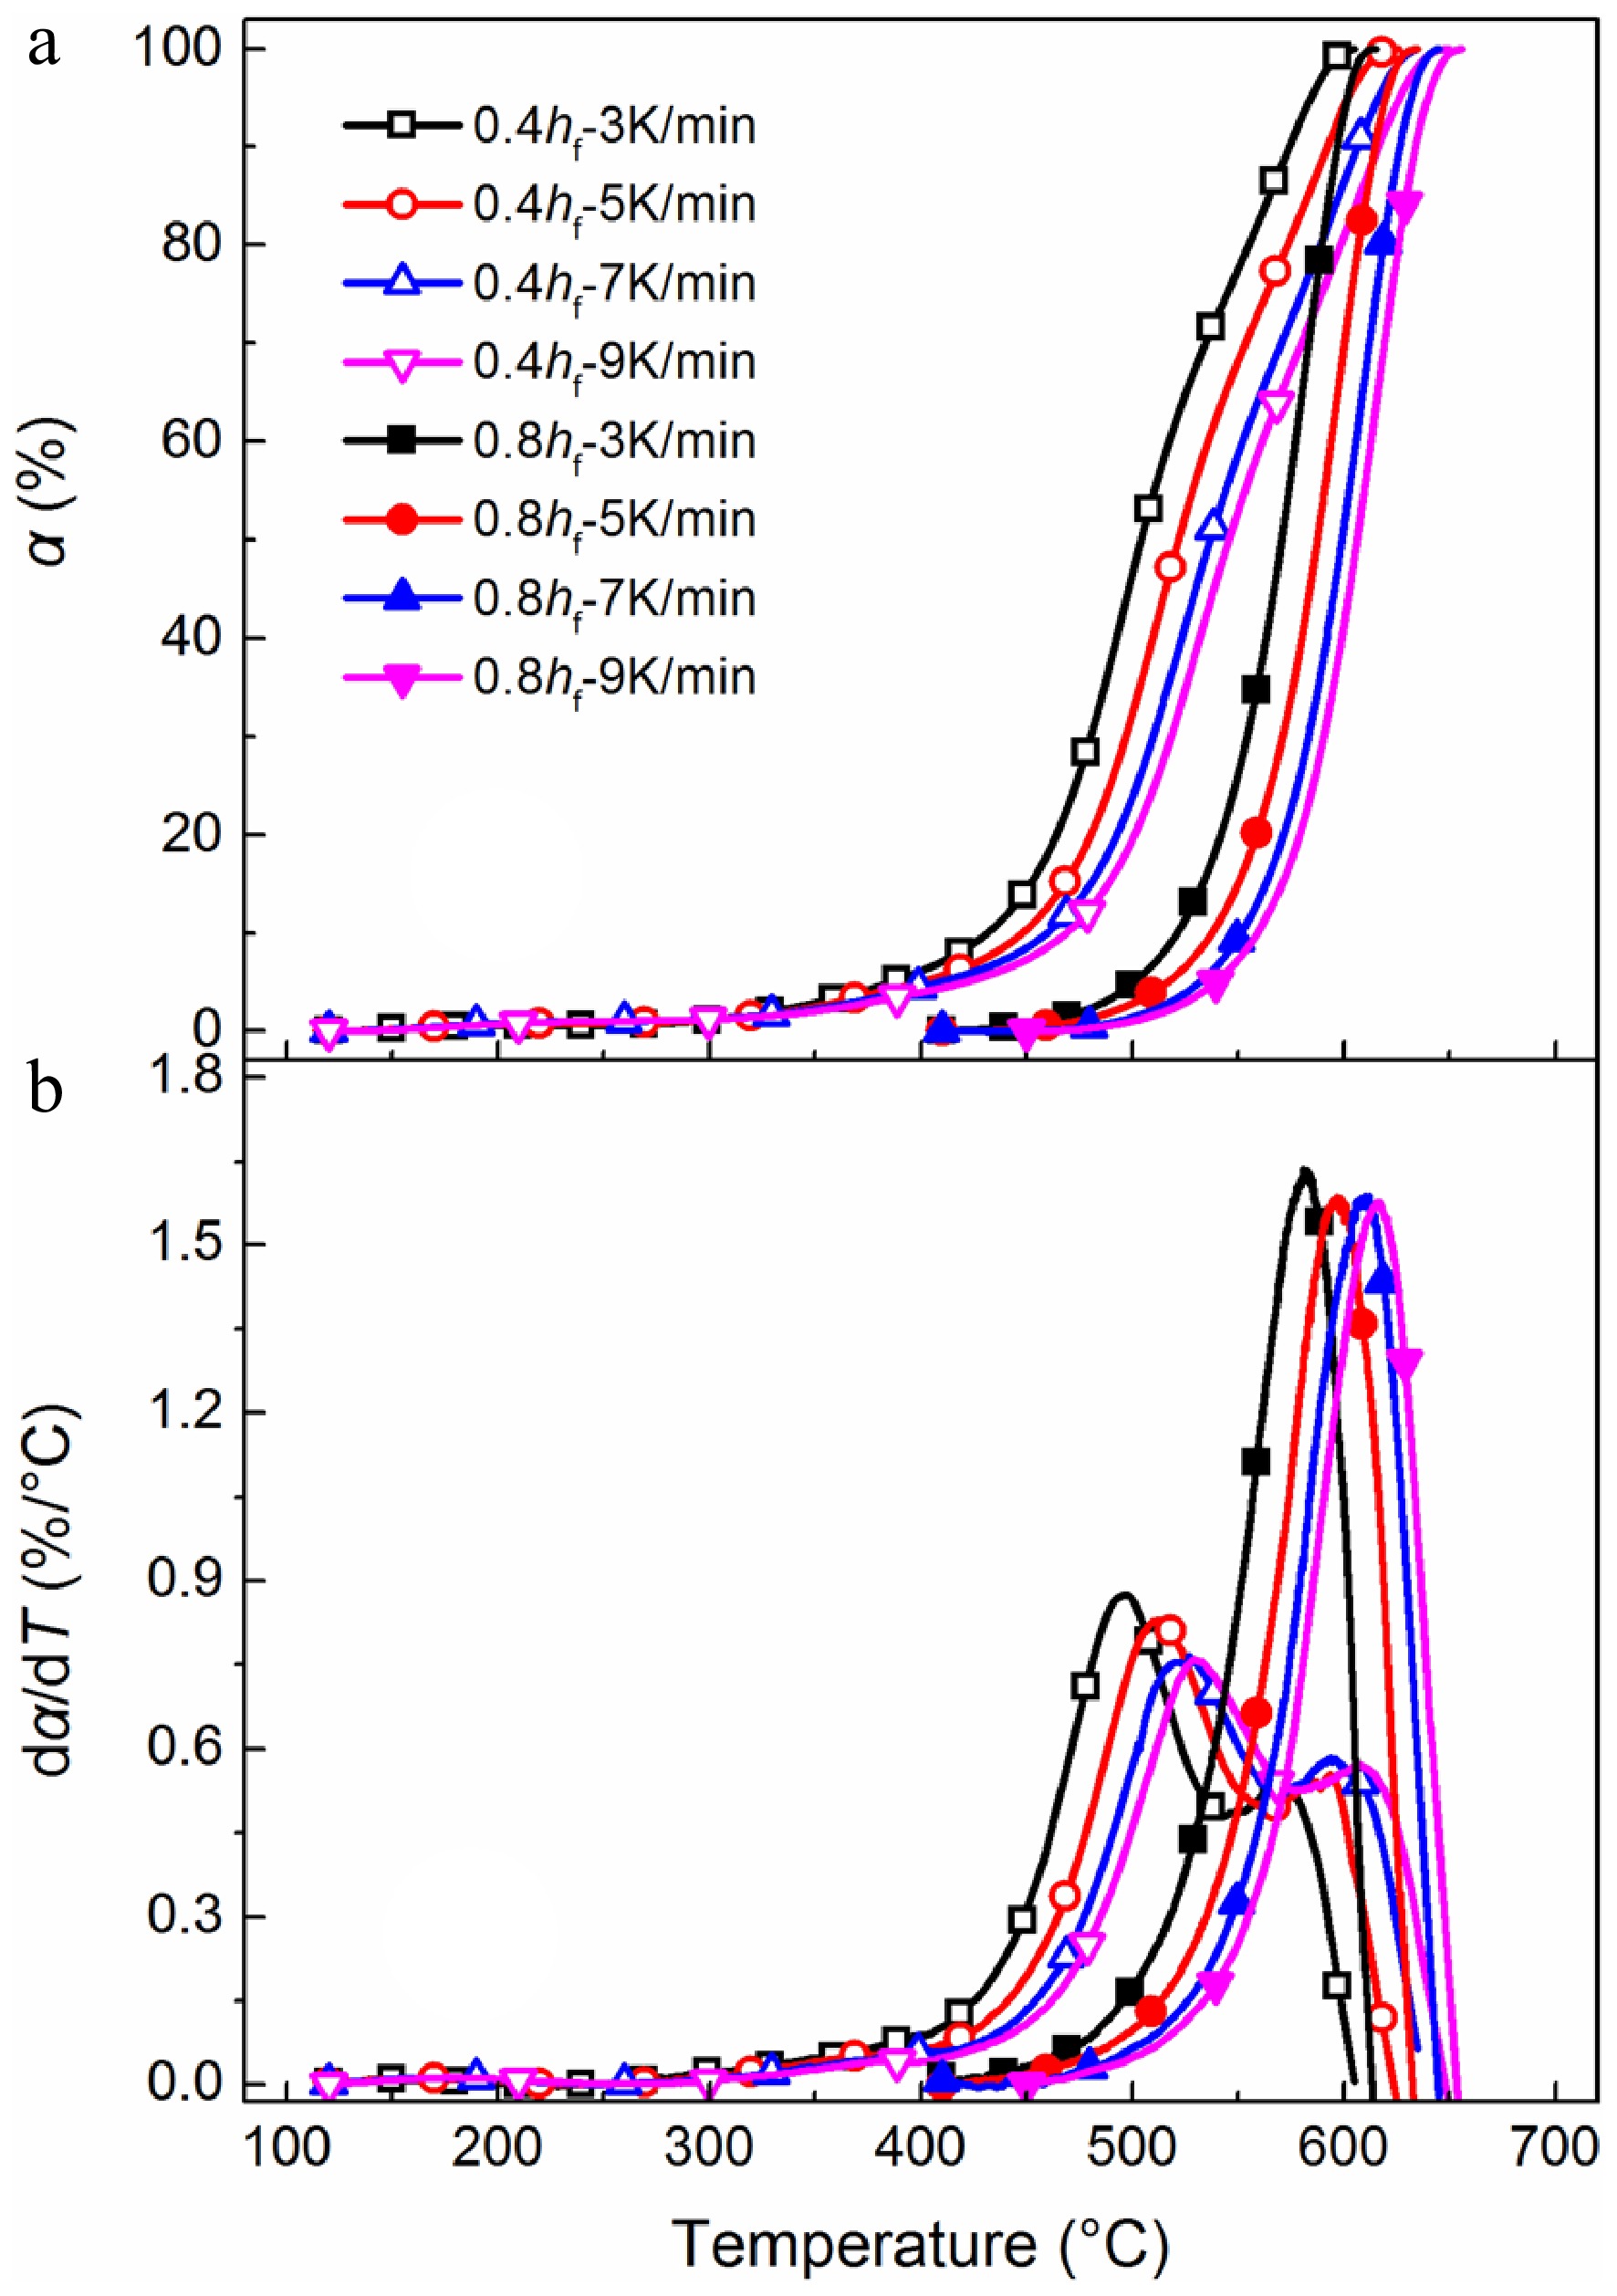
Figure 2.
(a) TG, and (b) DTG curves for soot sampled at 0.4 hf and 0.8 hf. Samples are heated from 50 to 750 °C with heating rates of 3, 5, 7, and 9 °C/min.
-
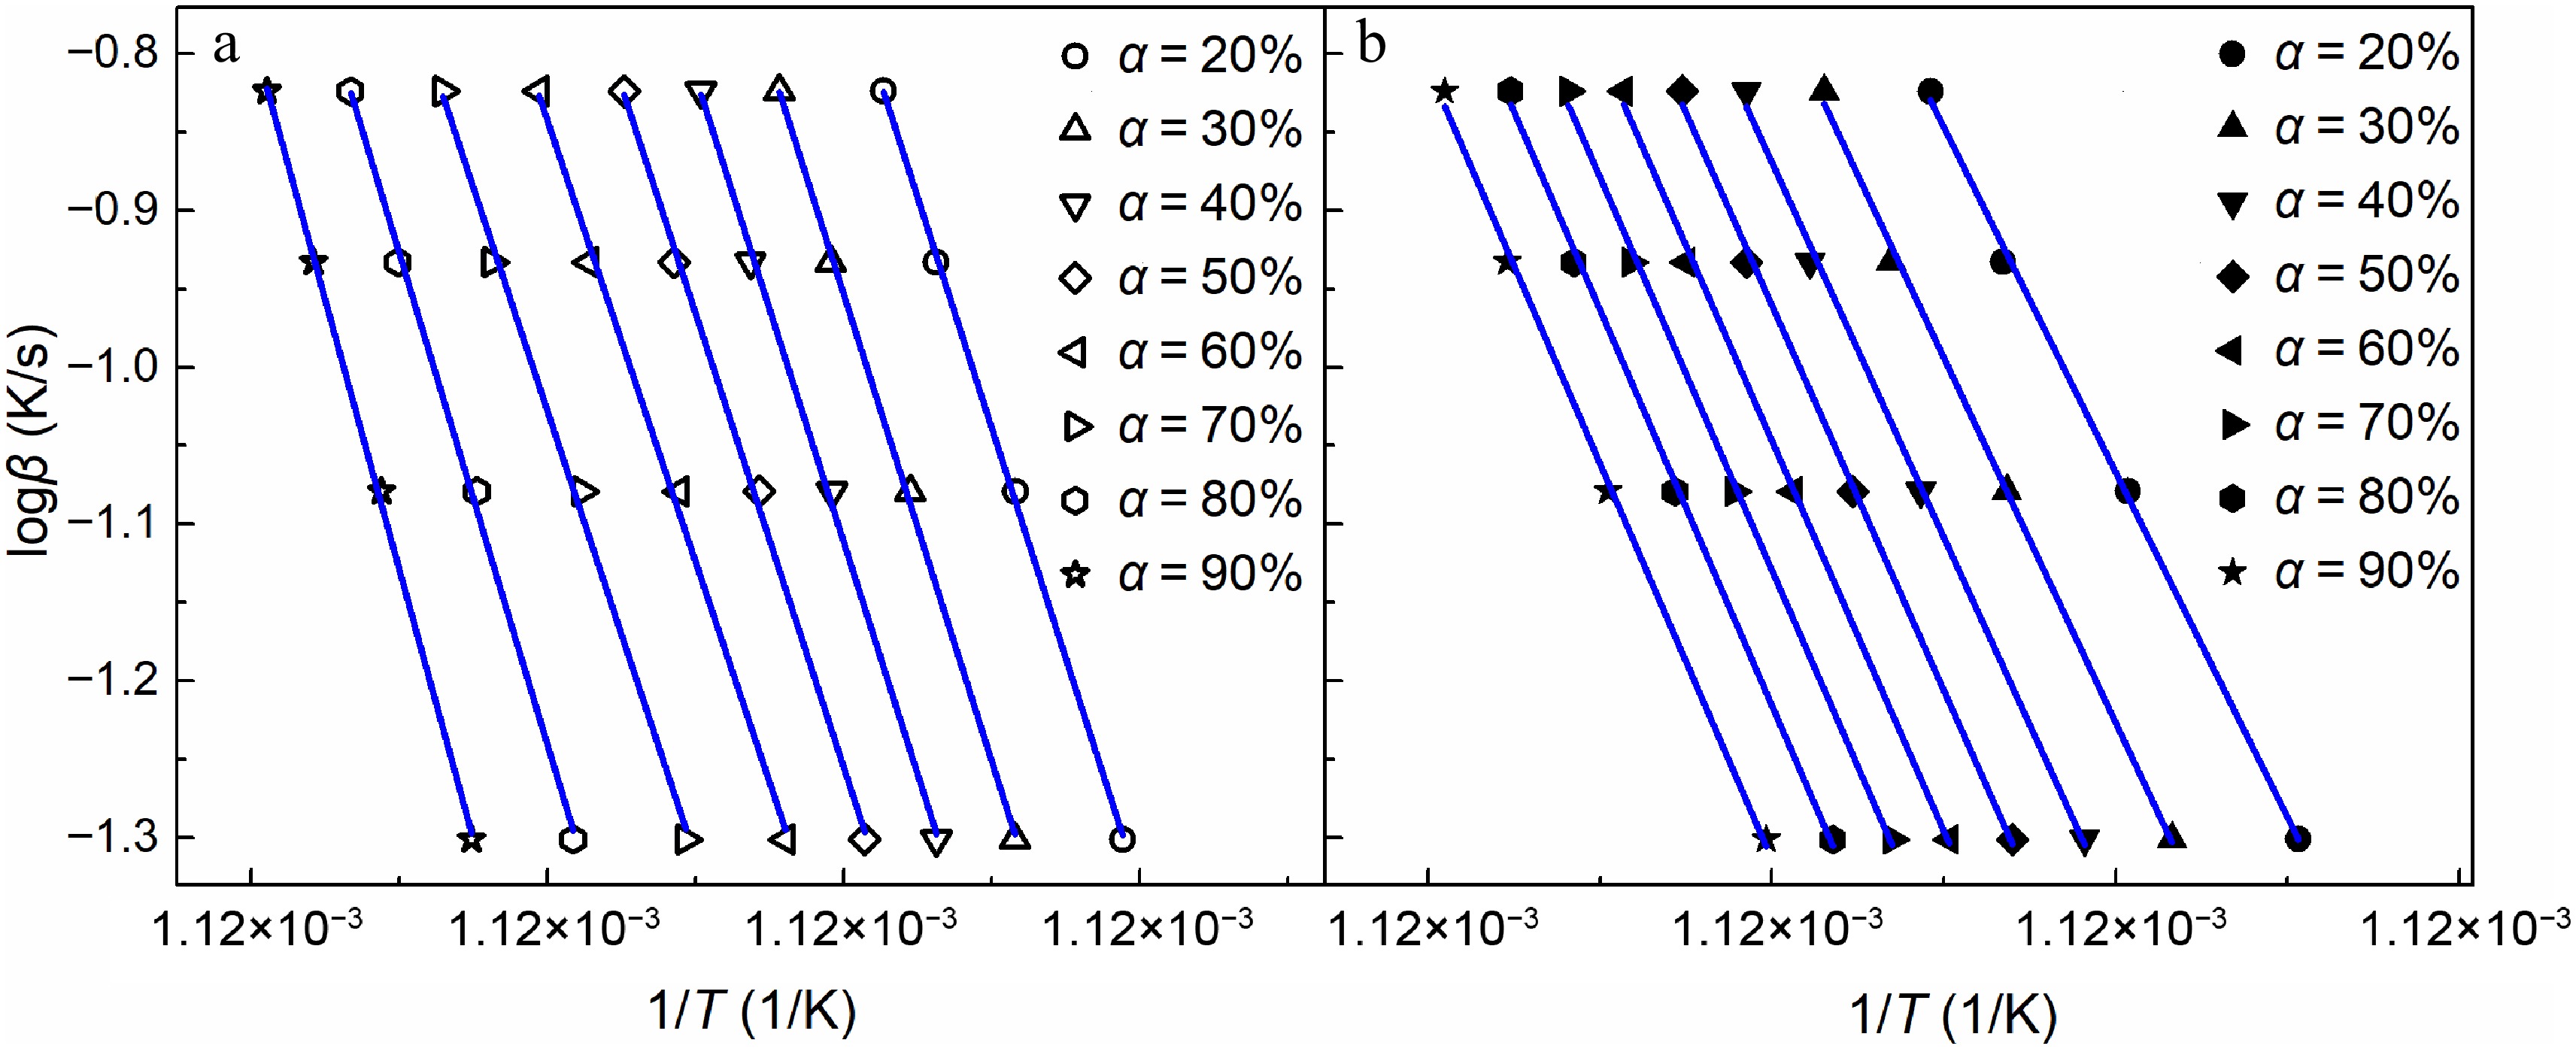
Figure 3.
Isoconversional plots under various conversions (α = 20%−90%) for soot sampled at (a) 0.4 hf, and (b) 0.8 hf. Symbols are the experimental results, while lines are the fitted results.
-
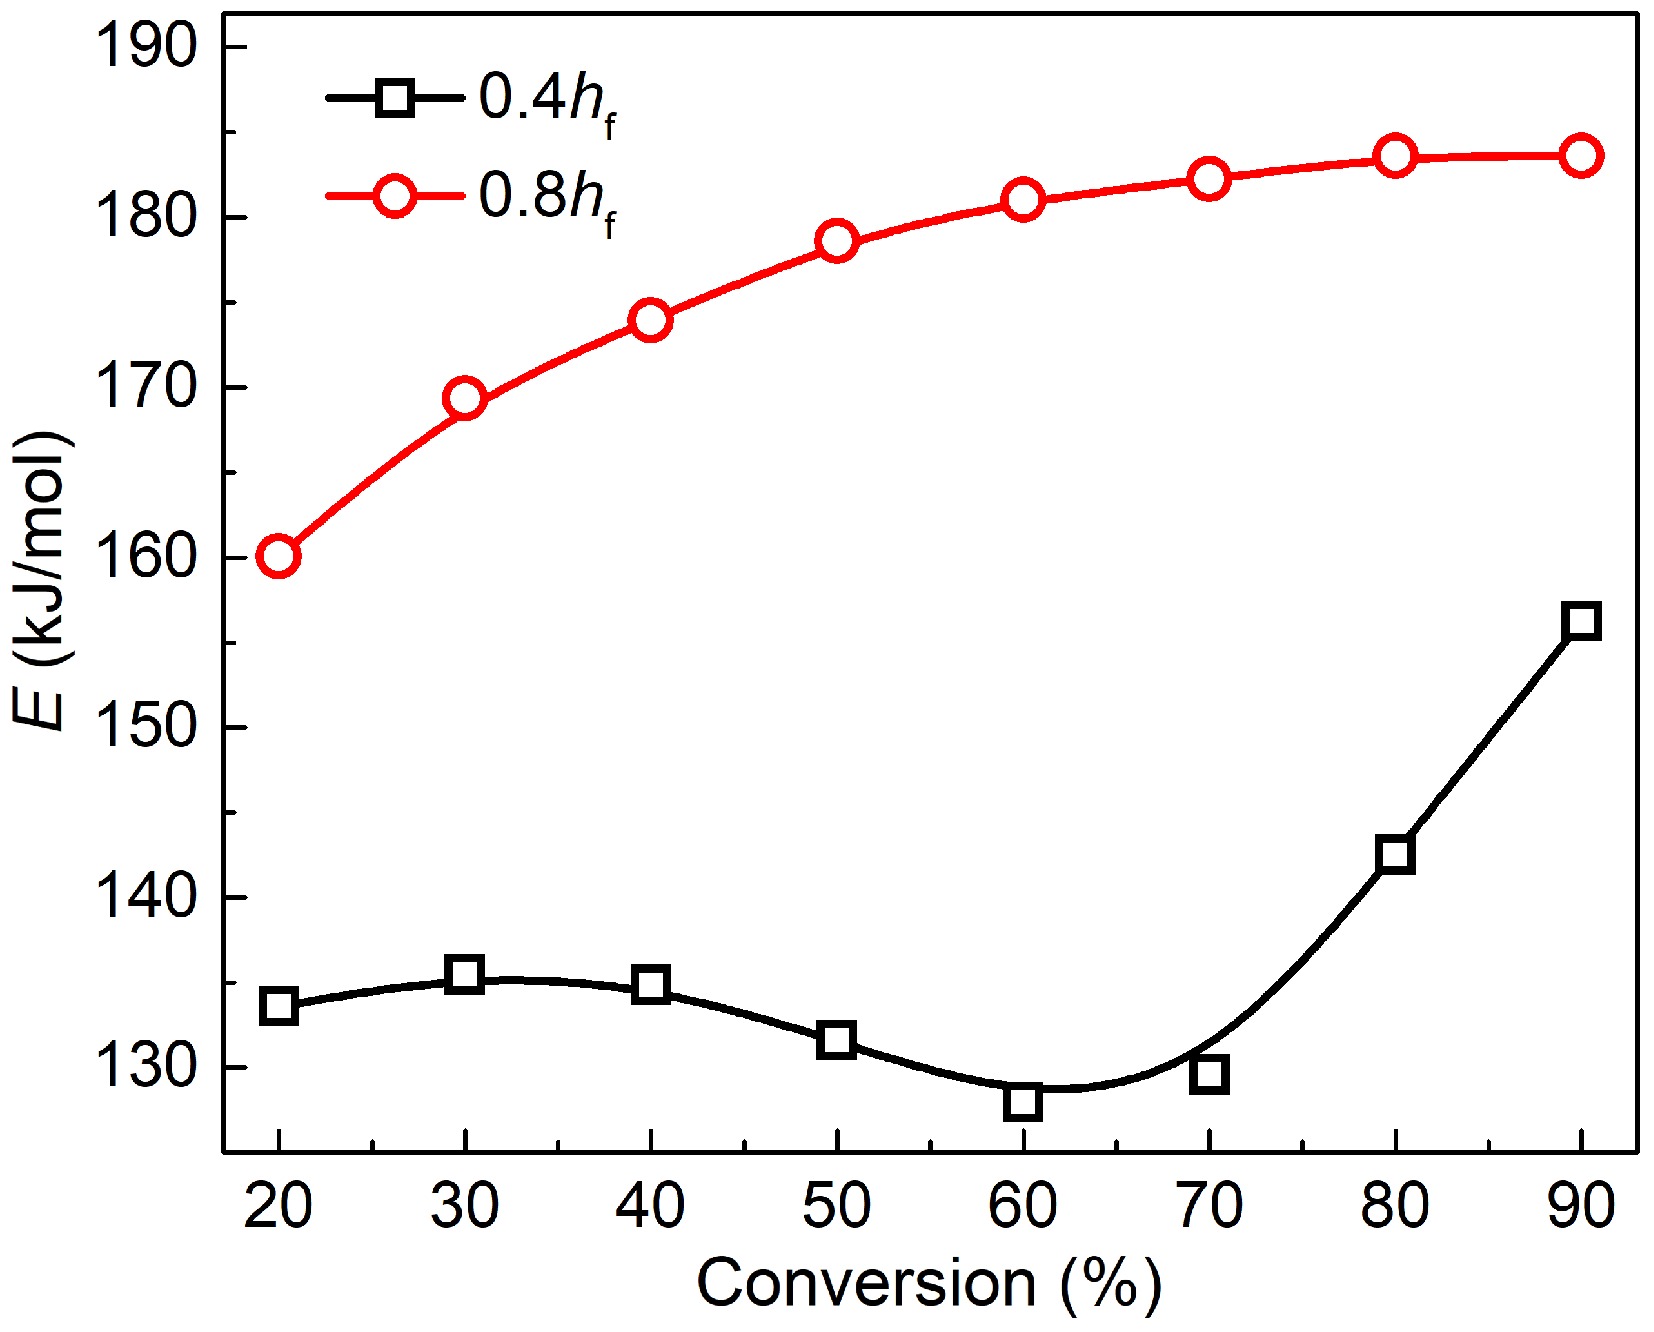
Figure 4.
Plots of activation energy vs conversion rate for soot sampled at 0.4 hf (square) and 0.8 hf (circle).
-
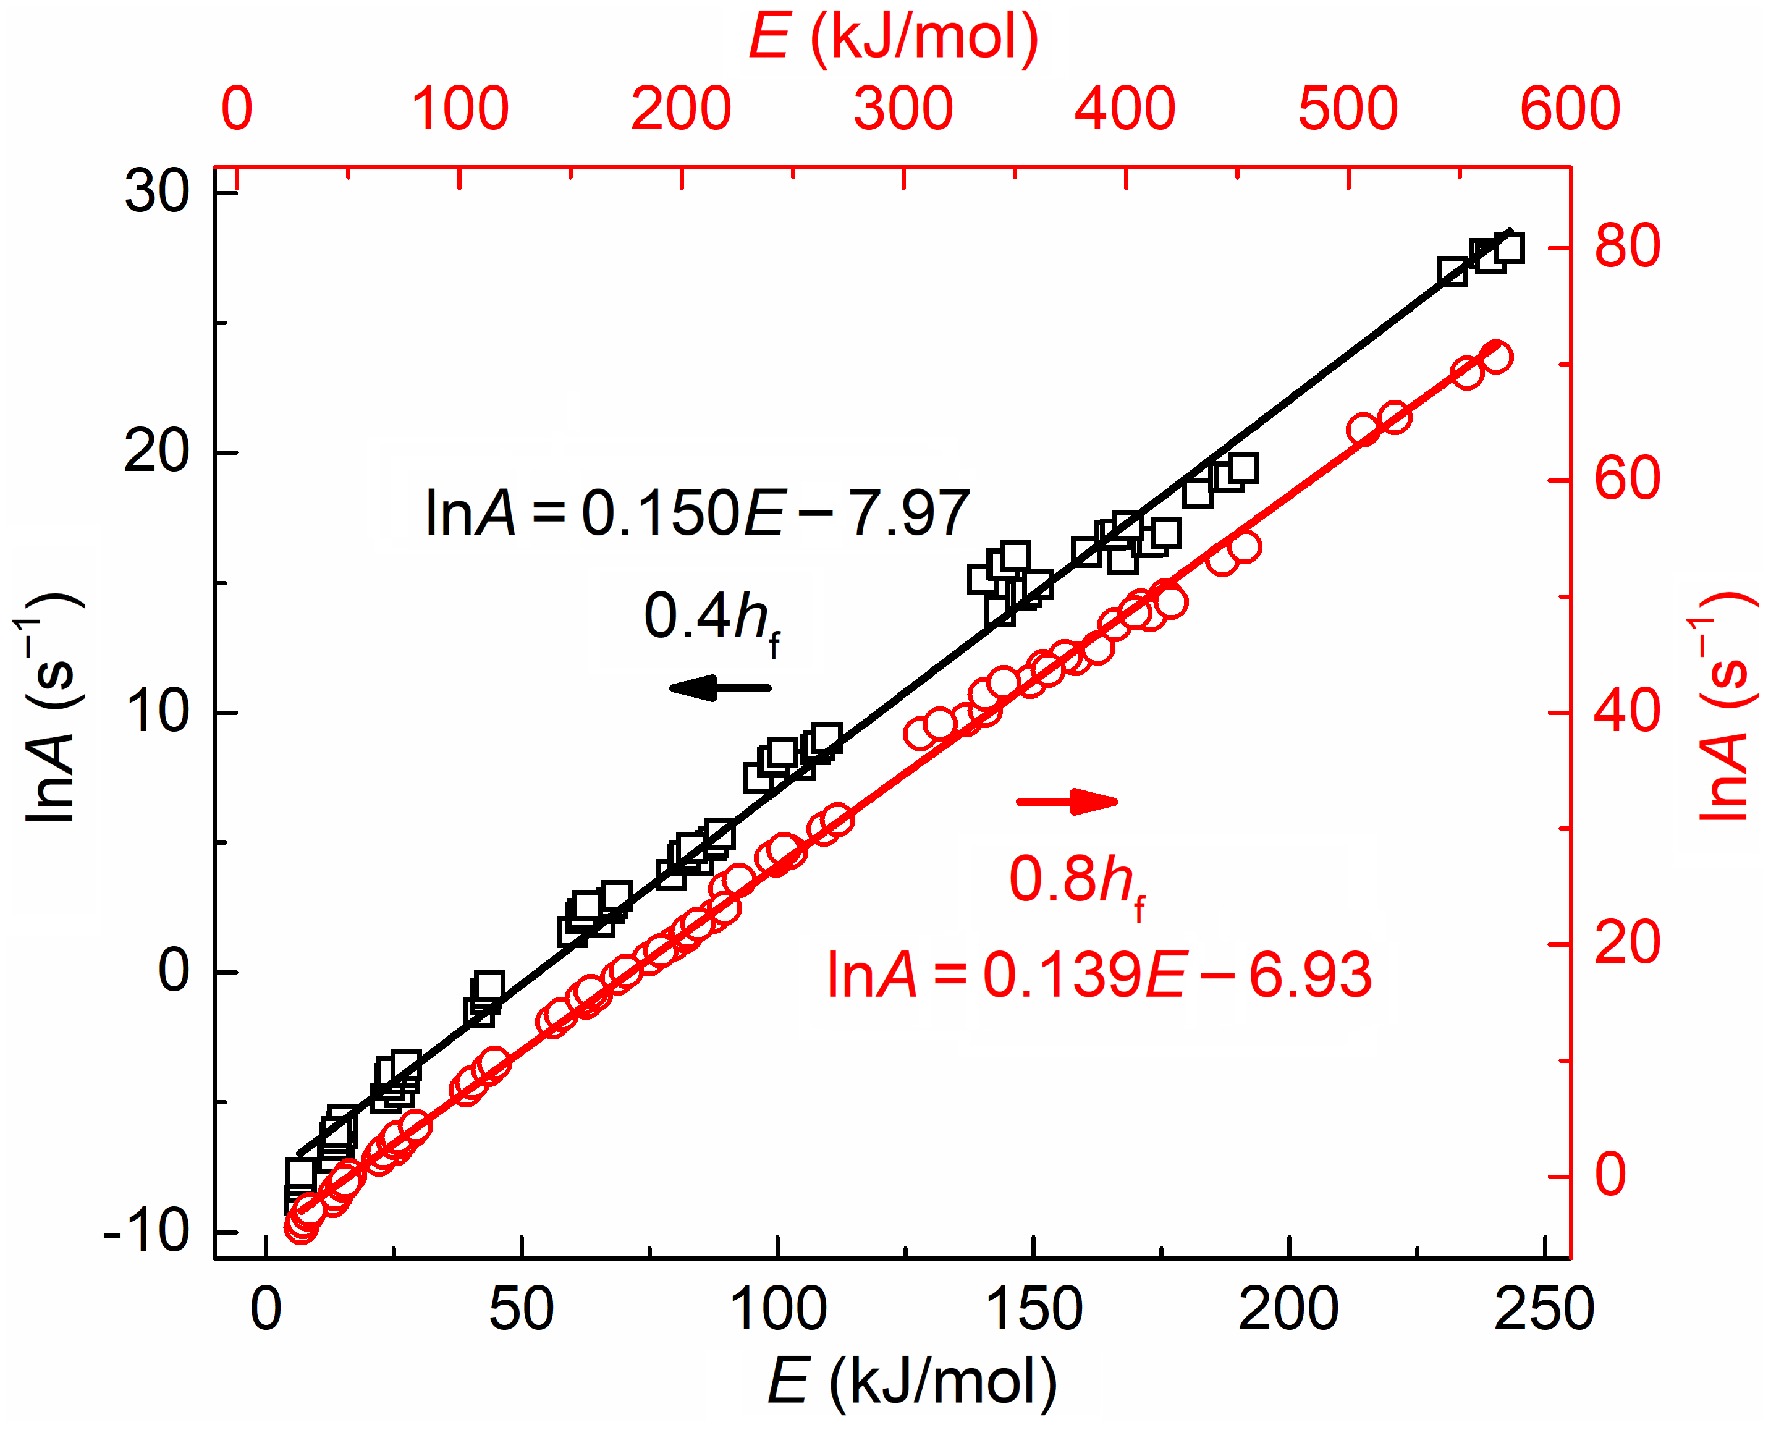
Figure 5.
Variations in activation energy with pre-exponential factors for soot sampled at 0.4 hf (square) and 0.8 hf (circle).
-
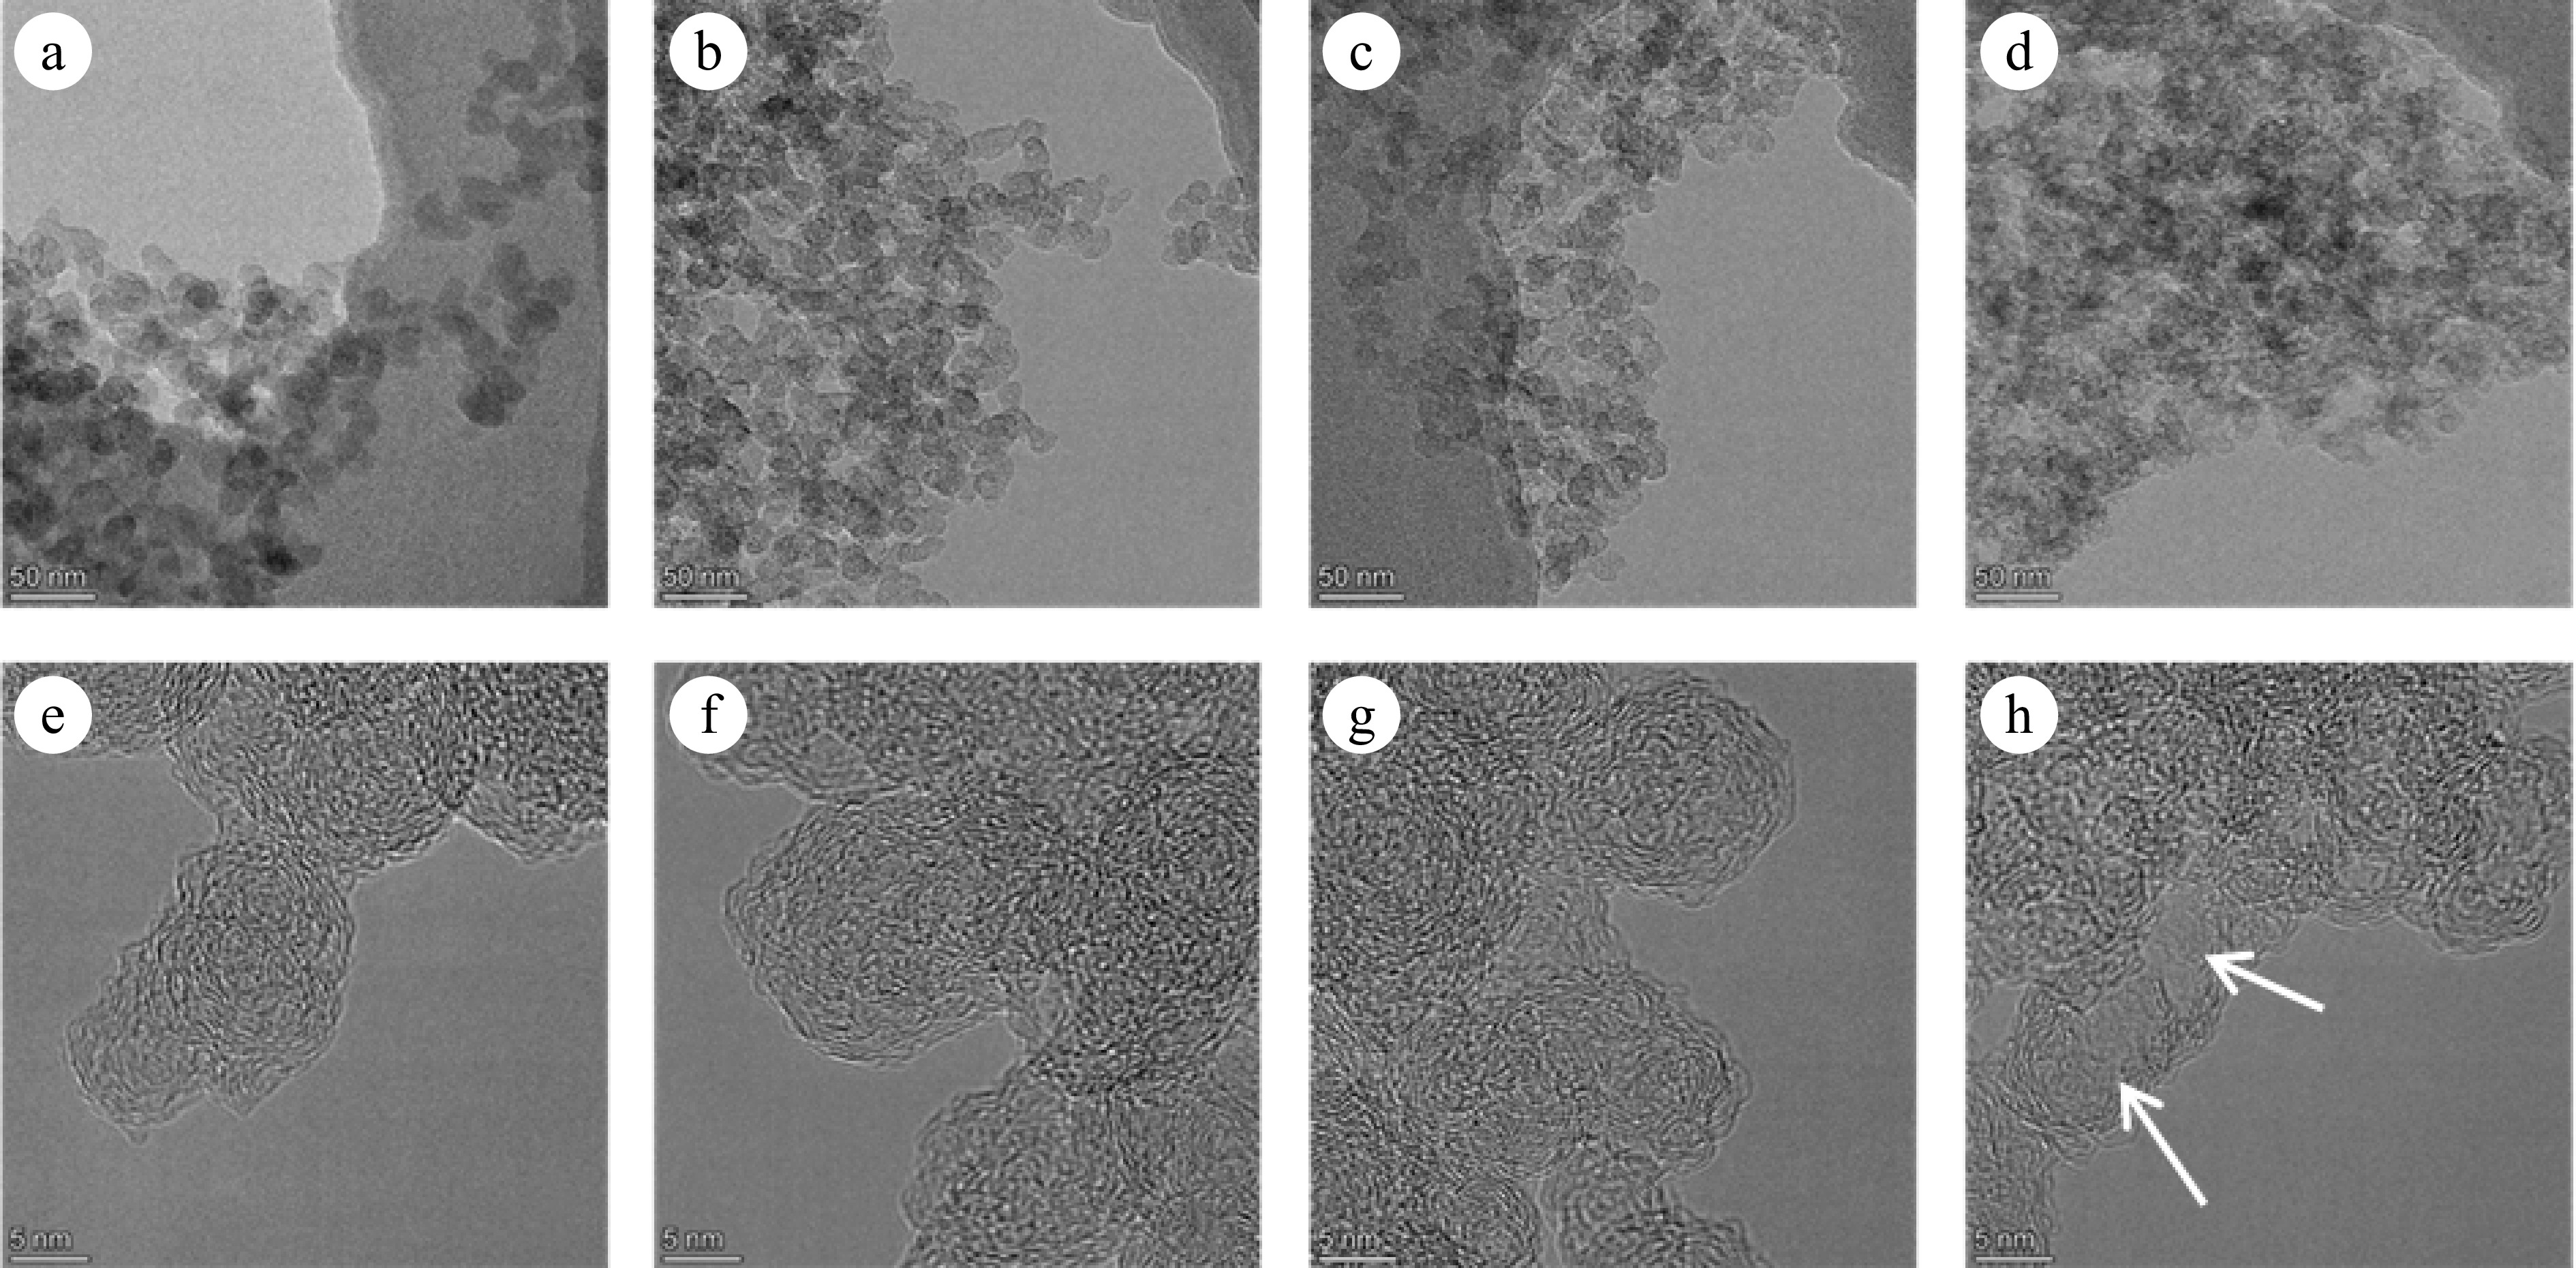
Figure 6.
(a)−(d) TEM, and (e)−(h) HRTEM images of soot sampled at 0.8 hf with different conversion rates: (a), (e) α = 0; (b), (f) α = 25%; (c), (g) α = 50%; (d), (h) α = 75%. The arrows indicate the hollow formed in the particle interior.
-
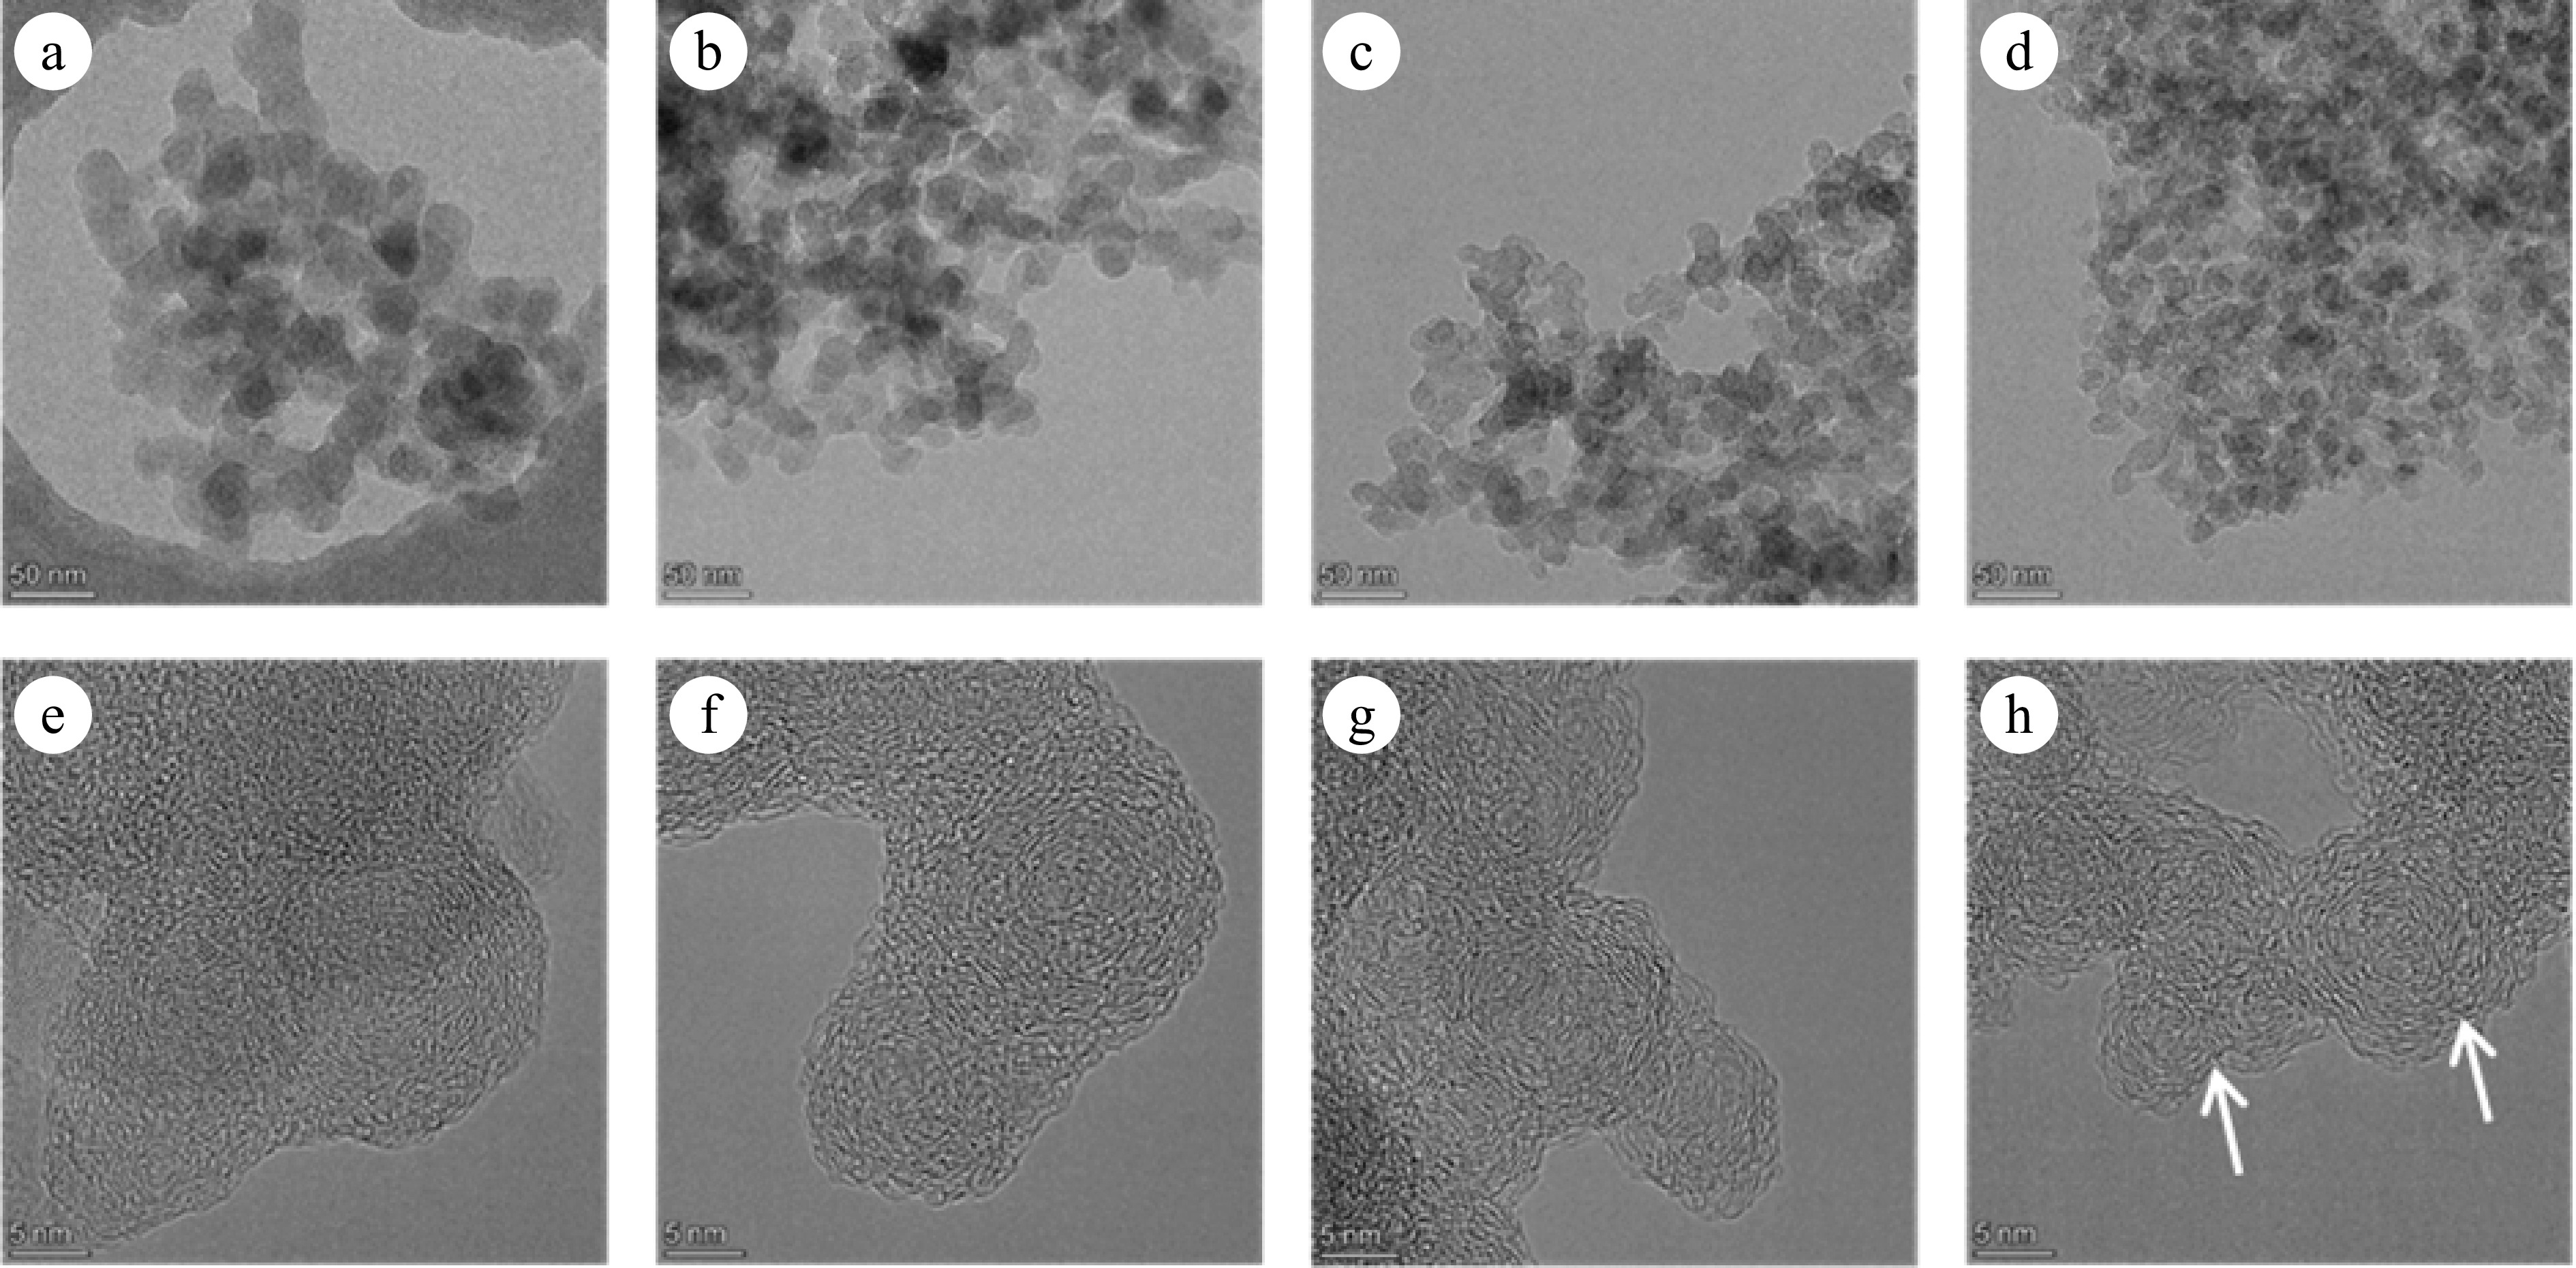
Figure 7.
(a)−(d) TEM, and (e)−(h) HRTEM images of soot sampled at 0.4 hf with different conversion rates: (a), (e) α = 0; (b), (f) α = 25%; (c), (g) α = 50%; (d), (h) α = 75%. The arrows indicate the onion structure formed in the particle interior.
-
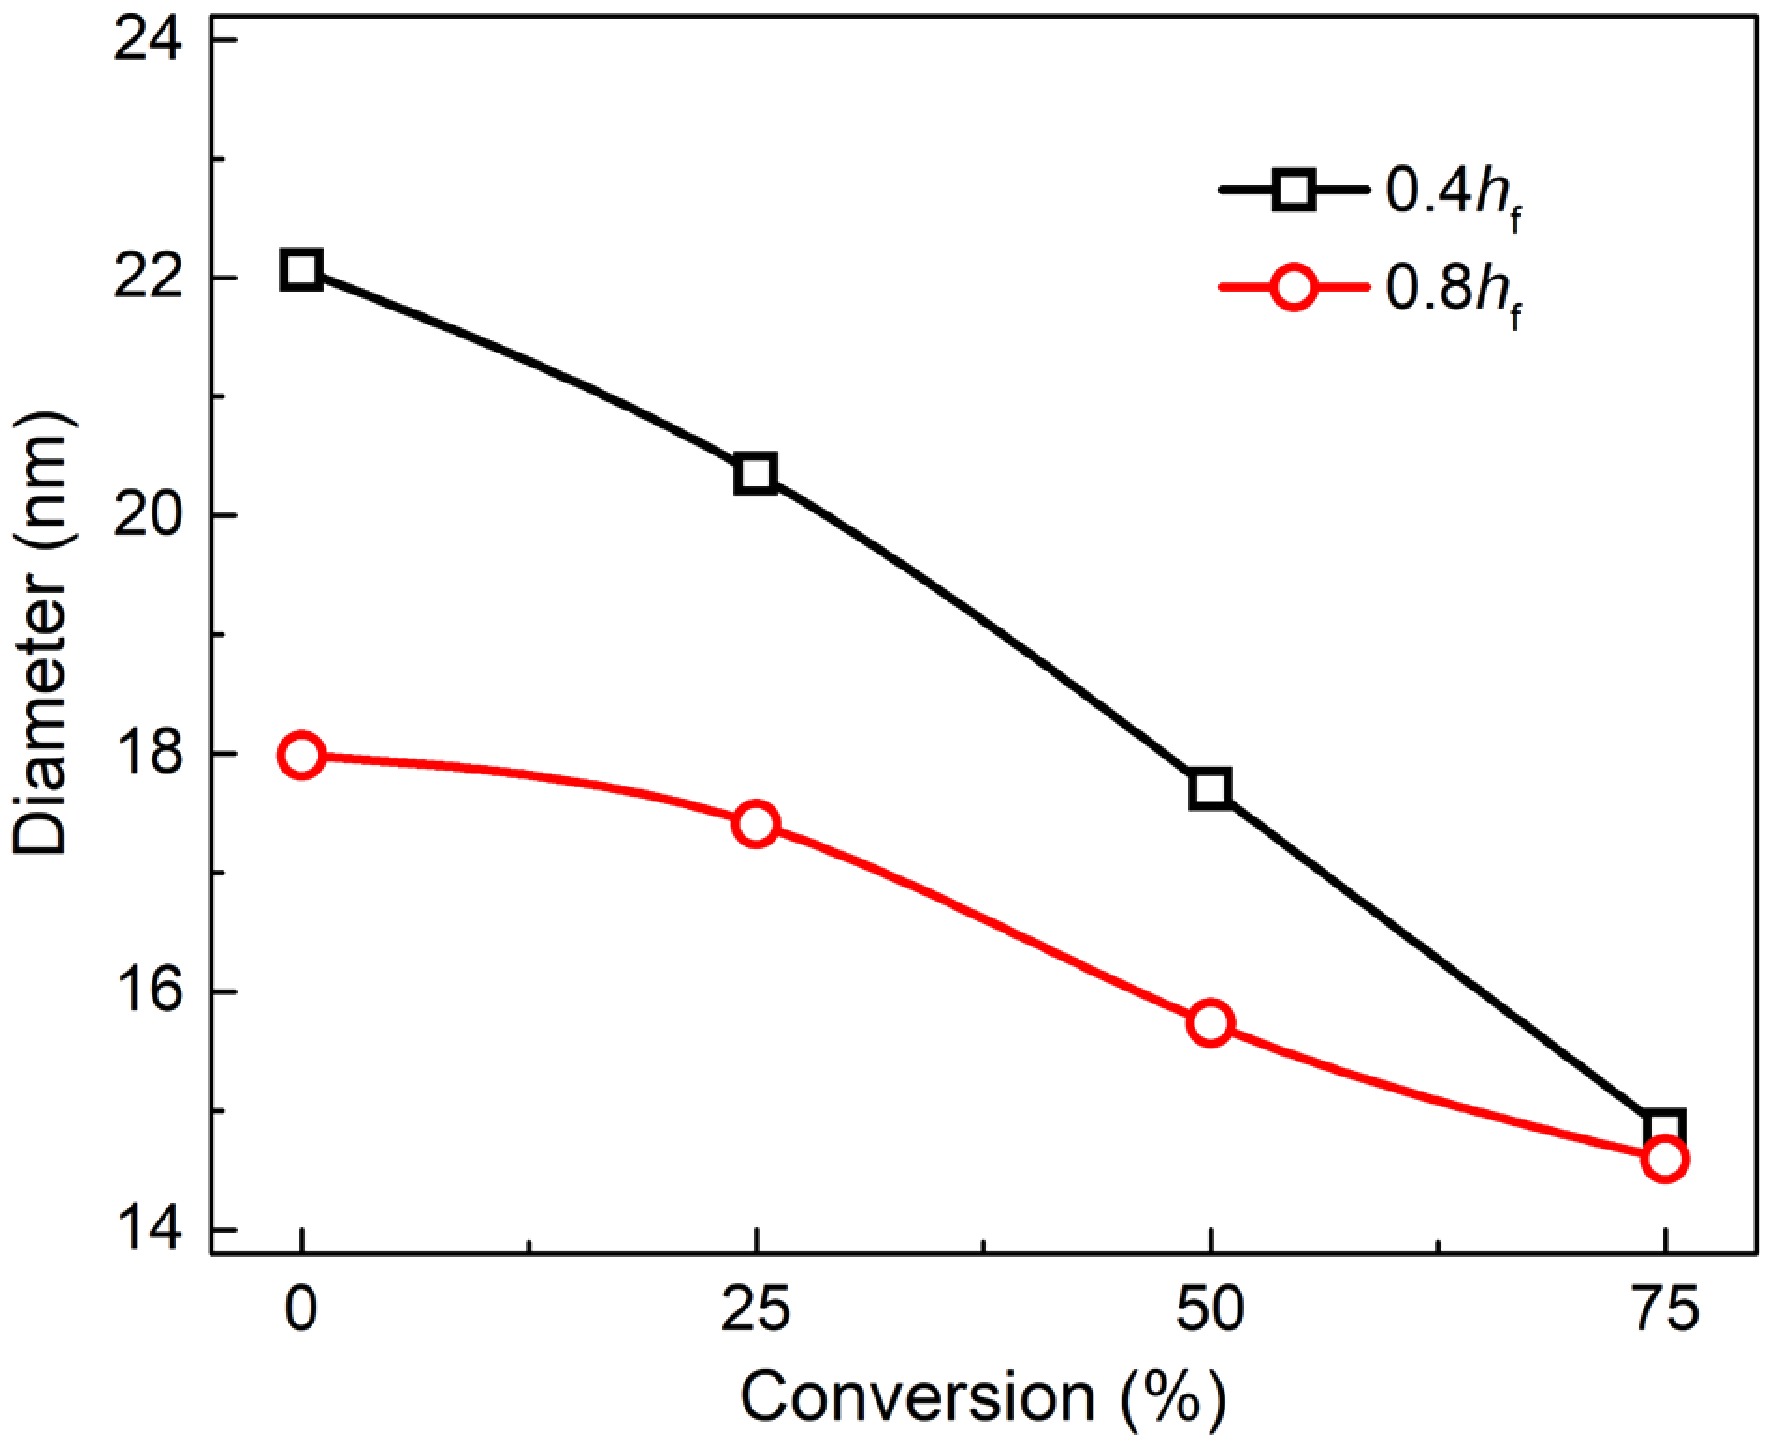
Figure 8.
Primary particle diameter of soot sampled at 0.4 hf (square) and 0.8 hf (circle) as a function of conversion rate.
-
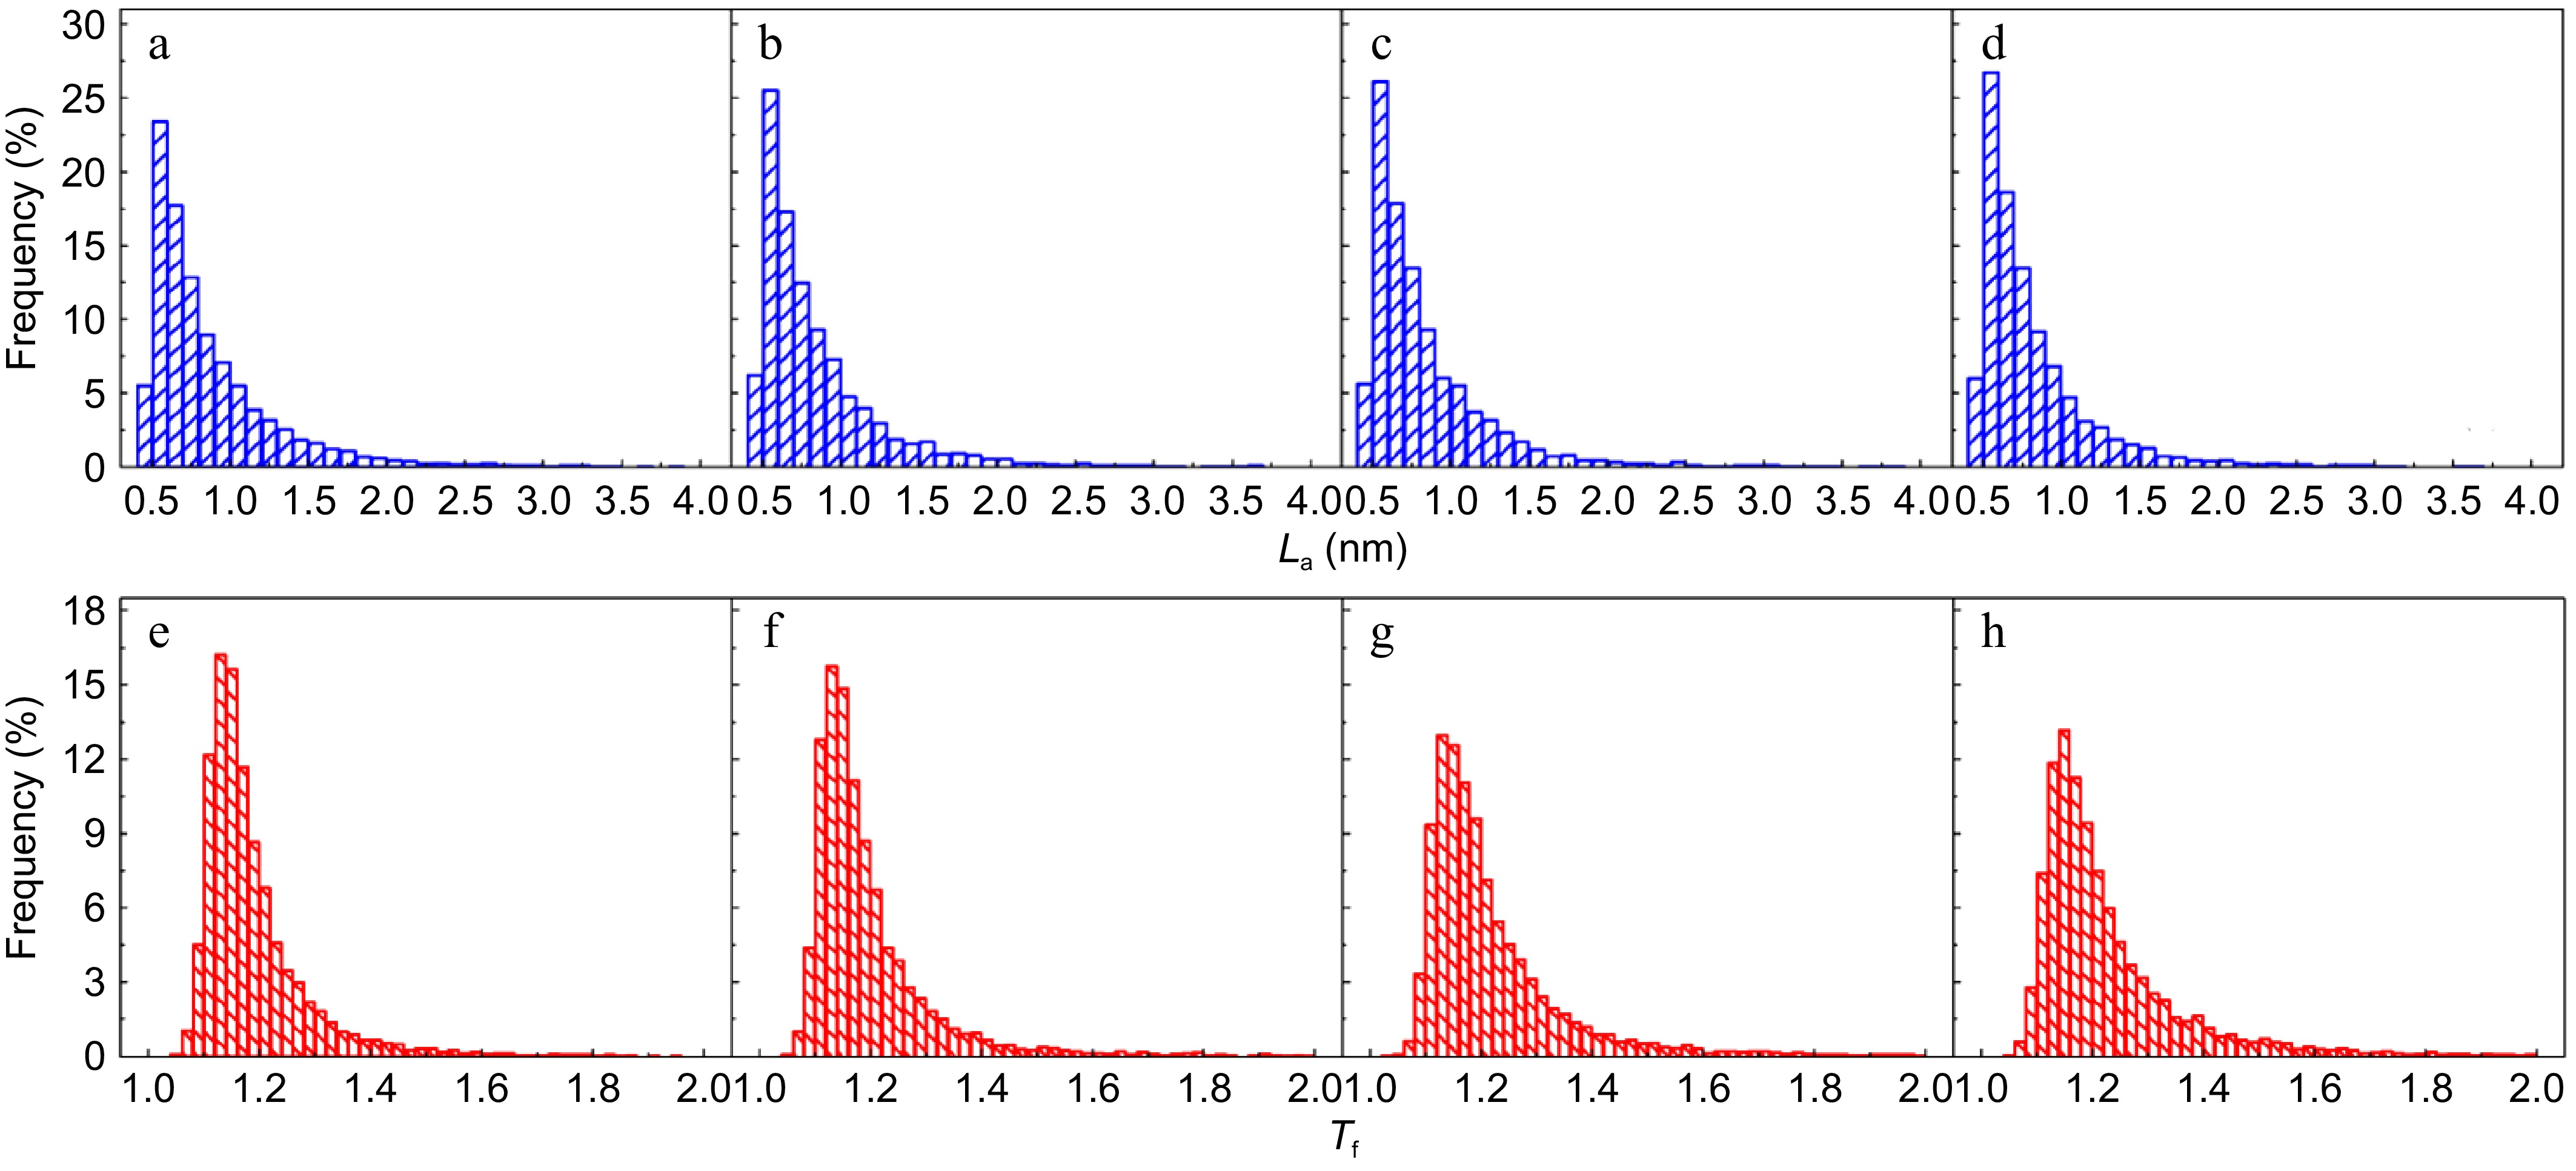
Figure 9.
(a)−(d) Fringe length, and (e)−(h) tortuosity distribution of soot sampled at 0.8 hf with different conversion rates: (a), (e) α = 0; (b), (f) α = 25%; (c), (g) α = 50%; (d), (h) α = 75%.
-
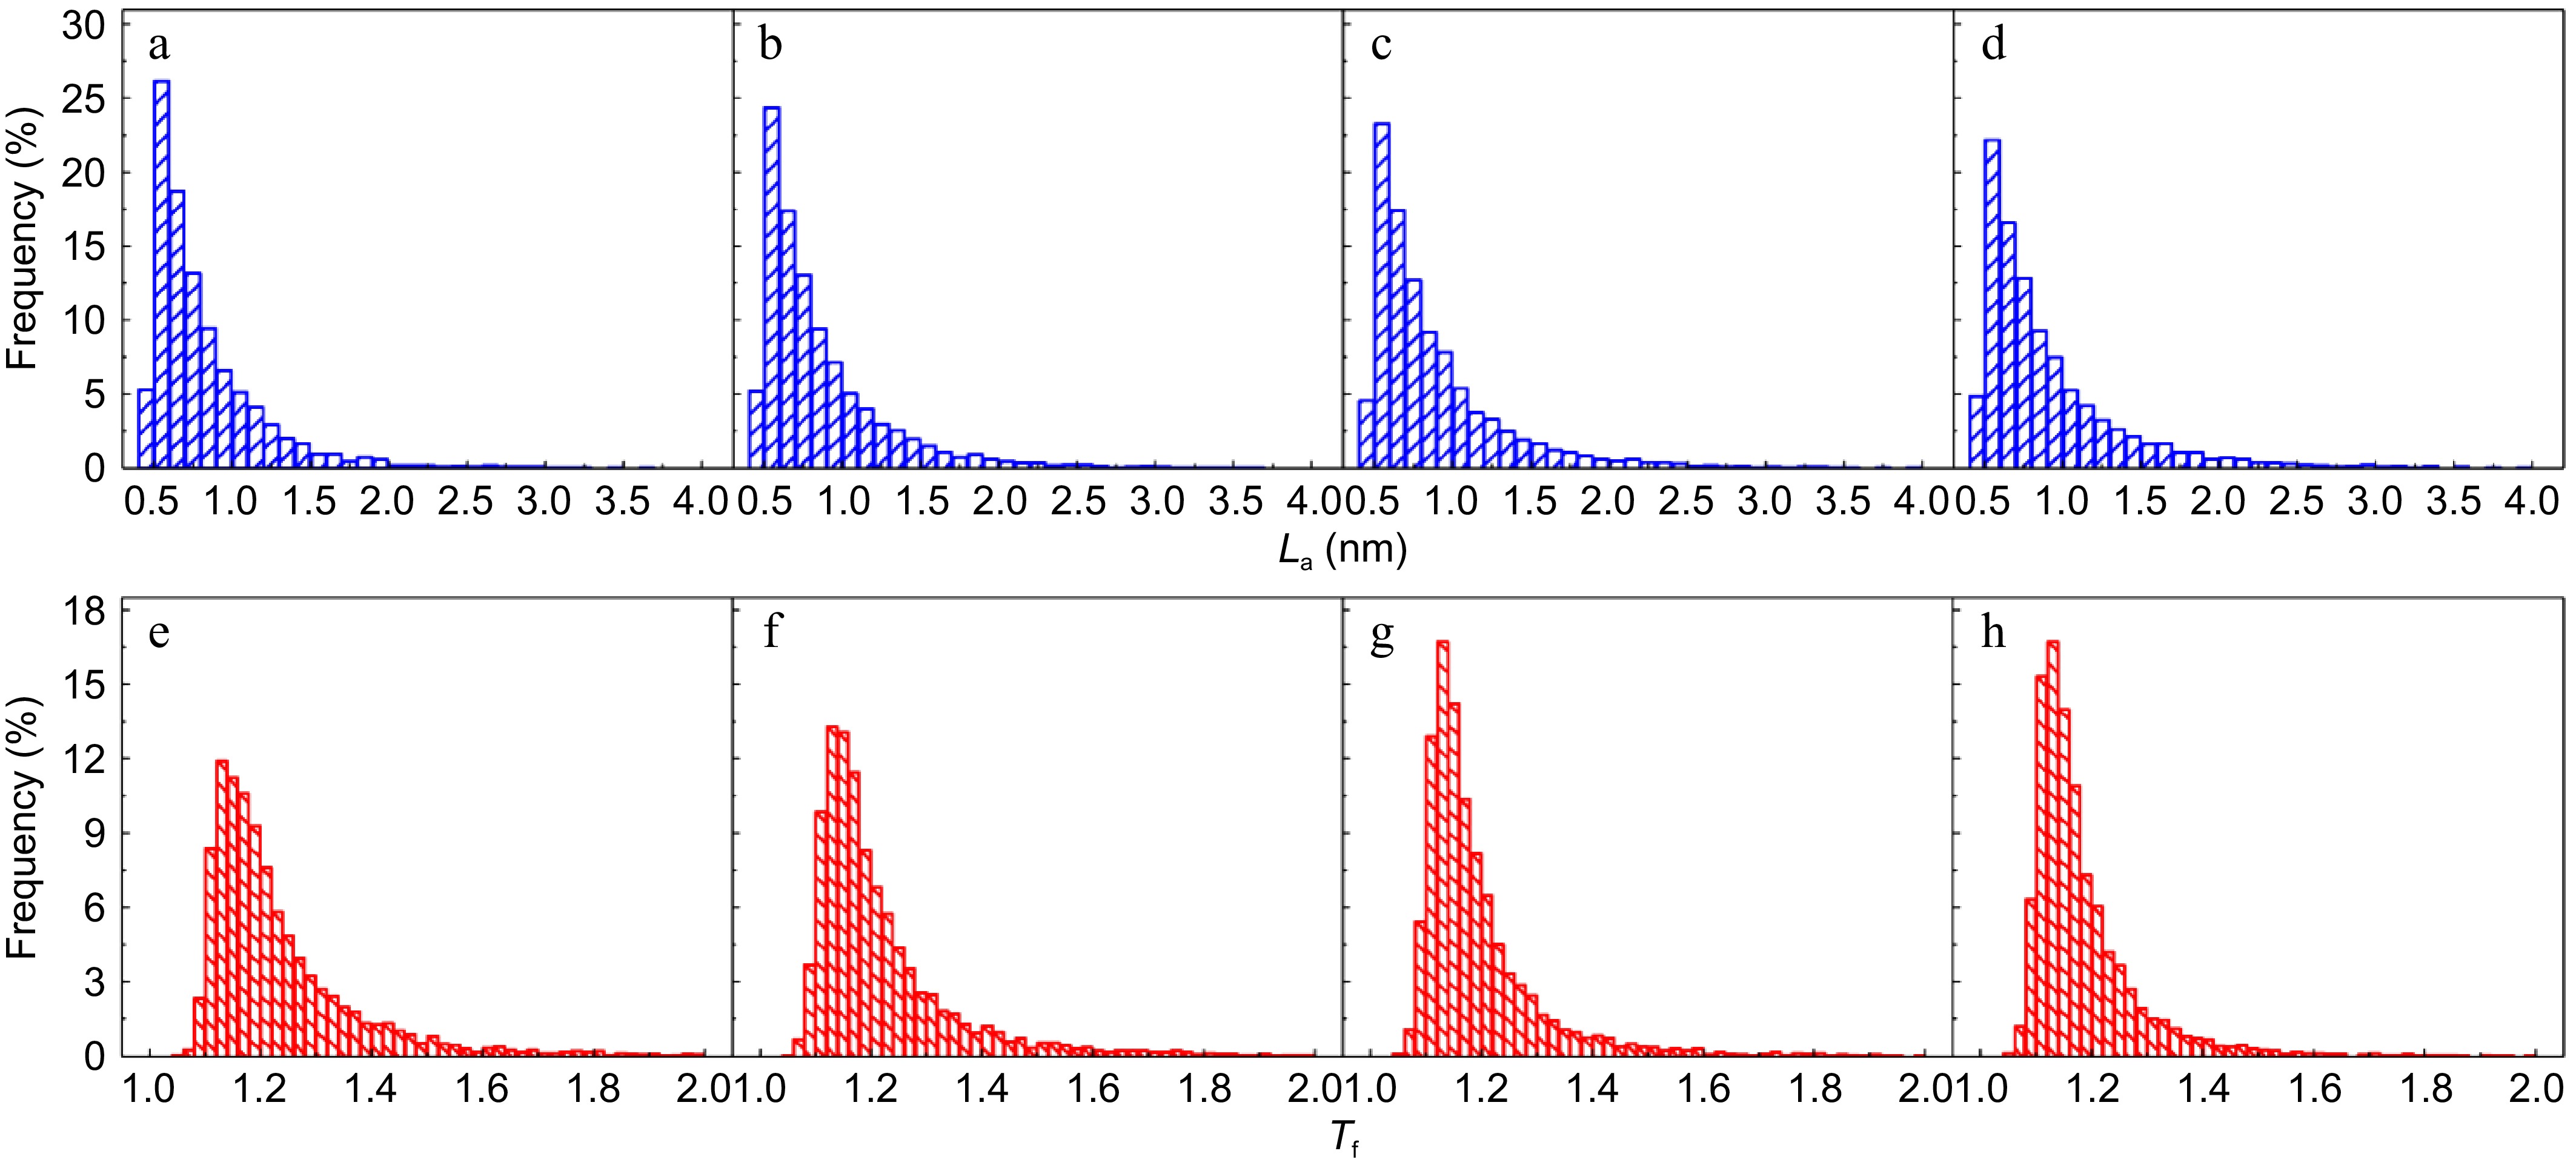
Figure 10.
(a)−(d) Fringe length, and (e)−(h) tortuosity distribution of soot sampled at 0.4 hf with different conversion rates: (a), (e) α = 0; (b), (f) α = 25%; (c), (g) α = 50%; (d), (h) α = 75%.
-
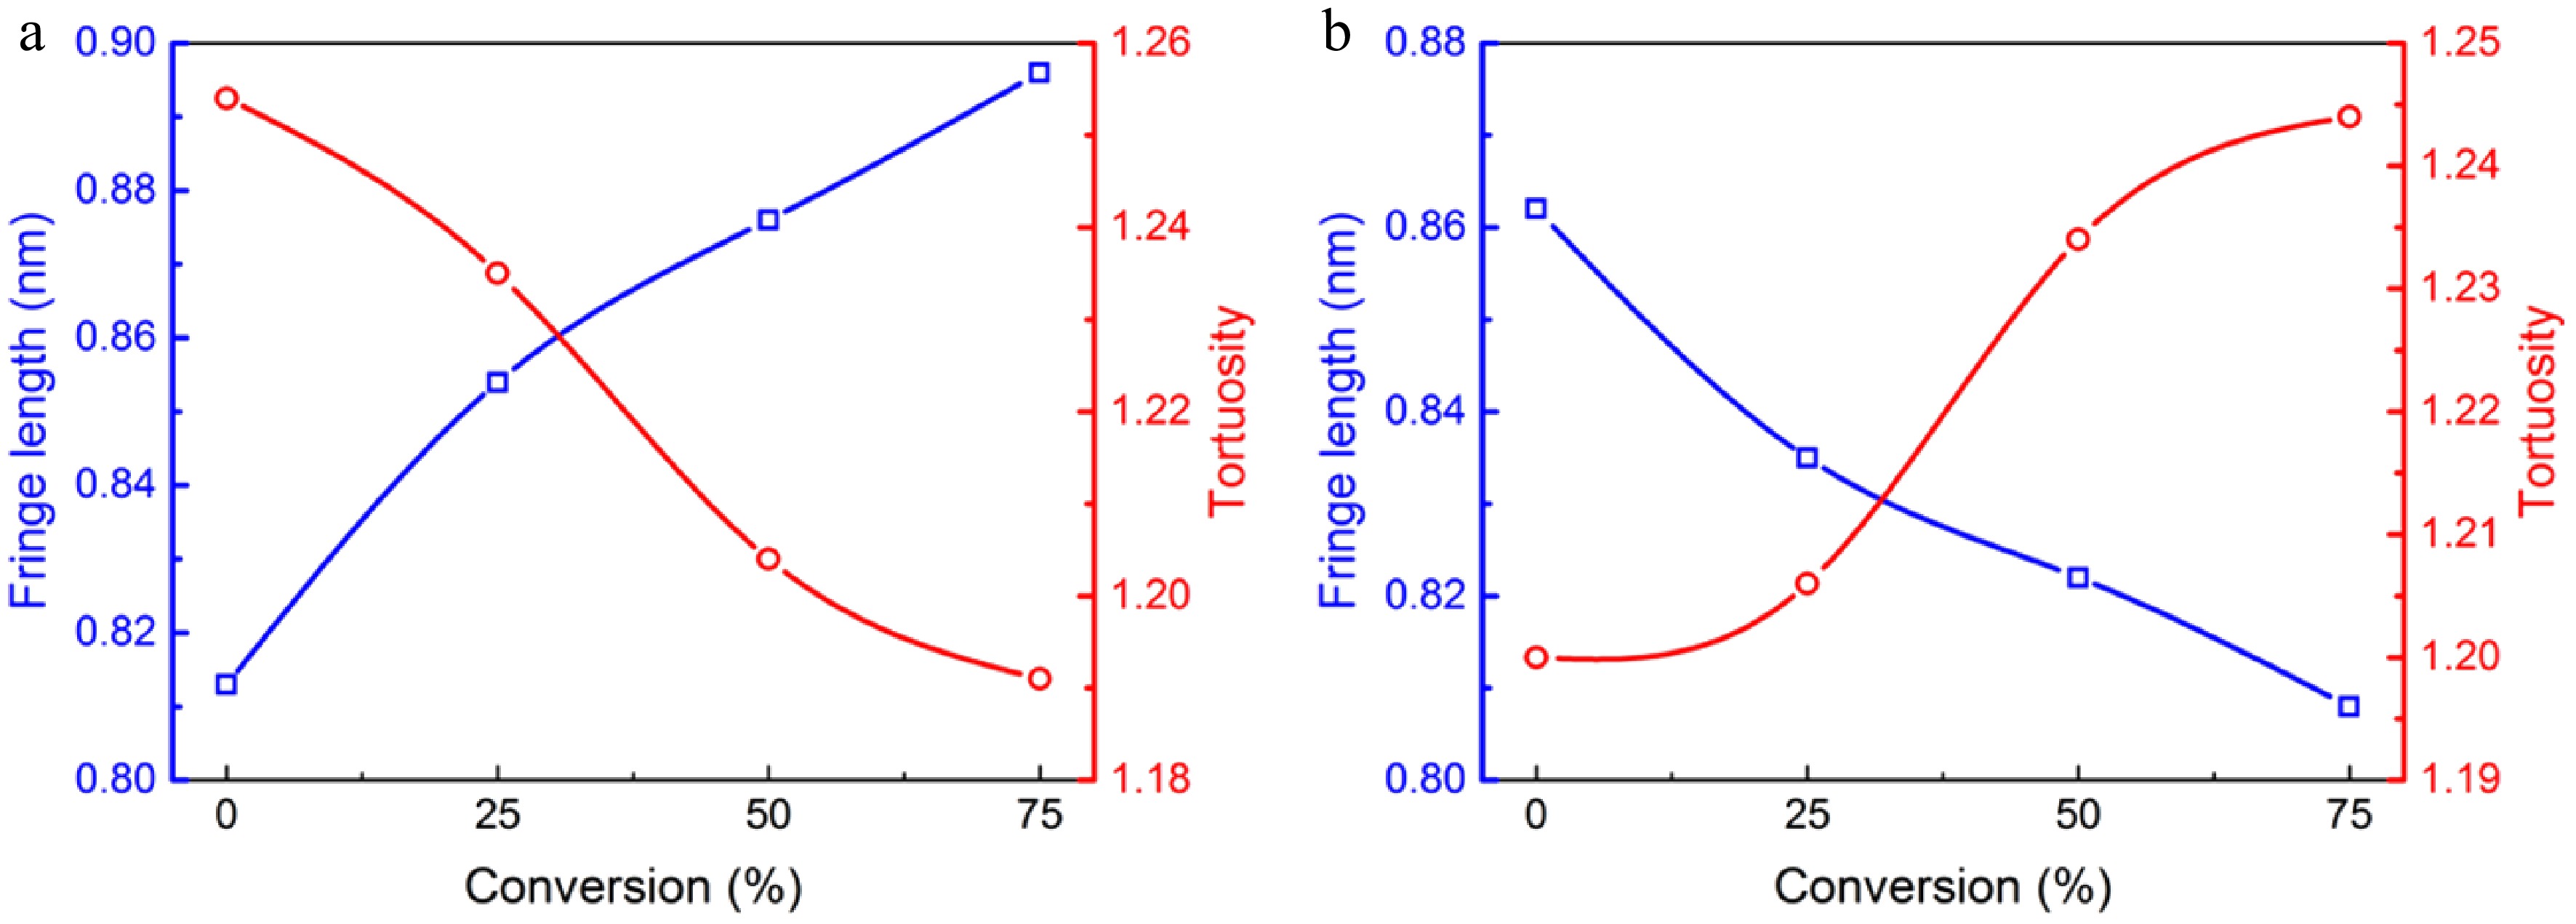
Figure 11.
Average fringe length (square), and tortuosity (circle) of soot sampled at (a) 0.4 hf and (b) 0.8 hf as functions of conversion rate.
-
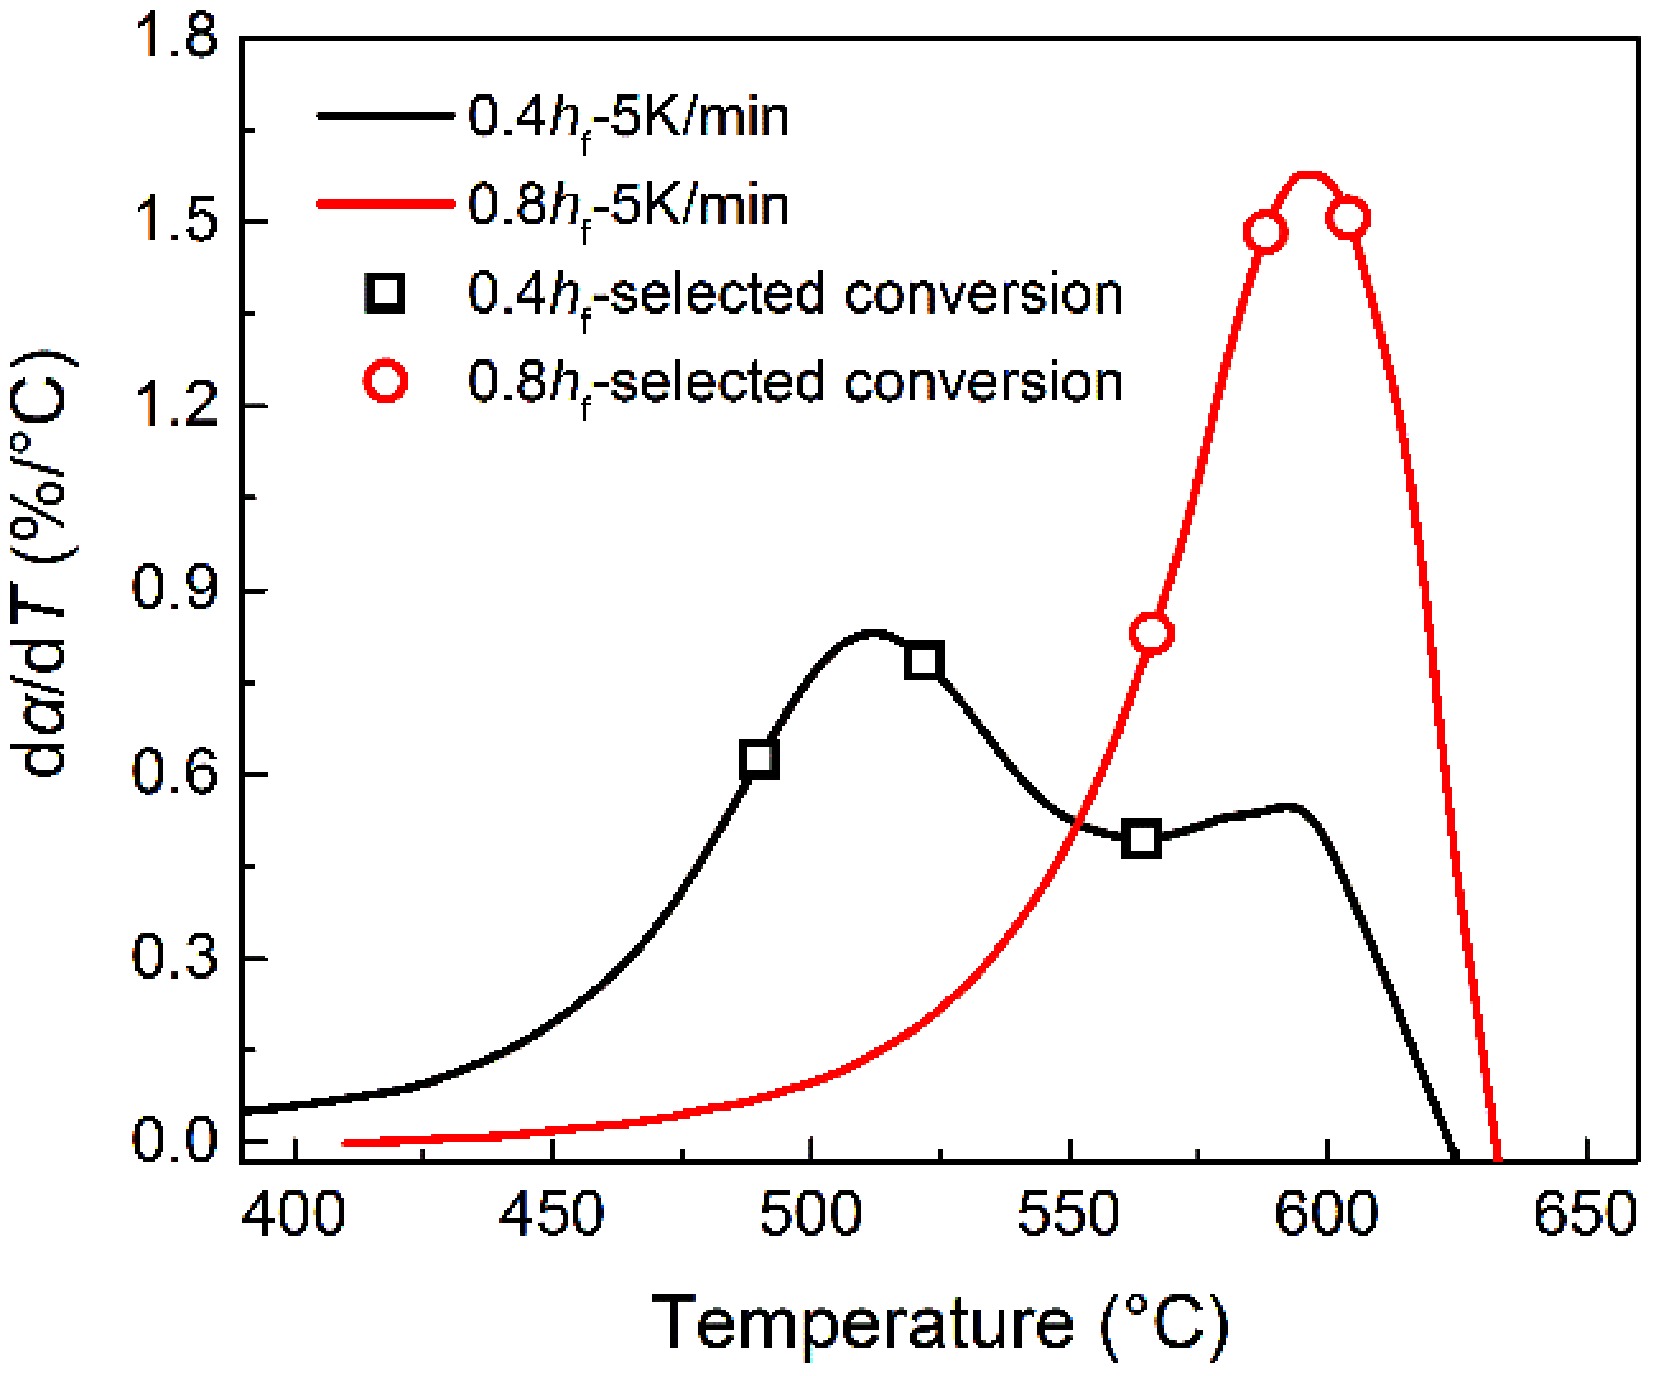
Figure 12.
Relationships between selected three conversion rates (symbols), and oxidation rates (curves).
-
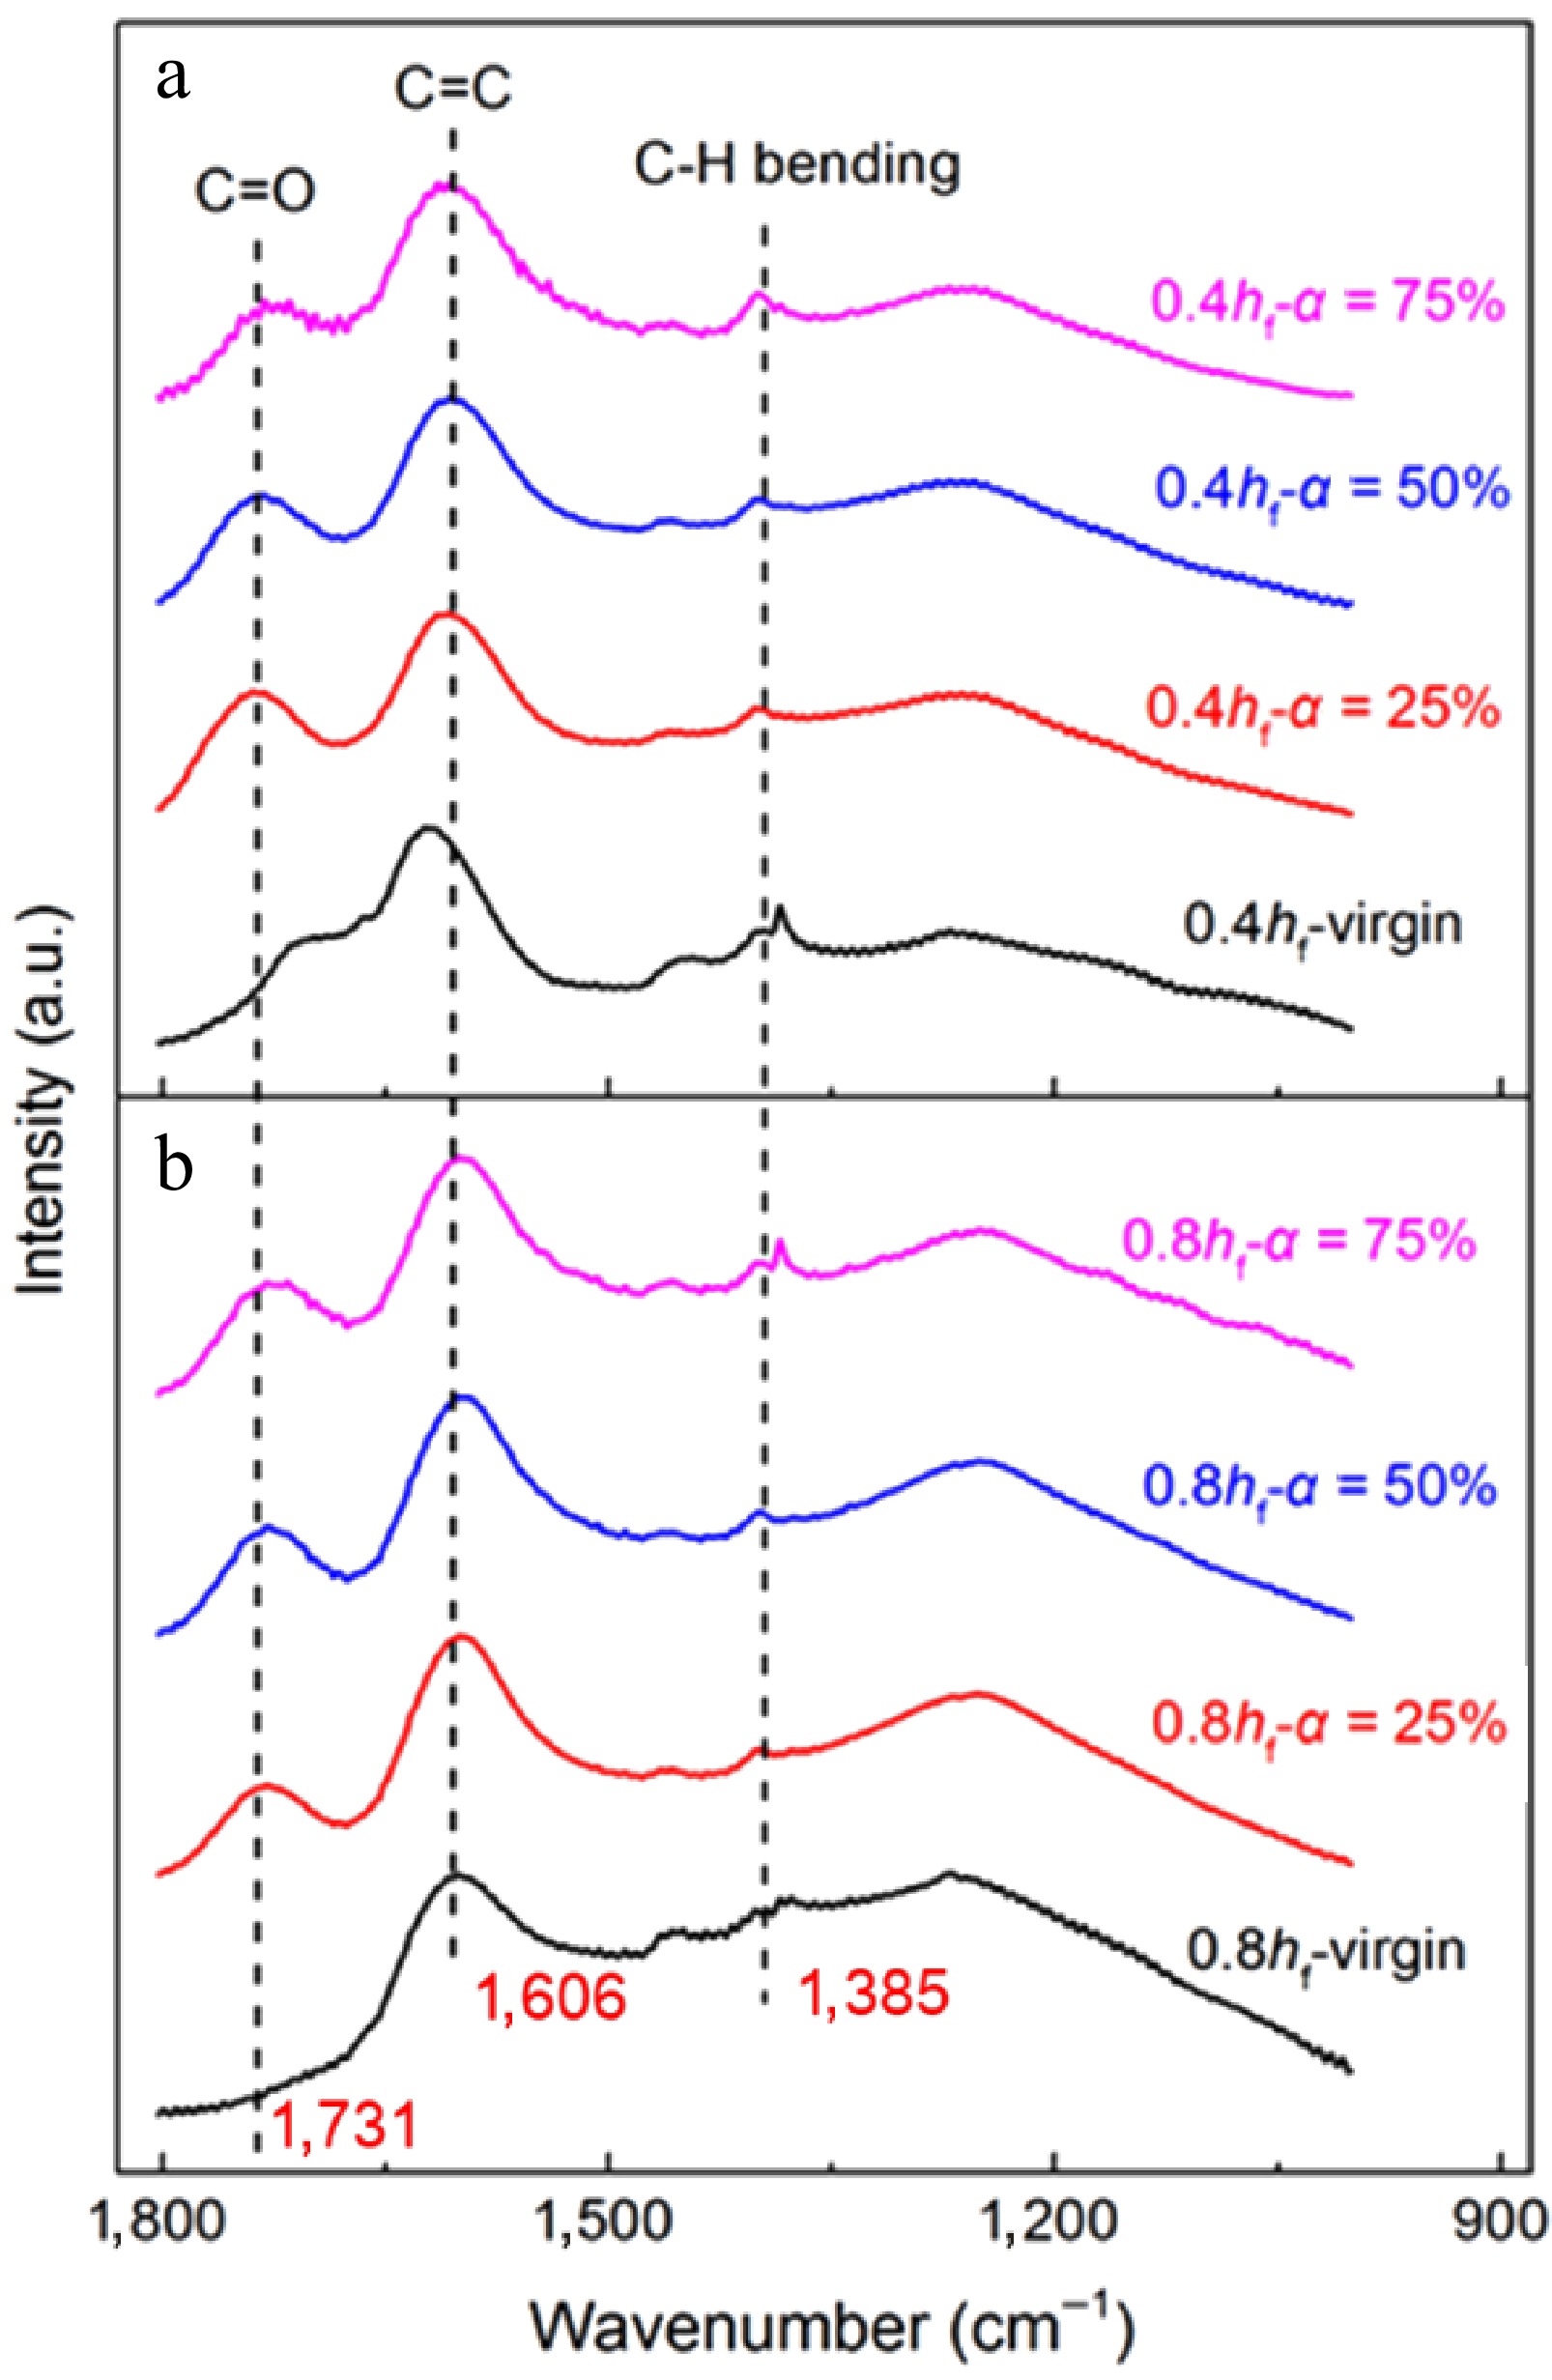
Figure 13.
FTIR spectra of soot sampled at (a) 0.4 hf, and (b) 0.8 hf as functions of conversion rate.
-

Figure 14.
Relationships between activation energy (symbols) and oxidation rates (curves) for soot sampled at 0.8 hf.
-
Sample T10/°C T90/°C 0.4 hf - 3 °C/min 432 575 0.4 hf - 5 °C/min 448 592 0.4 hf - 7 °C/min 460 606 0.4 hf - 9 °C/min 469 616 0.8 hf - 3 °C/min 521 597 0.8 hf - 5 °C/min 538 615 0.8 hf - 7 °C/min 552 626 0.8 hf - 9 °C/min 559 634 Table 1.
T10 and T90 measured from TG curves for soot samples at 0.4 hf and 0.8 hf.
-
Sample I1730/I1610 Sample I1730/I1610 0.4 hf−virgin 0.482 0.8 hf−virgin − 0.4 hf−α = 25% 0.640 0.8 hf−α = 25% 0.373 0.4 hf−α = 50% 0.553 0.8 hf−α = 50% 0.455 0.4 hf−α = 75% 0.459 0.8 hf−α = 75% 0.477 Table 2.
I1730/I1610 of soot sampled at 0.4 hf and 0.8 hf as a function of conversion.
Figures
(14)
Tables
(2)