-
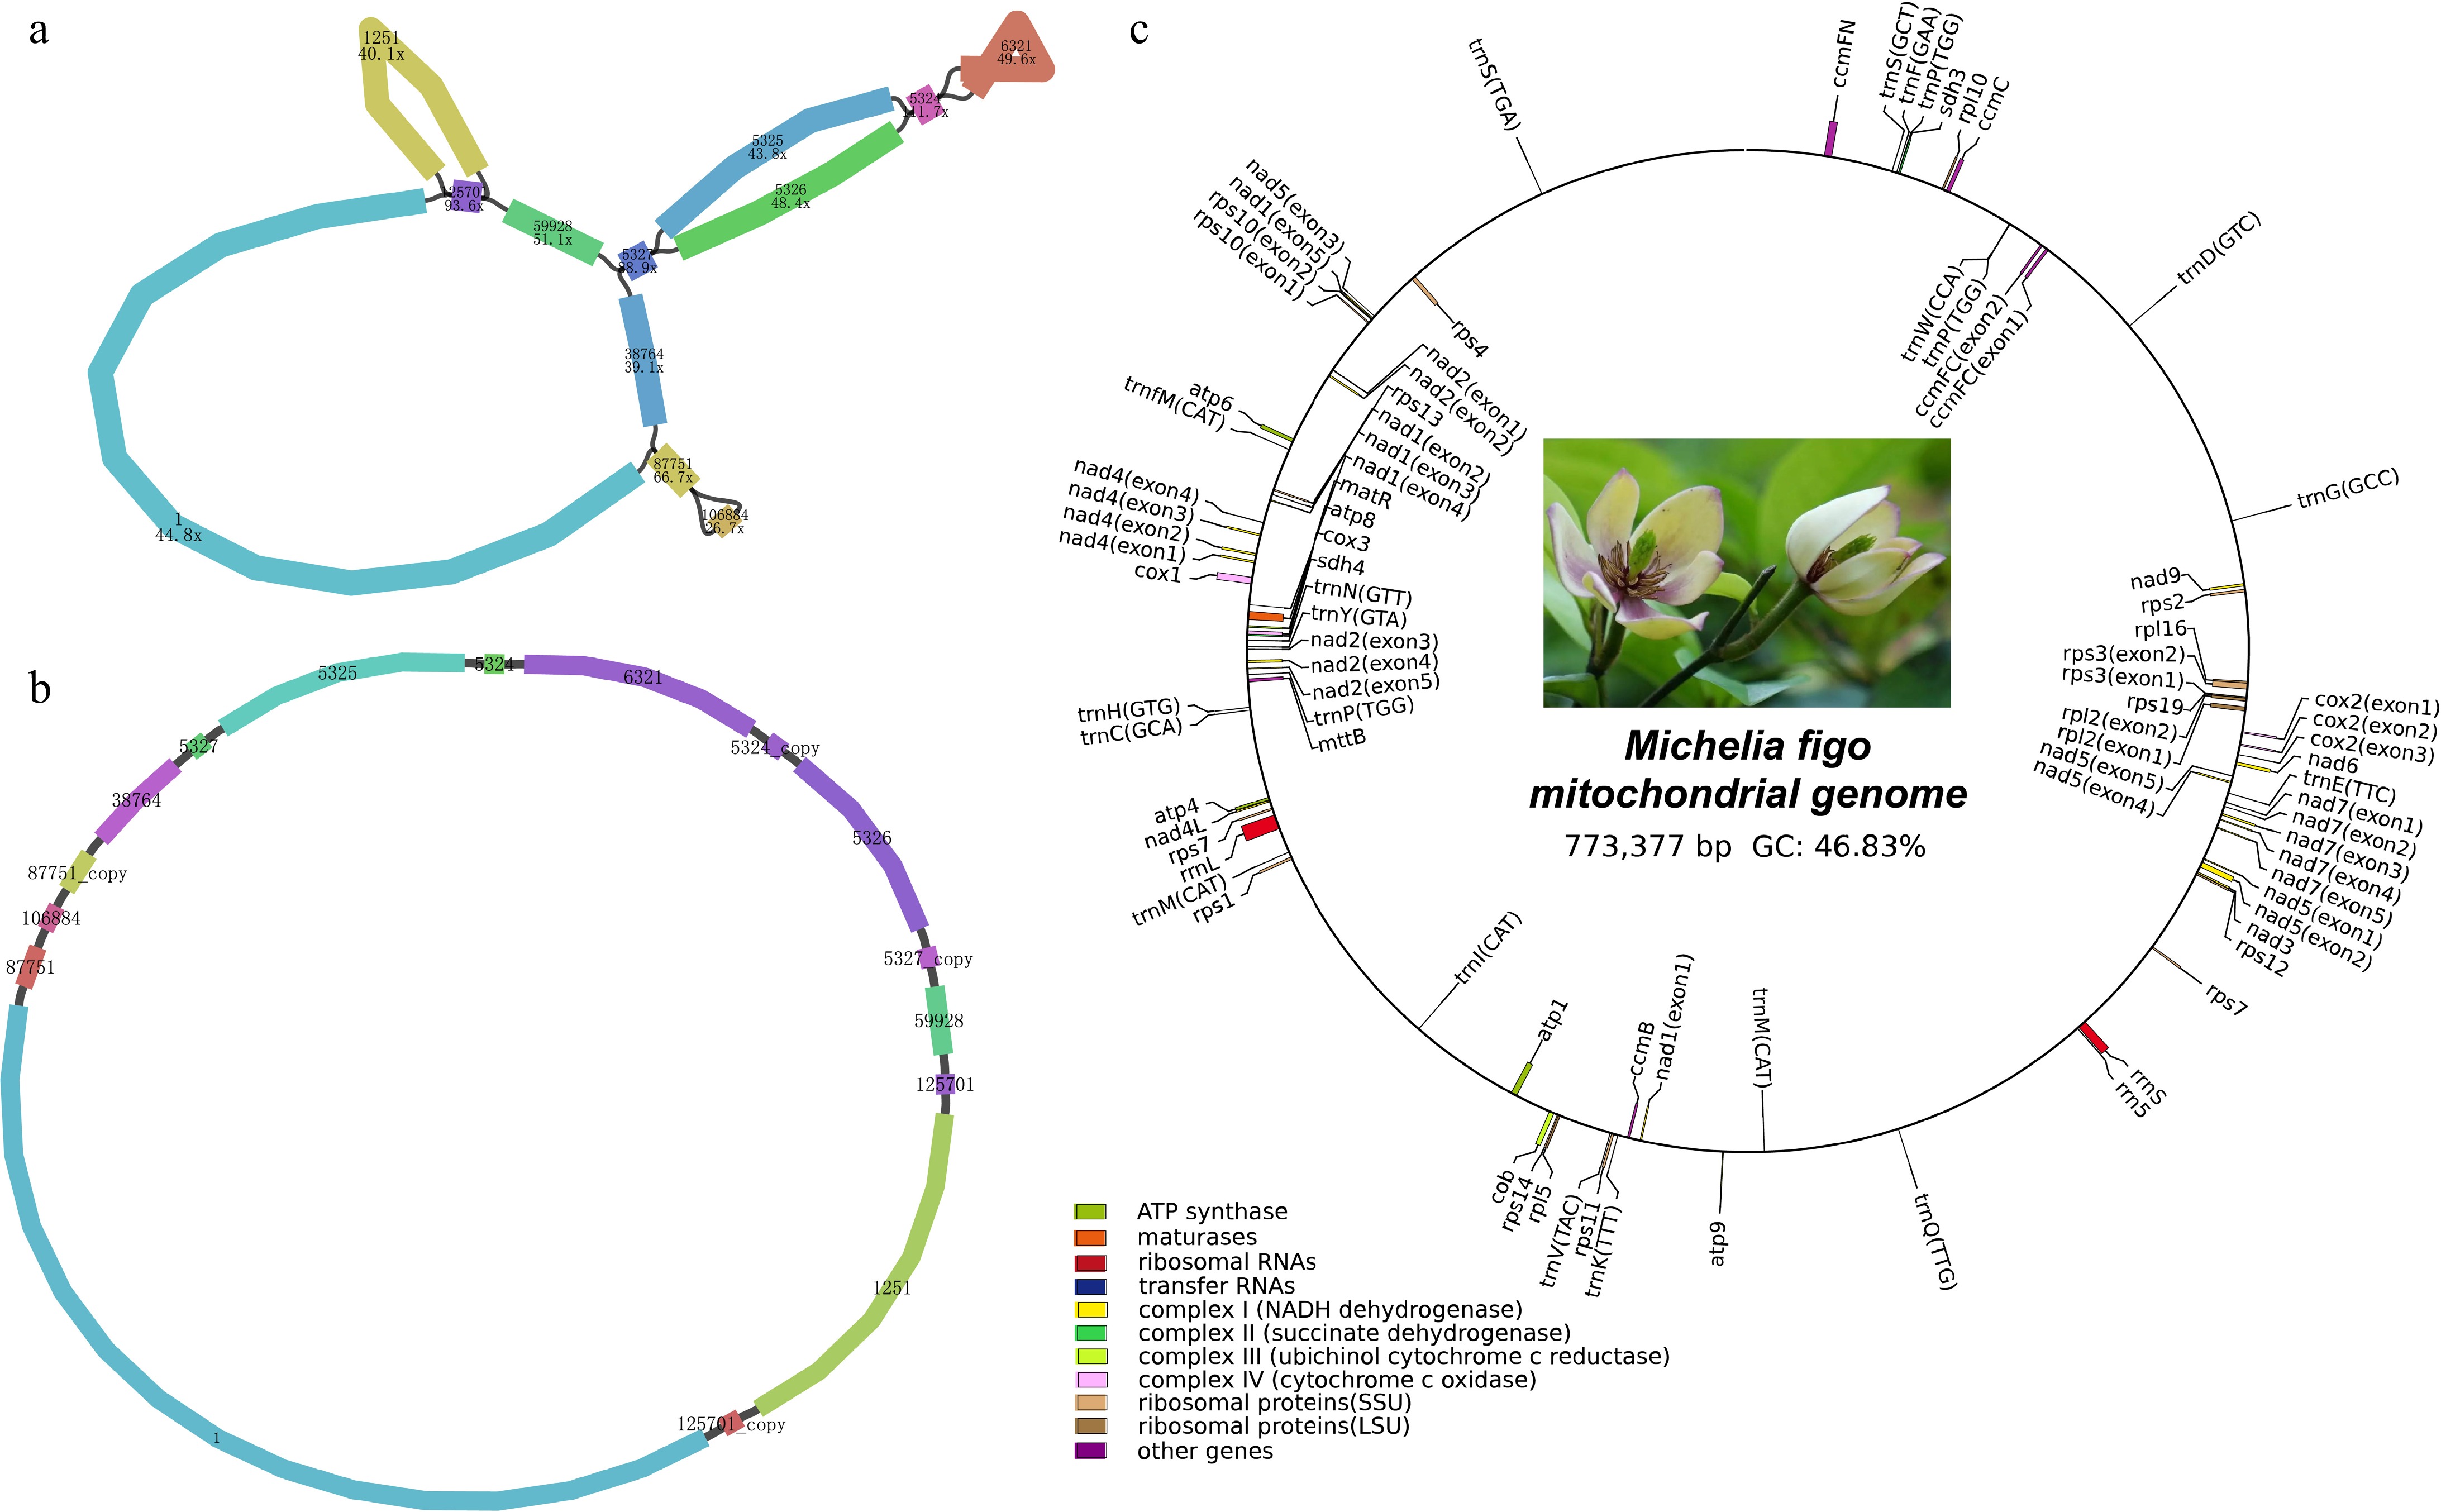
Figure 1.
Structural and functional features of the M. figo mitogenome. (a) The raw assembly graph of the M. figo mitogenome. (b) The disentangled graph of the M. figo mitogenome. (c) Circular mitogenome map of M. figo. Genes depicted outside the outer circle undergo clockwise transcription, while those positioned within the inner circle undergo counter-clockwise transcription. The legends of different colors positioned in the bottom left corner serve to distinguish genes based on their specific functionalities.
-
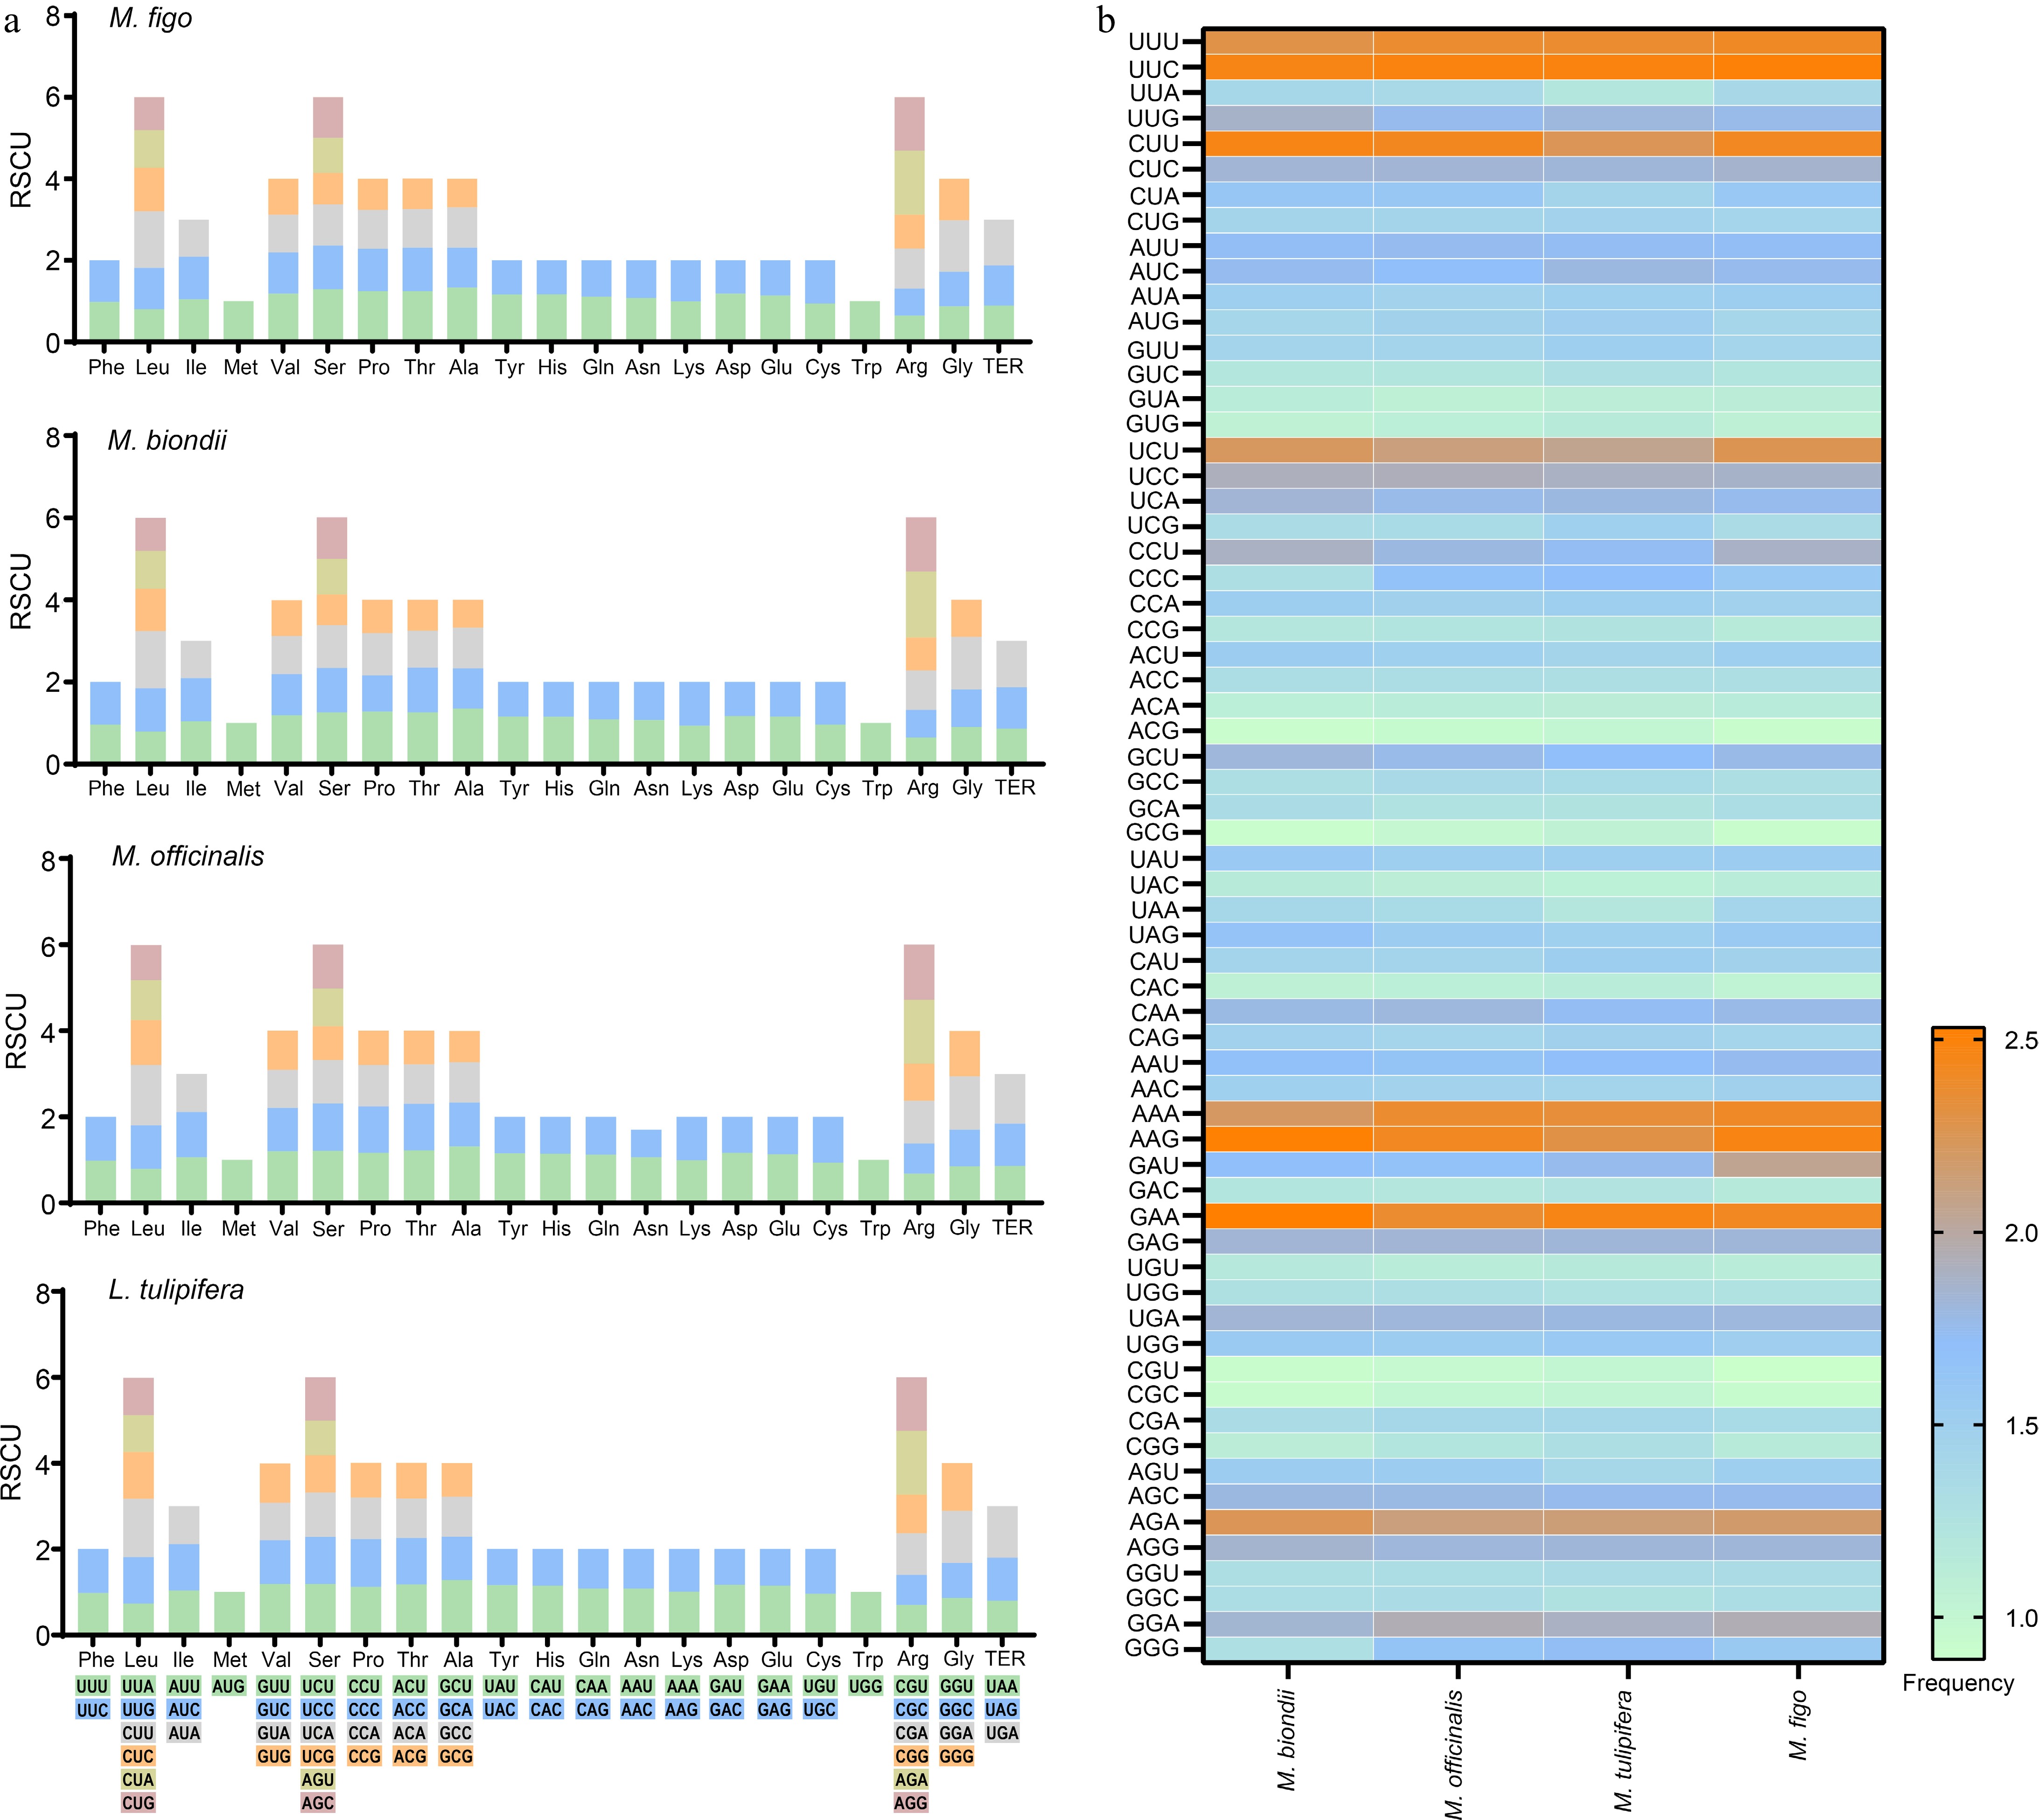
Figure 2.
Codon usage of four Magnoliaceae mitogenomes. (a) Stacked column plots of the relative synonymous codon usage. (b) Heatmap of the codon usage frequencies.
-
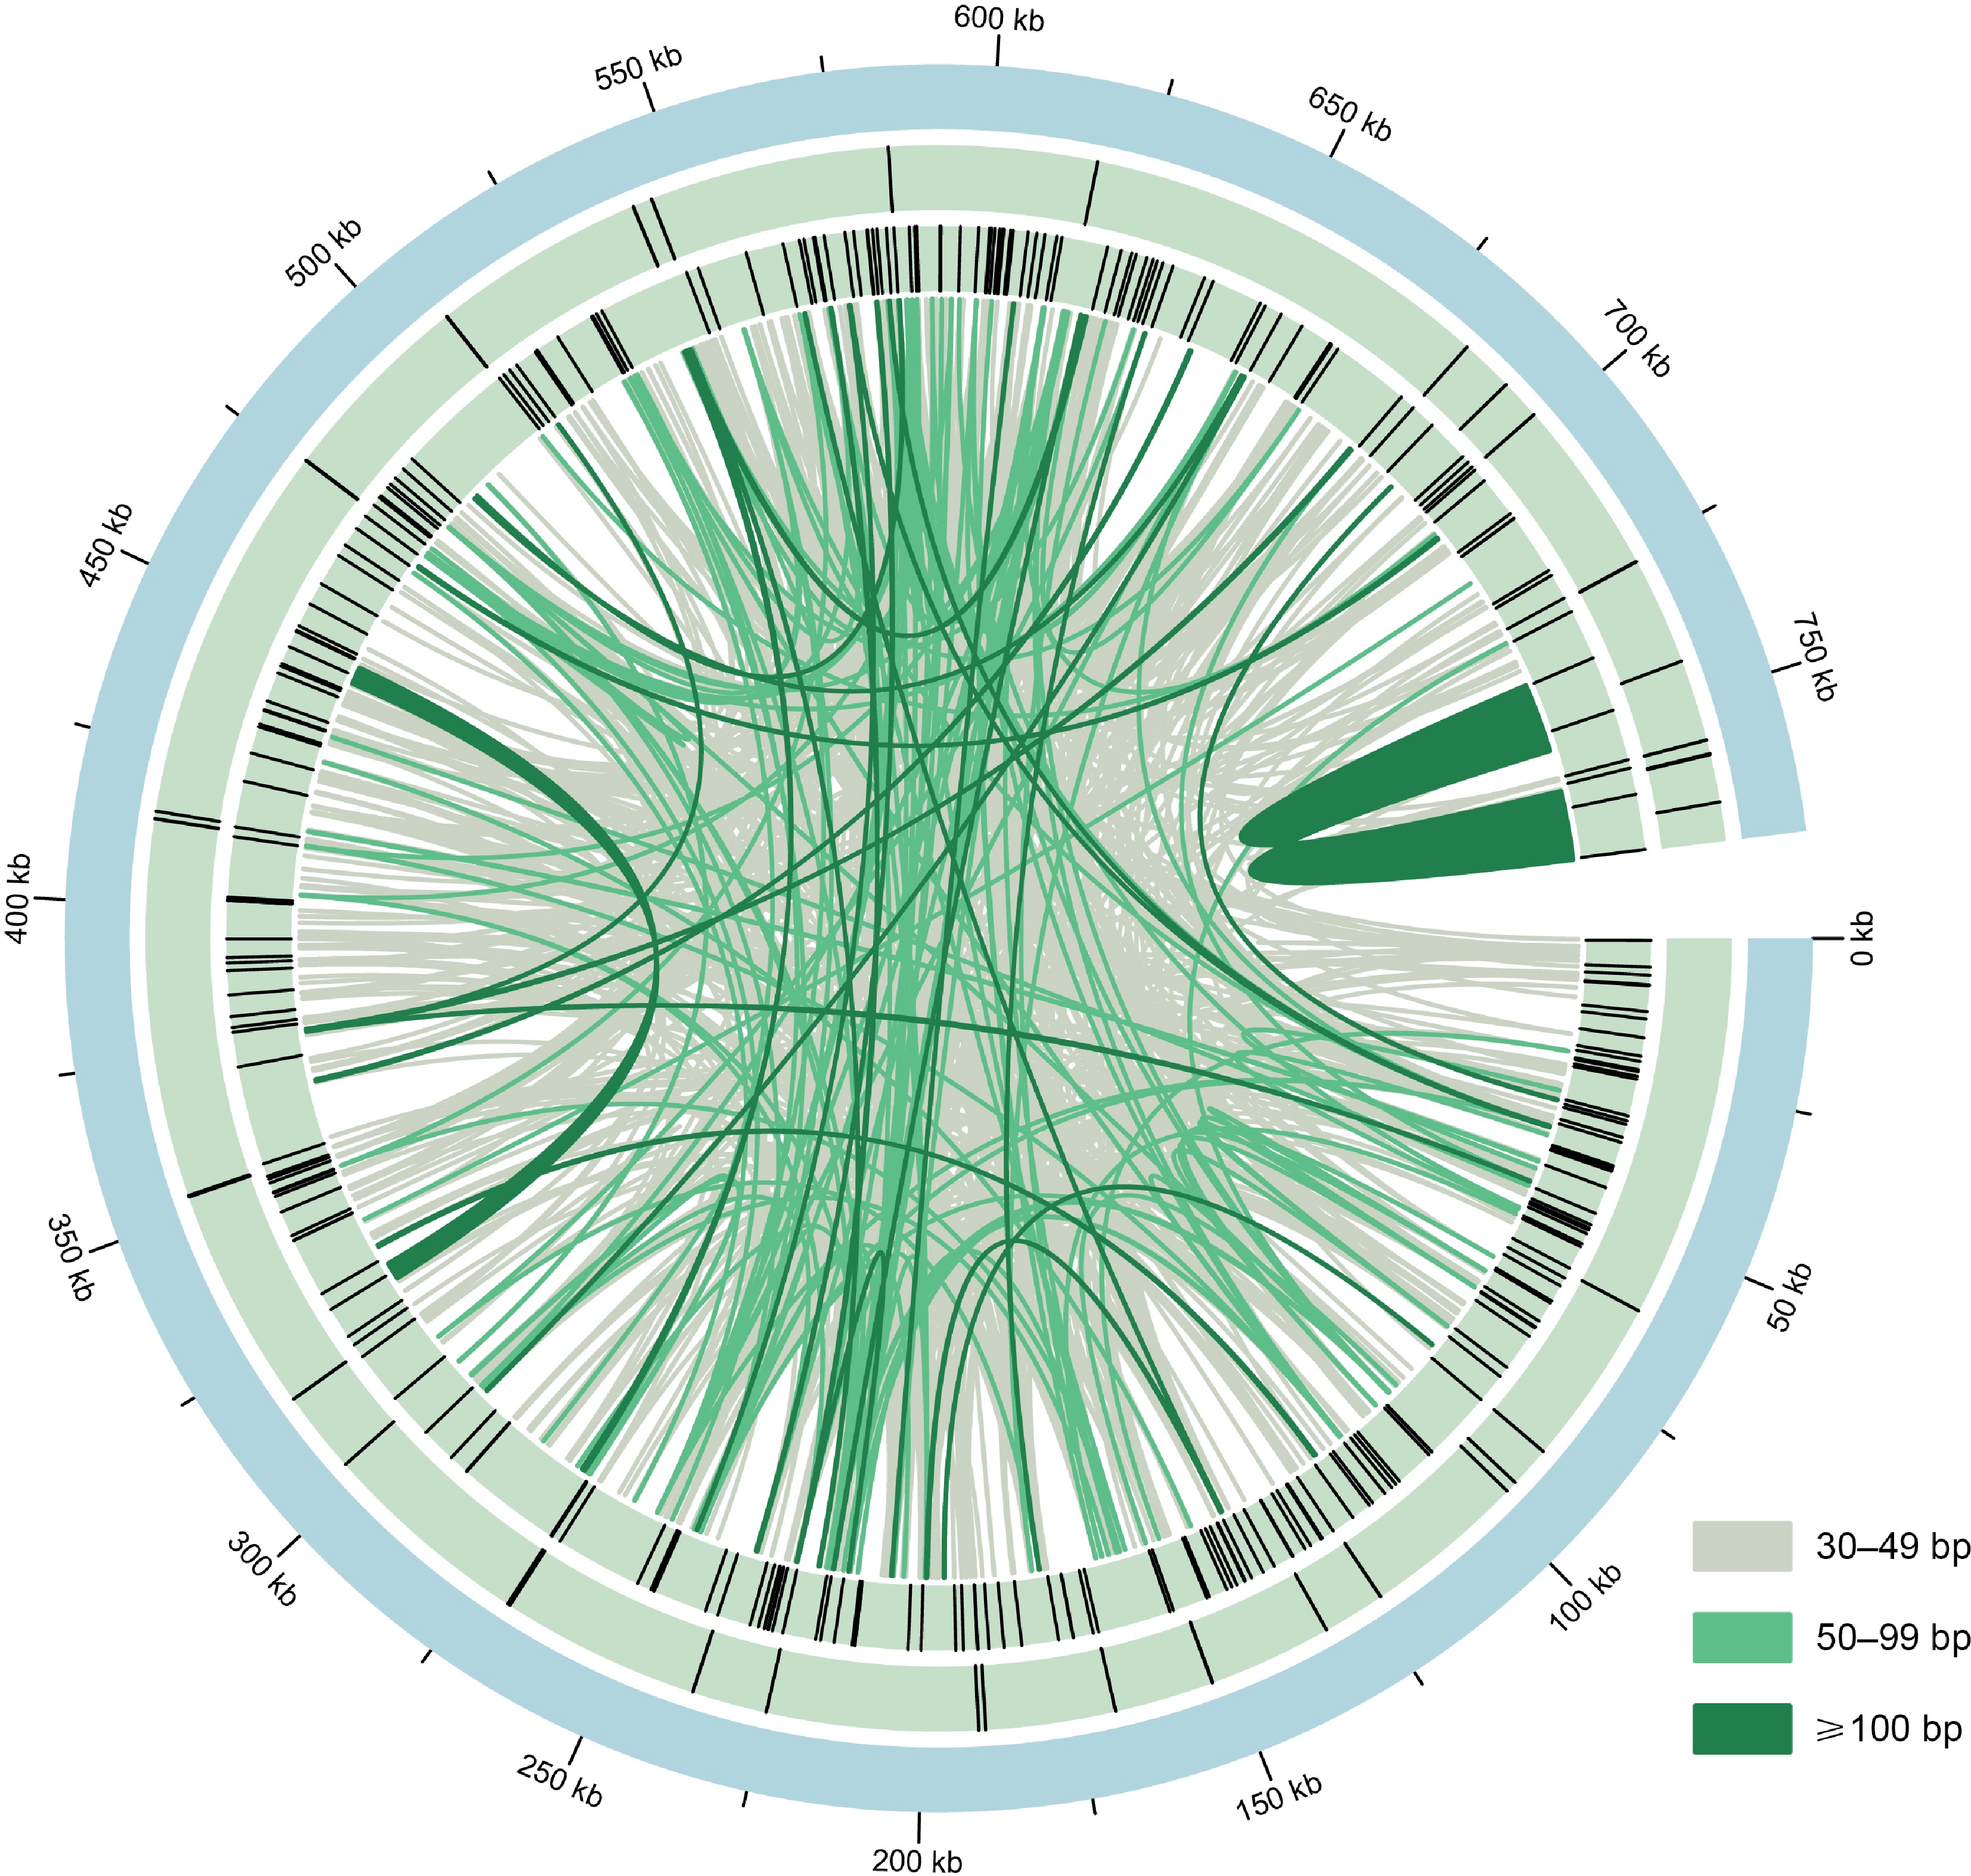
Figure 3.
The distribution of repeats in the M. figo mitogenome. From the center outward, the first circle shows the mitogenome of M. figo, the second and third circle shows tandem repeats and simple sequence repeats, respectively. The inner lines represent the dispersed repeats. The legends of different colors positioned in the bottom left corner represent the dispersed repeats of different lengths.
-
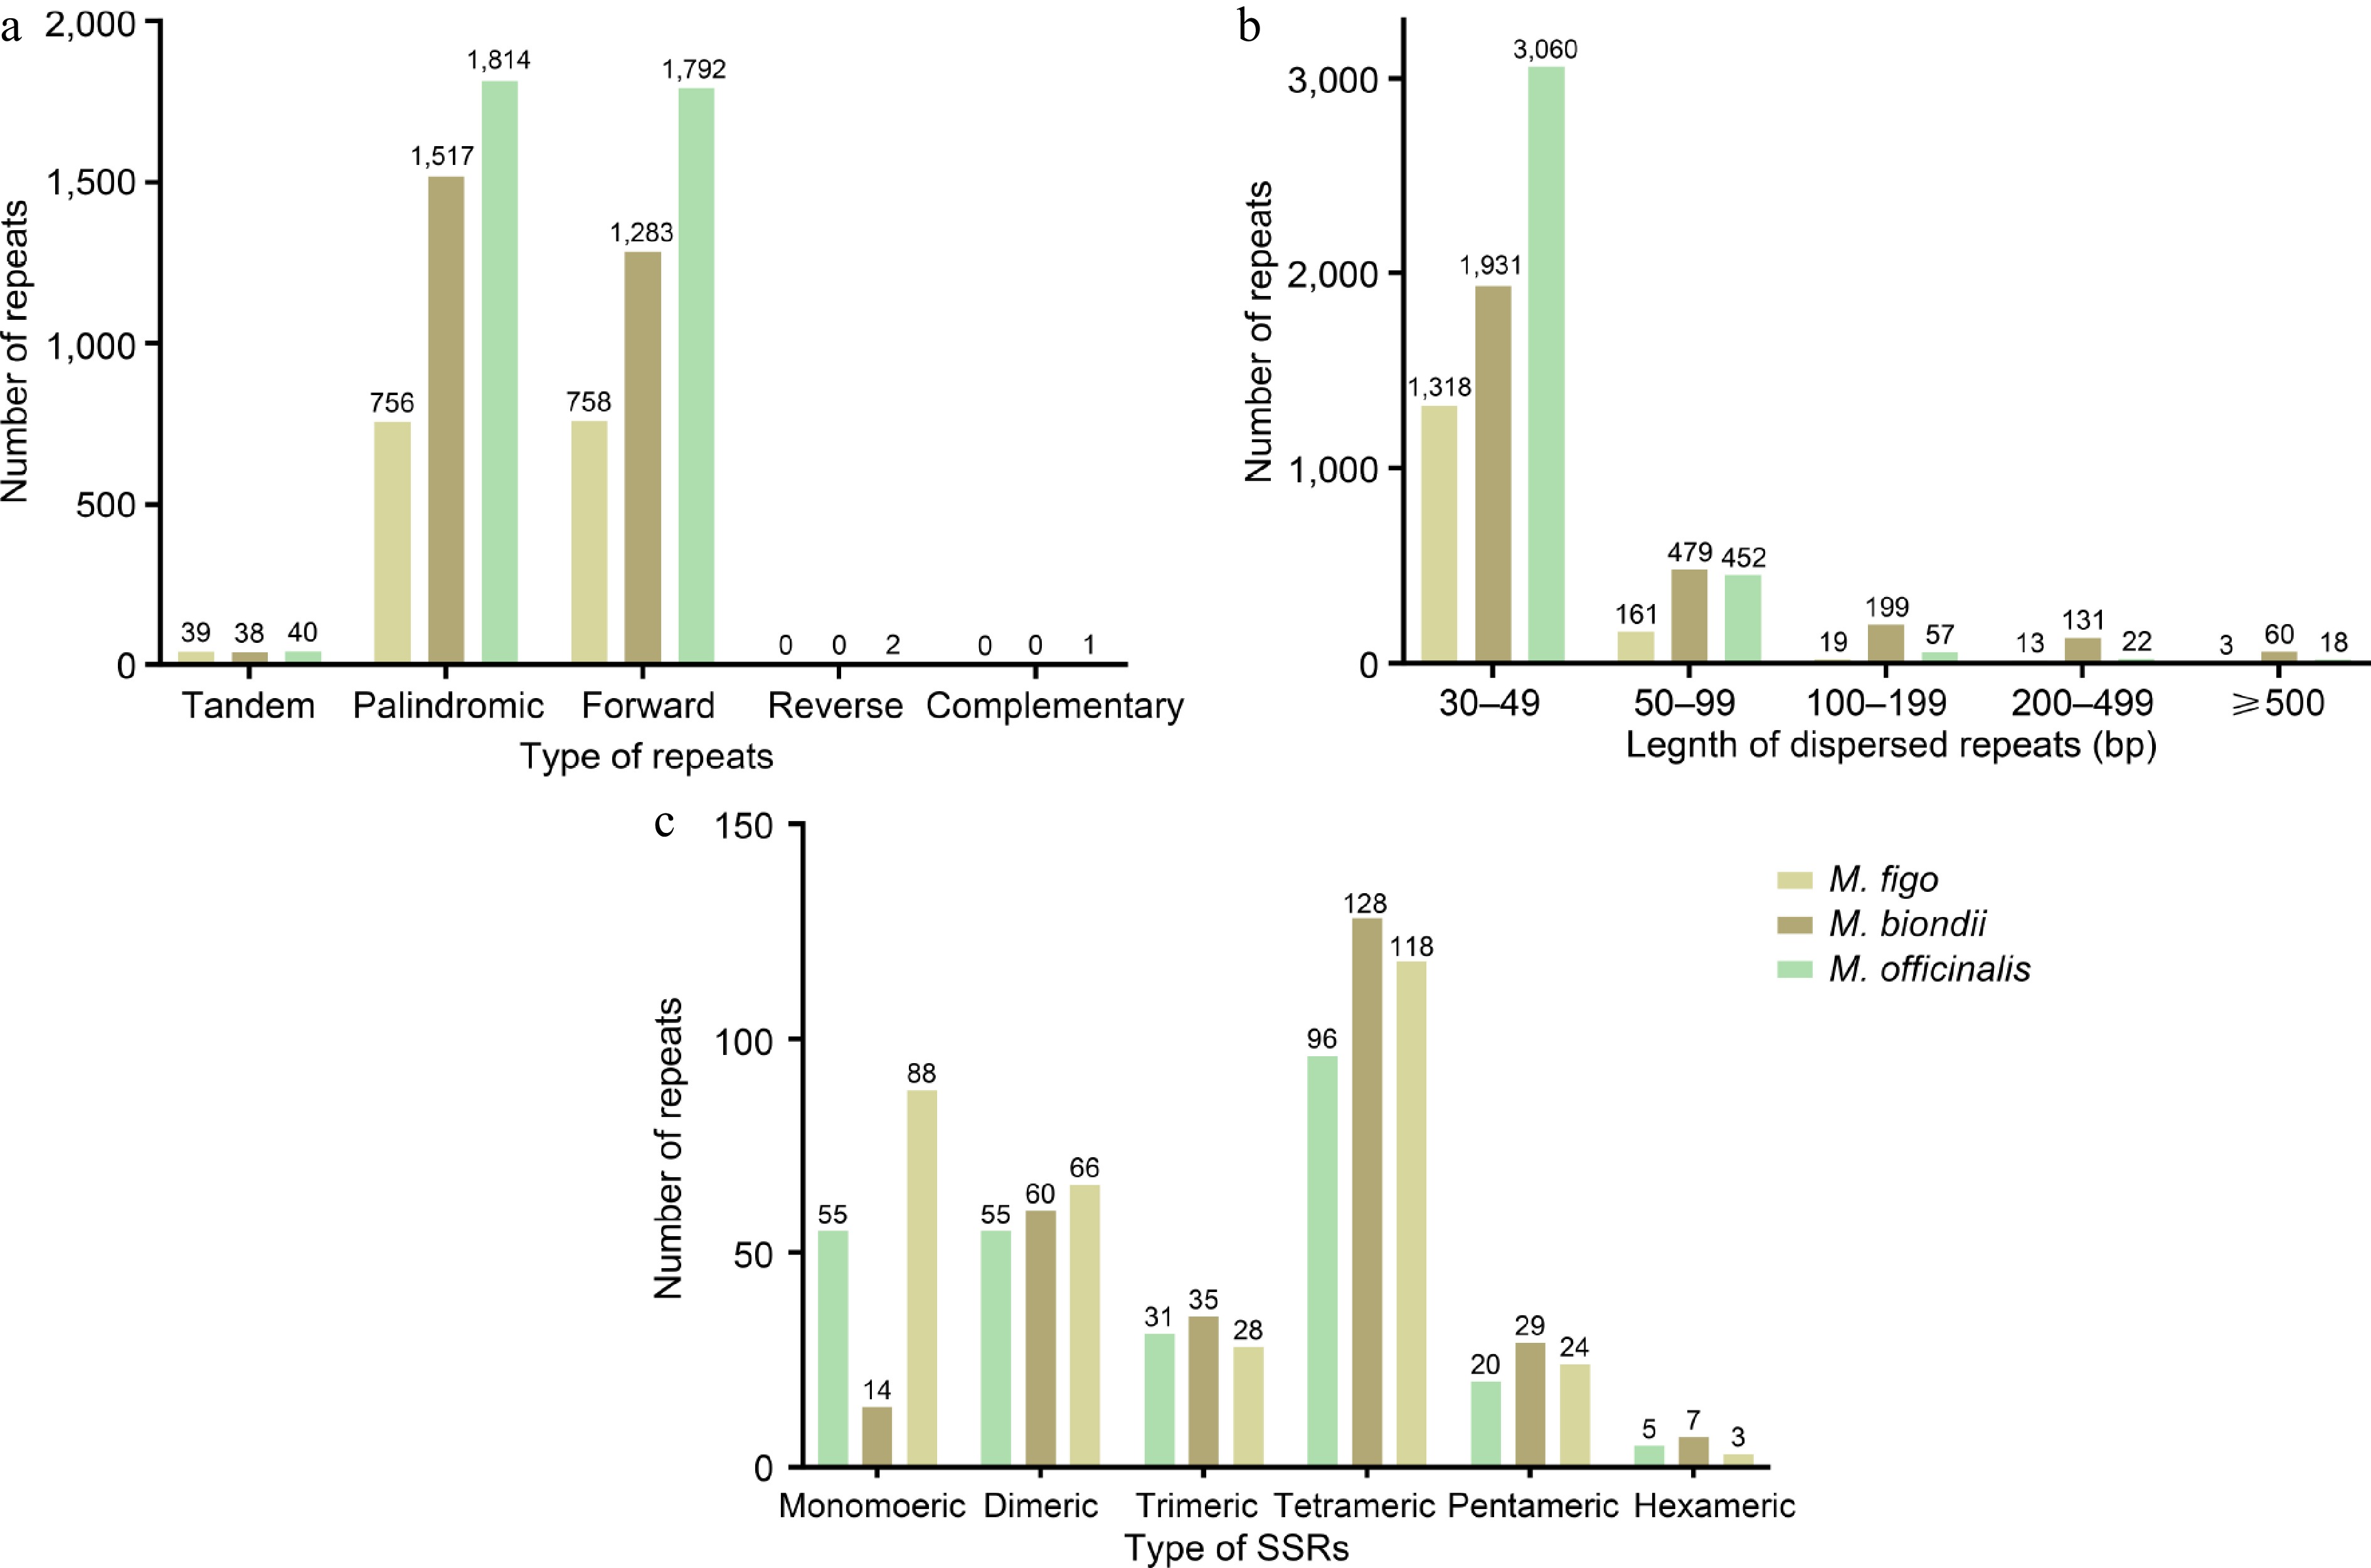
Figure 4.
(a) Type and number of simple sequence repeats in the mitogenomes of two Magnolia species and M. figo. (b) Length and number of dispersed repeats in the mitogenomes of two Magnolia species and M. figo. (c) The different colored legends indicate different species.
-
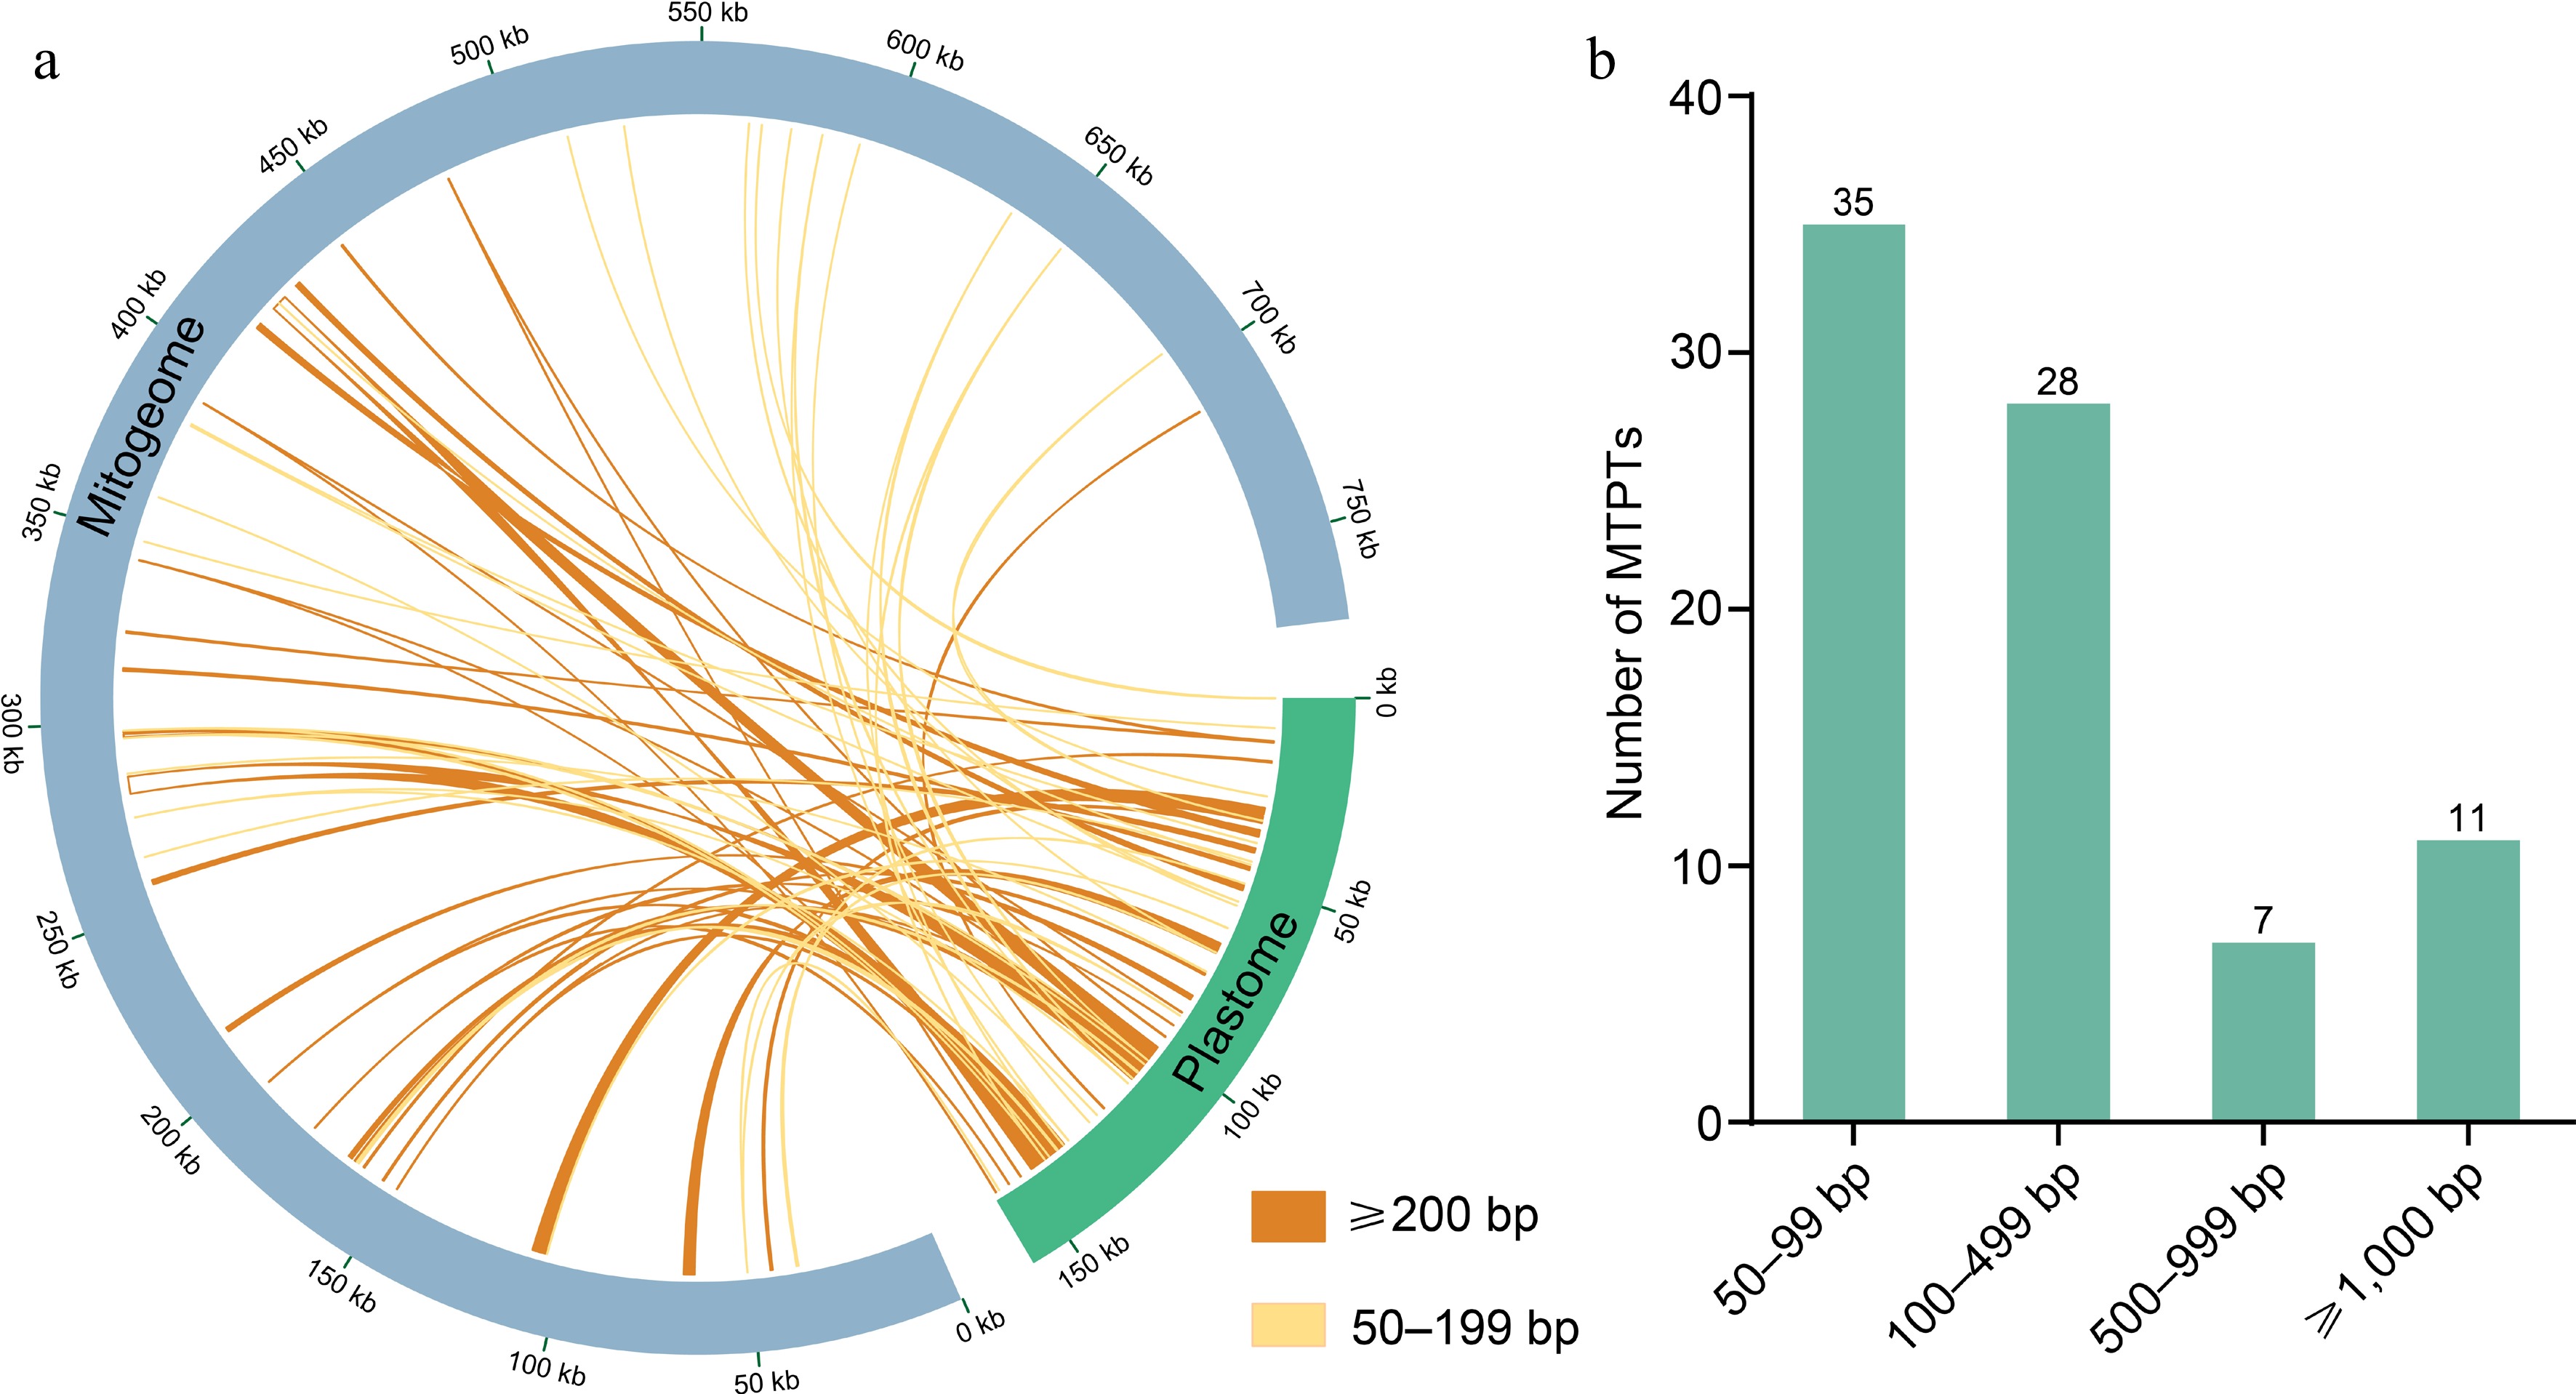
Figure 5.
(a) Homologous sequences between mitogenome and plastome. The plastome is represented by the green circular segment and the mitogenome by the gray circular segment, and two different kinds of yellow lines represent the homologous fragments. The legends of different colors positioned in the bottom right corner represent fragments of different lengths. (b) Lengths and numbers of these homologous fragments in the M. figo mitogenome.
-
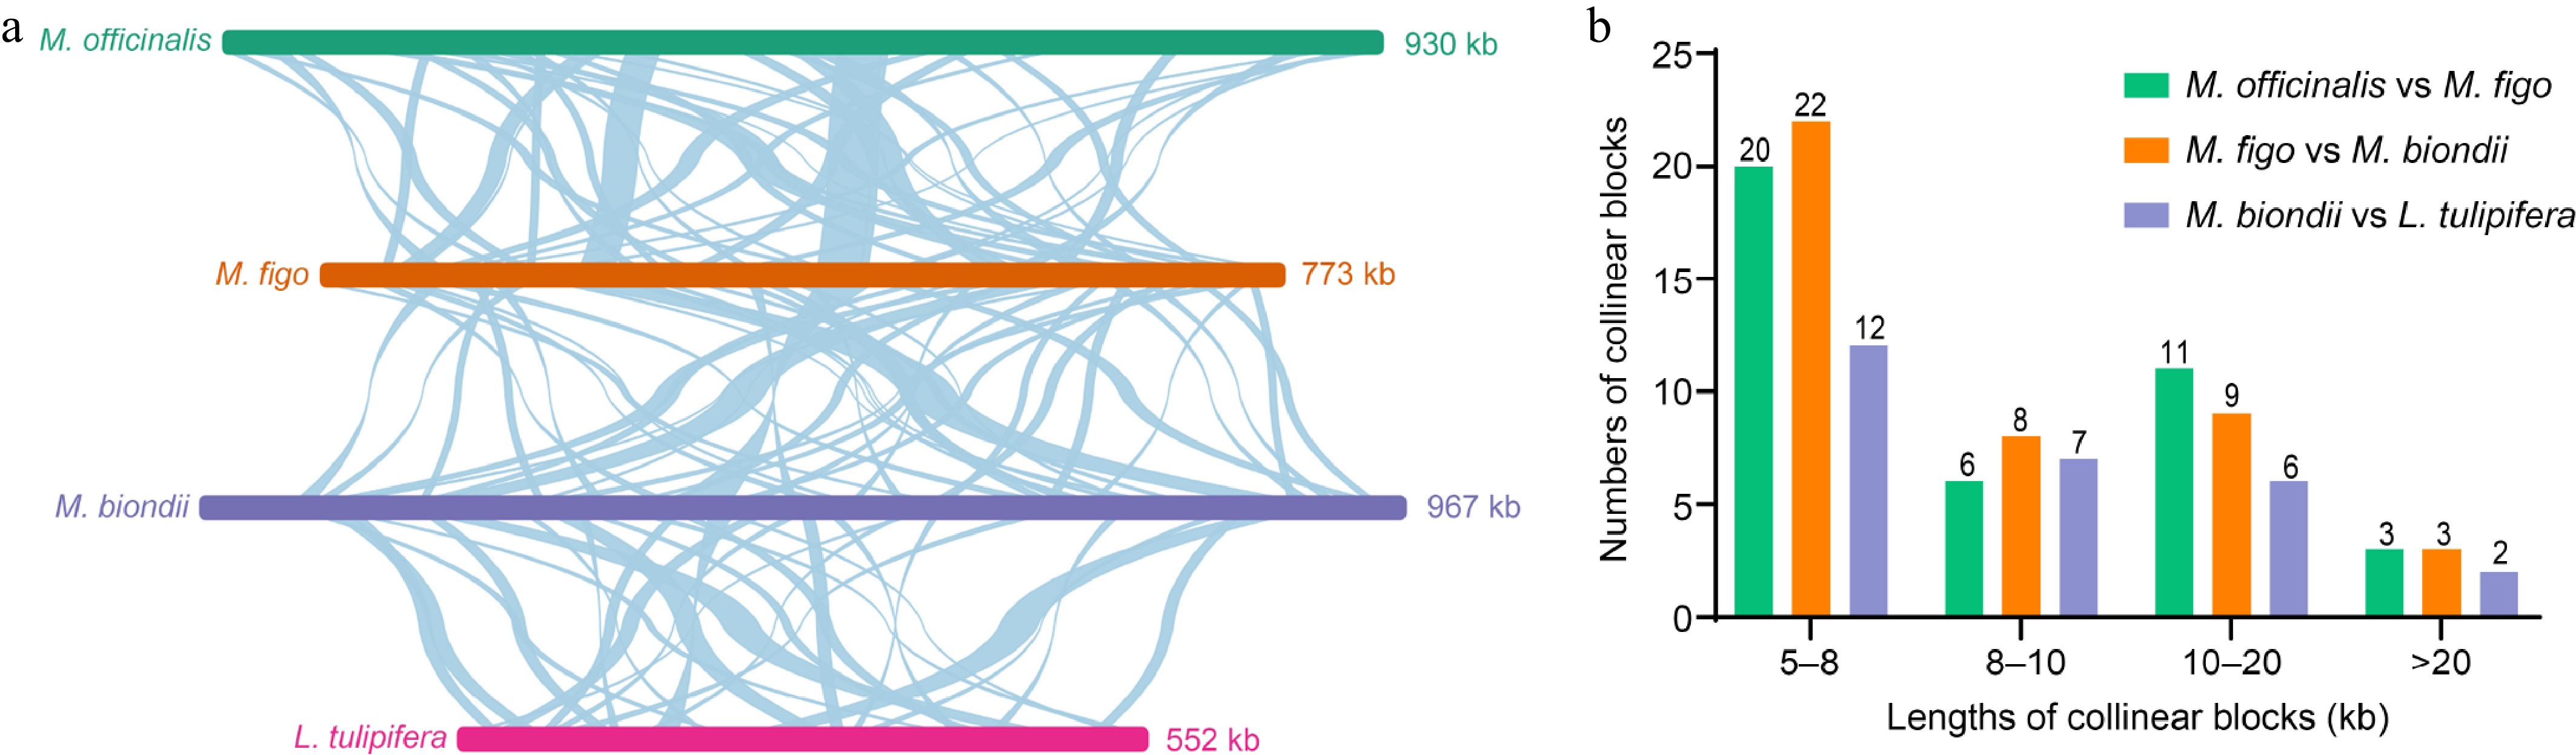
Figure 6.
Schematic representation of the collinearity among four Magnoliaceae mitogenomes. (a) Collinearity plots of the four Magnoliaceae mitogenomes. The mitogenomes are shown by the bars in each row, and collinear regions are indicated by the connecting lines in the center. (b) Lengths and numbers of collinear blocks. The different colored legends indicate homologous fragments between different species.
-
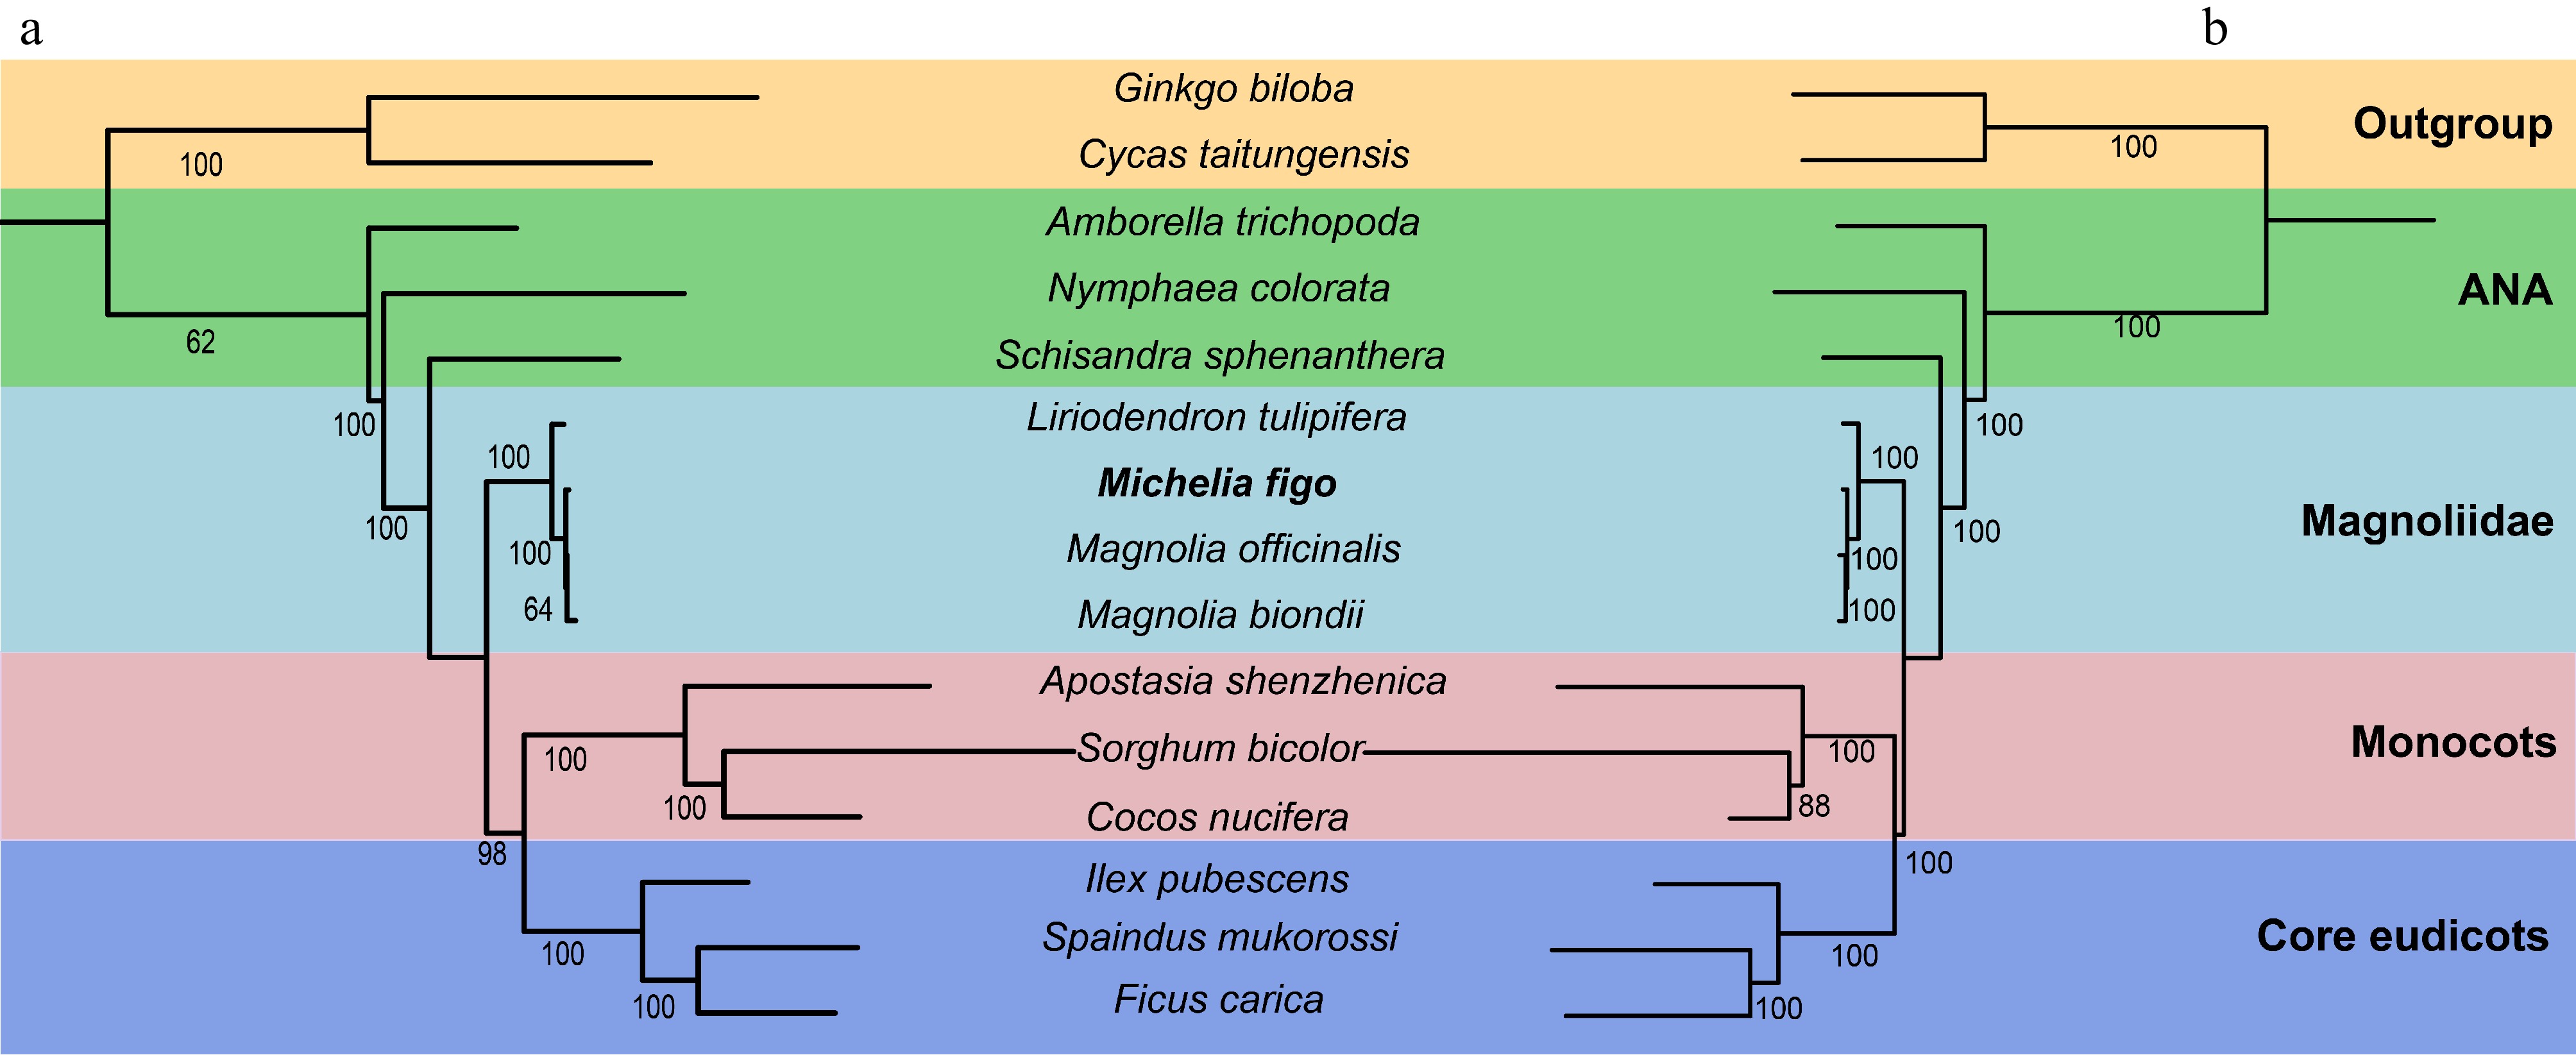
Figure 7.
The phylogenetic trees constructed based on M. figo and other 14 plant mitogenomes and plastomes. The bootstrap values are clearly displayed within each node. The utilization of distinct colors serves to show the various groups to which the specific species belong. (a) The tree was constructed based on 18 shared mitochondrial genes. (b) The tree was constructed based on 61 shared plastid genes.
-
Group of genes Name Start codon Stop codon Length Amino acids ATP synthase atp1 ATG TGA 1,530 509 atp4 ATG TAA 582 193 atp6 ATG TAG 891 296 atp8 ATG TAA 480 159 atp9 ATG TAA 261 86 Cytochrome c biogenesis ccmB ATG TGA 621 206 ccmC ATG TAA 960 319 ccmFc* ATG TAA 1,359 452 ccmFn ATG TAG 1,806 602 Ubichinol cytochrome c reductase cob ATG TGA 1,182 393 Cytochrome c oxidase cox1 ACG TAA 1,584 527 cox2** ATG TAA 759 252 cox3 ATG TGA 798 265 Maturases matR ATG TAG 1,959 652 Transport membrane protein mttB ACG TGA 768 255 NADH dehydrogenase nad1***+ ACG TAA 978 325 nad2**** ATG TAA 1,467 488 nad3 ATG TAA 357 118 nad4*** ATG TGA 1,488 495 nad4L ACG TAA 303 100 nad5**++ ATG TAA 2,013 670 nad6 ATG TGA 735 244 nad7**** ATG TAG 1,185 394 nad9 ATG TAA 573 190 Large subunit of ribosome (LSU) rpl10 ATG TAA 471 156 rpl16 GTG TAA 435 144 rpl2* ATG TAG 1,665 697 rpl5 ATG TAA 561 186 Small subunit of ribosome (SSU) rps1 ATG TAA 606 201 rps10* ATG TGA 420 139 rps11 ATG TGA 552 183 rps12 ATG TGA 378 125 rps13 ATG TGA 351 116 rps14 ATG TAG 303 100 rps19 ATG TAA 282 93 rps2 ATG TAA 657 218 rps3* ATG TAA 1,572 523 rps4 ACG TAA 1,071 356 rps7 (2) ATG/ATG TAA/TAA 450 149 Succinate dehydrogenase sdh3 ATG TAA 330 109 sdh4 ATG TGA 447 148 Ribosomal RNAs rrn5 − − 117 − rrnL − − 3,560 − rrnS − − 2,087 − Transfer RNAs trnC-GCA − − 71 − trnD-GUC − − 74 − trnE-UUC − − 72 − trnF-GAA − − 74 − trnfM-CAU − − 74 − trnG-GCC − − 73 − trnH-GUG − − 74 − trnI-CAU − − 81 − trnK-UUU − − 73 − trnM-CAU (2) − − 73/73 − trnN-GUU − − 72 − trnP-UGG (3) − − 75/74/75 − trnQ-UUG − − 72 − trnS-GCU − − 88 − trnS-UGA − − 87 − trnV-UAC − − 73 − trnW-CCA − − 74 − trnY-GUA − − 83 − * Indicates the cis-spliced introns, and + indicates the trans-spliced introns. The number of * and + represents the number of introns. The number in parentheses represents the number of genes. Table 1.
Gene compositions of the Michelia figo mitogenome.
Figures
(7)
Tables
(1)