-
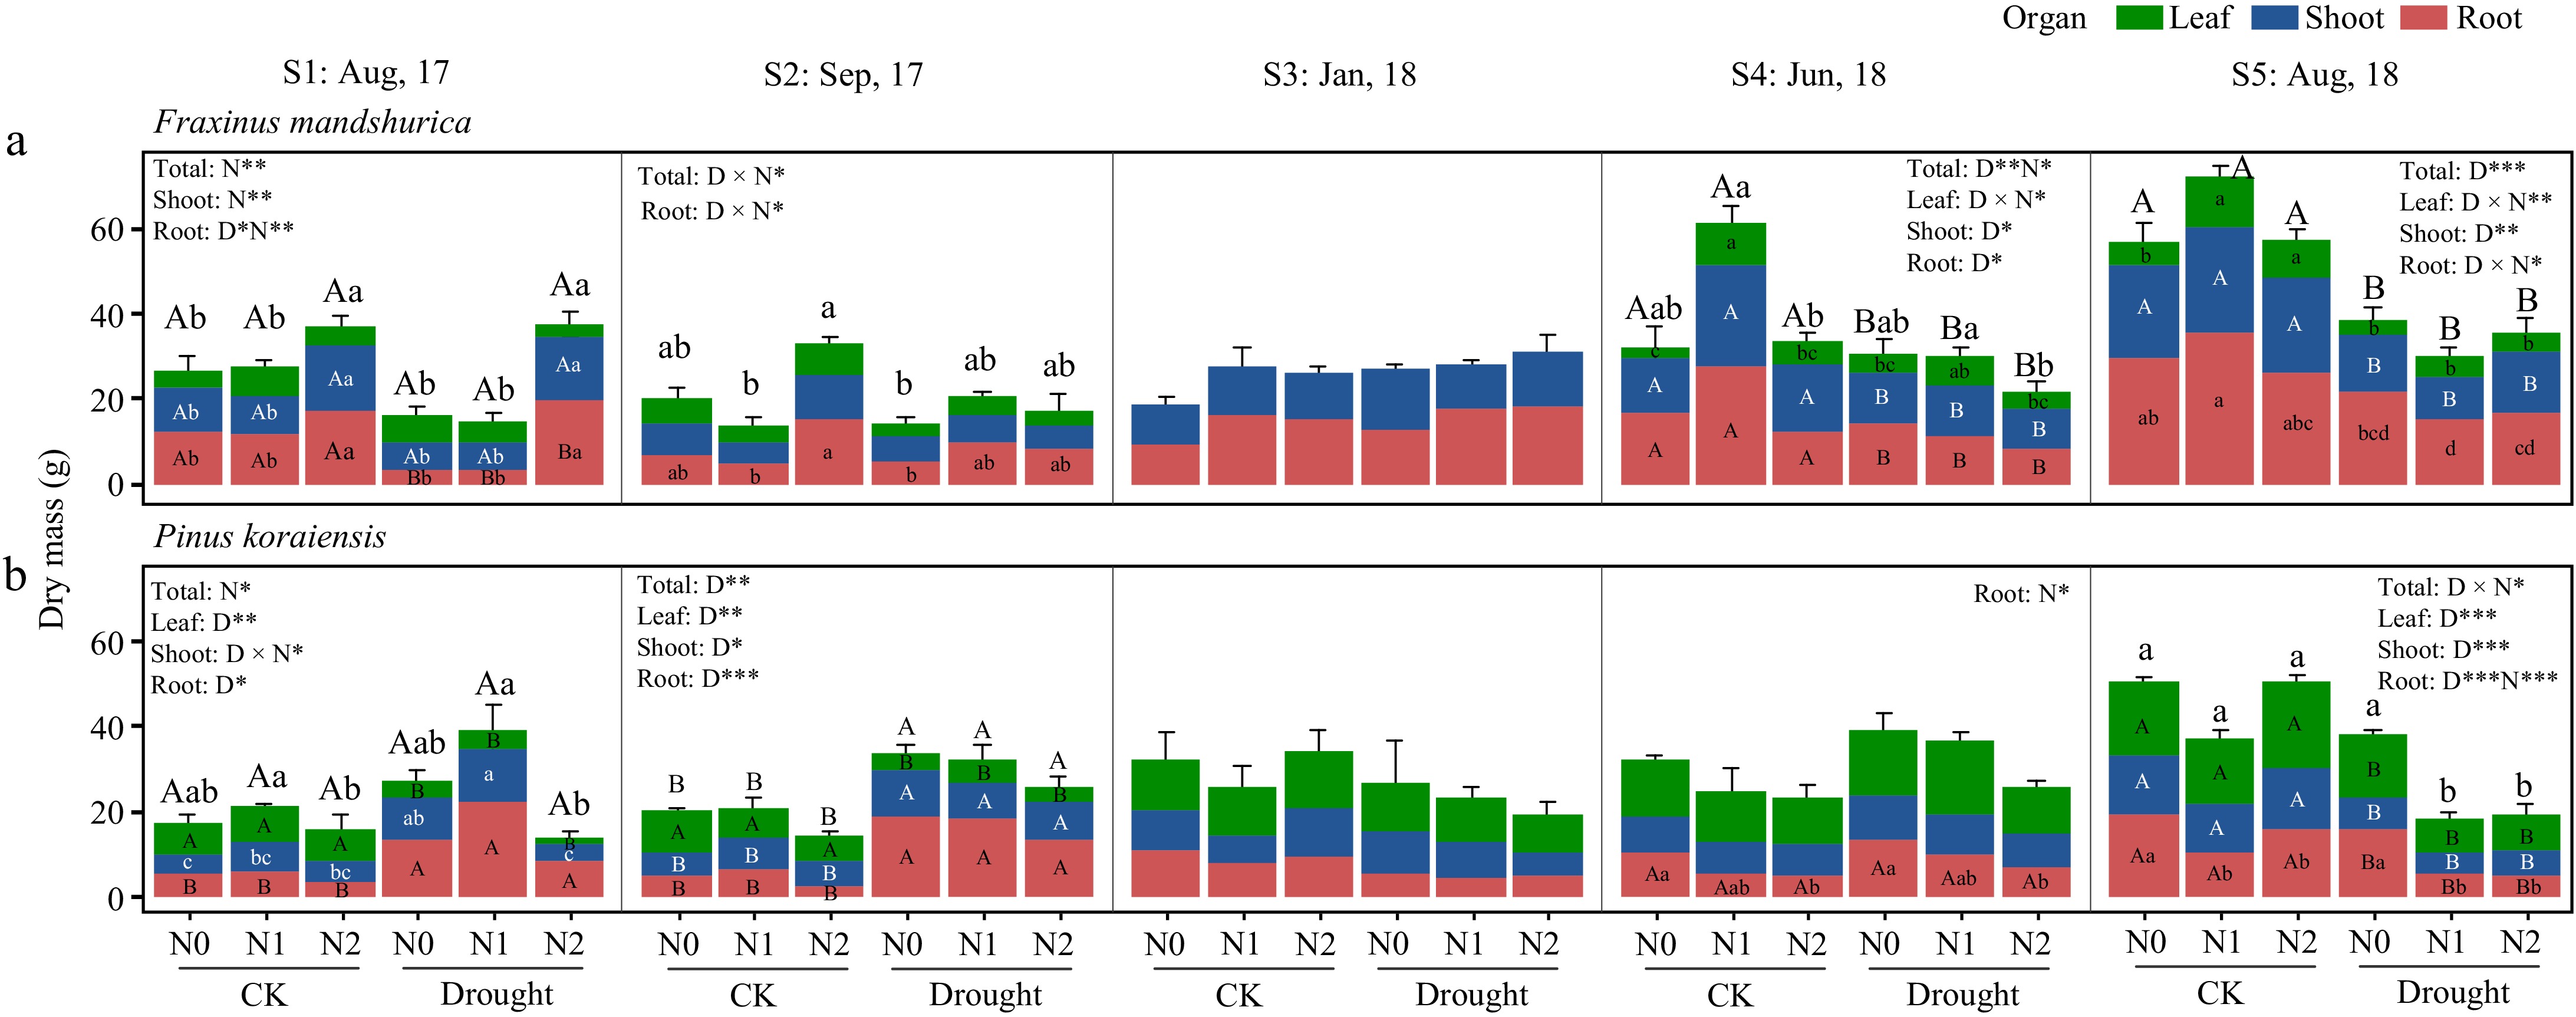
Figure 1.
The growth response of Fraxinus mandshurica and Pinus koraiensis saplings under drought and combined nitrogen fertilization treatments. CK means the ambient precipitation and Drought means 20% of ambient amount. Bars and segments indicate mean ± se (n = 3 individuals) dry mass of each organ (colored). Different upper-case letters represent significant differences in means of biomass of total (on stacked bar) or each organ (inside bar) among drought treatments (D), while lower-case letters represent significant differences between nitrogen treatments (N), or between all six combinations in case of a D × N interaction exists, tested with Tukey post-hoc test. The ANOVA results for each organ and the total biomass were listed above each sub-figure. ***, **, and * indicates significant difference at p < 0.001, p < 0.01, and p < 0.05, respectively.
-
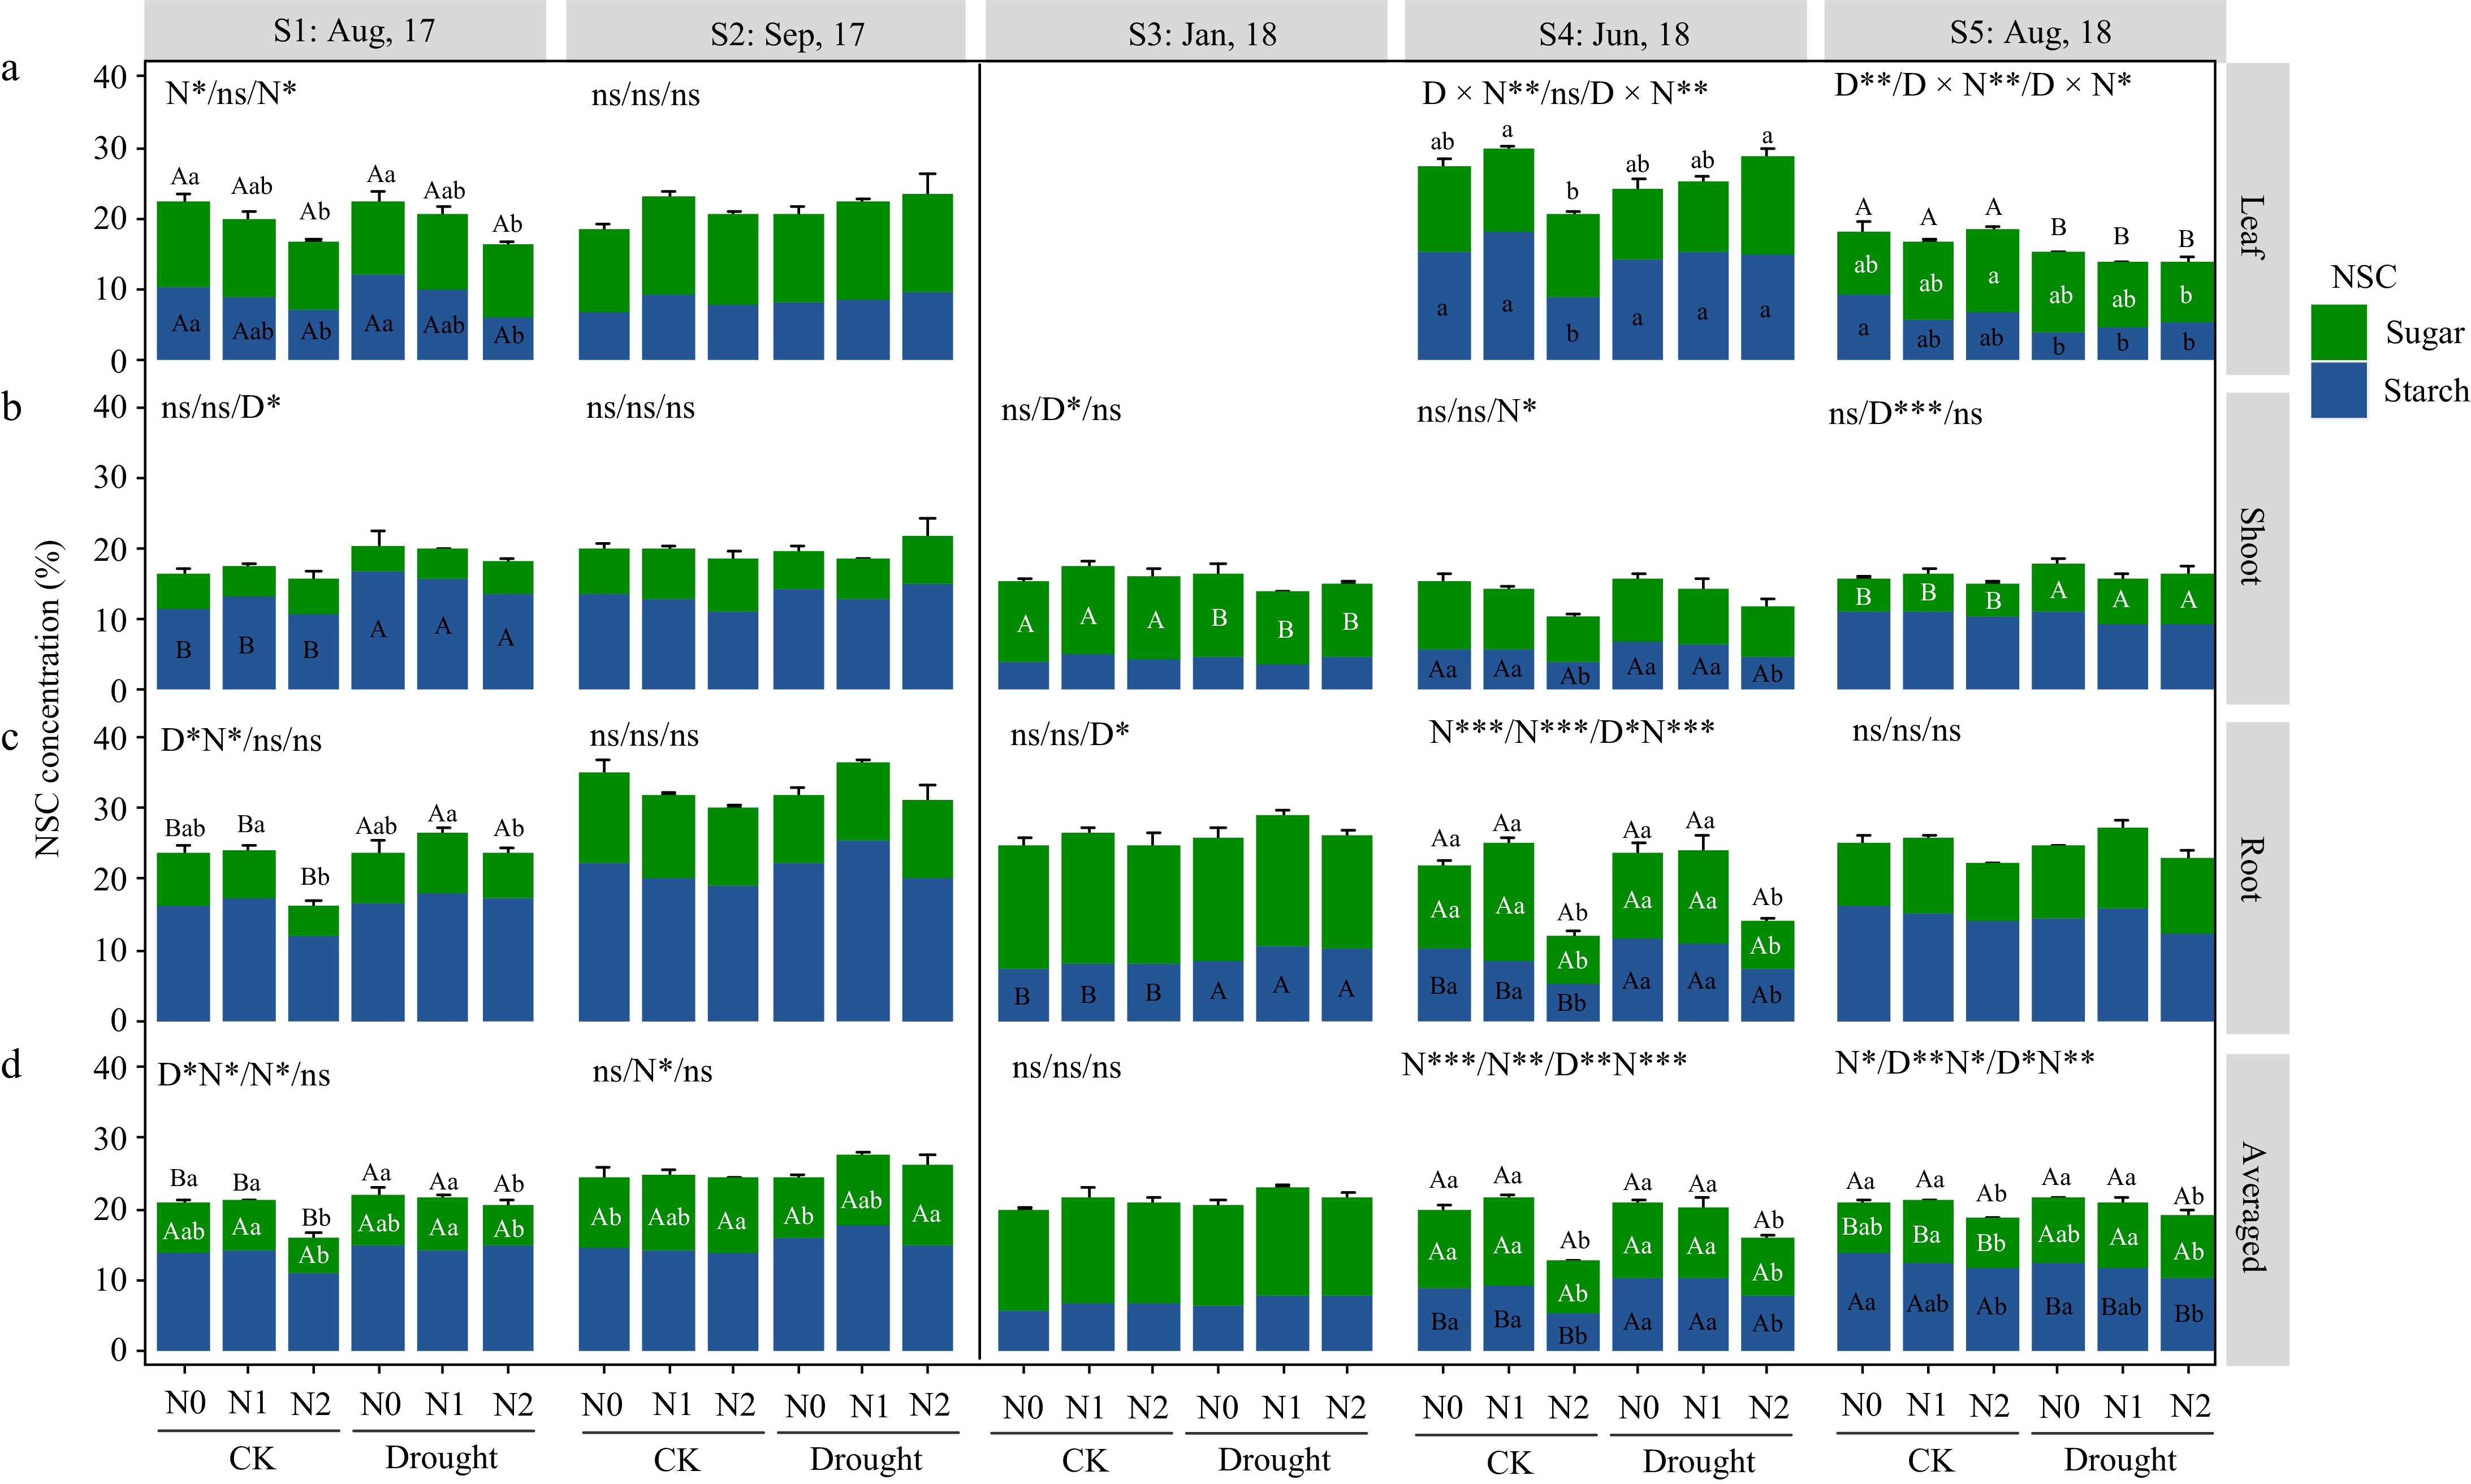
Figure 2.
Non-structural carbohydrate (NSC) response in different organs of Fraxinus mandshurica saplings at different sampling times. Bars and segments indicate mean ± se (n = 3 individuals) NSC concentration, different upper-case letters represent significant differences in means (on stacked bar for total NSC, or inside bar for sugar or starch) among drought treatments (D), while lower-case letters represent significant differences between nitrogen treatments (N), or between all six combinations in case of a D × N interaction exists, tested with Tukey post-hoc test. The ANOVA results for total NSC (sugar + starch), sugar and starch (delimited with slash symbol) were listed above each sub-figure. ***, **, and * indicates significant difference at p < 0.001, p < 0.01, and p < 0.05, respectively. ns means non-significant.
-
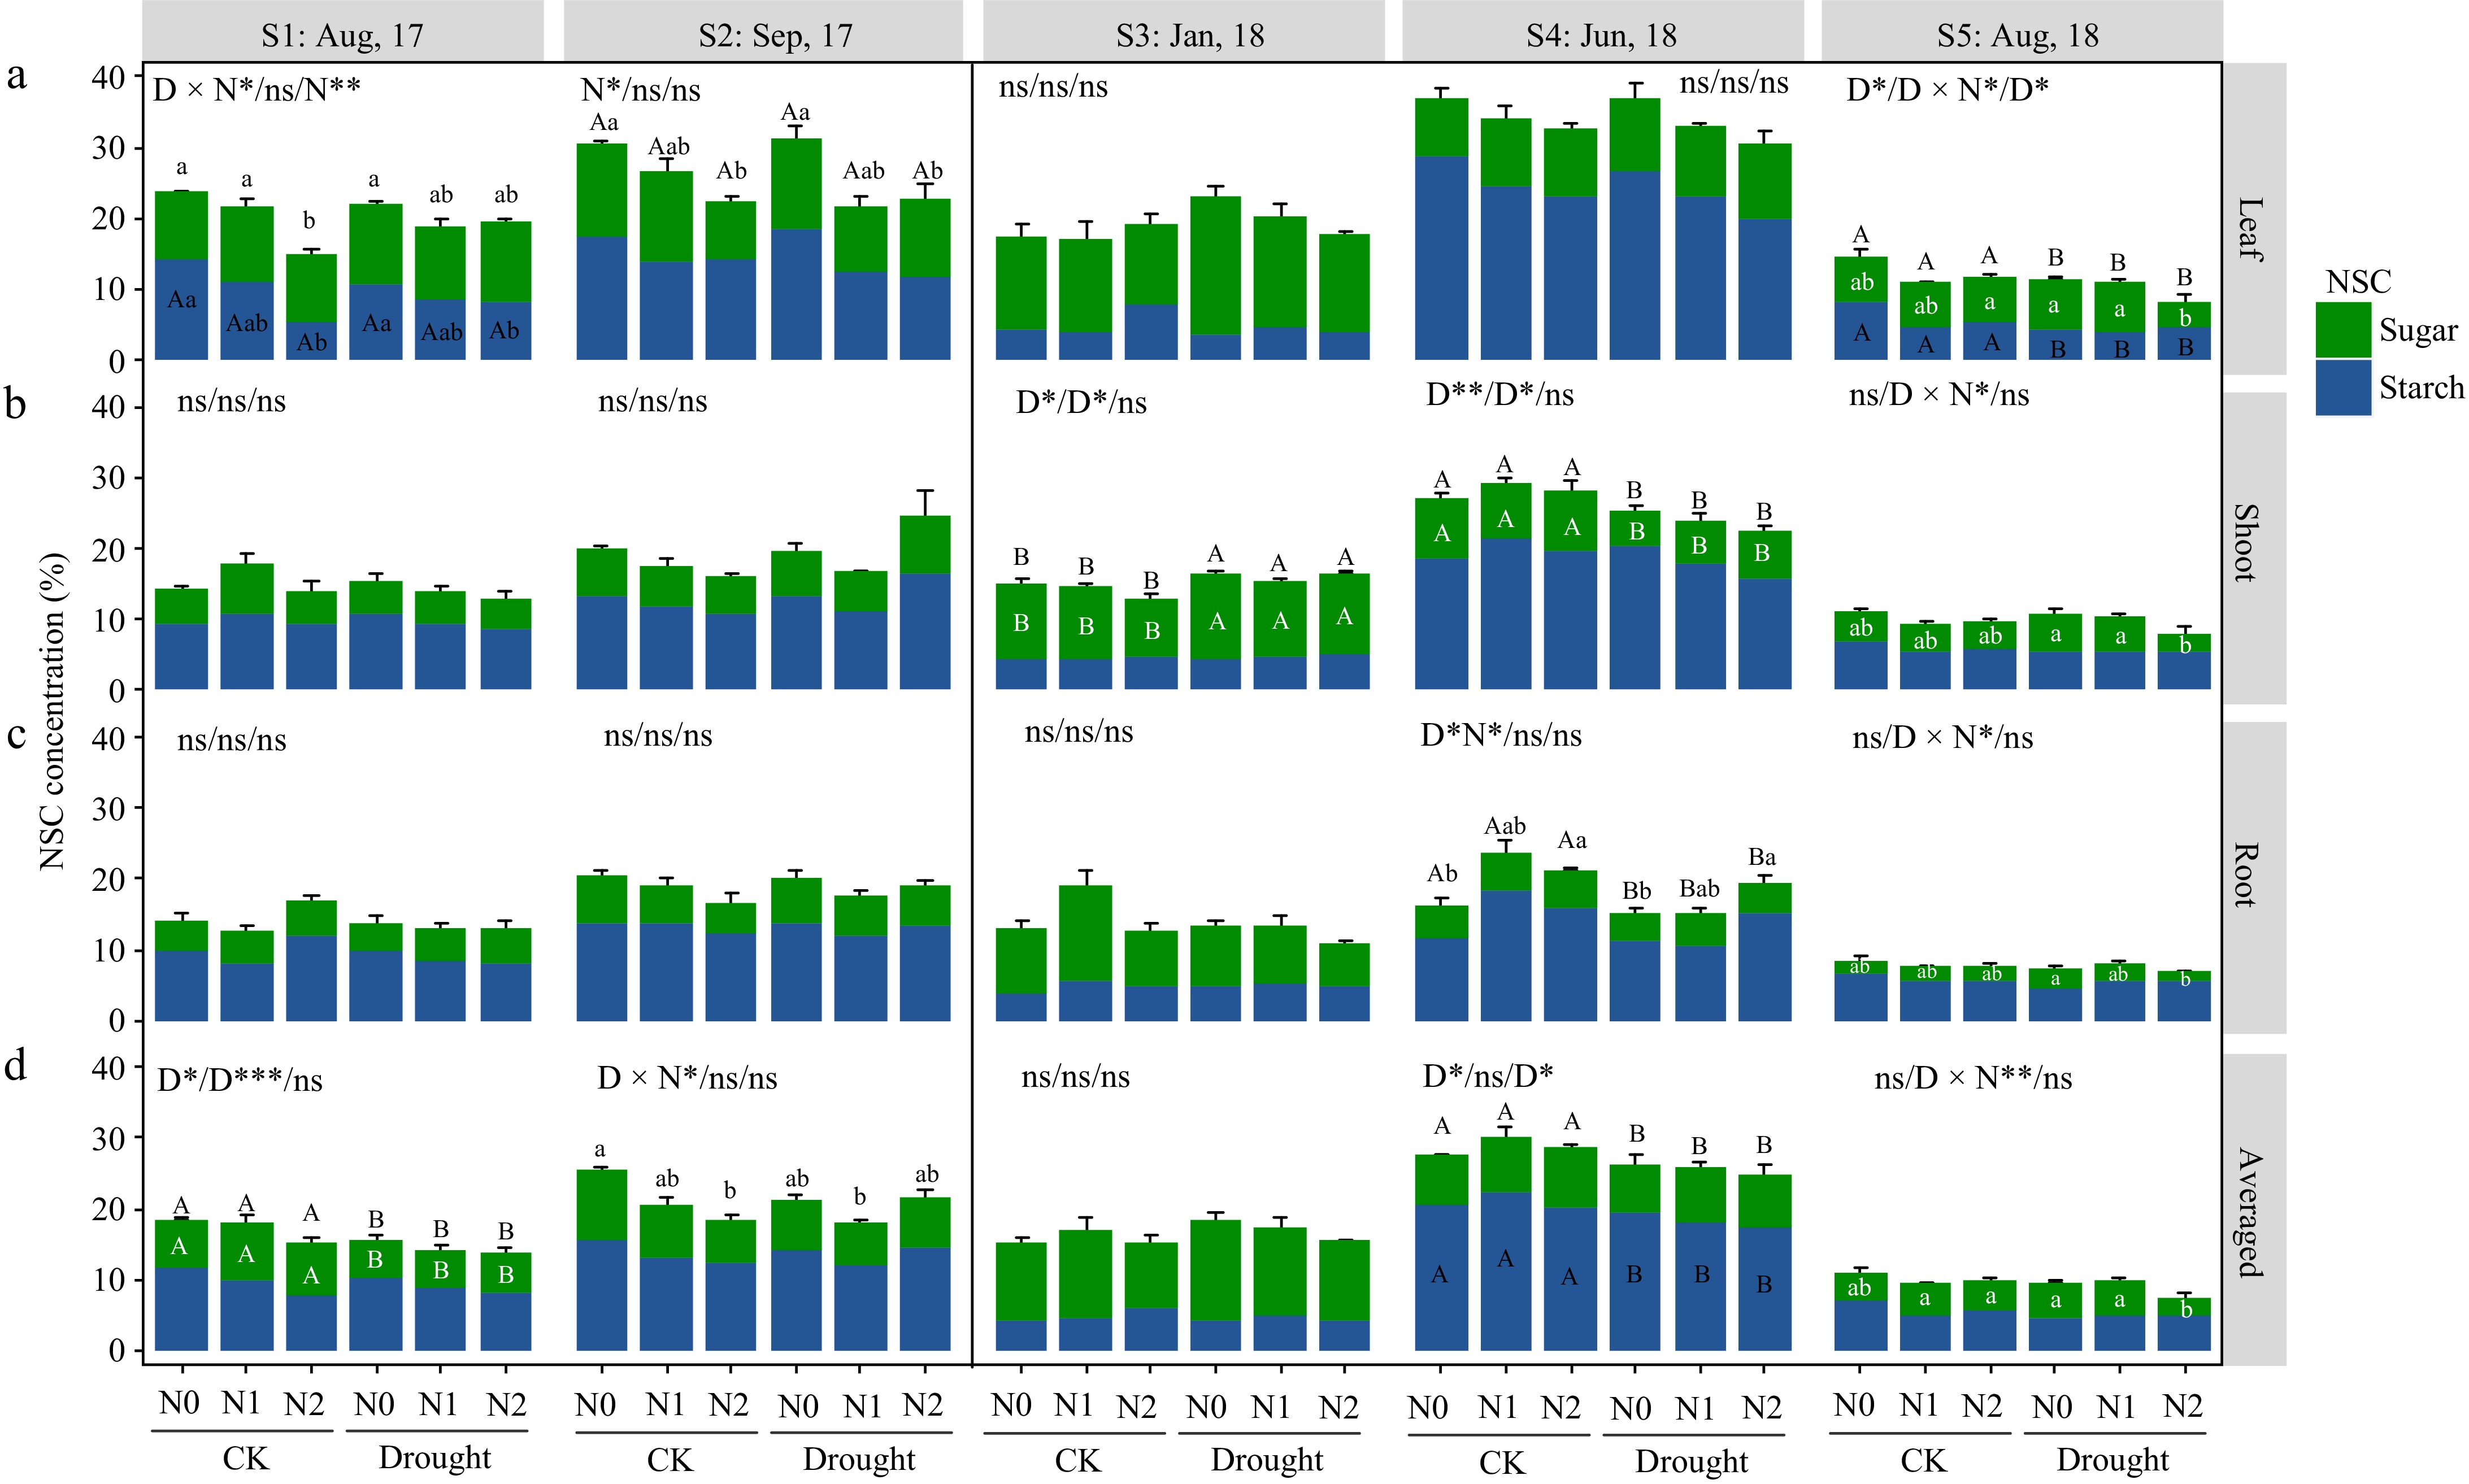
Figure 3.
Non-structural carbohydrate (NSC) response in organs of Pinus koraiensis saplings at different sampling times. Bars and segments indicate mean ± se (n = 3 individuals) NSC concentration, different upper-case letters represent significant differences in means (on stacked bar for total NSC, or inside bar for sugar or starch) among drought treatments (D), while lower-case letters represent significant differences between nitrogen treatments (N), or between all six combinations in case of a D × N interaction exists, tested with Tukey post-hoc test. The ANOVA results for total NSC (sugar + starch), sugar and starch (delimited with slash symbol) were listed above each sub-figure. ***, **, and * indicates significant difference at p < 0.001, p < 0.01, and p < 0.05, respectively. ns means non-significant.
-
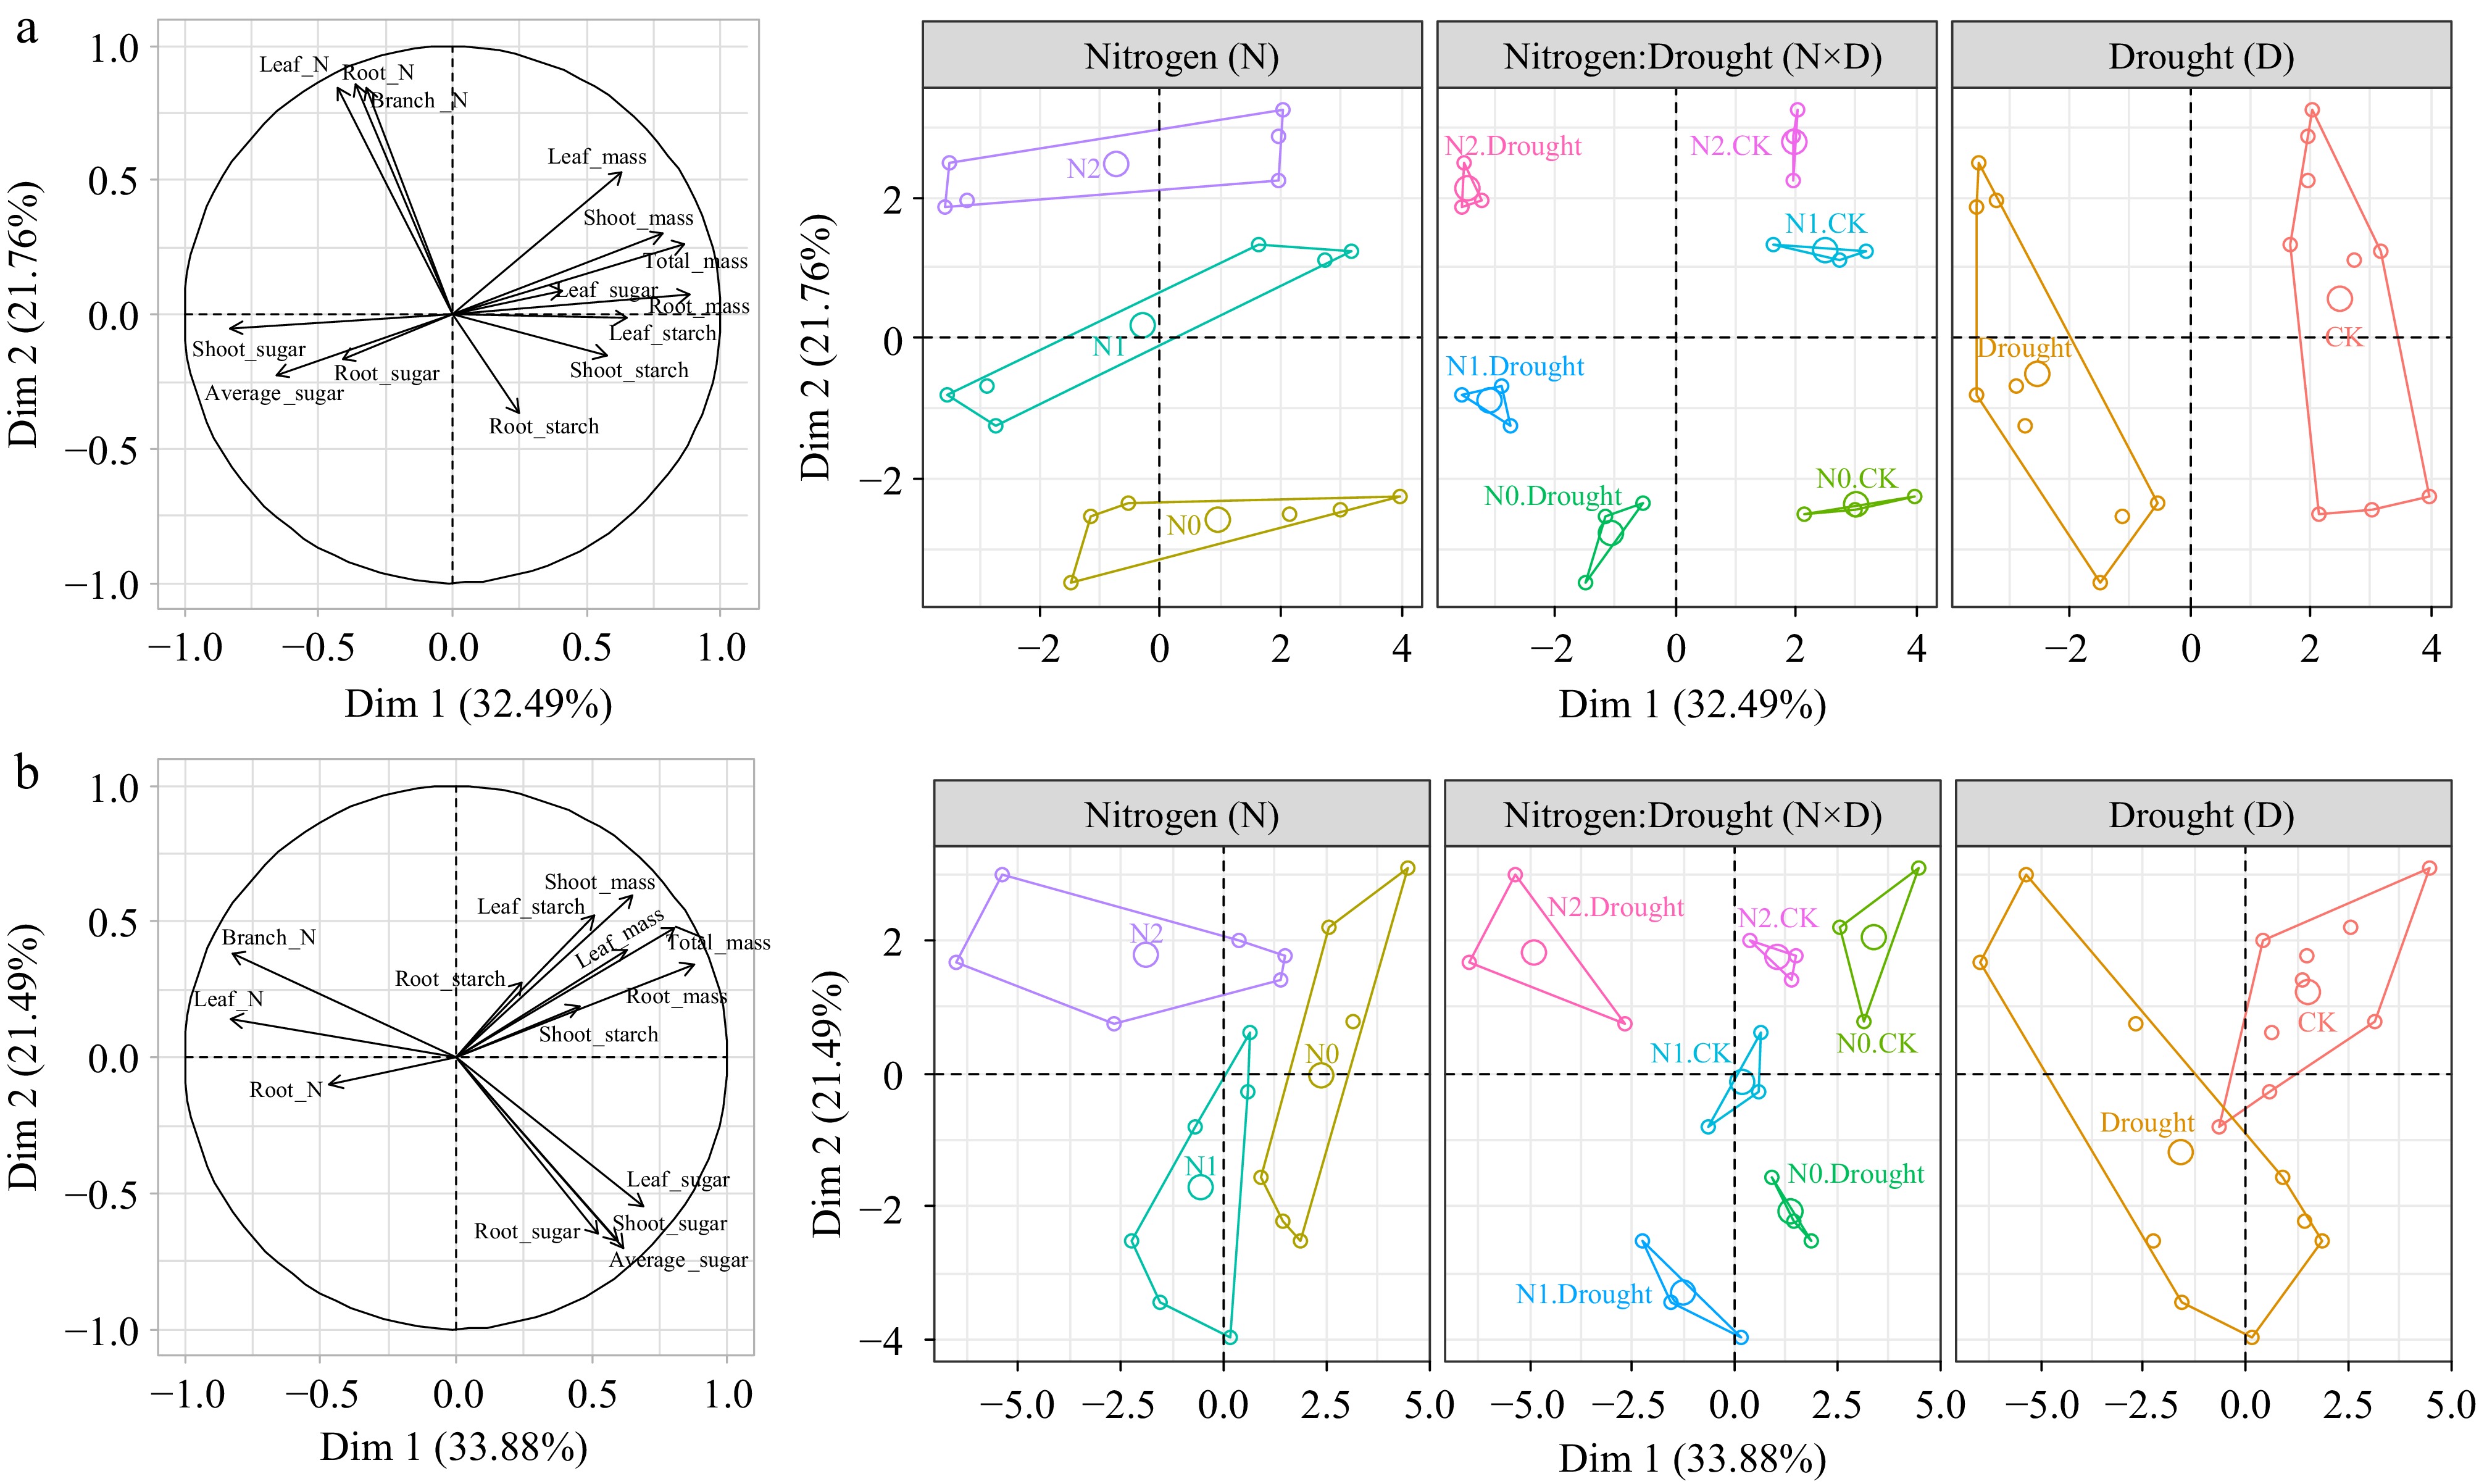
Figure 4.
Factor analysis of mixed (FAMD) non-structural carbohydrate (NSC), nitrogen (N) content in relation to growth in Fraxinus mandshurica and Pinus koraiensis at the final harvest time.
-
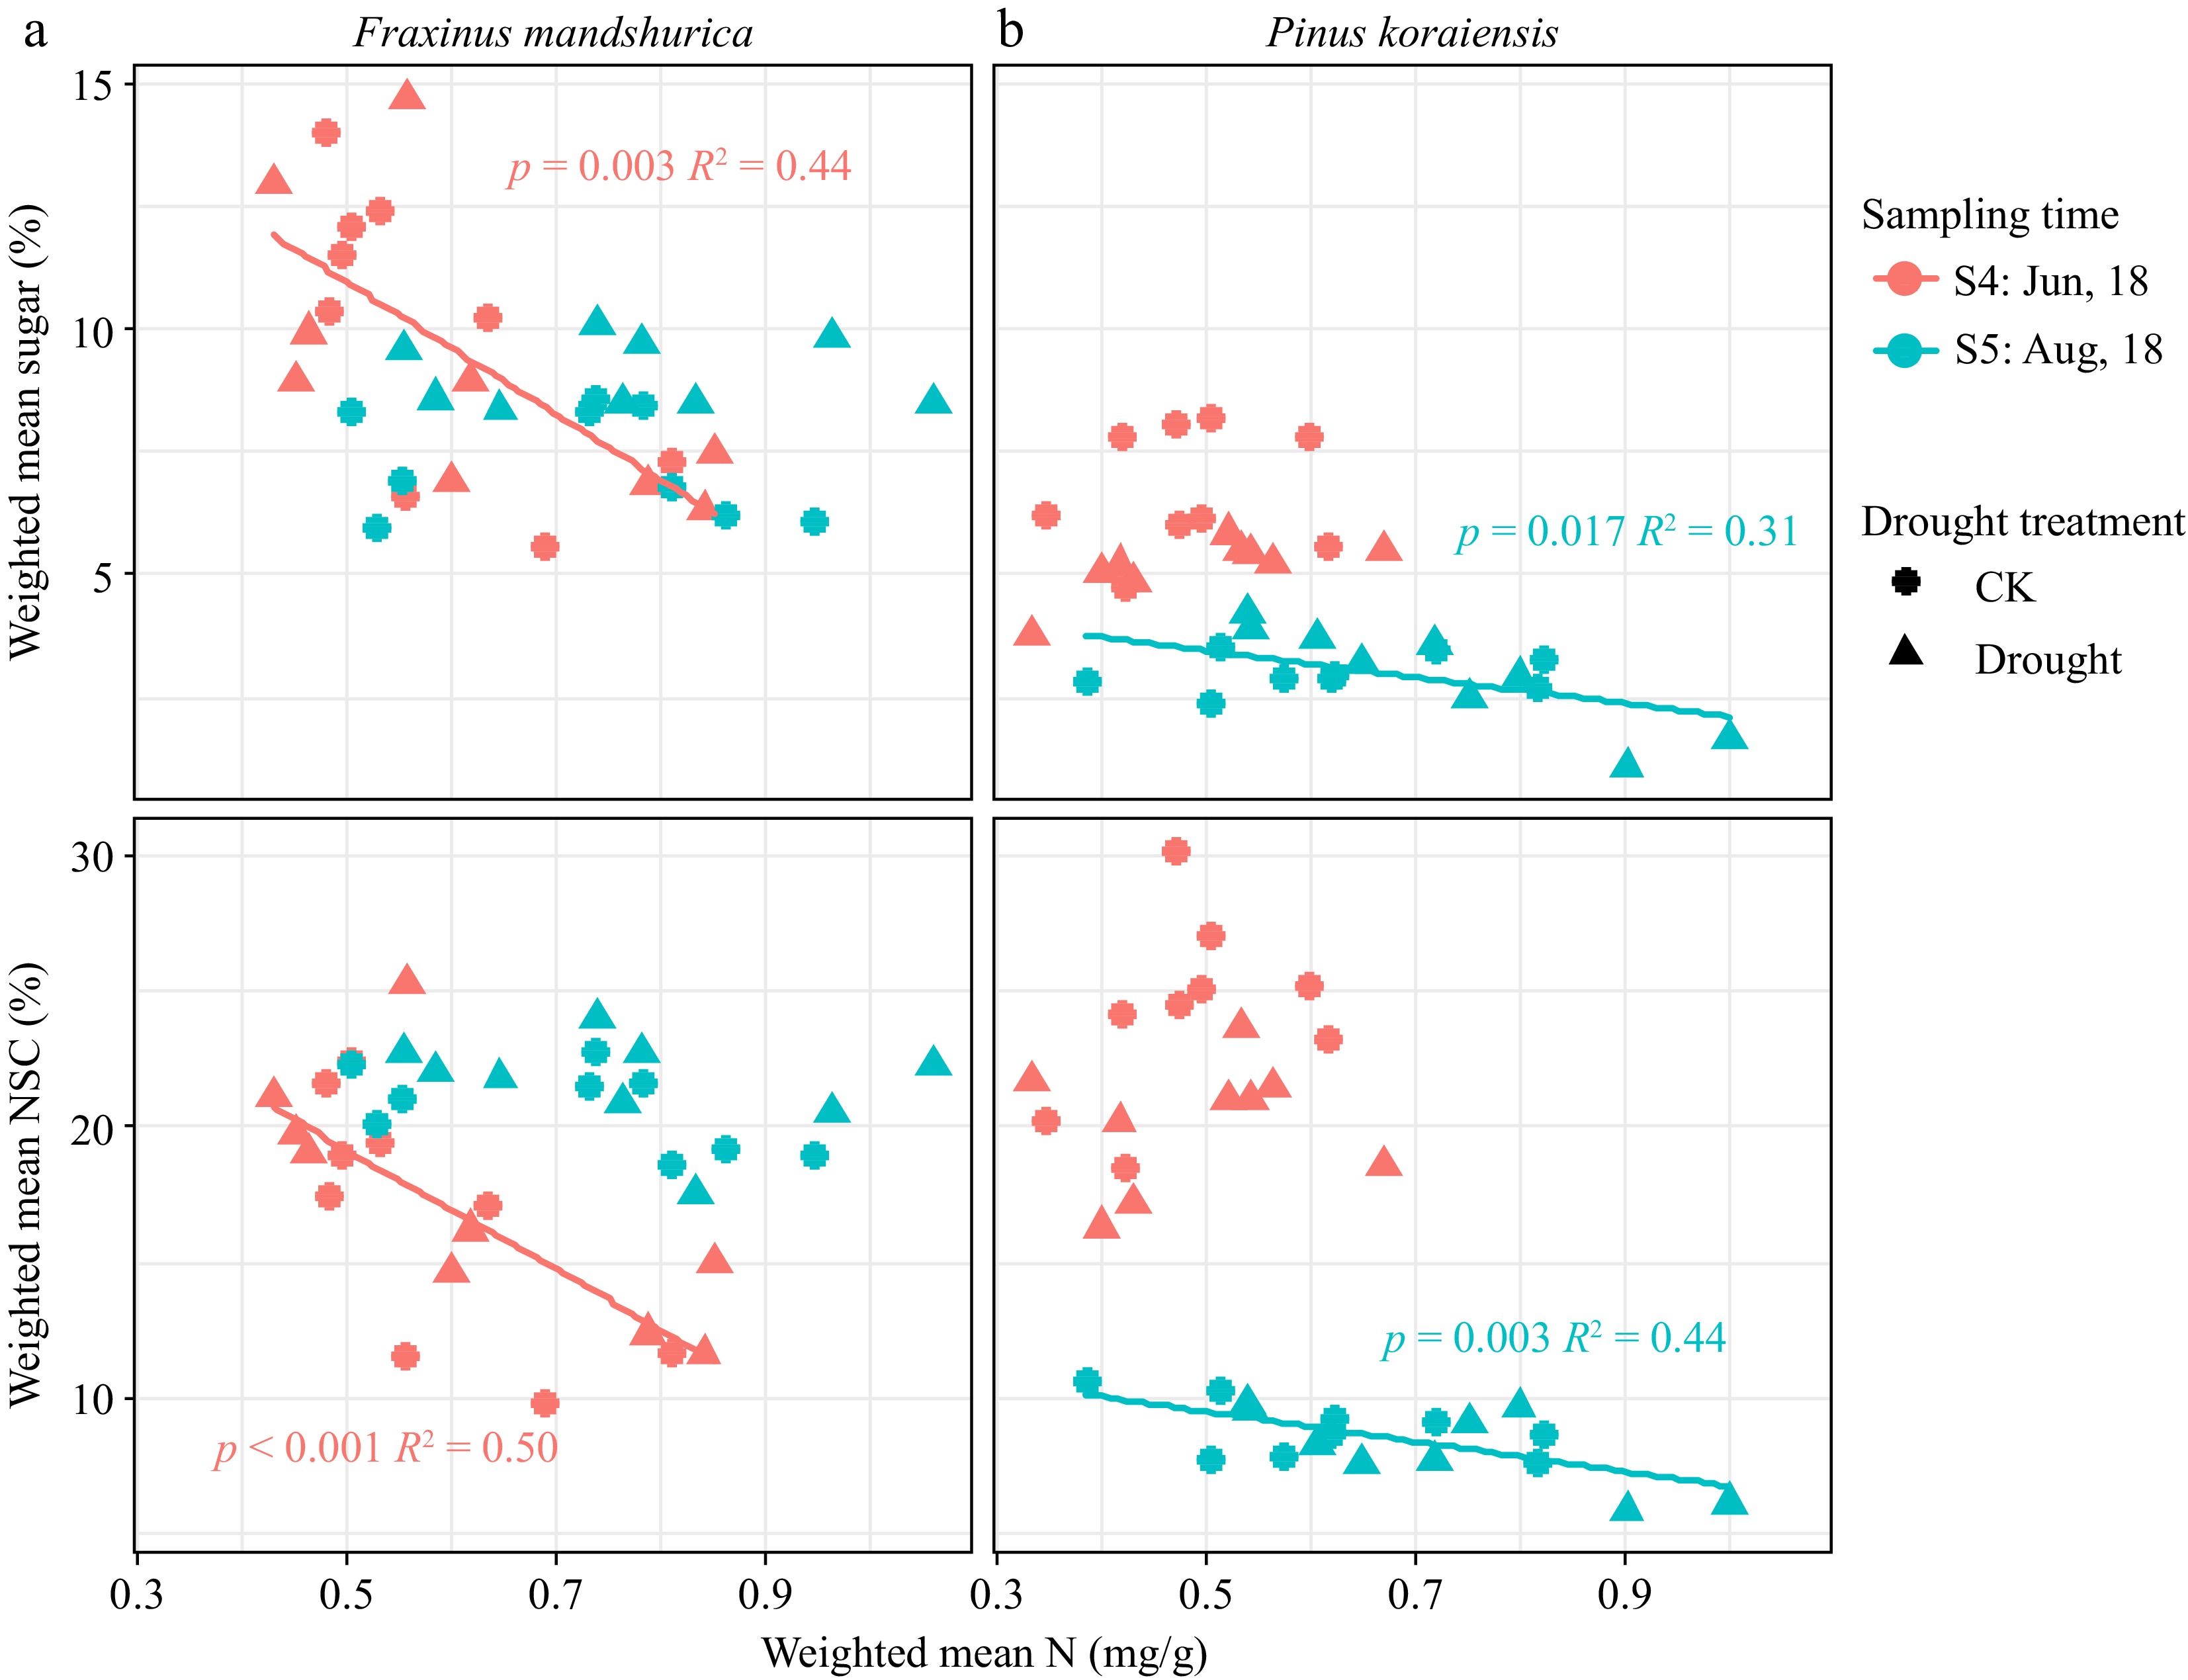
Figure 5.
Weighted mean total NSC and sugar concentration scaled with N content for different species at different sampling times. Parameters of fitted linear model (with p < 0.05) are given on each sub-figure.
-
Species Time Factors Total Leaf Shoot Root F value PEta F value PEta F value PEta F value PEta F. mand S1: Aug, 2017 Drought (D) 4.482 0.272 0.005 0.000 2.746 0.186 5.437* 0.312 Nitrogen (N) 8.815** 0.595 1.446 0.194 9.148** 0.604 12.093** 0.668 D × N 1.397 0.189 0.606 0.211 0.369 0.058 3.245 0.351 S2: Sep, 2017 Drought (D) 2.626 0.180 3.631 0.232 2.672 0.182 0.478 0.038 Nitrogen (N) 3.230 0.350 0.768 0.113 1.359 0.185 4.304* 0.418 D × N 4.856* 0.447 1.554 0.206 3.364 0.359 4.039* 0.402 S3: Jan, 2018 Drought (D) 0.638 0.050 3.884 0.245 0.606 0.048 Nitrogen (N) 0.268 0.043 0.188 0.030 1.413 0.191 D × N 0.083 0.014 2.220 0.270 0.032 0.005 S4: Jun, 2018 Drought (D) 9.920** 0.453 1.303 0.098 8.693* 0.420 8.108* 0.403 Nitrogen (N) 5.459* 0.476 29.768*** 0.832 2.696 0.310 3.732 0.383 D × N 3.371 0.360 5.865* 0.494 2.283 0.276 2.502 0.294 S5: Aug, 2018 Drought (D) 41.649*** 0.776 66.196*** 0.847 17.486** 0.593 48.484*** 0.802 Nitrogen (N) 0.433 0.067 17.308*** 0.743 0.054 0.009 2.259 0.273 D × N 3.057 0.338 7.592** 0.559 0.678 0.102 4.982* 0.454 P. Kora S1: Aug, 2017 Drought (D) 3.669 0.234 16.656** 0.581 15.063** 0.557 7.896* 0.397 Nitrogen (N) 3.949* 0.397 1.008 0.144 9.685** 0.617 2.008 0.251 D × N 1.702 0.221 0.356 0.056 5.614* 0.483 1.018 0.145 S2: Sep, 2017 Drought (D) 15.113** 0.557 10.300** 0.462 7.209* 0.375 53.981*** 0.819 Nitrogen (N) 2.095 0.259 2.205 0.269 0.028 0.005 2.998 0.333 D × N 0.079 0.013 1.086 0.153 0.875 0.127 0.265 0.042 S3: Jan, 2018 Drought (D) 0.822 0.064 0.320 0.026 0.237 0.019 2.283 0.160 Nitrogen (N) 0.126 0.021 0.029 0.005 0.249 0.040 0.182 0.029 D × N 0.210 0.034 0.137 0.022 1.106 0.156 0.061 0.010 S4: Jun, 2018 Drought (D) 2.492 0.172 1.624 0.119 0.374 0.058 4.425 0.269 Nitrogen (N) 2.070 0.256 1.411 0.190 0.505 0.078 5.206* 0.465 D × N 0.401 0.063 0.696 0.104 0.145 0.024 0.195 0.031 S5: Aug, 2018 Drought (D) 74.837*** 0.862 27.466*** 0.696 34.786*** 0.744 31.475*** 0.724 Nitrogen (N) 15.603*** 0.722 3.147 0.344 0.208 0.230 23.644*** 0.798 D × N 5.328* 0.470 3.758 0.385 0.683 0.062 3.546 0.371 F value of ANOVA is given, ***, **, and * indicates significant difference between different treatment levels at p < 0.001, p < 0.01, and p < 0.05, respectively (F value in bold if p < 0.05). F. mand: Fraxinus mandshurica, P. kora: Pinus koraiensis. PEta: Partial Eta squared which used to measure the effect size of different variables in ANOVA models. Table 1.
Two-way ANOVA analysis of total, leaf, shoot and root dry biomass in Fraxinus mandshurica and Pinus koraiensis affected by drought and nitrogen addition treatments.
-
Measurements Factors Fraxinus mandshurica Pinus koraiensis F value PEta F value PEta Leaf N Time (T) 5.261** 0.200 8.666*** 0.302 Drought (D) 8.530** 0.119 4.175* 0.050 Nitrogen (N) 54.789*** 0.635 21.438*** 0.349 D × N 0.074 0.002 1.171 0.028 Shoot N Time (T) 14.977*** 0.428 5.759*** 0.224 Drought (D) 2.398 0.029 3.089 0.027 Nitrogen (N) 17.753*** 0.307 17.265*** 0.301 D × N 0.700 0.017 0.484 0.012 Root N Time (T) 10.773*** 0.350 47.128*** 0.702 Drought (D) 2.513 0.030 2.118 0.026 Nitrogen (N) 29.981*** 0.428 16.025*** 0.286 D × N 0.495 0.012 1.788 0.043 Weighted N Time (T) 7.175*** 0.255 10.604*** 0.346 Drought (D) 0.012 0.000 0.410 0.005 Nitrogen (N) 22.405*** 0.416 33.934*** 0.459 D × N 0.977 0.030 0.011 0.000 F value of results is given, ***, **, and * indicates significant difference between different treatment levels at p < 0.001, p < 0.01, and p < 0.05, respectively (F value in bold if p < 0.05). PEta: Partial Eta squared which used to measure the effect size of different variables in ANOVA models. Table 2.
Three-way ANOVA analysis of sampling time, drought, and nitrogen (N) addition treatments effects on N content in different organs.
-
Sampling time Drought treatment Nitrogen treatment Fraxinus mandshurica Pinus koraiensis Leaf N Weighted N Leaf N Weighted N S1:Aug, 2017 CK N0 0.941 (0.195)c 0.206 (0.041)b 0.855 (0.059)a 0.603 (0.04)Ab N1 1.485 (0.158)b 0.578 (0.171)ab 0.706 (0.415)a 0.517 (0.13)Ab N2 2.054 (0.083)a 0.692 (0.191)a 1.253 (0.294)a 0.847 (0.152)Aa Drought N0 1.1 (0.14)c 0.555 (0.025)ab 0.828 (0.279)a 0.462 (0.094)Bb N1 1.023 (0.034)c 0.441 (0.203)ab 1.181 (0.061)a 0.513 (0.023)Bb N2 1.472 (0.083)b 0.41 (0.265)ab 0.705 (0.152)a 0.629 (0.034)Ba S2:Sep, 2017 CK N0 0.931 (0.126)Ac 0.498 (0.156)Ab 0.724 (0.03)Ab 0.591 (0.014) N1 1.403 (0.164)Ab 0.889 (0.22)Ab 1.007 (0.189)Aab 0.627 (0.179) N2 1.853 (0.135)Aa 0.994 (0.232)Aa 1.184 (0.198)Aa 0.813 (0.136) Drought N0 0.699 (0.187)Ac 0.246 (0.043)Ab 0.964 (0.435)Ab 0.531 (0.216) N1 1.072 (0.071)Ab 0.539 (0.138)Ab 1.095 (0.252)Aab 0.714 (0.141) N2 1.852 (0.324)Aa 1.299 (0.442)Aa 1.319 (0.159)Aa 0.733 (0.137) S3:Jan, 2018 CK N0 *No data 0.307 (0.014)Ab 0.613 (0.065)Ab 0.435 (0.06)Bc N1 0.584 (0.217)Aab 1.159 (0.298)Aa 0.765 (0.17)Bb N2 1.176 (0.208)Aa 1.309 (0.179)Aa 0.781 (0.036)Ba Drought N0 0.283 (0.062)Bb 0.968 (0.096)Ab 0.606 (0.019)Ac N1 0.444 (0.223)Bab 1.168 (0.188)Aa 0.707 (0.053)Ab N2 0.53 (0.42)Ba 1.488 (0.169)Aa 0.98 (0.105)Aa S4:Jun, 2018 CK N0 1.474 (0.396)Ab 0.54 (0.081)bc 0.627 (0.025)Ac 0.397 (0.042)Ab N1 1.118 (0.059)Ab 0.502 (0.026)c 0.696 (0.005)Ab 0.48 (0.014)Aa N2 1.701 (0.2)Aa 0.685 (0.128)ab 0.842 (0.02)Aa 0.573 (0.06)Aa Drought N0 0.961 (0.128)Bb 0.45 (0.018)c 0.626 (0.068)Ac 0.395 (0.052)Ab N1 1.069 (0.054)Bb 0.593 (0.031)bc 0.756 (0.044)Ab 0.497 (0.085)Aa N2 1.352 (0.074)Ba 0.827 (0.034)a 0.862 (0.106)Aa 0.583 (0.075)Aa S5:Aug, 2018 CK N0 0.618 (0.122)Ac 0.528 (0.024)Ac 0.661 (0.042)Ab 0.468 (0.072)Ab N1 1.035 (0.131)Ab 0.75 (0.028)Ab 0.963 (0.206)Aab 0.672 (0.133)Aab N2 1.324 (0.131)Aa 0.872 (0.068)Aa 1.039 (0.202)Aa 0.72 (0.097)Aa Drought N0 0.663 (0.096)Ac 0.596 (0.047)Ac 0.826 (0.028)Ab 0.6 (0.053)Ab N1 1.169 (0.105)Ab 0.762 (0.021)Ab 0.979 (0.205)Aab 0.686 (0.133)Aab N2 1.516 (0.244)Aa 0.953 (0.114)Aa 1.229 (0.098)Aa 0.884 (0.125)Aa The upper-case letters represent significant differences in means among drought treatments, while lower-case letters represent significant differences between N treatments, or between all six combinations in case of a D × N interaction exists, tested with Tukey post-hoc test. Table 3.
Leaf and the whole plant weighed (averaged) nitrogen content (Mean and SD, N mg/g).
Figures
(5)
Tables
(3)