-
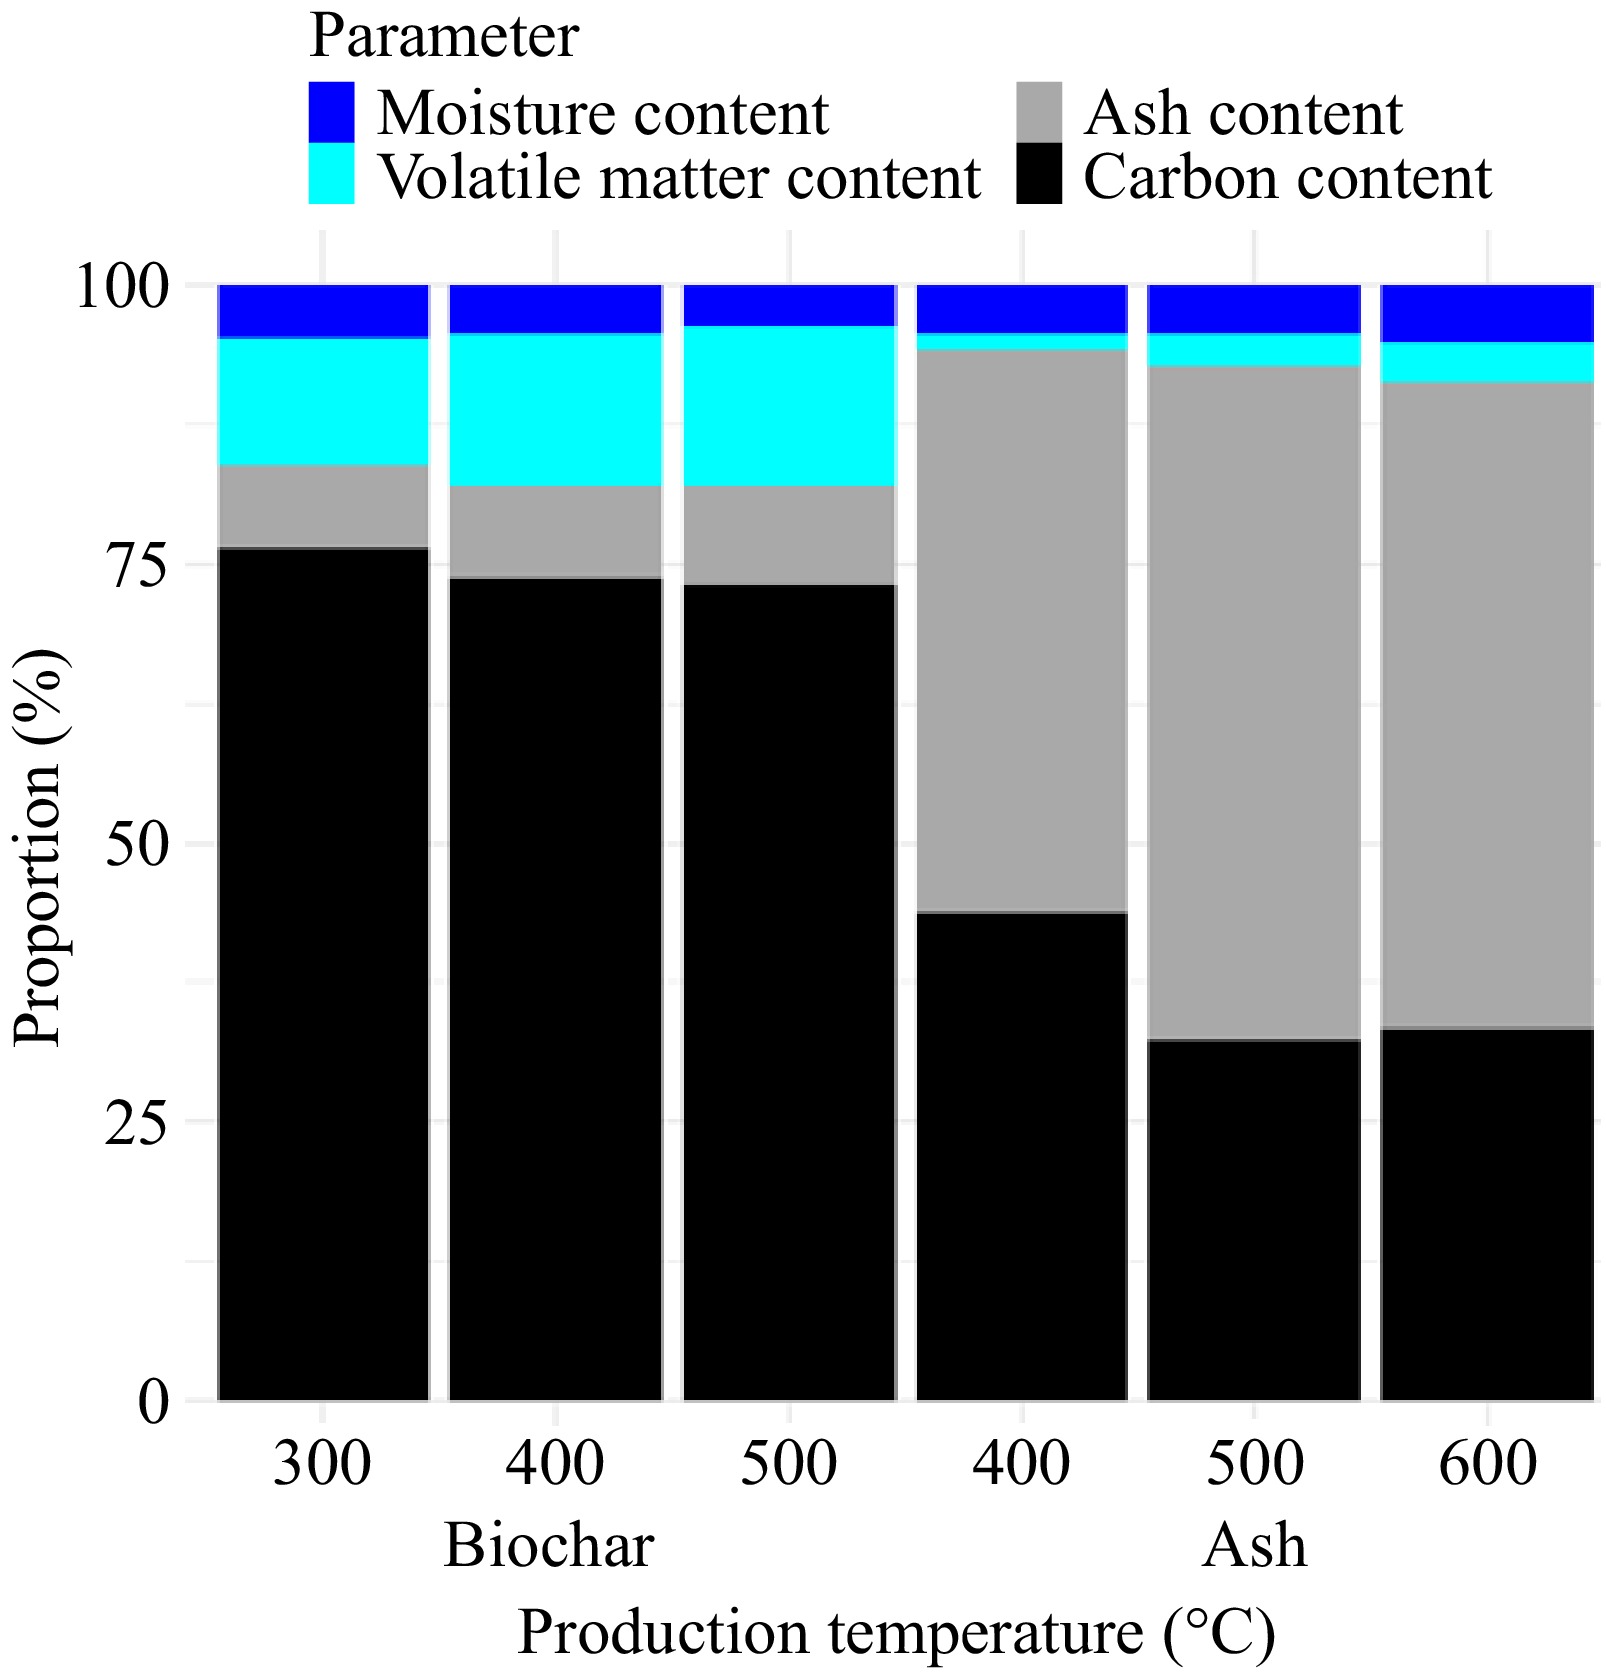
Figure 1.
Proximate analysis of KCHW-biochar and KCHW-ash.
-
Period Volume of king coconut nut export (MT) Value generated from king coconut nut exportation
(LKR. millions)January to September 2022 8,236,427 1,516.58 January to September 2023 9,991,401 2,556.24 Change (%) 21 69 Table 1.
Export performance of king coconut nuts in Sri Lanka[4].
-
Pyrolysis temperature (°C) Total nutrient content (%) Available nutrient content (%) N P K Ca Mg N P K Ca Mg 300 1.99a 0.42 2.41 0.29b 0.37 0.08 0.05 2.37b 0.21 0.03b 400 1.37b 0.46 3.02 0.35b 0.41 0.08 0.16 2.62ab 0.21 0.08b 500 0.58c 0.46 3.33 1.16a 0.41 0.08 0.16 2.93a 0.38 0.24a p-value 0.000 0.560 0.116 0.000 0.688 0.980 0.478 0.047 0.055 0.017 CV 47.55 13.92 19.27 71.42 12.55 25.72 132.38 11.58 40.68 96.38 * In each column, means that do not share a letter differ significantly at p < 0.05. Table 2.
Macronutrient composition of KCHW-biochar at different pyrolysis temperatures.
-
Pyrolysis
temperature
(°C)Total nutrient content Na (%) Fe (%) Cu (ppm) Zn (ppm) Pb (ppm) Ni (ppm) 300 0.69 0.59 20.56 82.47 1.85 14.45 400 0.98 0.21 17.37 92.33 0.49 14.16 500 1.04 0.40 19.66 75.24 0.56 16.51 p-value 0.142 0.078 0.724 0.377 0.154 0.442 CV 25.83 54.96 23.26 16.92 100.63 15.13 Table 3.
Micronutrient composition of KCHW-biochar at different pyrolysis temperatures.
-
Pyrolysis temperature (°C) Total nutrient content (%) Available nutrient content (%) N P K Ca Mg N P K Ca Mg 400 2.27a 1.58b 11.79b 2.29 1.30b 0.07 0.82b 8.01 1.13b 0.45 500 1.15b 2.36a 16.16a 3.11 1.78a 0.05 1.35ab 12.40 1.87a 0.41 600 0.77b 2.47a 15.49ab 2.19 1.71a 0.04 2.27a 10.60 1.46ab 0.15 p-value 0.000 0.003 0.027 0.229 0.016 0.381 0.042 0.154 0.010 0.150 CV 49.68 21.20 16.84 27.68 16.30 42.58 53.19 27.15 24.45 62.62 * In each column, means that do not share a letter differ significantly at p < 0.05. Table 4.
Macro-nutrient composition of KCHW-ash at different pyrolysis temperatures.
-
Pyrolysis
temperature
(°C)Total nutrient content Na (%) Fe (%) Cu (ppm) Zn (ppm) Pb (ppm) Ni (ppm) 400 4.13 0.68 63.34b 197.91b 0.75 10.65b 500 5.79 0.88 88.31a 333.09a 2.29 17.47ab 600 5.39 1.57 88.79a 320.32a 1.36 21.74a p-value 0.082 0.132 0.024 0.008 0.157 0.048 CV 19.53 55.58 18.66 25.52 67.27 36.52 * In each column, means that do not share a letter differ significantly at p < 0.05. Table 5.
Micronutrient composition of KCHW-ash at different pyrolysis temperatures.
Figures
(1)
Tables
(5)