-
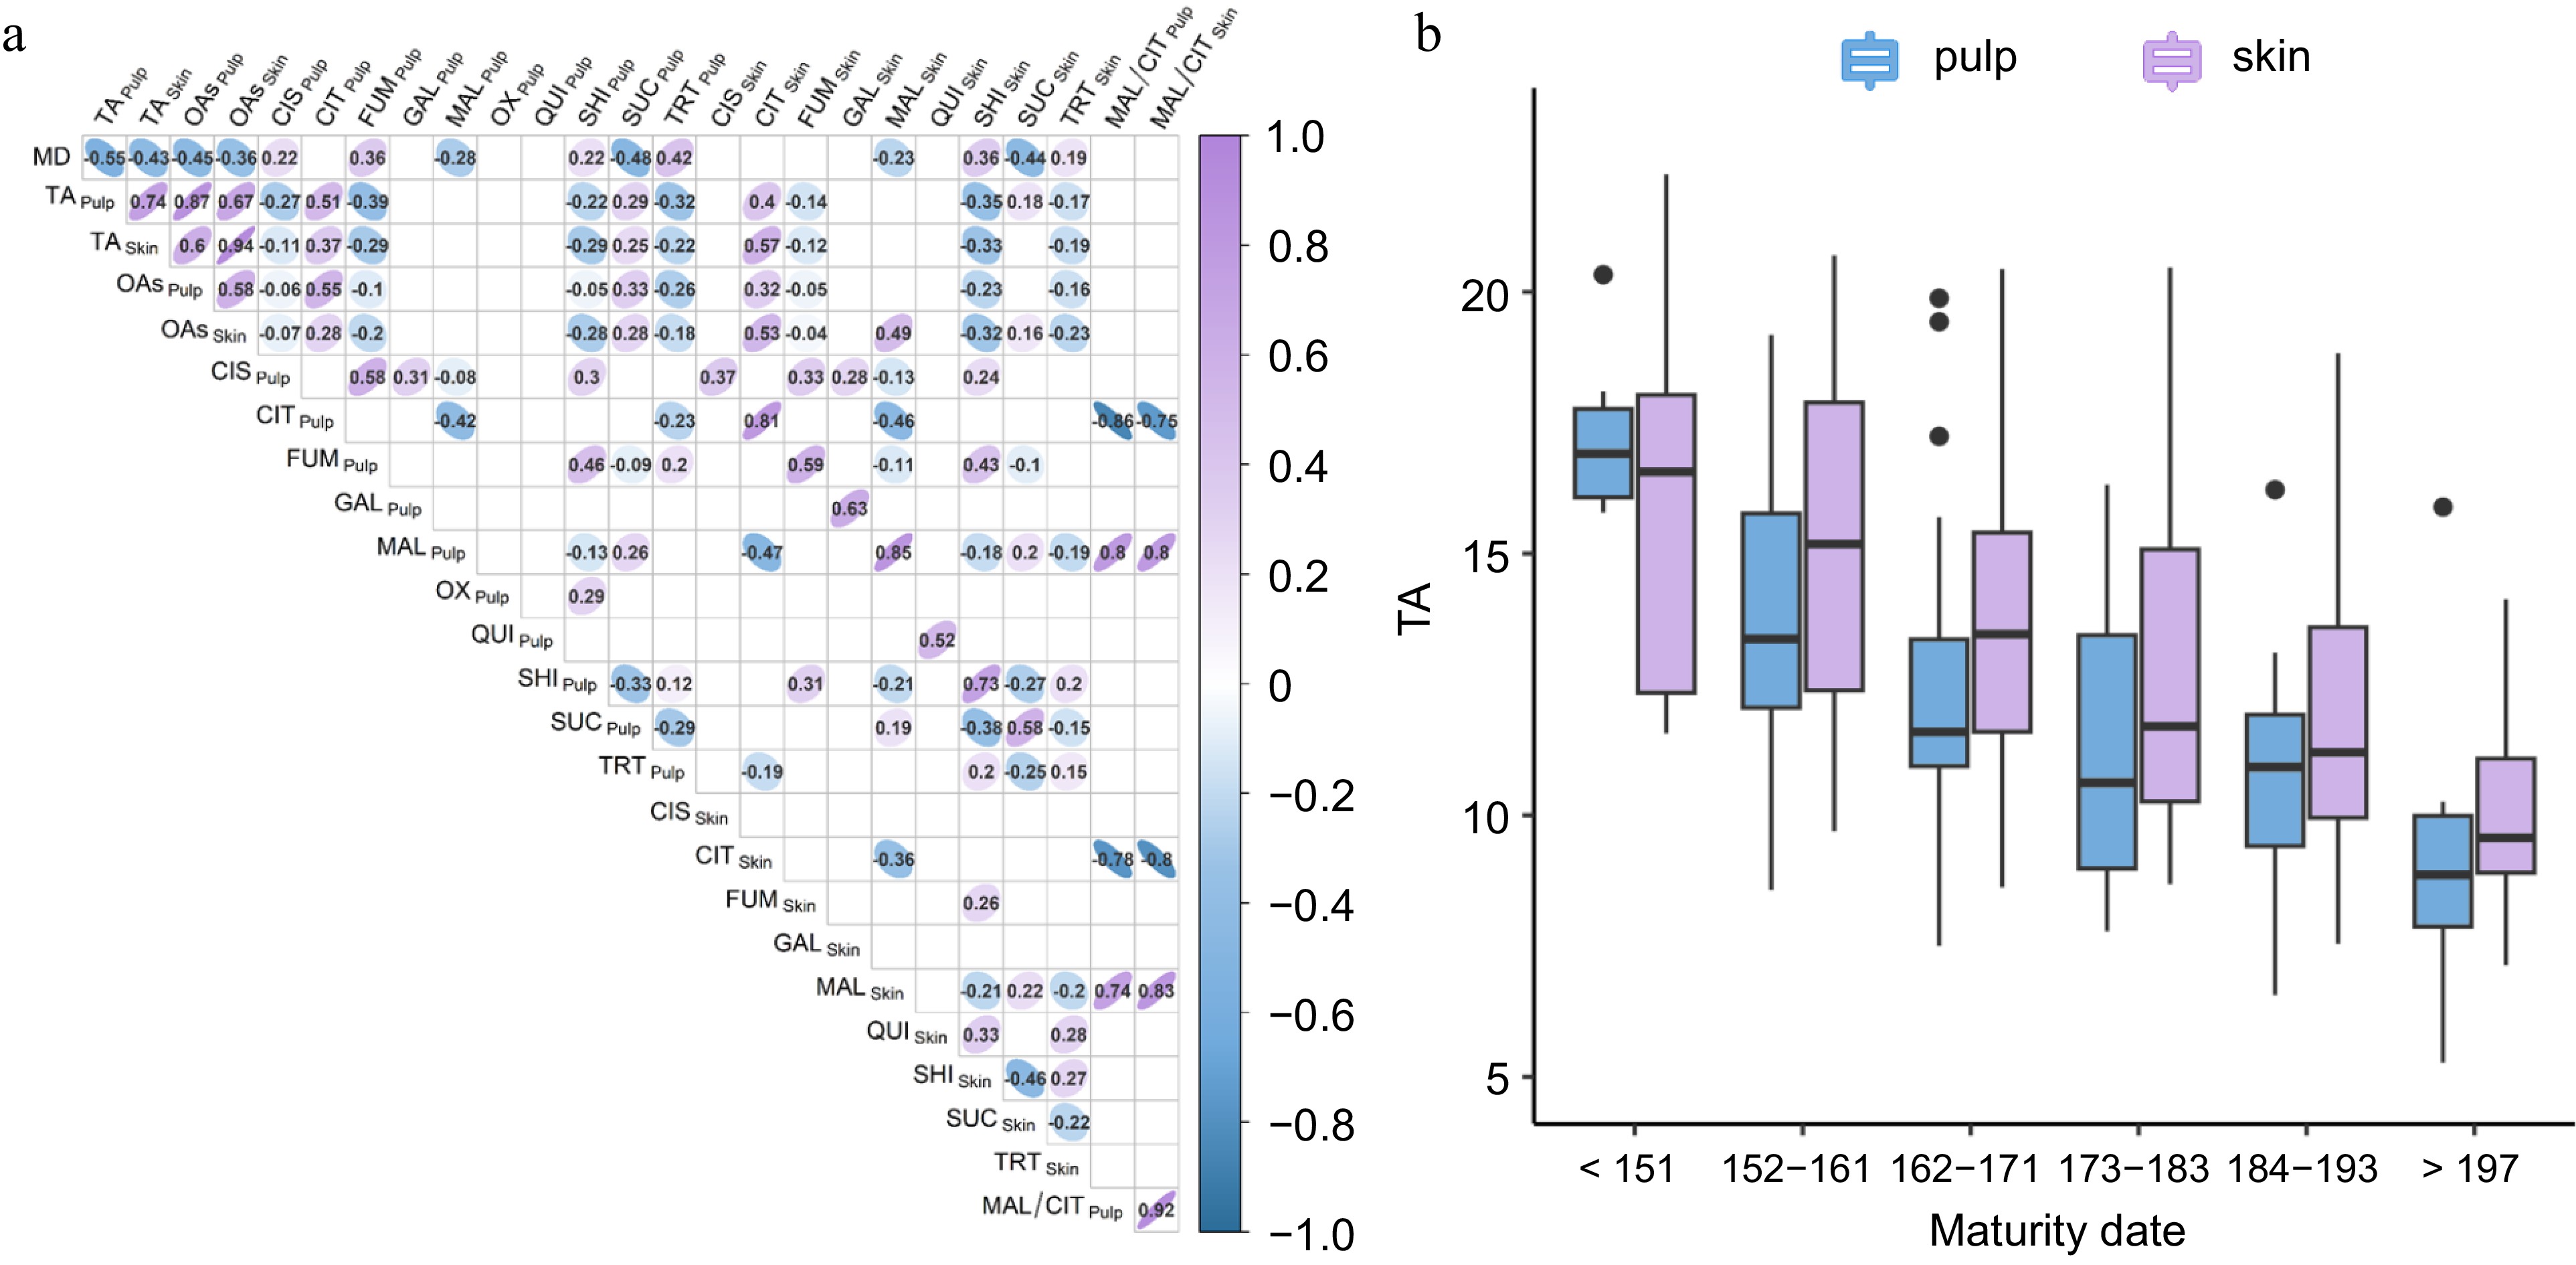
Figure 1.
(a) Spearman's correlation coefficient between TA and organics acids contents in pulp and skin in the analysed apricot set; (b) Variation of TA content in fruit pulp (light blue) and skin (violet) across 10-d harvest windows. Abbreviations: MD, maturity date; TA, titratable acidity; OAs, total content of the ten organic acids; CIS, cis-aconitate; CIT, citrate; FUM, fumarate; GAL, galacturonate; MAL, malate; OX, oxalate; QUI, quinate; SHK, shikimate; SUC, succinate; TRT, tartrate.
-
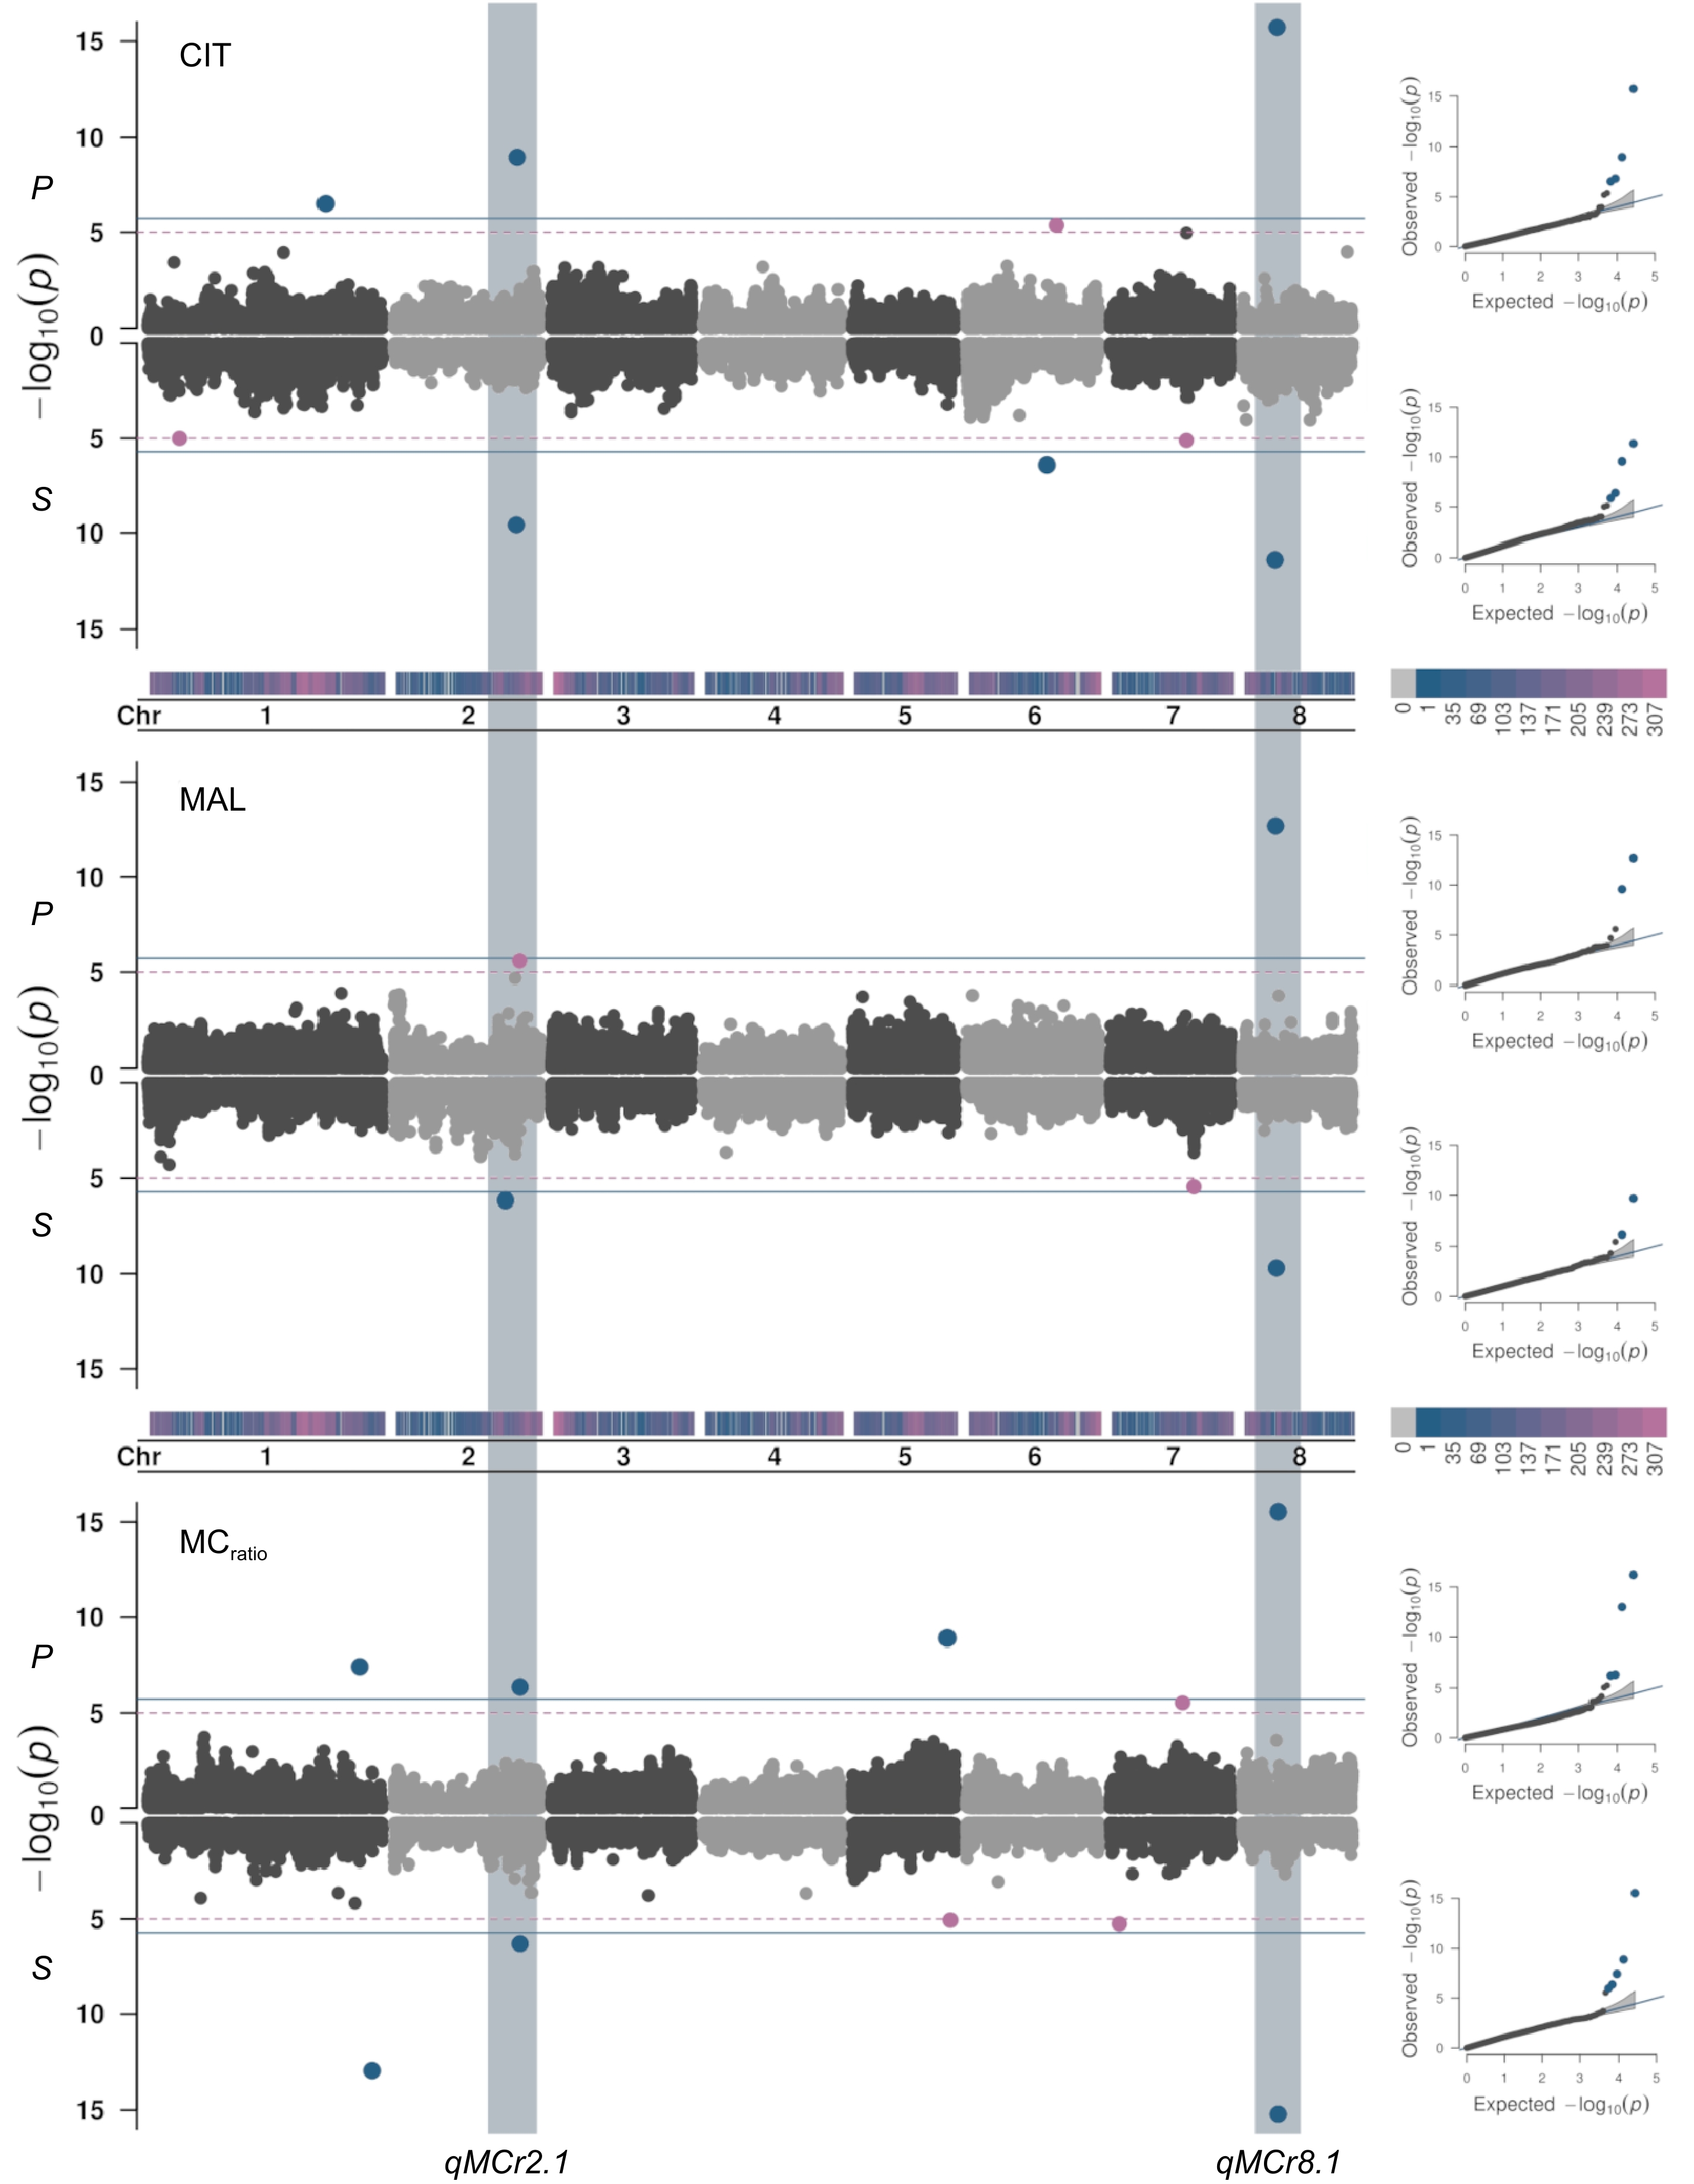
Figure 2.
Manhattan and QQ-plots (right panel) estimated from BLUPs of citrate (CIT, mg·mL−1), malate (MAL, mg·mL−1) and malate/citrate ratio (MCratio) in fruit pulp (P) and skin (S) combining Blink, FarmCPU, and MLMM models (see Table 1 for signals common or specifics of each model) adjusted for population structure (Q = 2) in the apricot panel of 131 accessions. The continuous horizontal line indicates the Bonferroni's adjusted-threshold for a type one error rate of 0.05 based on the effective number of independent tests (1.86E-06), while dashed line corresponds to the permutation test (1.14E-05). Main associated loci were identified on chr 2 (qMCr2.1) and chr 8 (qMCr8.1), hosting a cluster of multi-trait signals controlling CIT and MAL content, and MCratio in both pulp and skin.
-

Figure 3.
Boxplots of the marker-trait association of significant SNPs at qMCr2.1 (SNP42515, SNP41746, and SNP43076 on chr 2) and at qMCr8.1 (SNP46961 on chr 8) loci with the content of citrate (CIT, mg·mL−1) and malate (MAL, mg·mL−1), and malate/citrate ratio (MCratio) using seasonal and BLUP data in the germplasm panel. Letters and asterisks indicate significant differences between classes (p < 0.01) as inferred by one-way ANOVA (CIT and MAL) or Kruskal-Wallis rank-sum test (MCratio).
-
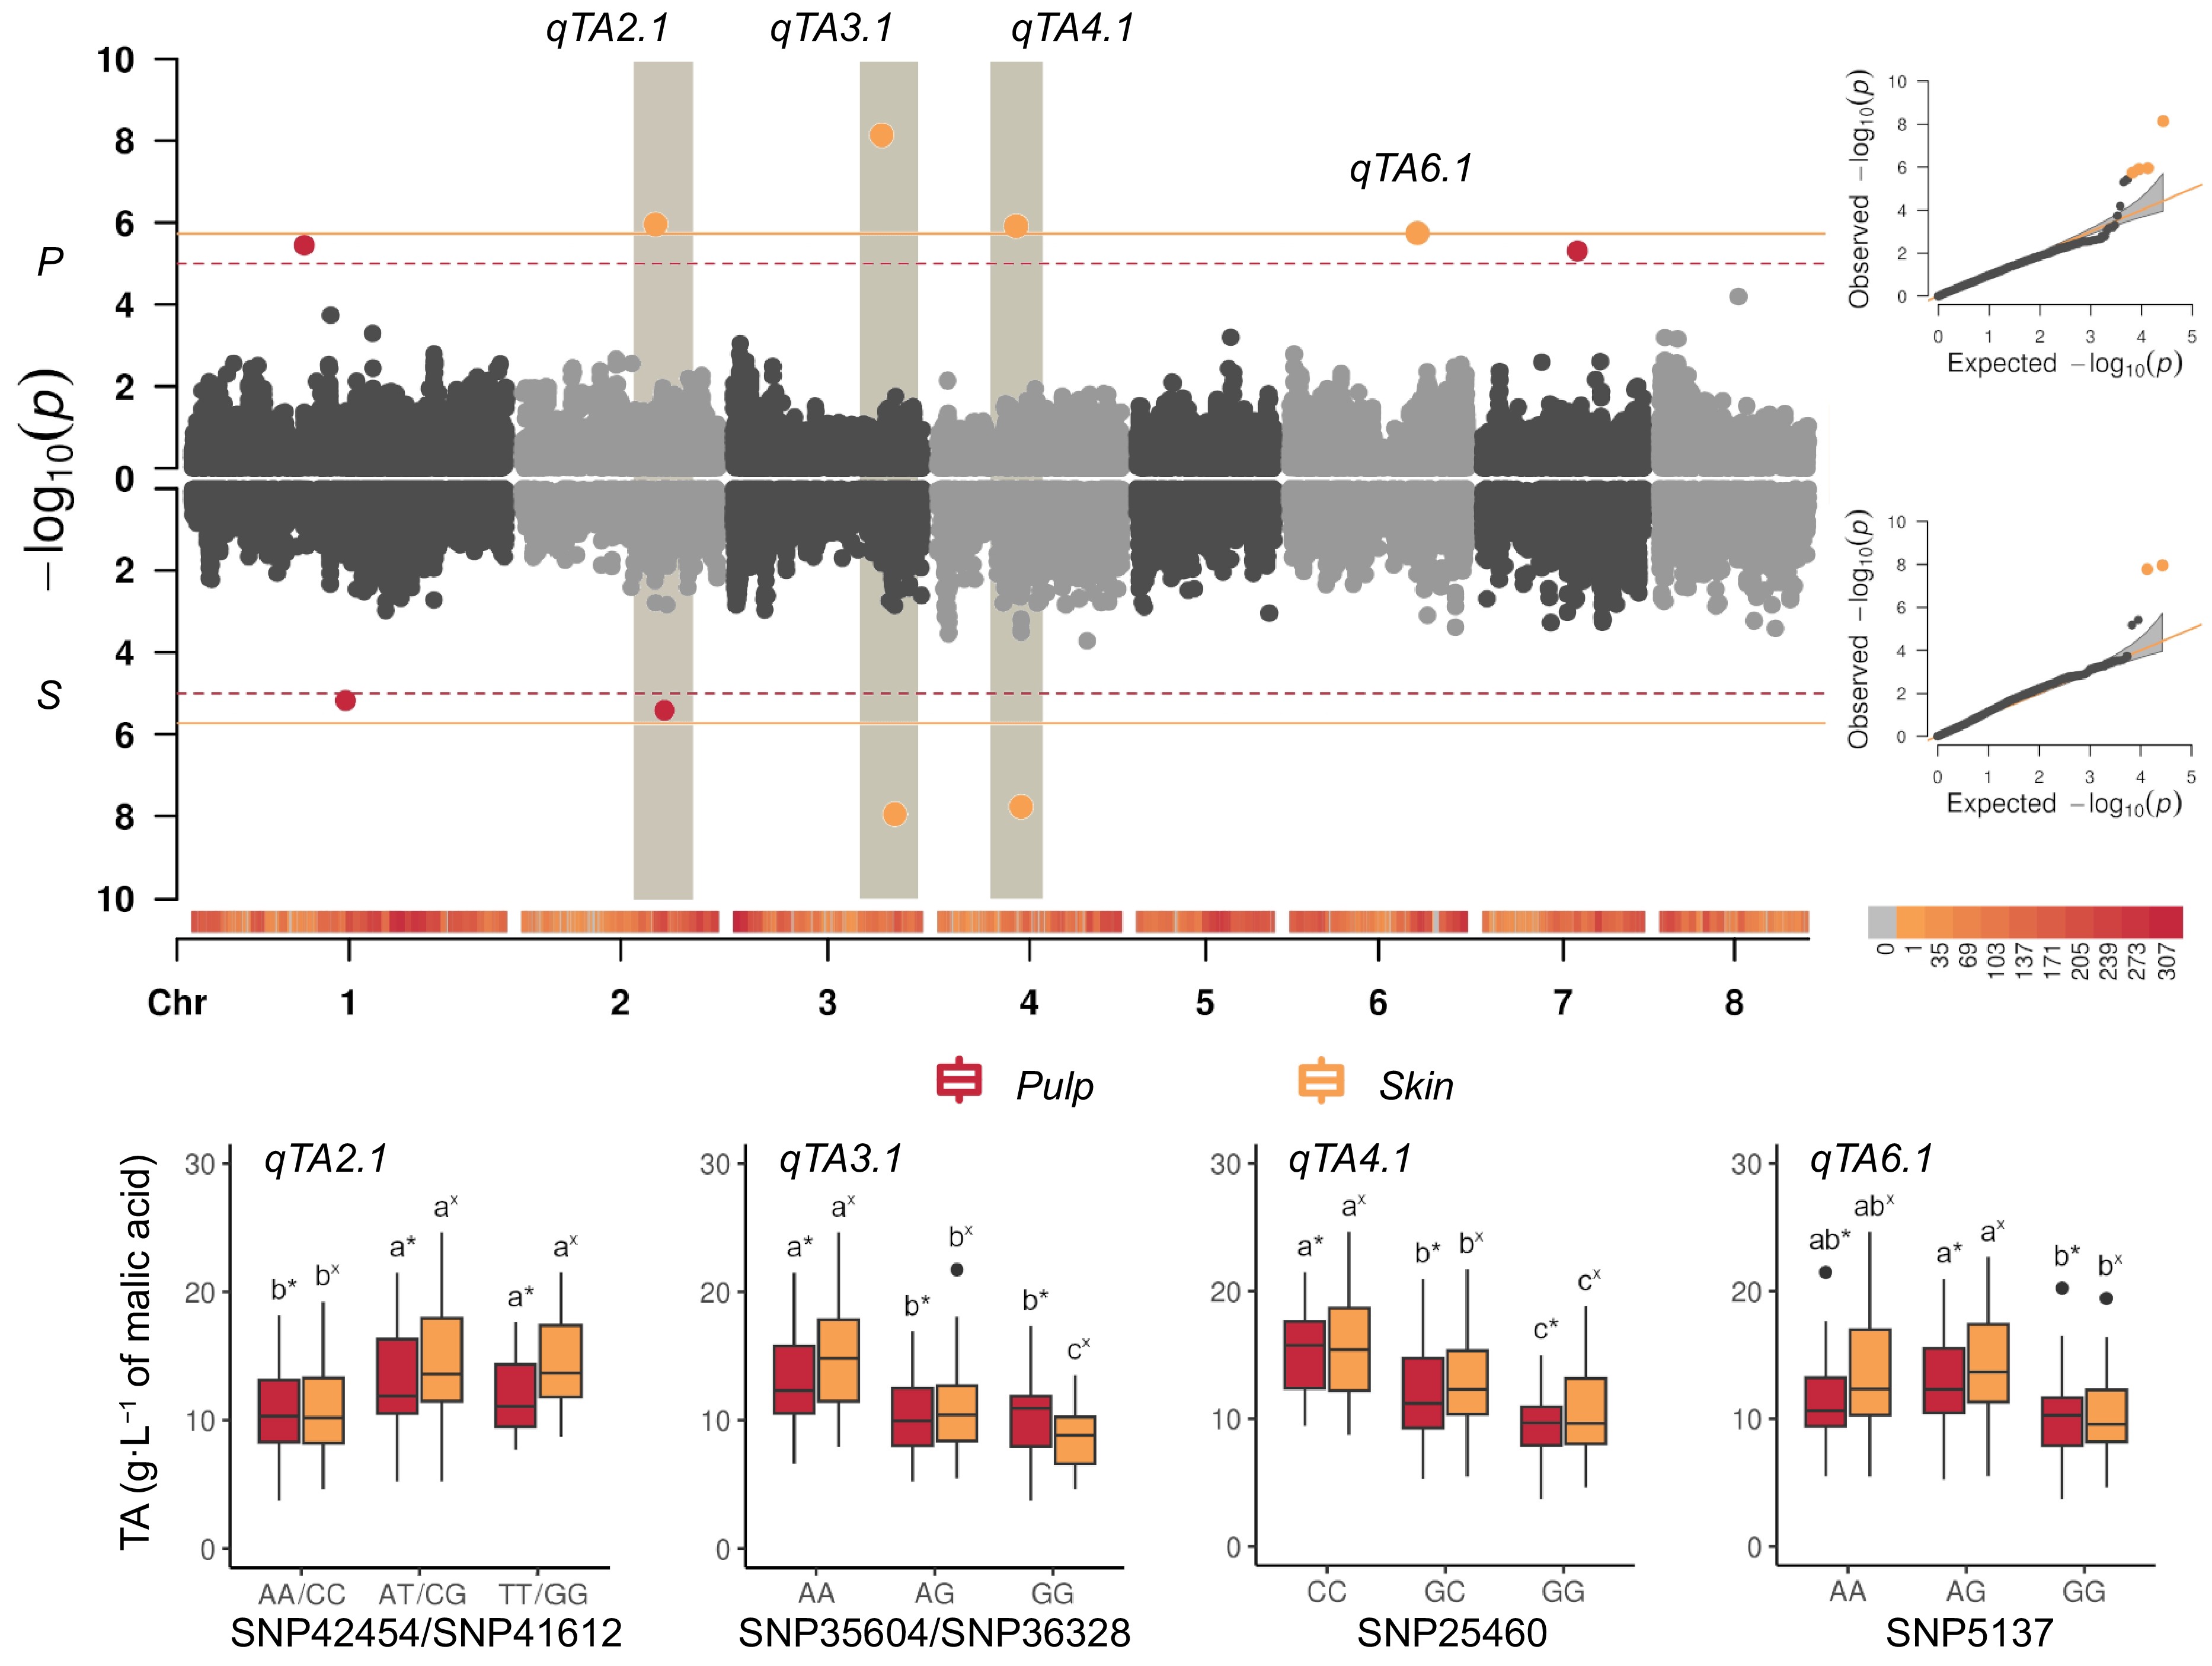
Figure 4.
(a) Manhattan and QQ-plots (right panel) estimated from BLUPs of titratable acidity (TA, in g·L−1 of malic acid) in fruit pulp (P), and skin (S), combining Blink, FarmCPU, and MLMM models (see Table 1 for signals common or specifics of each model) adjusted for population structure (Q = 2) in the apricot panel of 131 accessions. The continuous horizontal line indicates the Bonferroni's adjusted-threshold for a type one error rate of 0.05 based on the effective number of independent tests (1.86E-06), while dashed line corresponds to the permutation test (1.11E-05). Main signals were detected on: chr 3 (qTA3.1), peaking at SNP35941 (~18.9 Mbp) and SNP36328 (~21.6 Mbp) in pulp and skin, respectively; on chr 4 (qTA4.1) peaking at SNP25460 (~10.7 Mbp) and SNP25558 (~11.4 Mbp); on chr 2 (qTA2.1) peaking at SNP40835 (~18.1 Mbp) and SNP41430 (~19.2 Mbp, close to qMCr2.1 locus); on chr 6 (qTA6.1) peaking at SNP5234 (~17.4 Mbp) only in pulp tissue. (b) Boxplots of the marker-trait association of SNPs explaining highest PEV for titratable acidity (TA, expressed as g·L−1) identified in the LD region around qTA2.1 (SNP425454 and SNP41612, respectively in pulp and skin), qTA3.1 (SNP35604 and SNP36328), qTA4.1 (SNP25460) and qTA6.1 (SNP5137) in the germplasm panel. Letters and asterisks indicate significant differences between classes (p < 0.01) as inferred by one-way ANOVA.
-

Figure 5.
QTL mapping of citrate (CIT, in mg·mL−1), malate (MAL, in mg·mL−1), malate/citrate balance (MCratio), and titratable acidity (TA, in g·L−1 of malic acid) in 'Goldrich' × 'Moniqui' (G × M) and 'Lito' × 'BO81604311' (L × B) segregating progenies. Linkage mapping and LOD profiles confirmed the presence of two major loci regulating CIT, MAL, MCratio, and TA on LG2 in 'G × M' (left) and on LG8 in the L × B (right) integrated maps. Markers names are shown in Supplementary File 1.
-
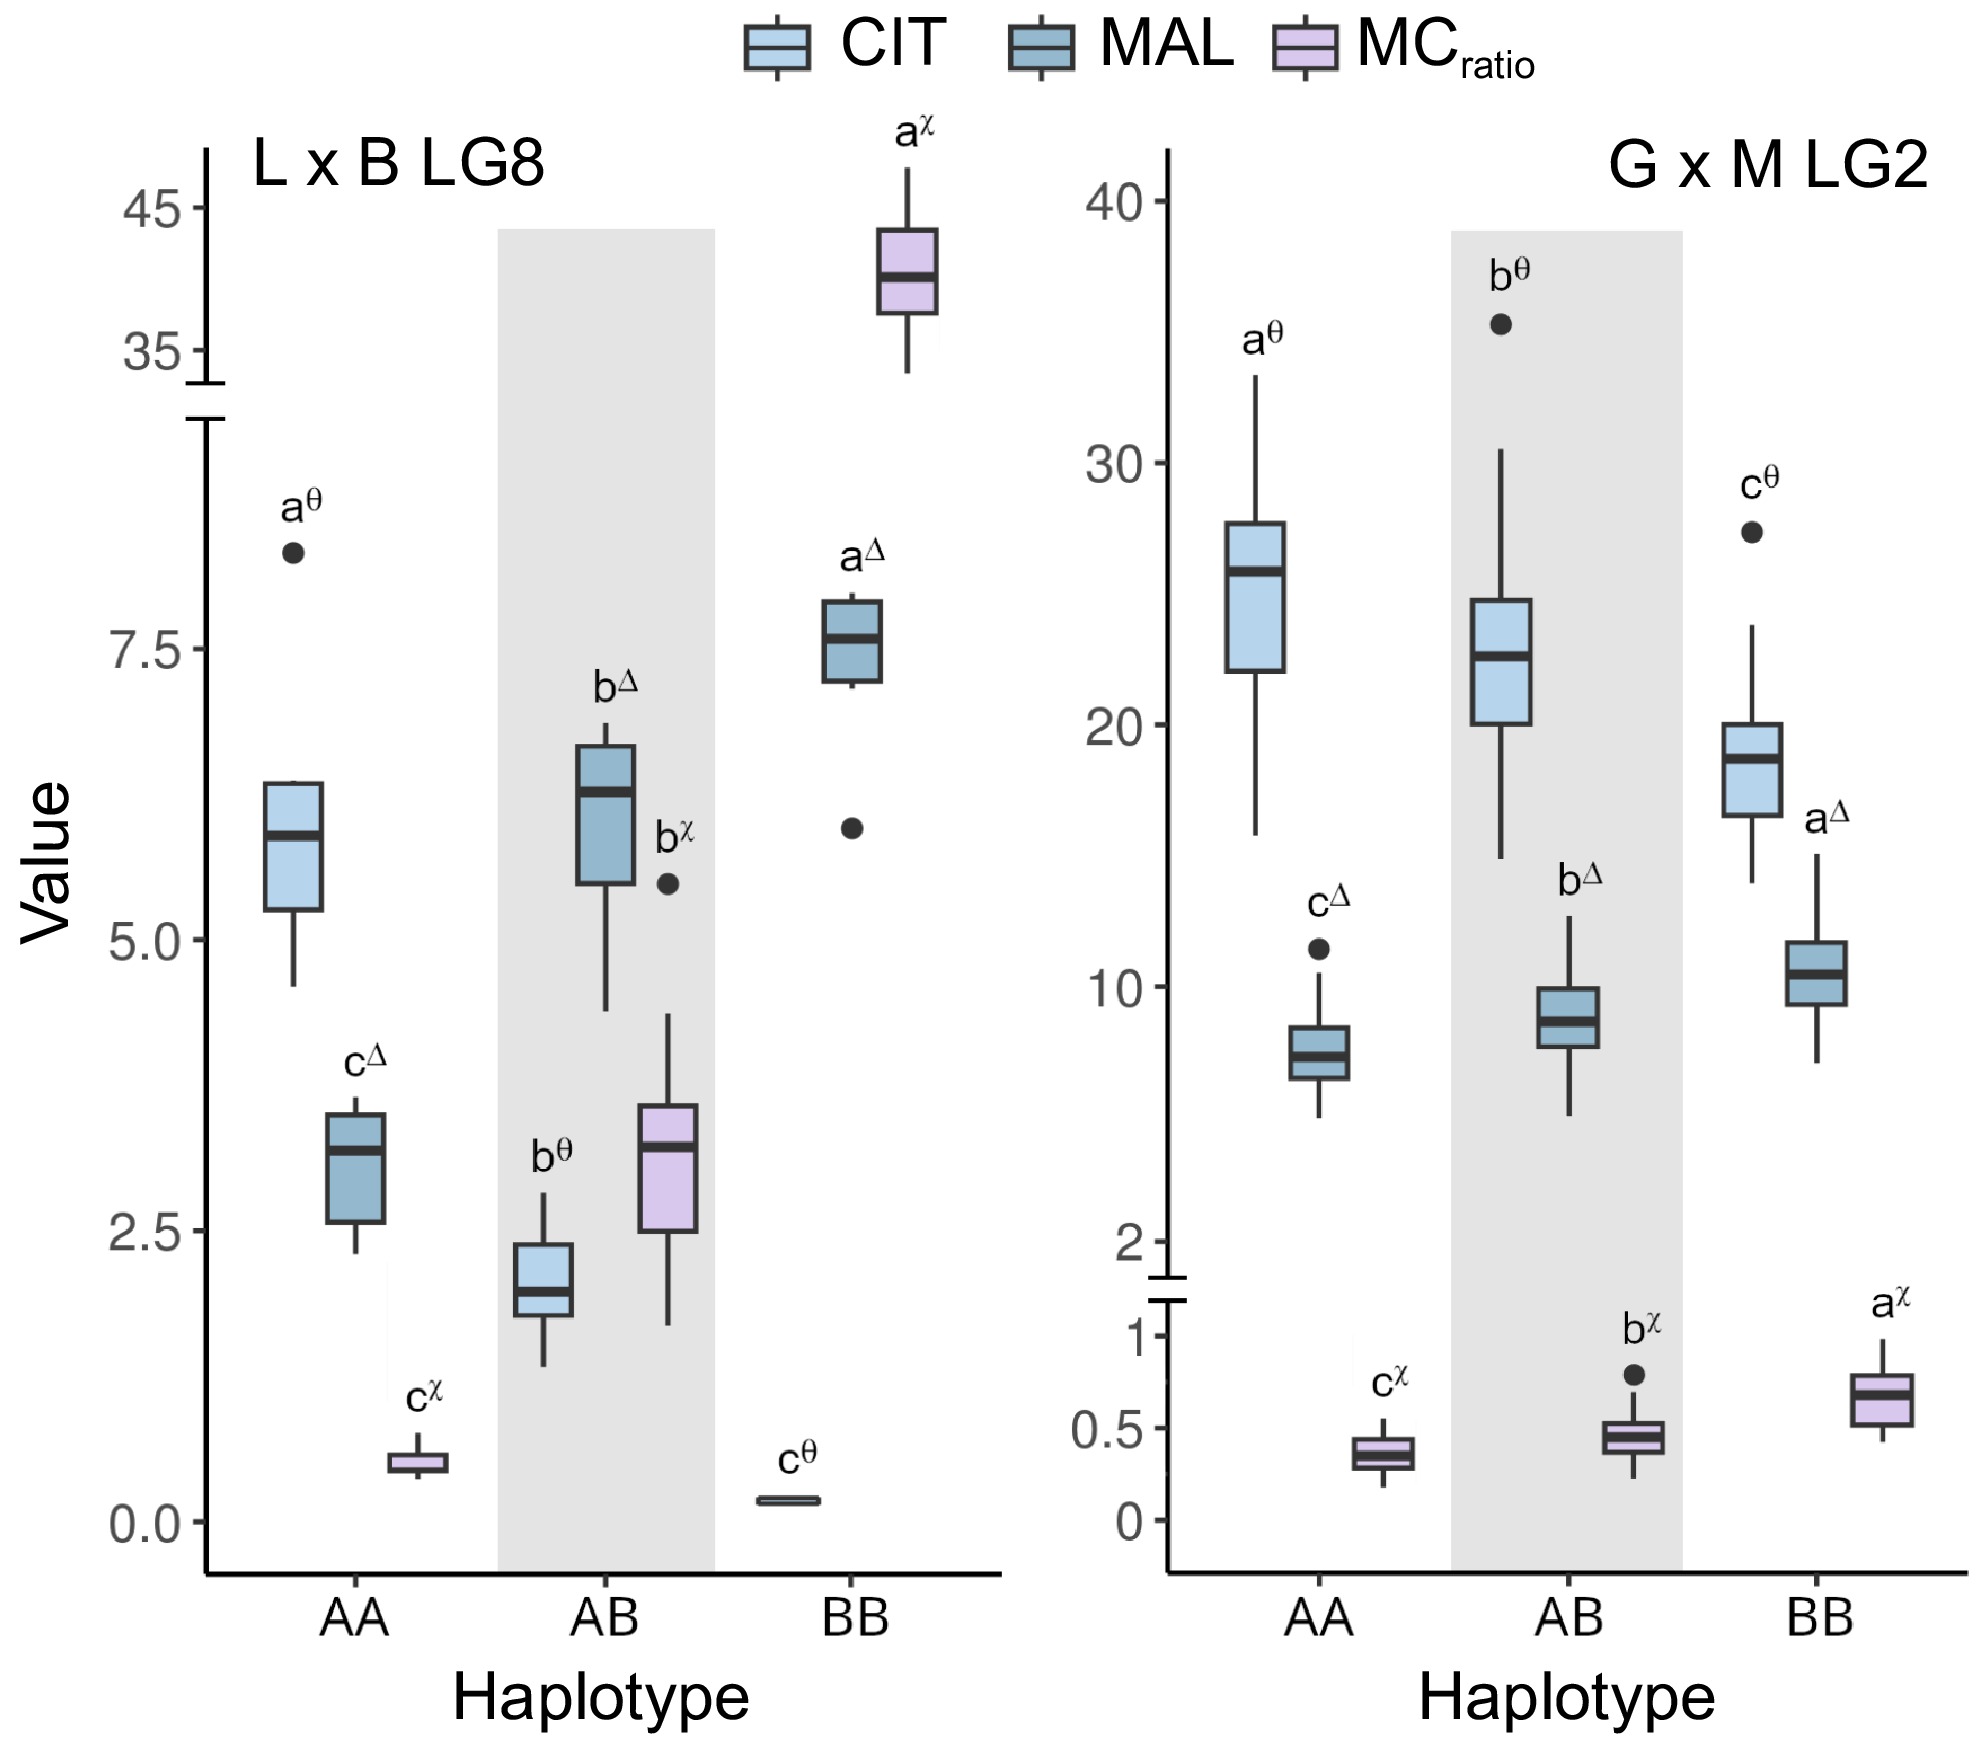
Figure 6.
Boxplots of the associations between haplotypes at qMCr8.1 (LG8) and qMCr2.1 loci (LG2) with citrate (CIT, in mg·mL−1), malate (MAL, in mg·mL−1), and malate/citrate ratio (MCratio). Haplotypes at qMCr8.1 were defined by the fine-mapped interval between markers SNP46688 and SNP47104 in 'Lito' × 'BO81604311' (haplotype A and B, respectively) (right) while haplotypes at qMCr2.1 were delimited by markers Pp02:22857329_T/G and Pp02:26399548_T/A in 'Goldrich' × 'Moniqui' (haplotype A and B, respectively) (left). Letters and asterisks indicate significant differences between classes (p < 0.01) as inferred by one-way ANOVA and SNK test for multiple comparisons. Haplotypes intervals and markers are shown in Supplementary File 1.
-
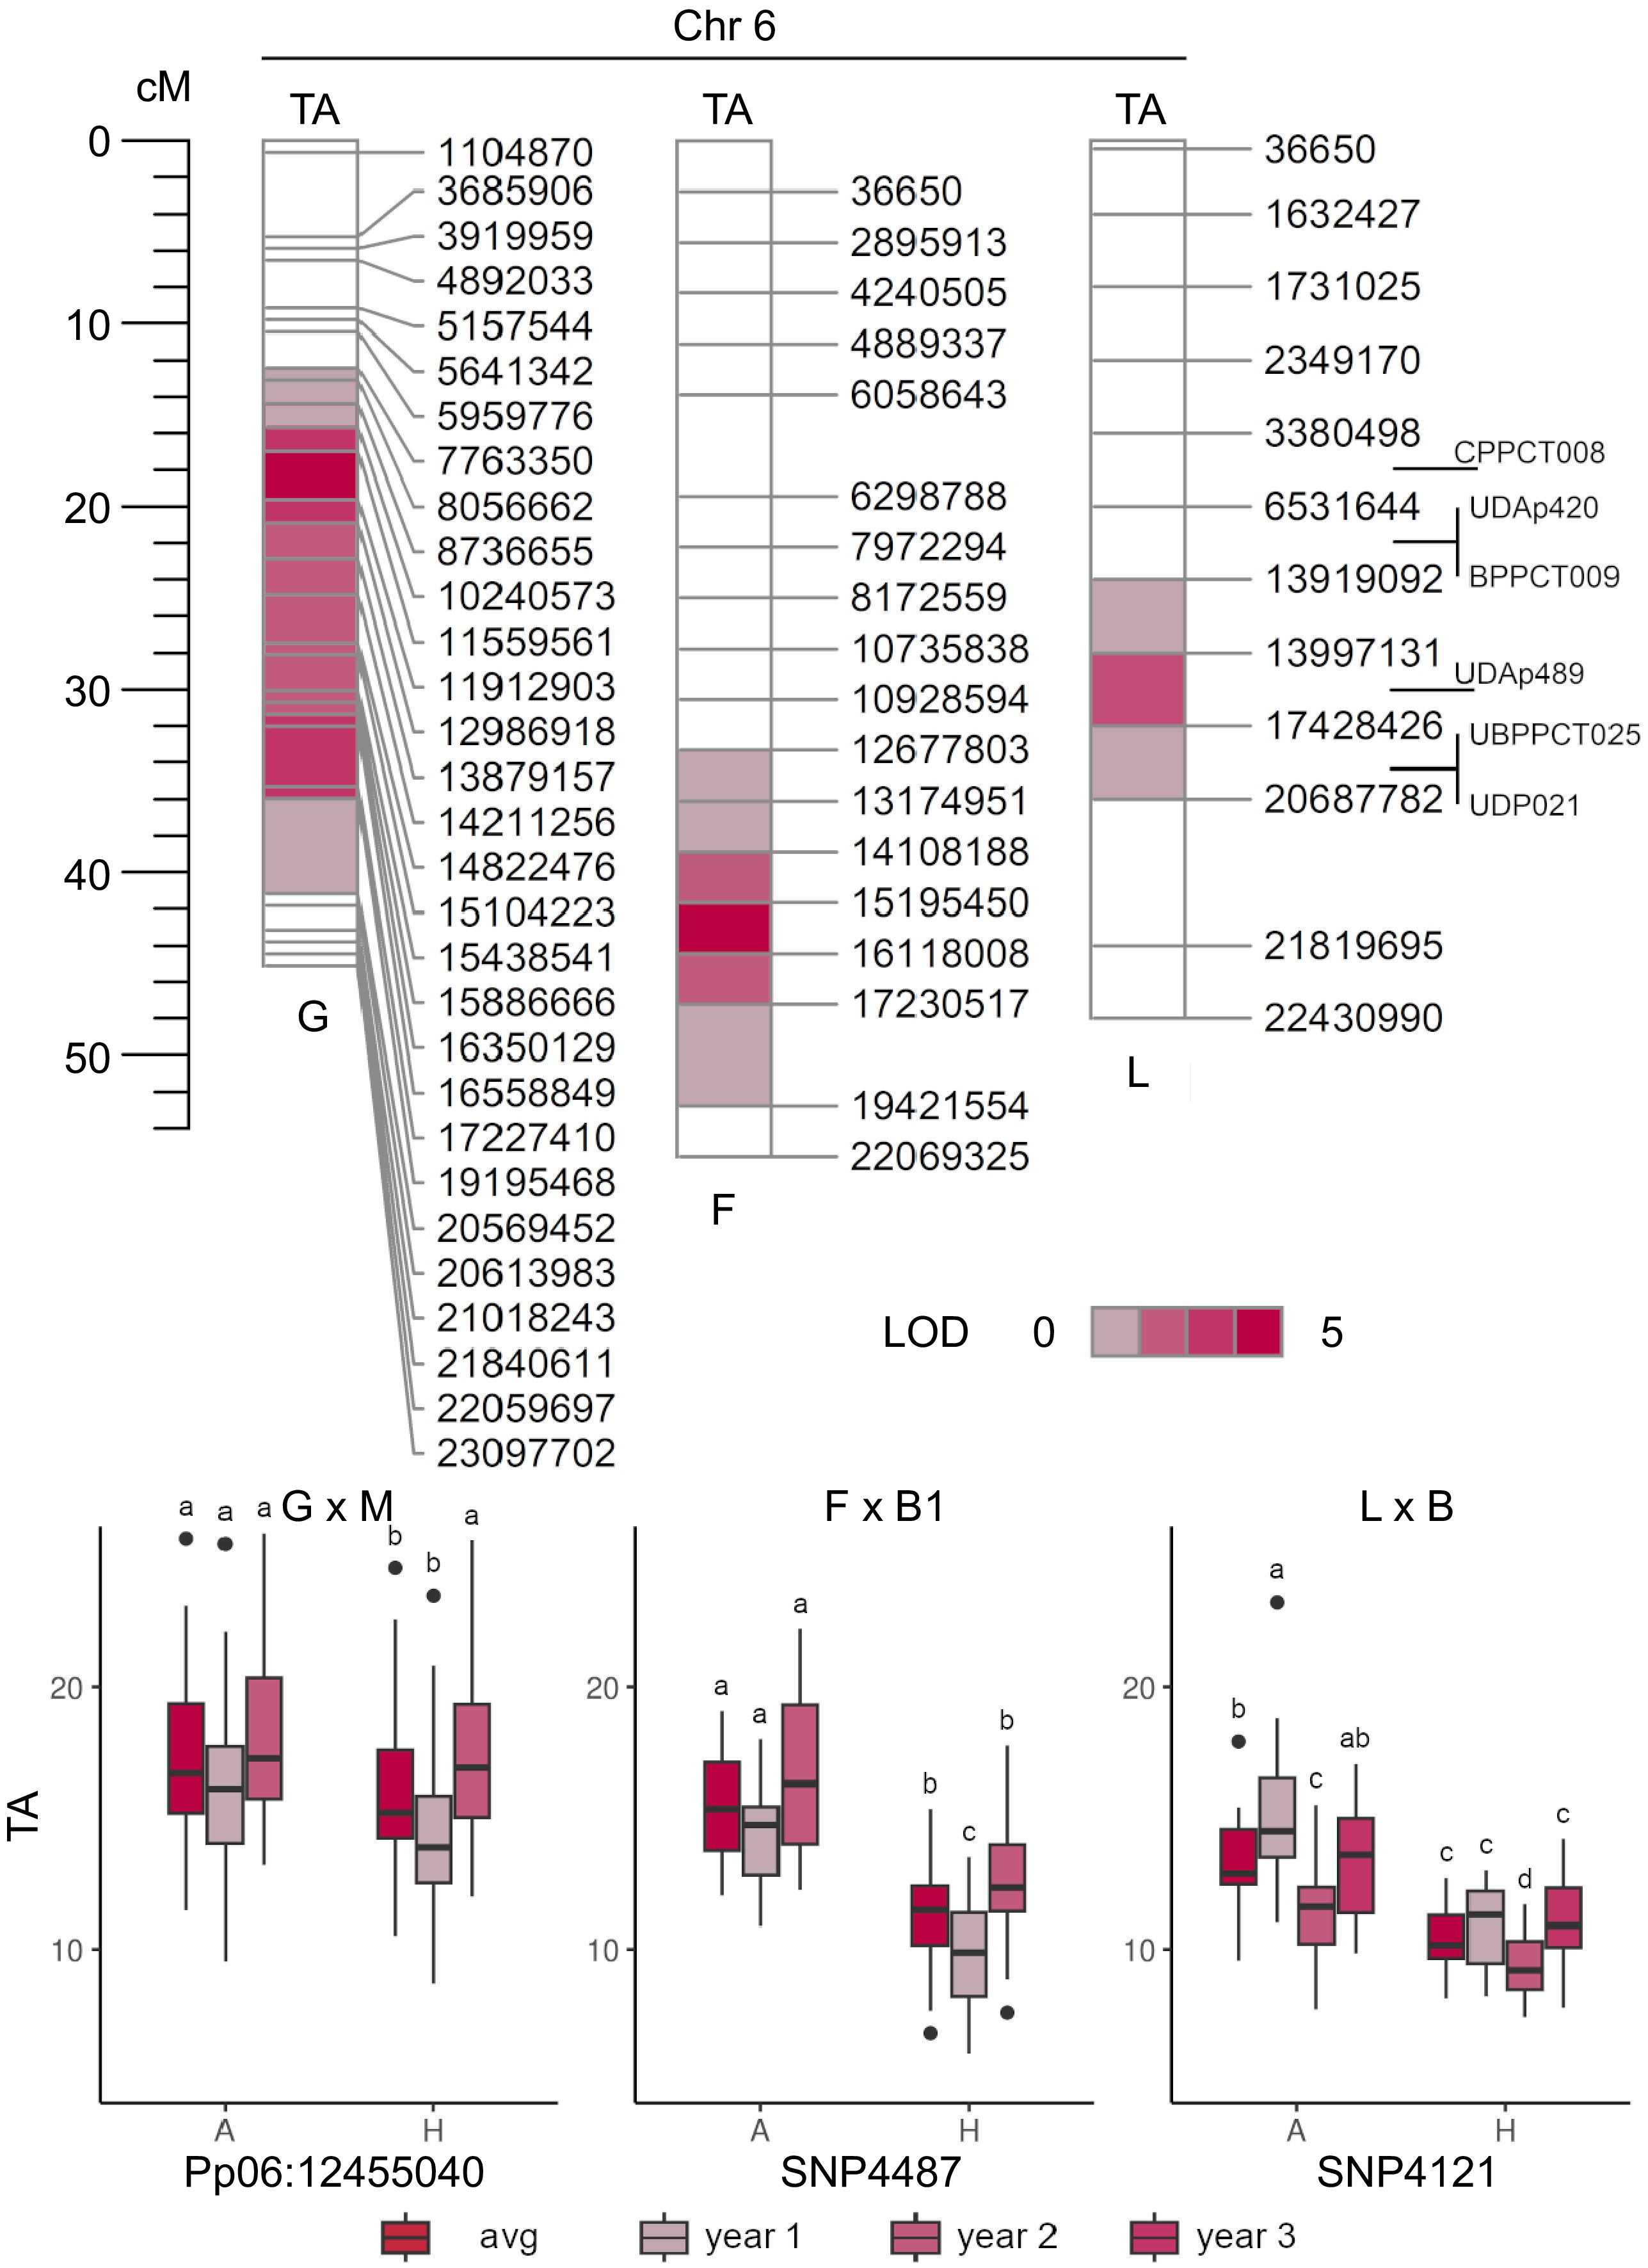
Figure 7.
QTL mapping of titratable acidity (TA, in g·L−1 of malic acid) in 'Goldrich' × 'Moniqui' (G × M), 'Fiamma' × 'BO93623033' (F × B2) and 'Lito' × 'BO81604311' (L × B) segregating progenies showing the presence of minor loci on LG6 (top). Boxplots of the marker-trait associations of LOD-peaks Pp06:12455040 (~11.6 Mbp), SNP4487 (~15.2 Mbp) and SNP4121 (~13.9 Mbp) and TA content in 'Goldrich', 'Fiamma' and 'Lito' parents, respectively (bottom).
-
SNP Chr* Position (bp)* p-value Trait Fruit tissue Best model SNP12585 1 15,342,498 3.56E-06 TA Pulp FarmCPU SNP14038 1 20,961,590 6.62E-06 TA Skin FarmCPU, MLMM SNP22411 1 38,691,257 1.30E-06 CIT Skin Blink SNP23067 1 40,962,943 1.02E-13, 3.70E-08 MCratio Pulp, skin Blink SNP37816 2 482,379 1.79E-09 GAL Skin Blink SNP38501 2 4,306,256 1.58E-07 QUI Skin Blink SNP39168 2 11,017,000 9.01E-16 OX Pulp FarmCPU SNP39549 2 13,211,197 1.10E-08 QUI Skin Blink SNP40618 2 17,447,353 3.38E-10 FUM Skin Blink SNP40835 2 18,090,890 1.10E-06 TA Pulp FarmCPU SNP41430 2 19,296,508 3.82E-06 TA Skin FarmCPU SNP41753 2 20,477,404 6.85E-07 MAL Skin MLMM SNP42290 2 22,156,402 3.71E-07 MCratio Pulp, skin Blink SNP42444 2 22,474,569 2.70E-10 CIT Skin Blink SNP42515 2 22,628,715 1.14E-09 CIT Pulp Blink SNP42730 2 23,081,253 2.53E-06 MAL Pulp MLMM SNP35941 3 20,241,635 7.30E-09 TA Pulp FarmCPU SNP36441 3 22,026,005 1.11E-08 TA Skin Blink SNP25460 4 10,712,890 1.22E-06 TA Pulp FarmCPU SNP25558 4 11,398,395 1.69E-08 TA Skin Blink SNP29553 4 23,963,190 1.60E-10 OX Pulp FarmCPU SNP53375 5 10,674,138 4.40E-07 GAL Skin Blink SNP54563 5 13,222,476 1.87E-15 QUI Pulp MLMM SNP54563 5 13,222,476 8.95E-27, 1.76E-28 SHK Skin, pulp MLMM, Blink SNP54585 5 13,270,051 2.68E-10, 8.17E-23 QUI, SHK Pulp, skin MLMM SNP55378 5 15,163,890 8.34E-07 OX Pulp FarmCPU SNP56541 5 17,961,164 8.67E-06 MCratio Pulp Blink SNP56292 5 17,426,390 1.25E-09 MCratio Skin Blink SNP4310 6 14,694,019 3.82E-07 CIT Skin FarmCPU SNP4771 6 16,436,115 4.24E-06 CIT Pulp FarmCPU SNP4919 6 16,755,770 6.01E-07, 1.01E-06 MCratio Pulp, skin Blink SNP5129 6 17,093,858 1.15E-08 TRT Skin Blink SNP5234 6 17,428,425 1.81E-06 TA Pulp FarmCPU SNP58520 7 10,229,477 6.83E-08 GAL Skin Blink SNP58781 7 11,025,623 2.68E-10 QUI Pulp FarmCPU SNP59439 7 12,955,009 4.95E-06 TA Pulp Blink SNP59231 7 12,551,007 3.23E-11 SHK Pulp FarmCPU SNP59495 7 13,089,613 2.89E-09 MCratio Skin Blink SNP59575 7 13,367,263 8.17E-23 SHK Skin FarmCPU SNP59768 7 13,778,391 6.42E-06 CIT Pulp FarmCPU SNP59786 7 13,795,723 7.56E-06 CIT Skin Blink SNP60128 7 15,175,420 3.47E-06 MAL Skin MLMM SNP46027 8 3,461,859 1.62E-13 OX Skin FarmCPU SNP46814 8 5,943,907 4.47E-12 CIT Skin FarmCPU, Blink, MLMM SNP46877 8 6,044,576 2.03E-13 MAL Pulp FarmCPU, Blink, MLMM SNP46906 8 6,193,099 2.09E-10 MAL Skin FarmCPU, Blink, MLMM SNP46961 8 6,316,393 2.93E-16, 8.00E-14 MCratio Pulp FarmCPU, Blink, MLMM SNP47073 8 6,524,584 1.90E-16 CIT Skin, pulp FarmCPU, Blink, MLMM *Genome coordinates referred to the apricot genome reference assembly of 'Chuanzhihong' cultivar genome[61] recalibrated based on the linkage group of Prunus reference map[91]. Table 1.
Summary of SNPs associated to BLUP of fruit acidity-related traits in the apricot accessions panel.
Figures
(7)
Tables
(1)