-
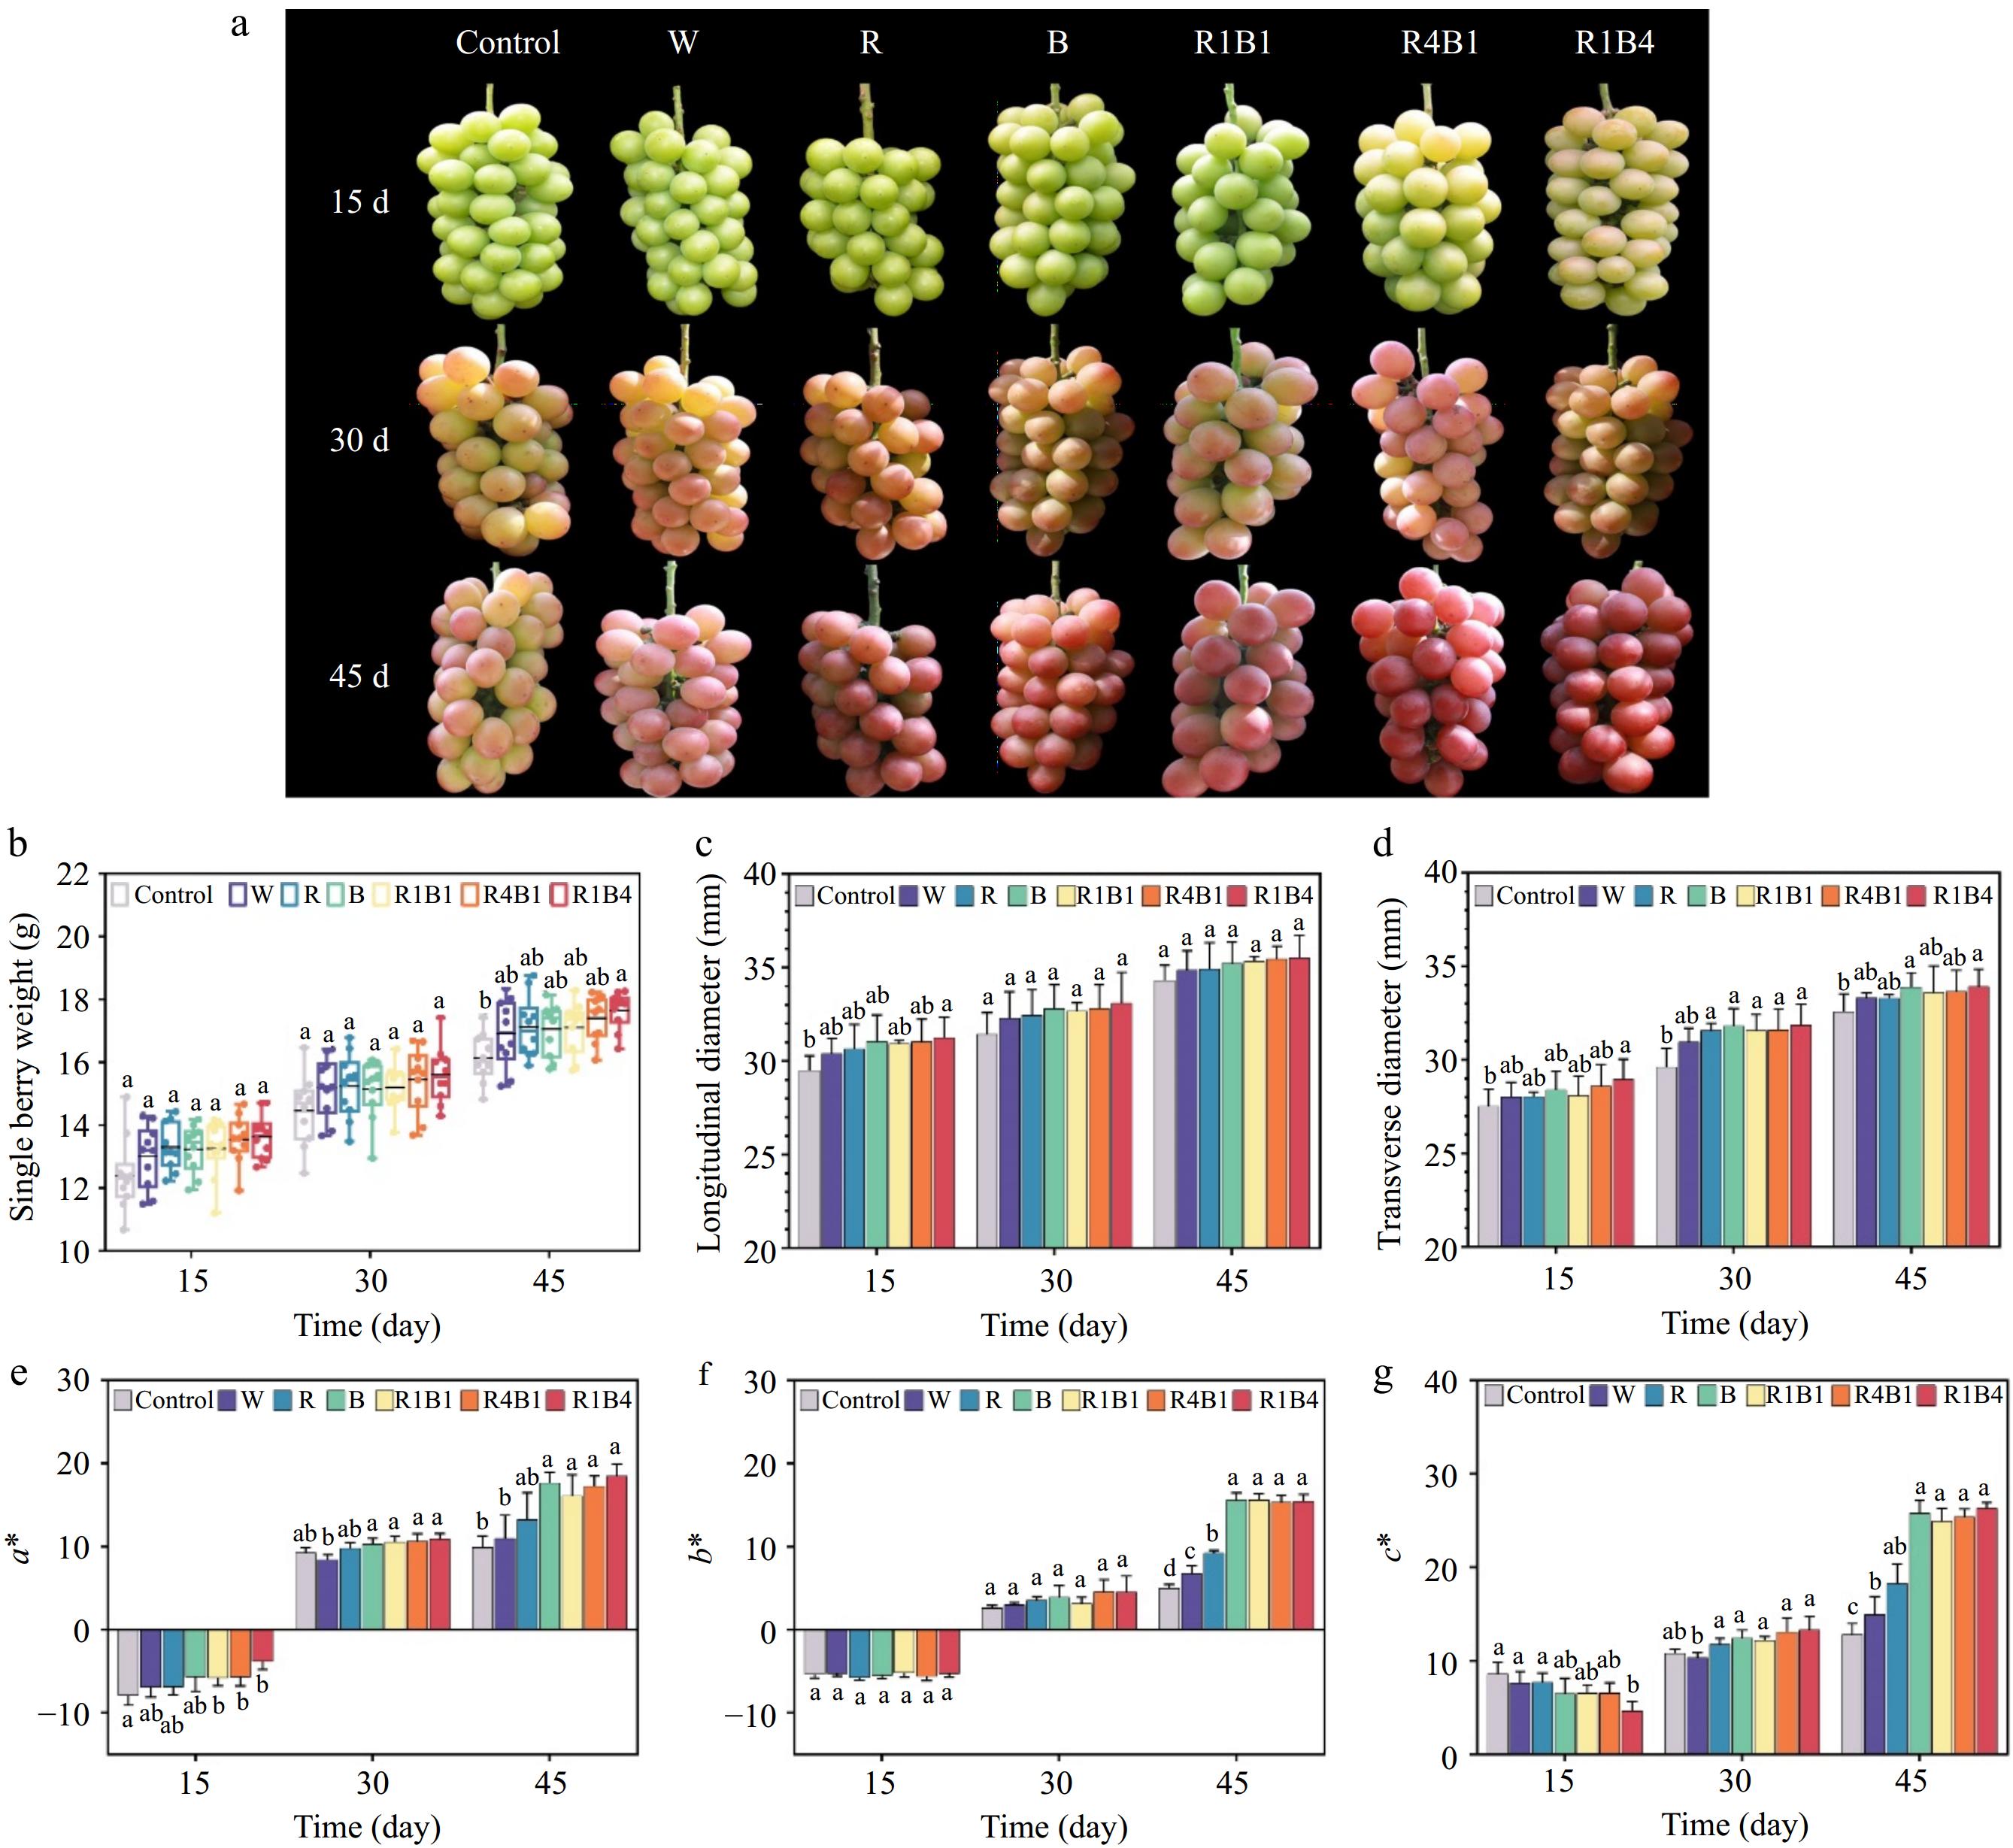
Figure 1.
Phenotypic and physiological characteristics of grapes under different light quality treatments. (a) Color phenotypes of 'Queen Nina' grapes at 15, 30 and 45 d after treatment with different light qualities. Abbreviations: W, white light treatment; R, red light treatment; B, blue light treatment; R1B1, red and blue light at a 1:1 ratio; R4B1, red and blue light at a 4:1 ratio; R1B4, red and blue light at a 1:4 ratio. (b)−(d) Measurement of various physiological parameters including individual berry weight, longitudinal and transverse diameters. (e) Color difference a*; (f) Color difference b*; (g) Color saturation c*. Data are presented as mean ± standard deviation (n = 10). Different letters indicate statistically significant differences based on one-way analysis of variance (P < 0.05).
-
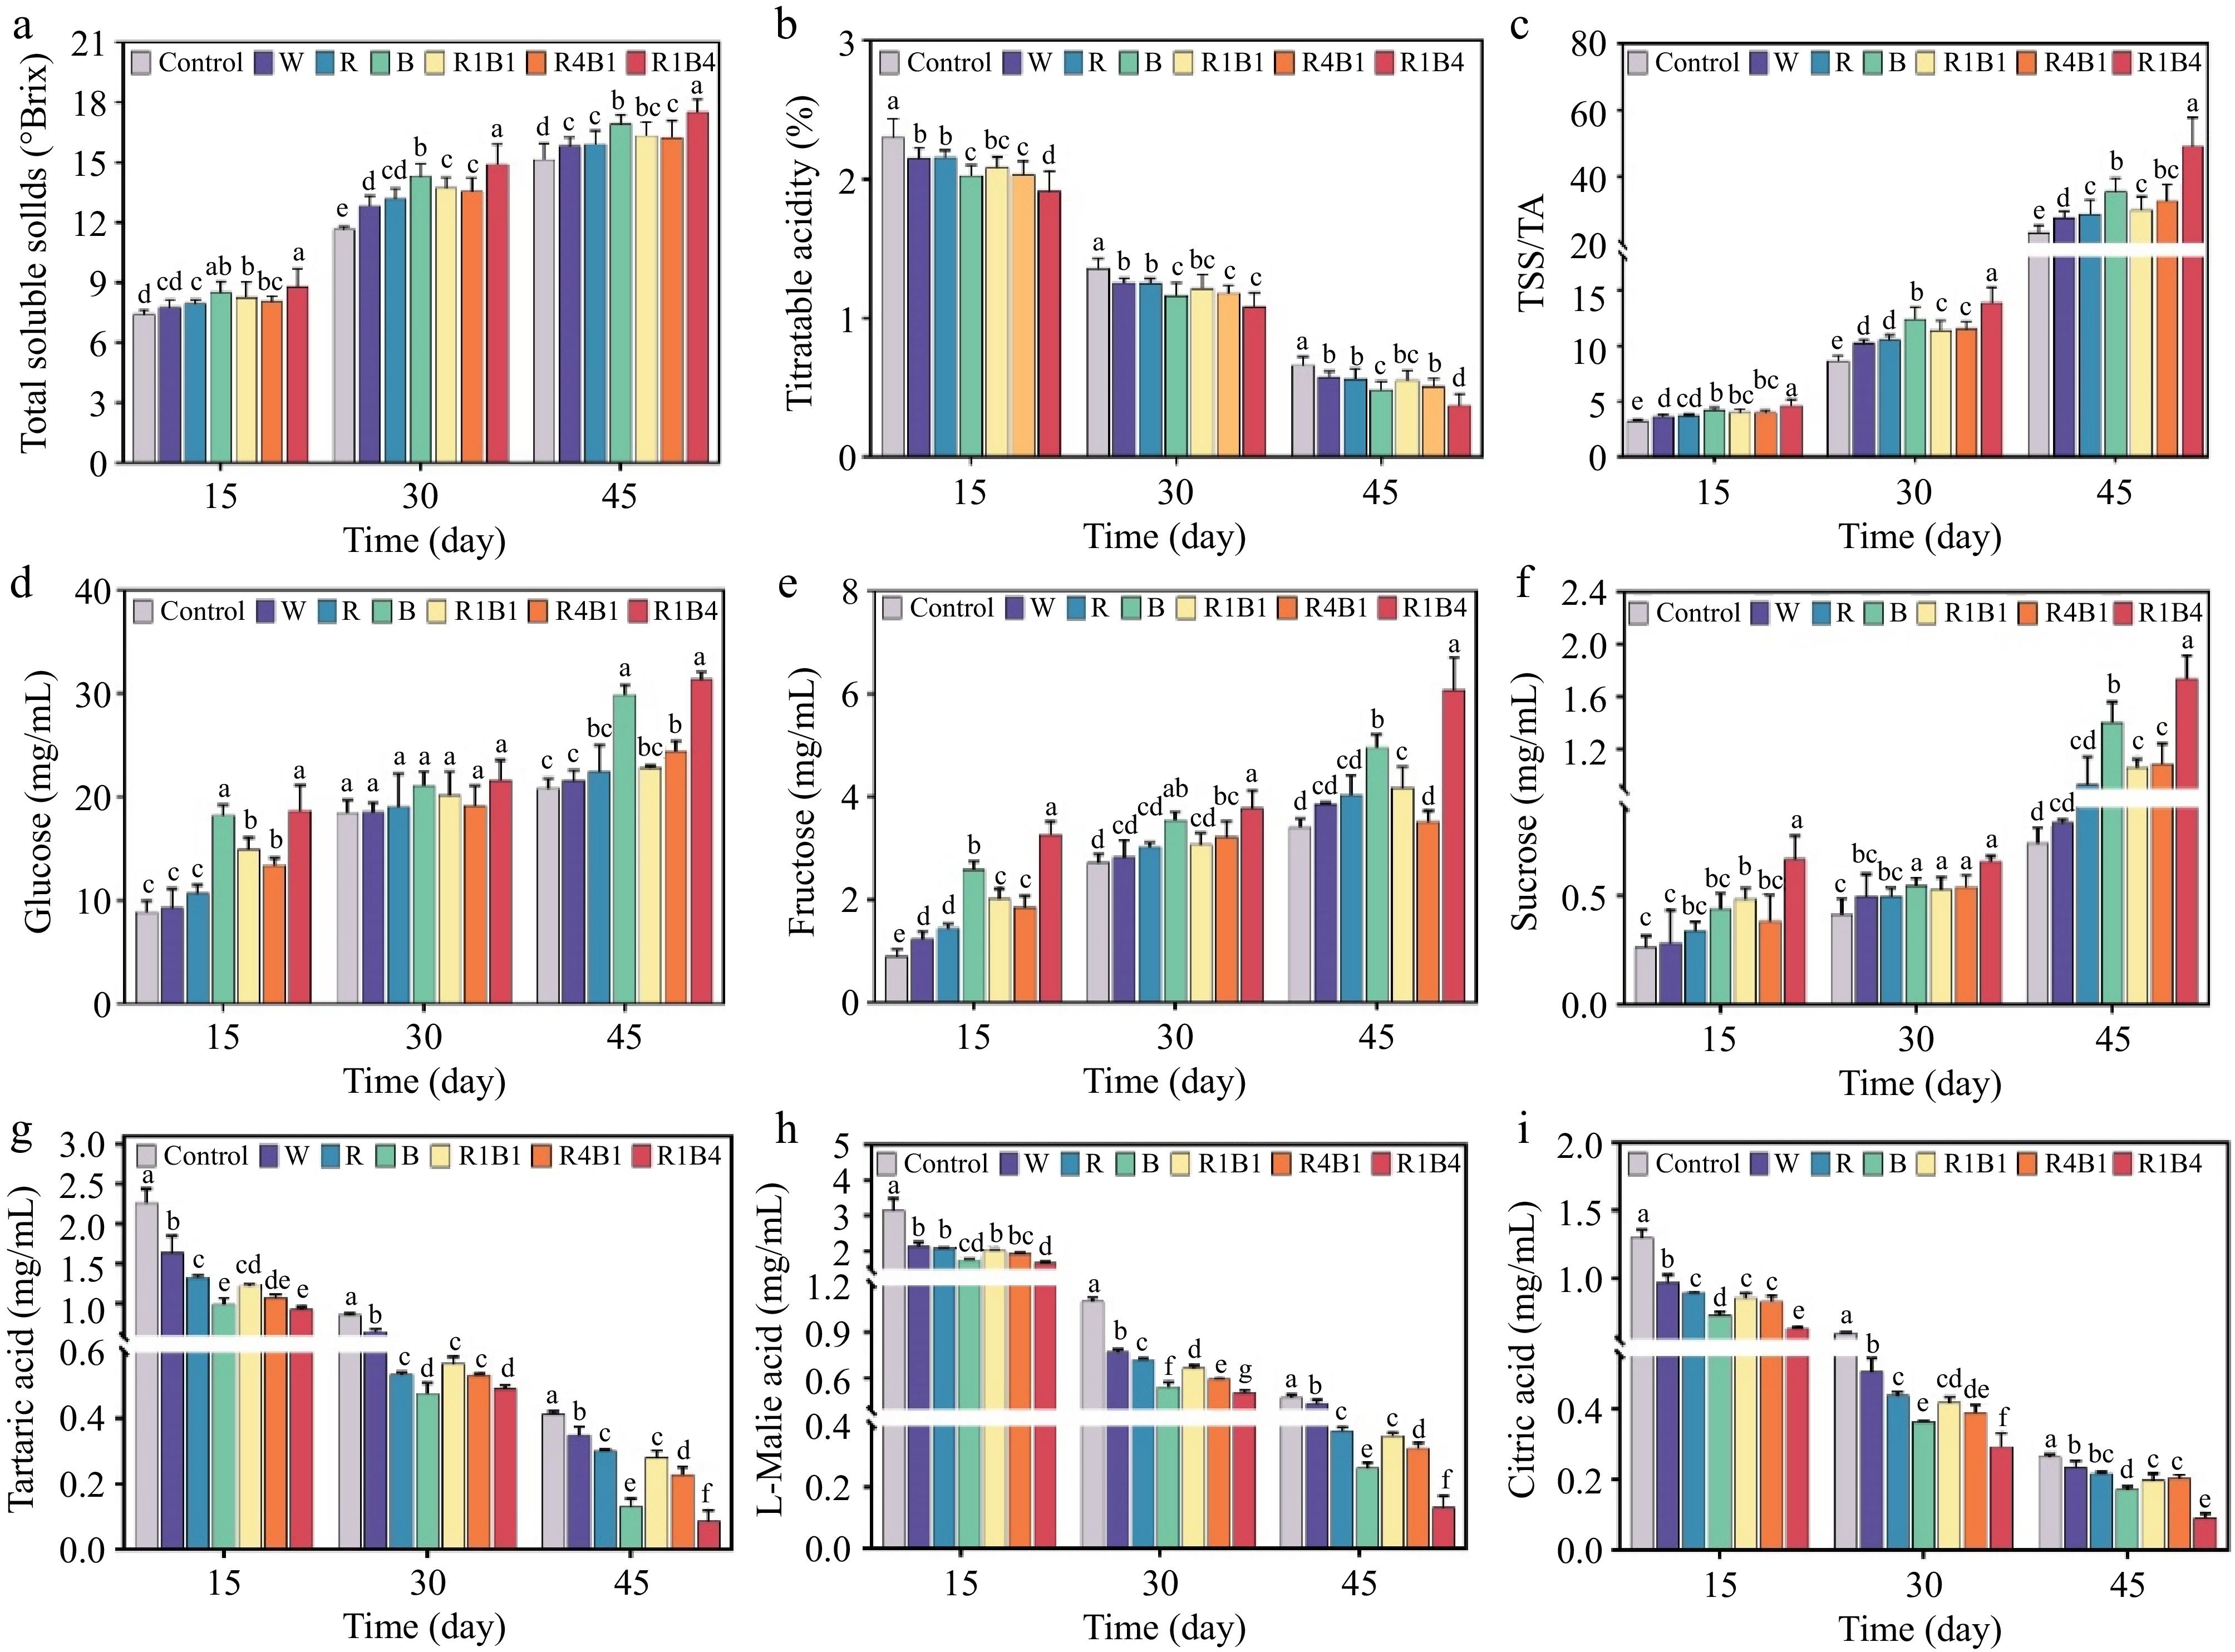
Figure 2.
Changes of sugar and acid in grape berry after different light quality treatments at 15, 30, and 45 d. (a) Total soluble solids content (TSS); (b) Titratable acidity (TA); (c) Sugar acid ratio (TSS/TA); (d) Glucose content; (e) Fructose content; (f) Sucrose content; (g) Tartaric acid content; (h) L-malic acid content; (i) Citric acid content. Data are presented as mean ± standard deviation (n = 3). Different letters indicate statistically significant differences based on one-way analysis of variance (p < 0.05).
-
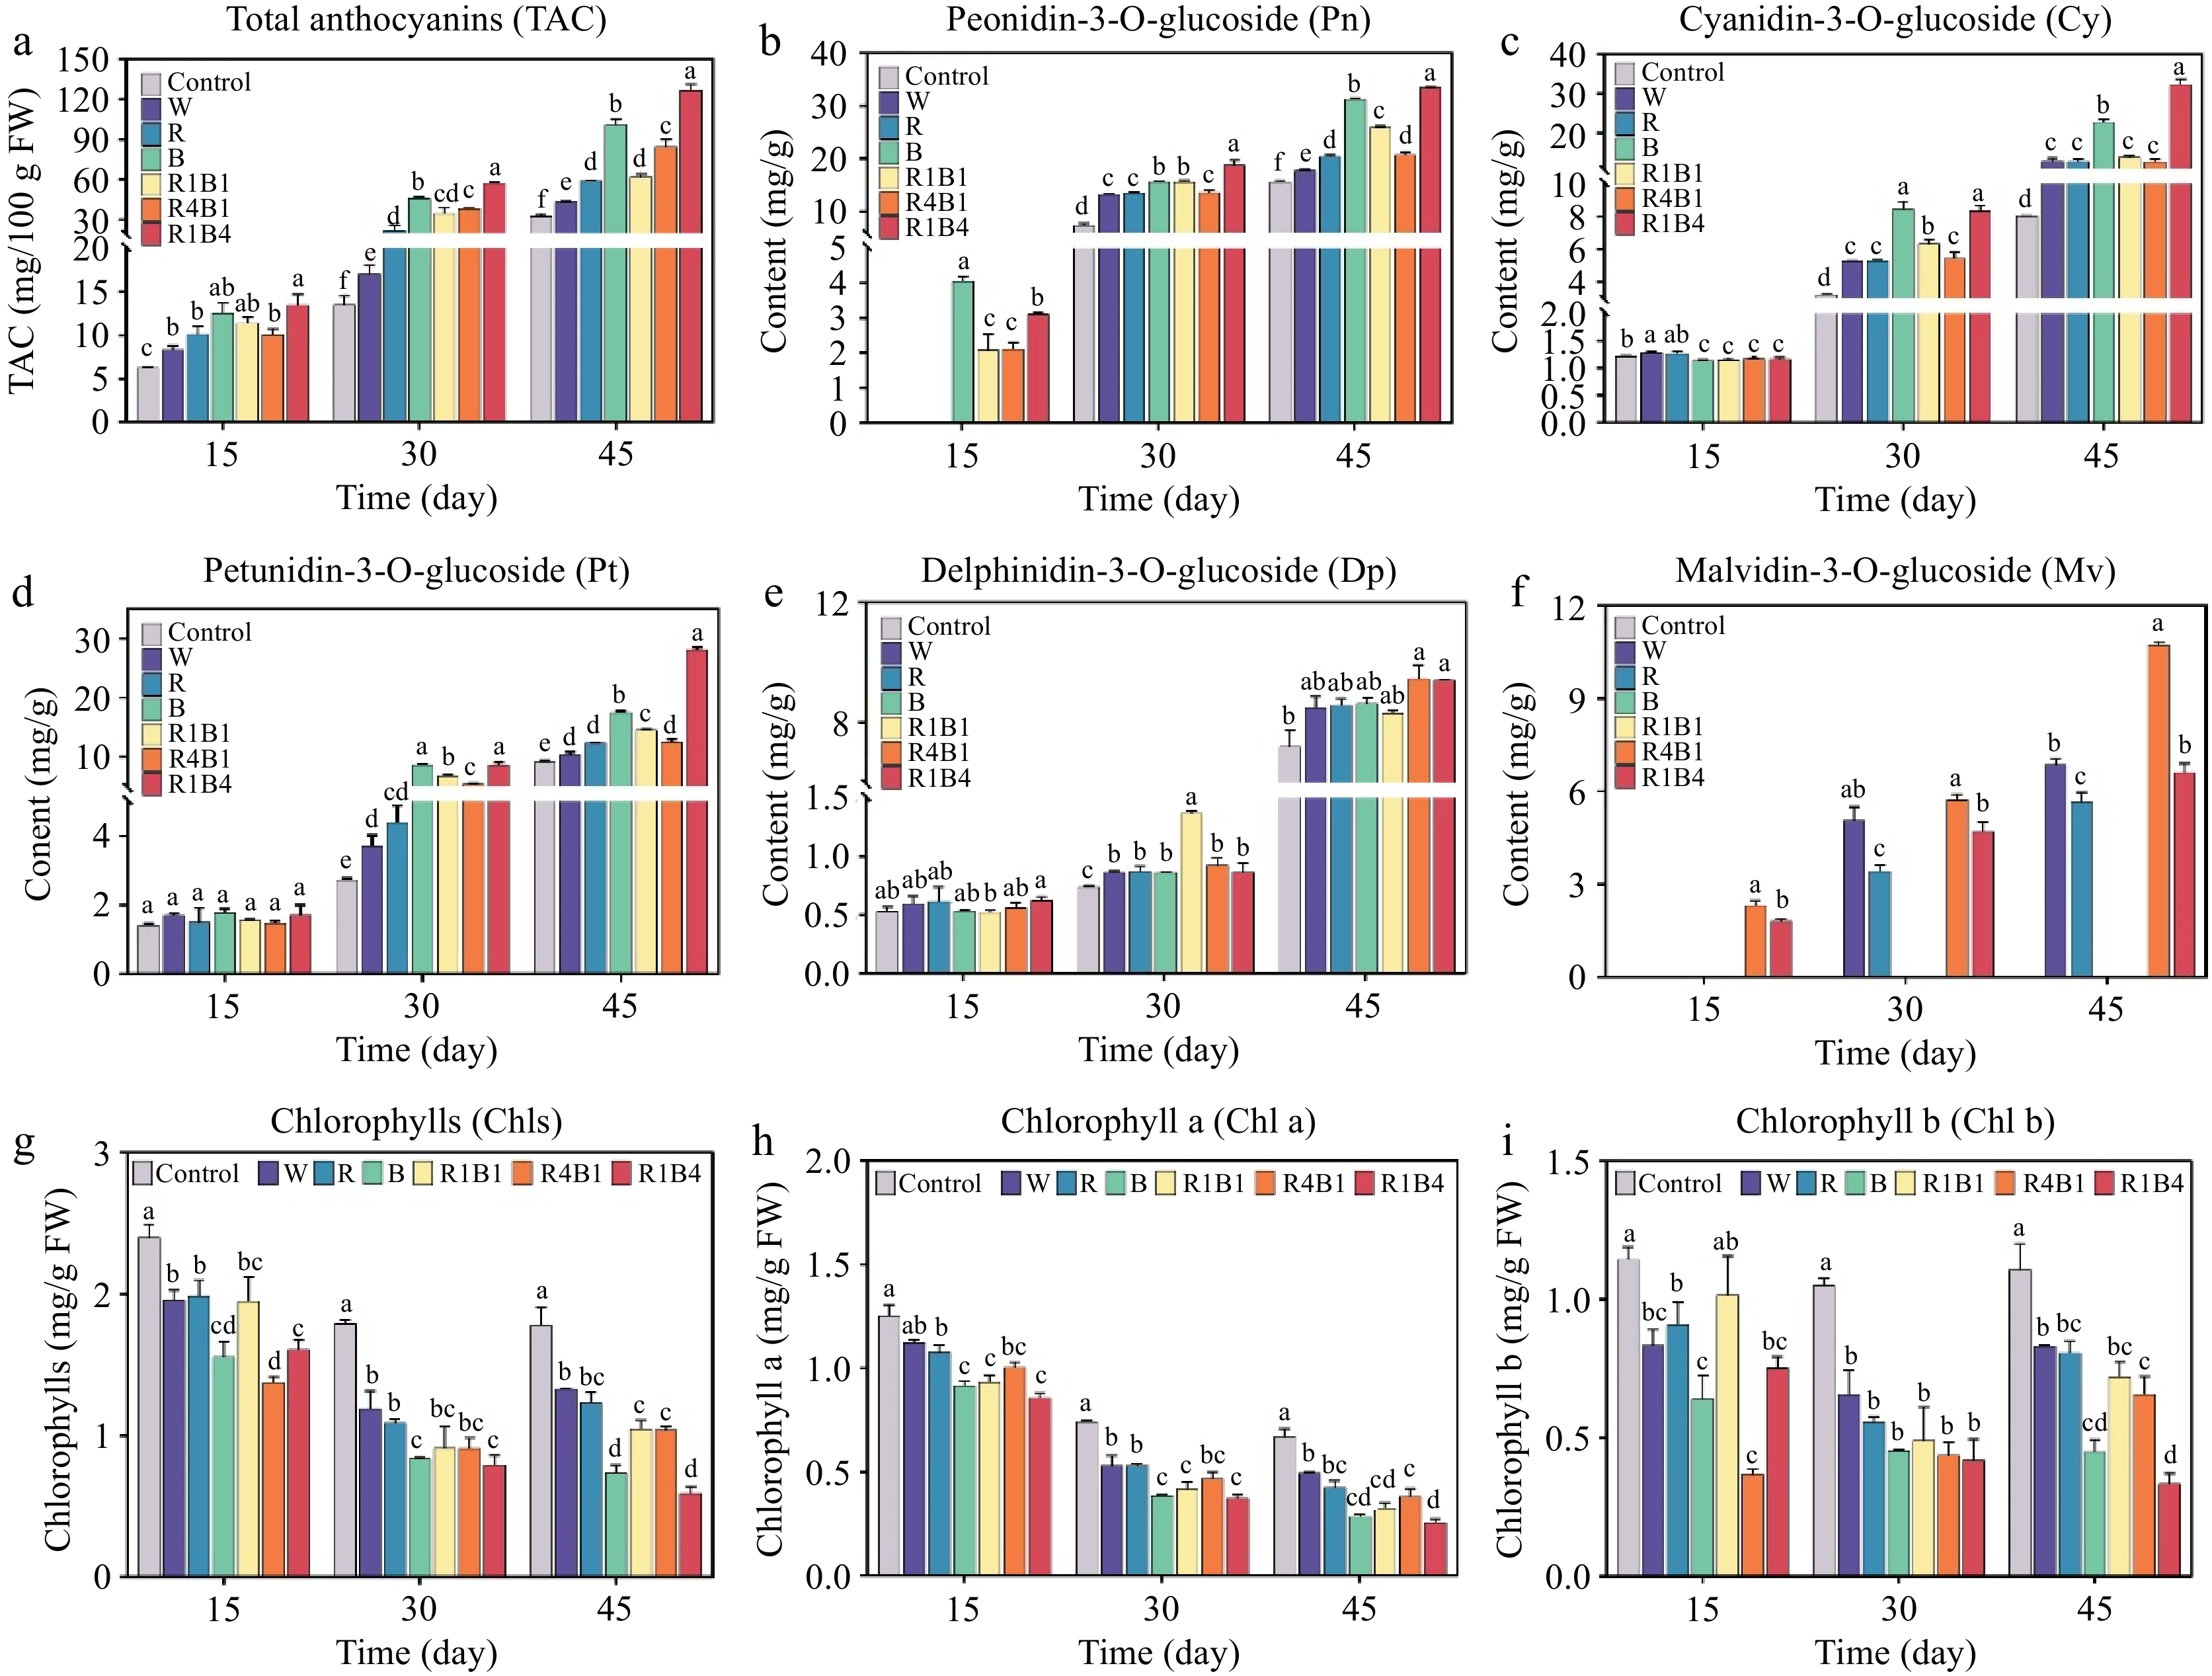
Figure 3.
Changes in grape berry anthocyanin components and color difference after different light quality treatments at 15, 30, and 45 d. (a) Total anthocyanin content (TAC); (b) Peonidin-3-O-glucoside content (Pn); (c) Cyanidin-3-O-glucoside content (Cy); (d) Petunidin-3-O-glucoside content (Pt); (e) Delphinidin-3-O-glucoside content (Dp); (f) Malvidin-3-O-glucoside content (Mv); (g)−(i) total chlorophyll content, chlorophyll a content, chlorophyll b content at each time point. Data are presented as mean ± standard deviation (n = 3). Different letters indicate statistically significant differences based on one-way analysis of variance (P < 0.05).
-
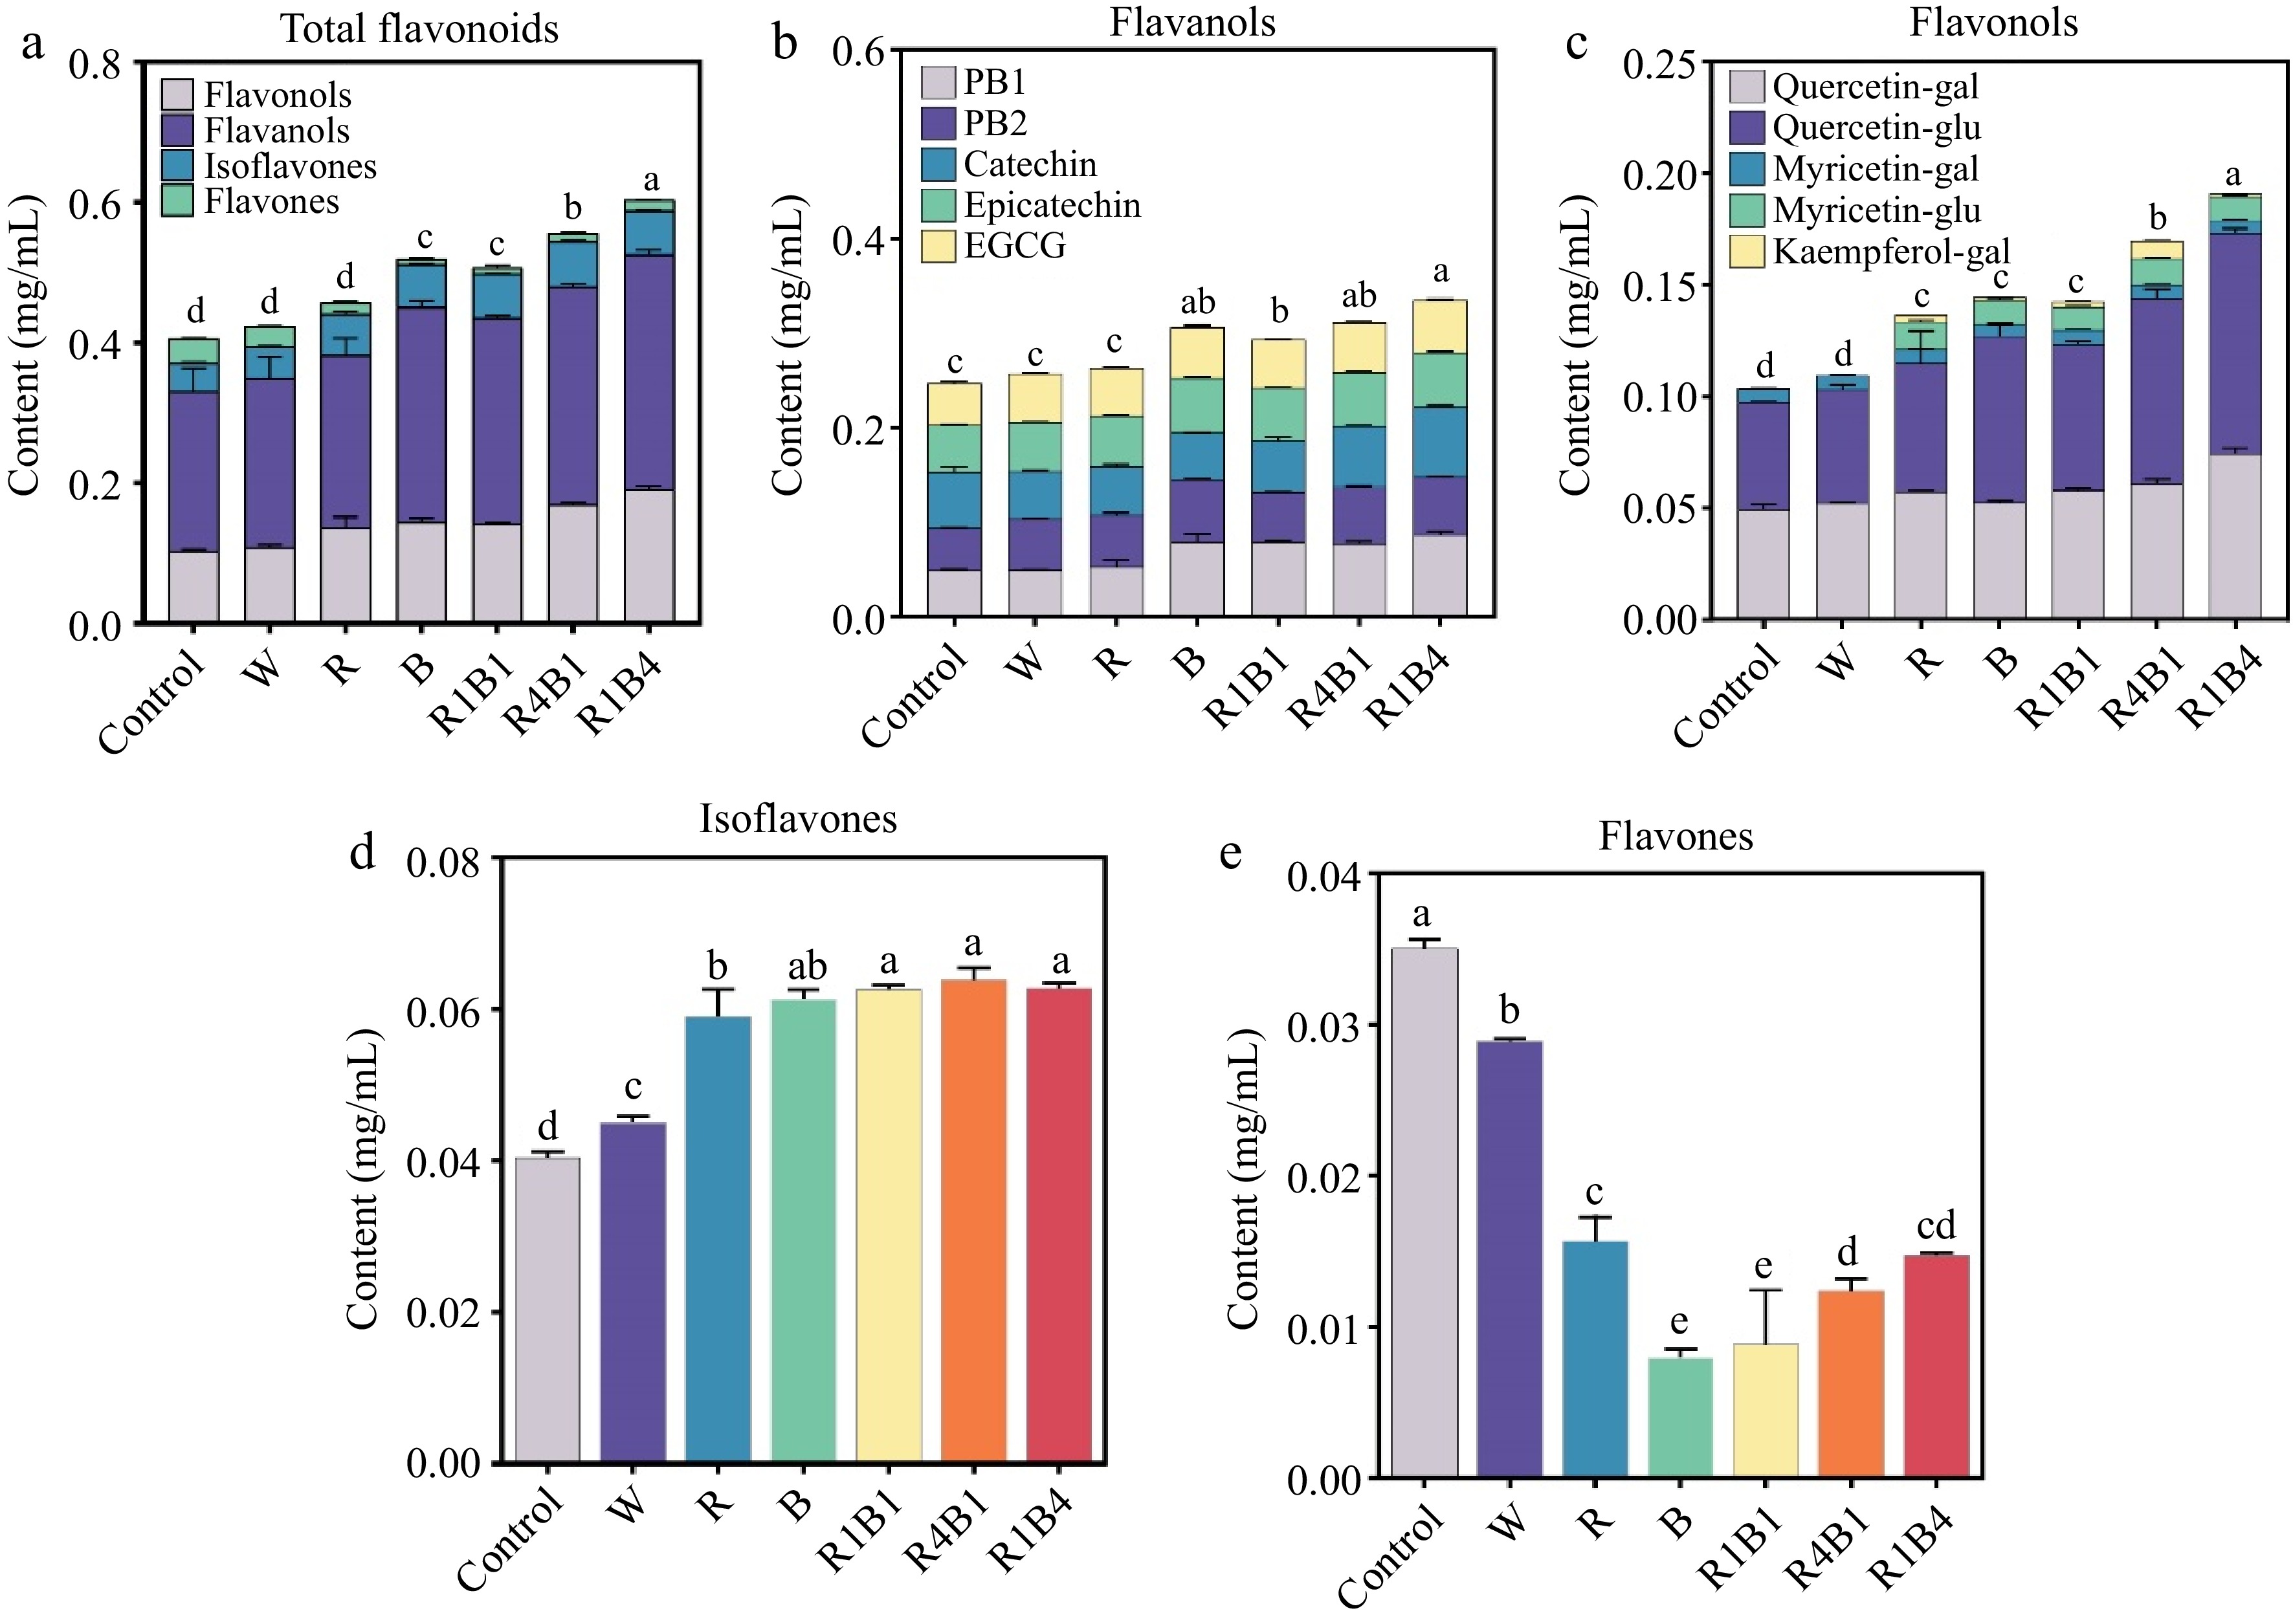
Figure 4.
Changes in grape berry flavonoid components after different light quality treatments at 45 d. (a) Total flavonoid content; (b) Flavanols content; PB1, procyanidin B1; PB2, procyanidin B2; EGCG, epigallocatechin gallate; (c) Flavonols content; Quercetin-gal, Quercetin-galctoside; Quercetin-glu, Quercetin-glucoside; Myricetin-gal, Myricetin-galctoside; Myricetin-glu, Myricetin-glucoside; Kaempferol-gal, Kaempferol-galctoside. (d) Isoflavones content; (e) Flavones content. Data are presented as mean ± standard deviation (n = 3). Different letters indicate statistically significant differences based on a one-way analysis of variance (p < 0.05).
-
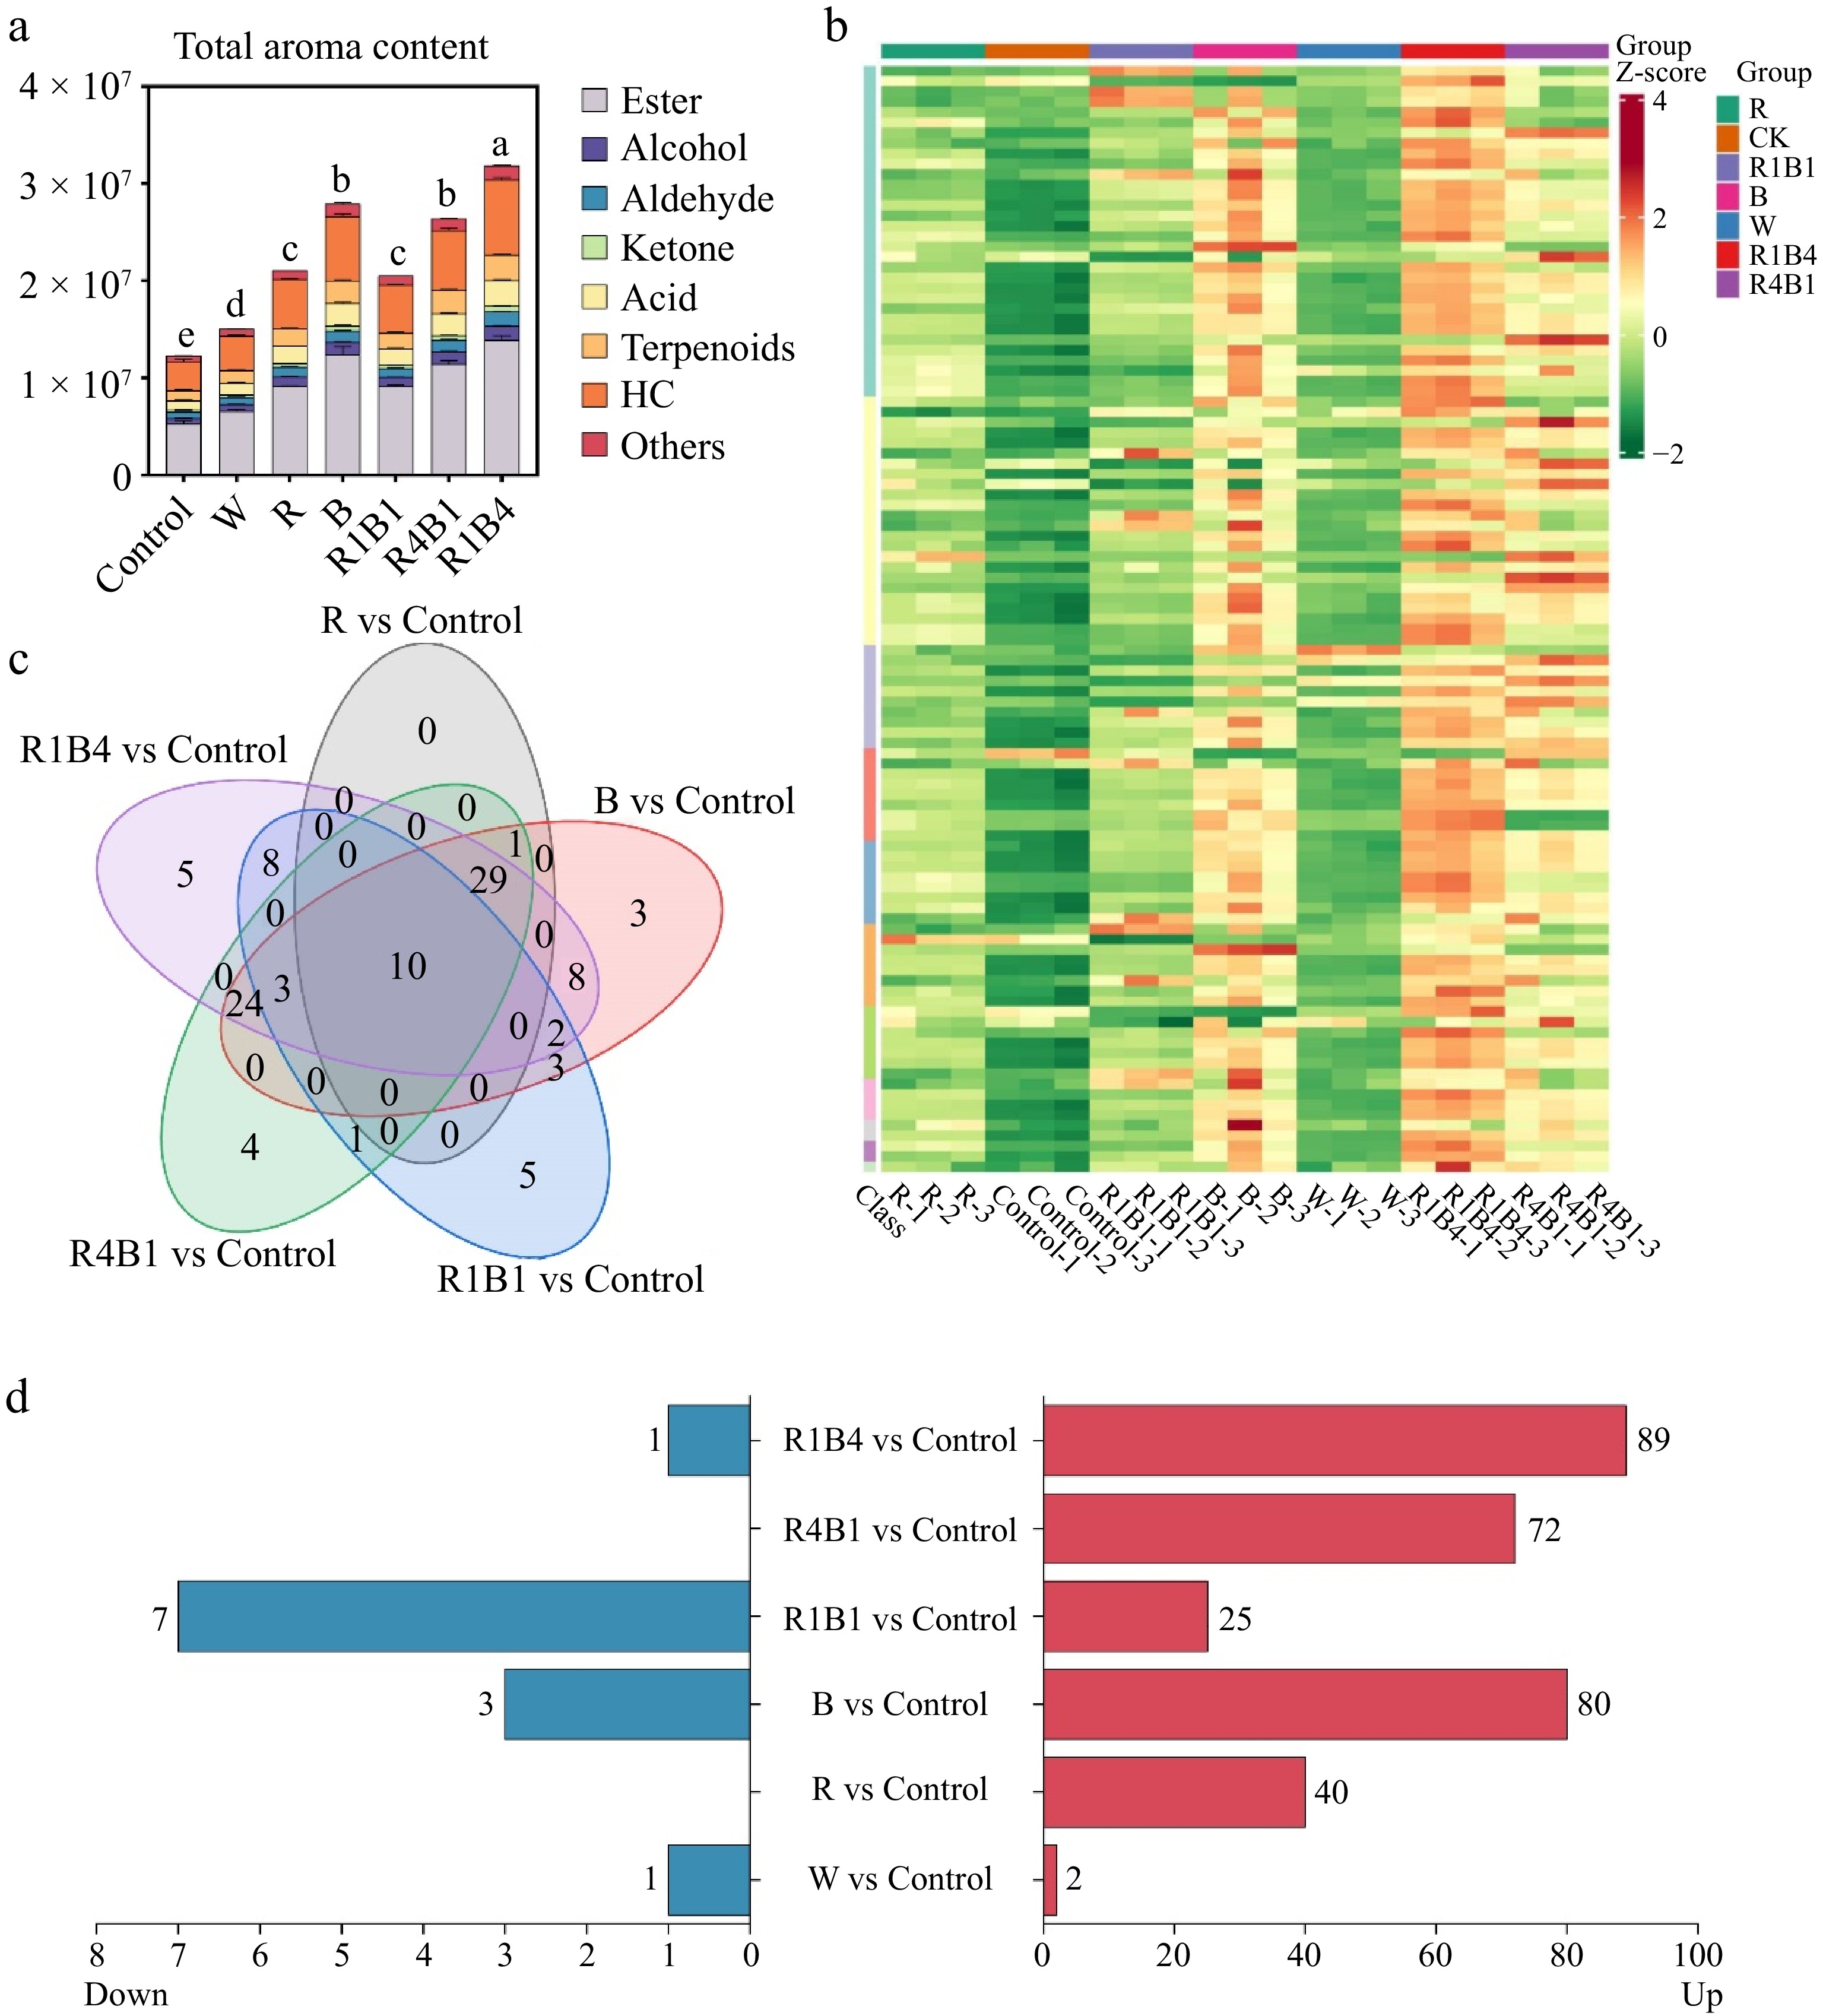
Figure 5.
Changes in grape berry aroma components after different light quality treatments at 45 d. (a) Total aroma content; (b) Venn diagrams presenting unique and common aroma metabolites in six light treatments compared to control; (c) Aroma components up-regulated and down-regulated by six light treatments compared to control; (d) Heat maps of 107 VOCs components in all treatments.
-
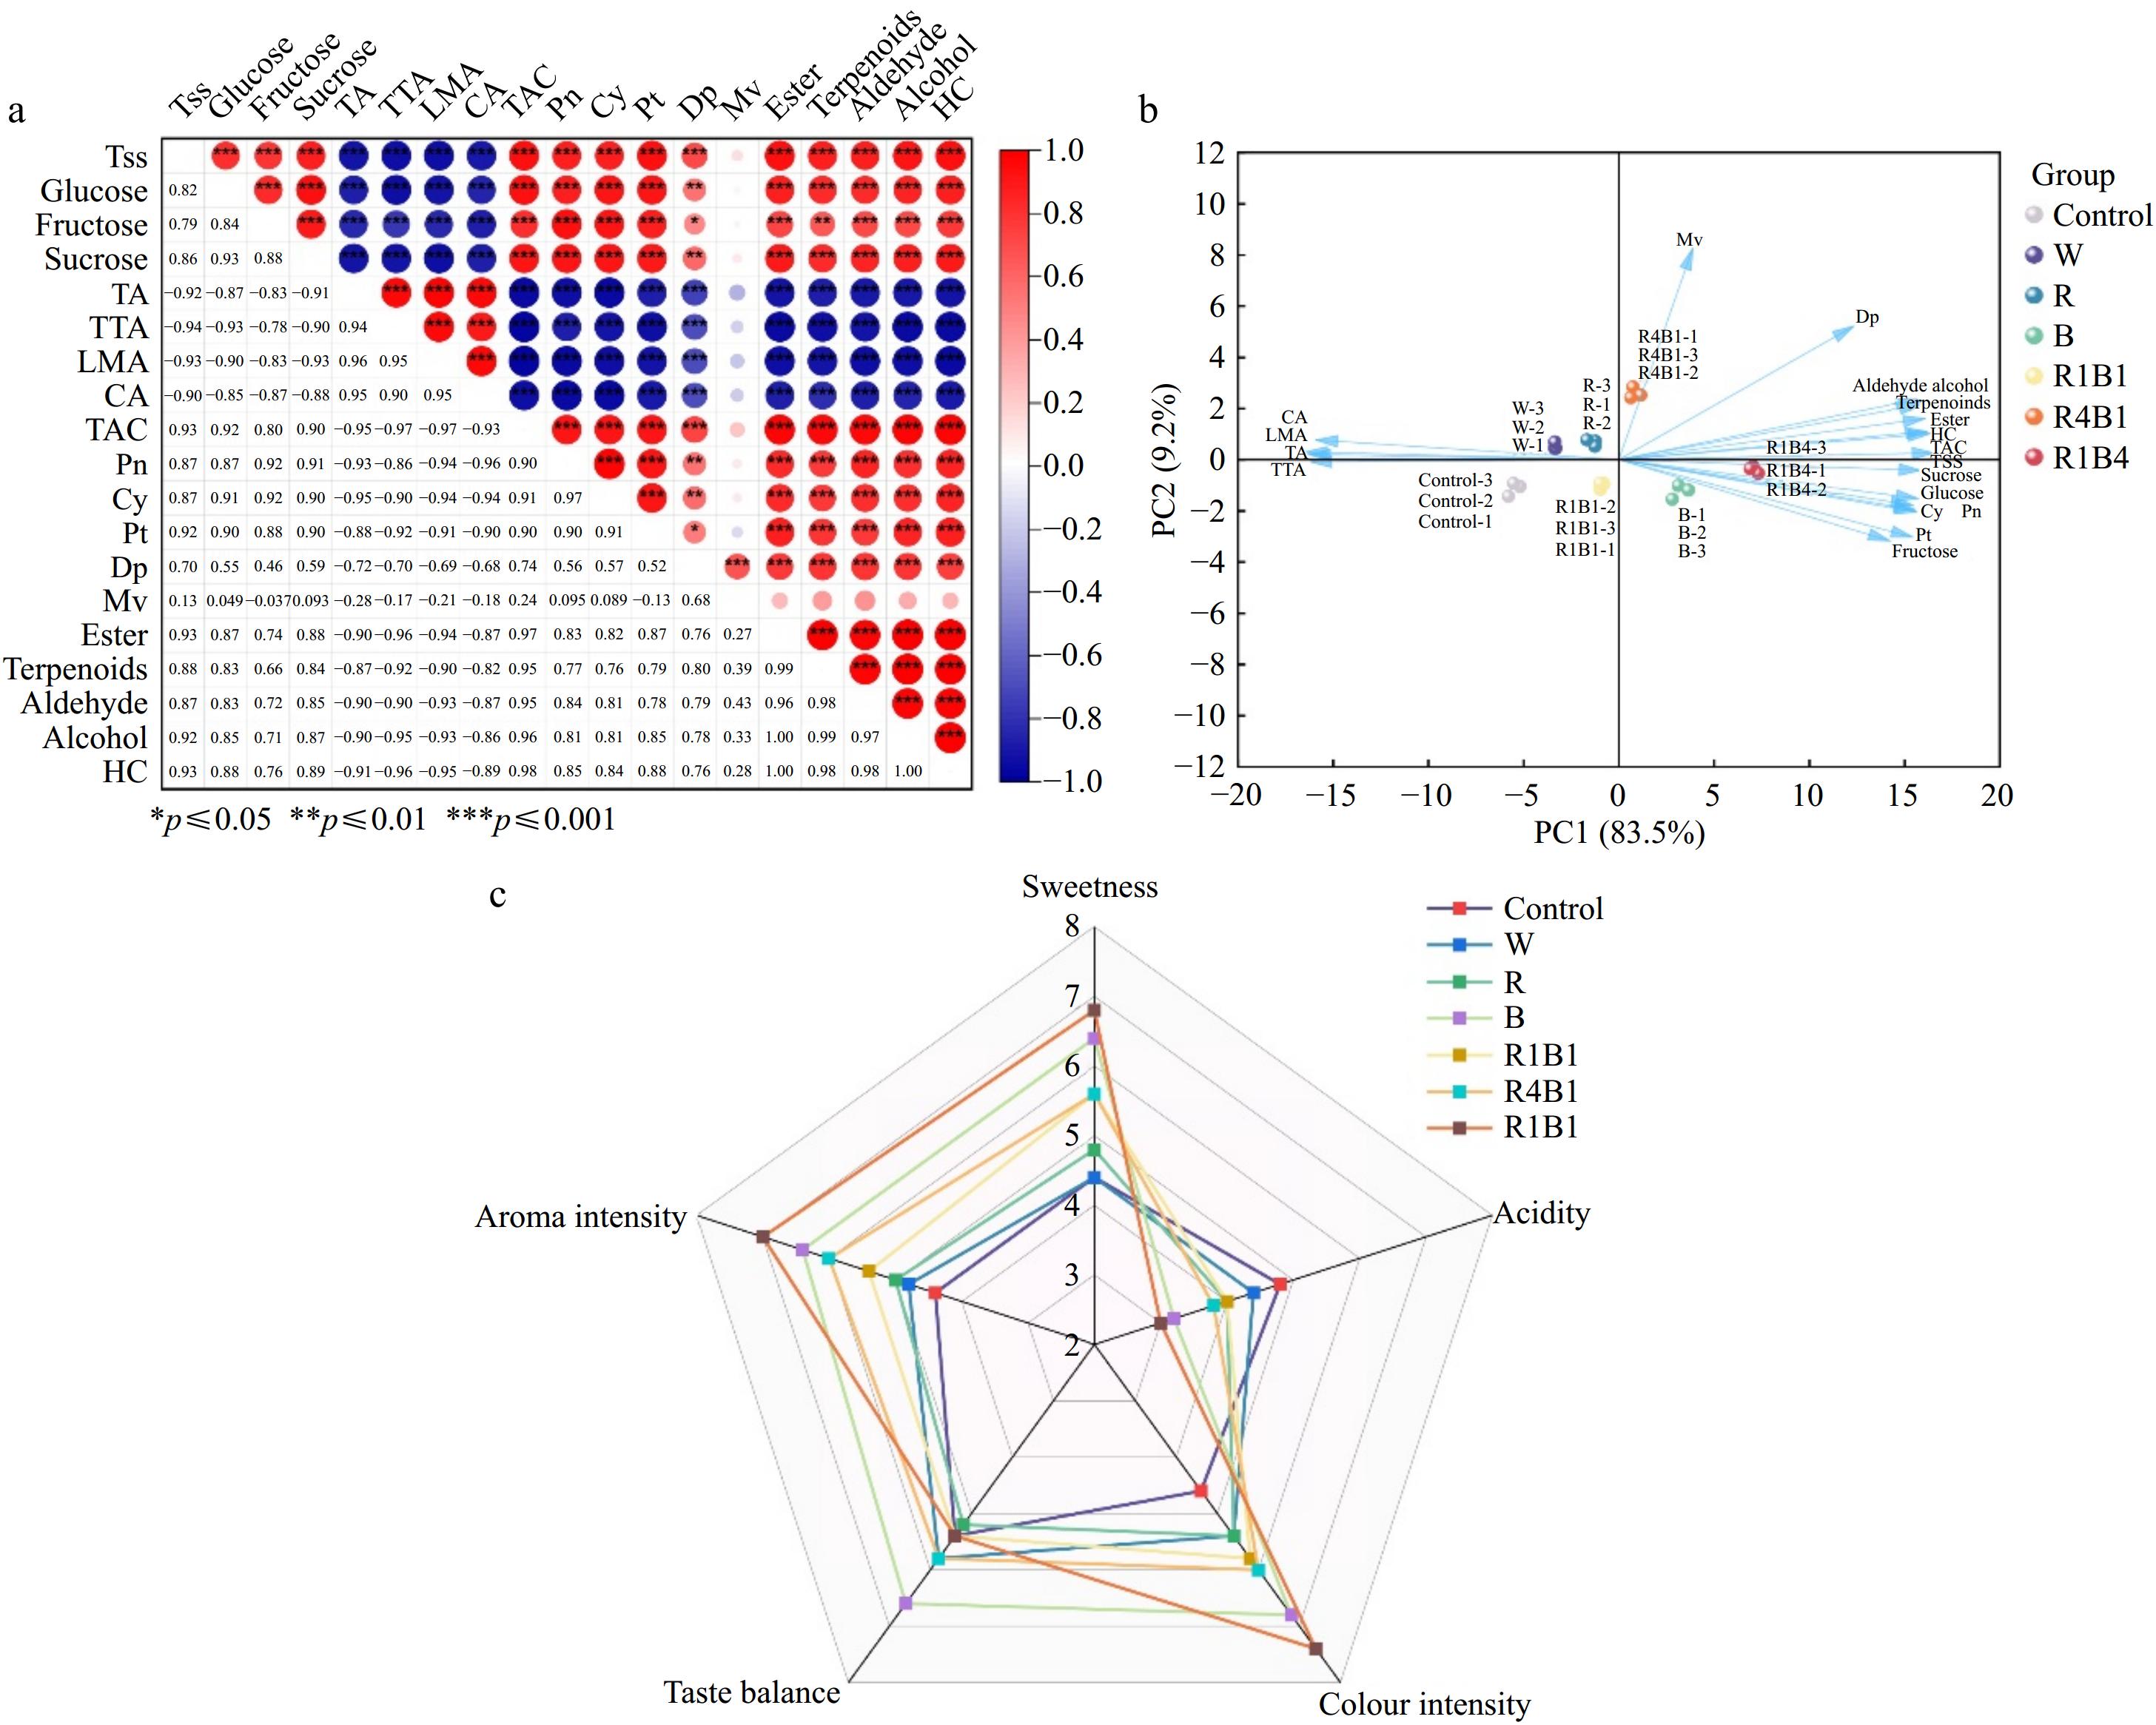
Figure 6.
Correlation analysis of 19 quality indicators in 'Queen Nina'. (a) The color intensity and circle size are proportional to the value of each correlation coefficient. Red represents a positive correlation, and blue represents a negative correlation. TTA, tartaric acid; LMA, L-malic acid; CA, citric acid; Ant, total anthocyanins; HC, Heter compound. (b) PCA scores of physiological parameters of 'Queen Nina' under different treatments at maturity stage. (c) Radar plots of sensory assessment of different treatments at harvest.
Figures
(6)
Tables
(0)