-
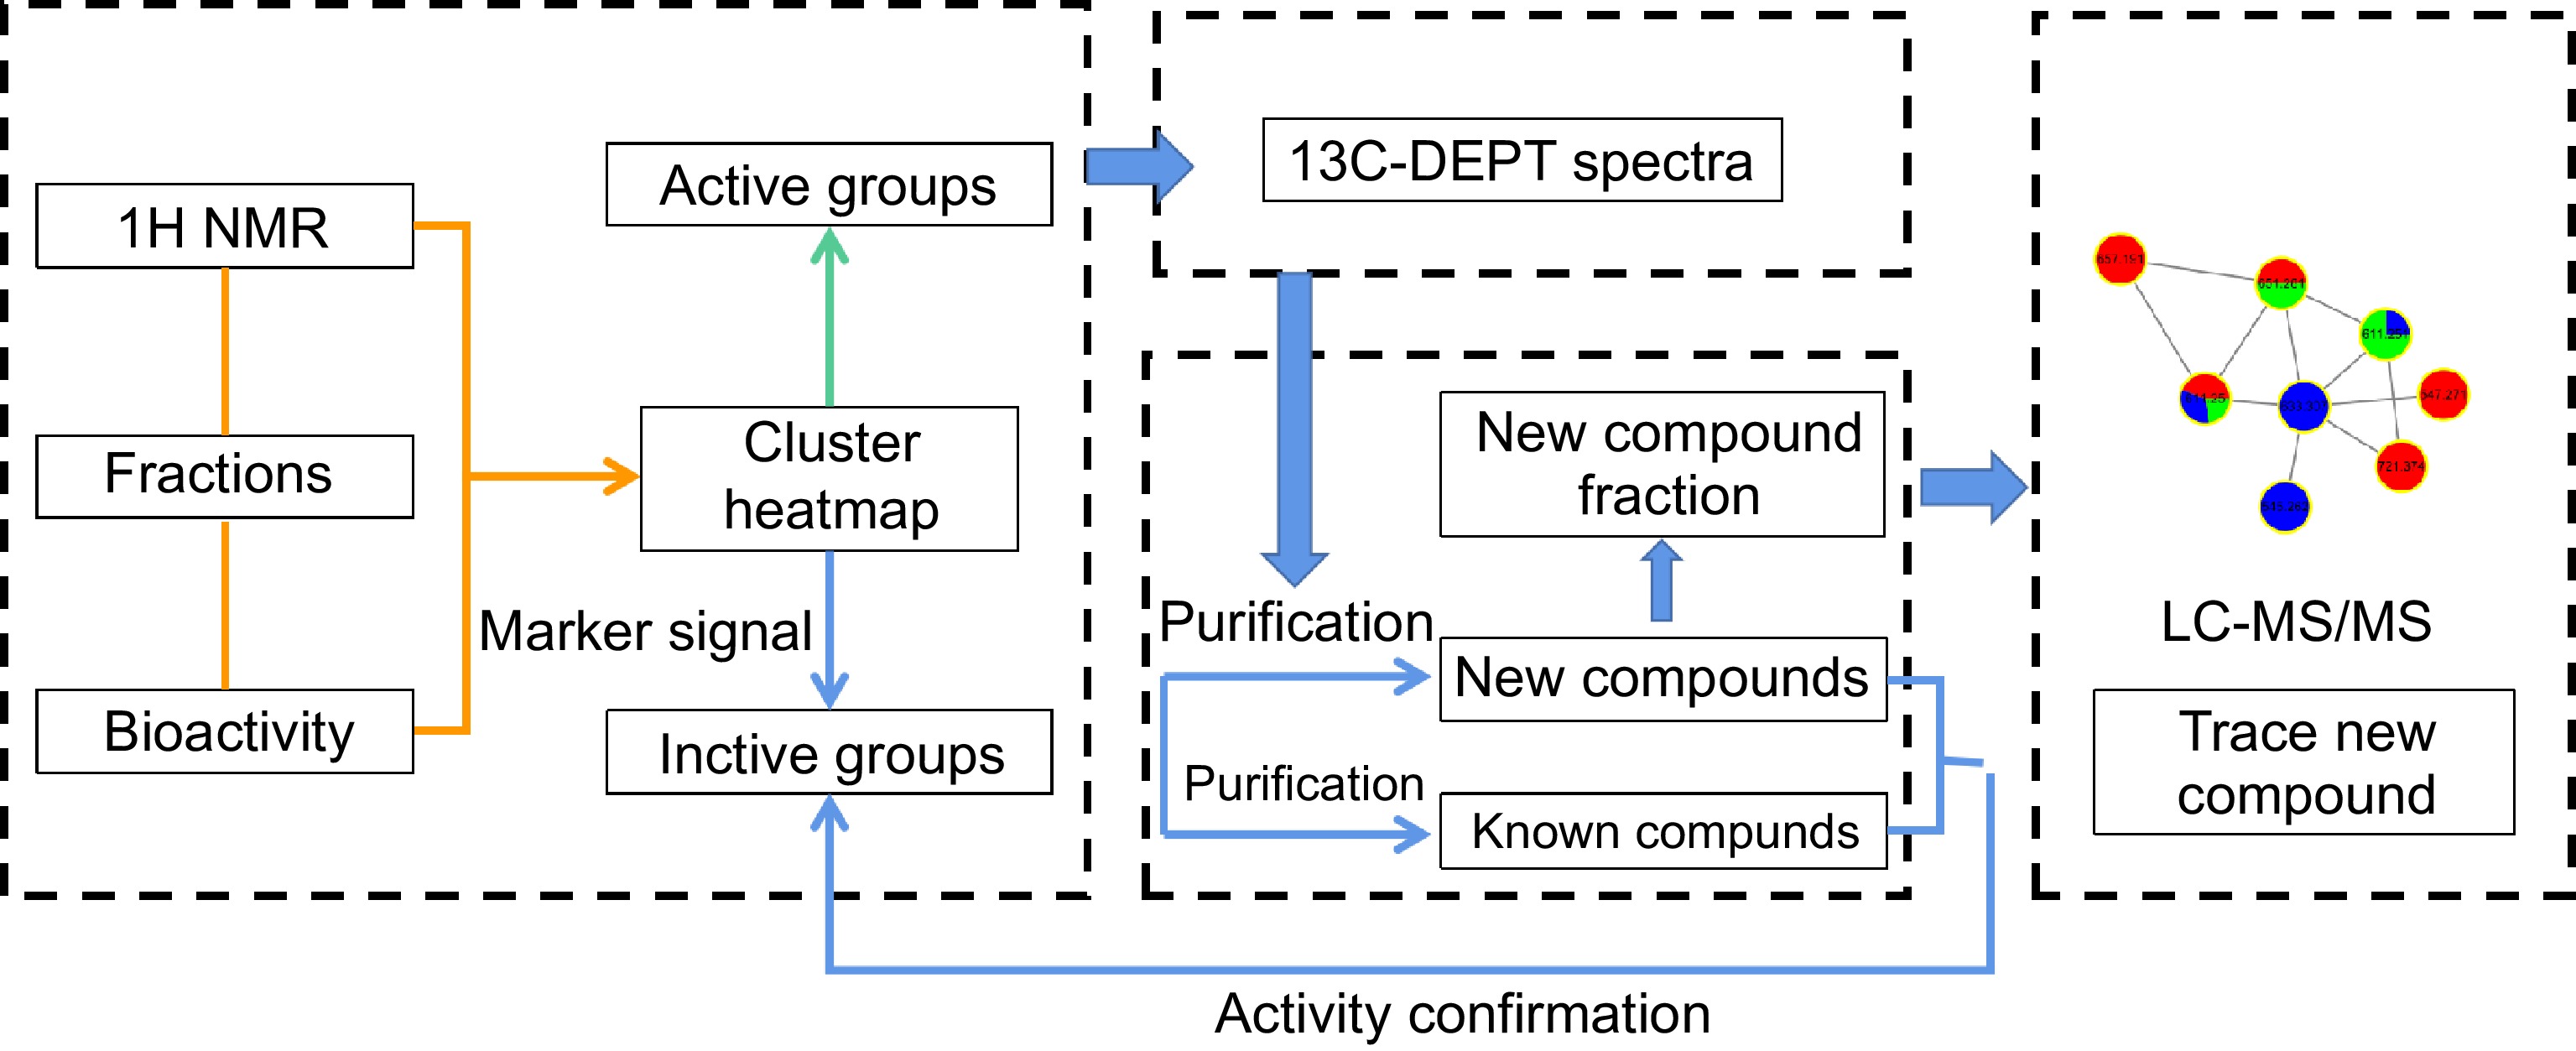
Figure 1.
General strategy for discovery of bioactive ingredients in roasted coffee.
-
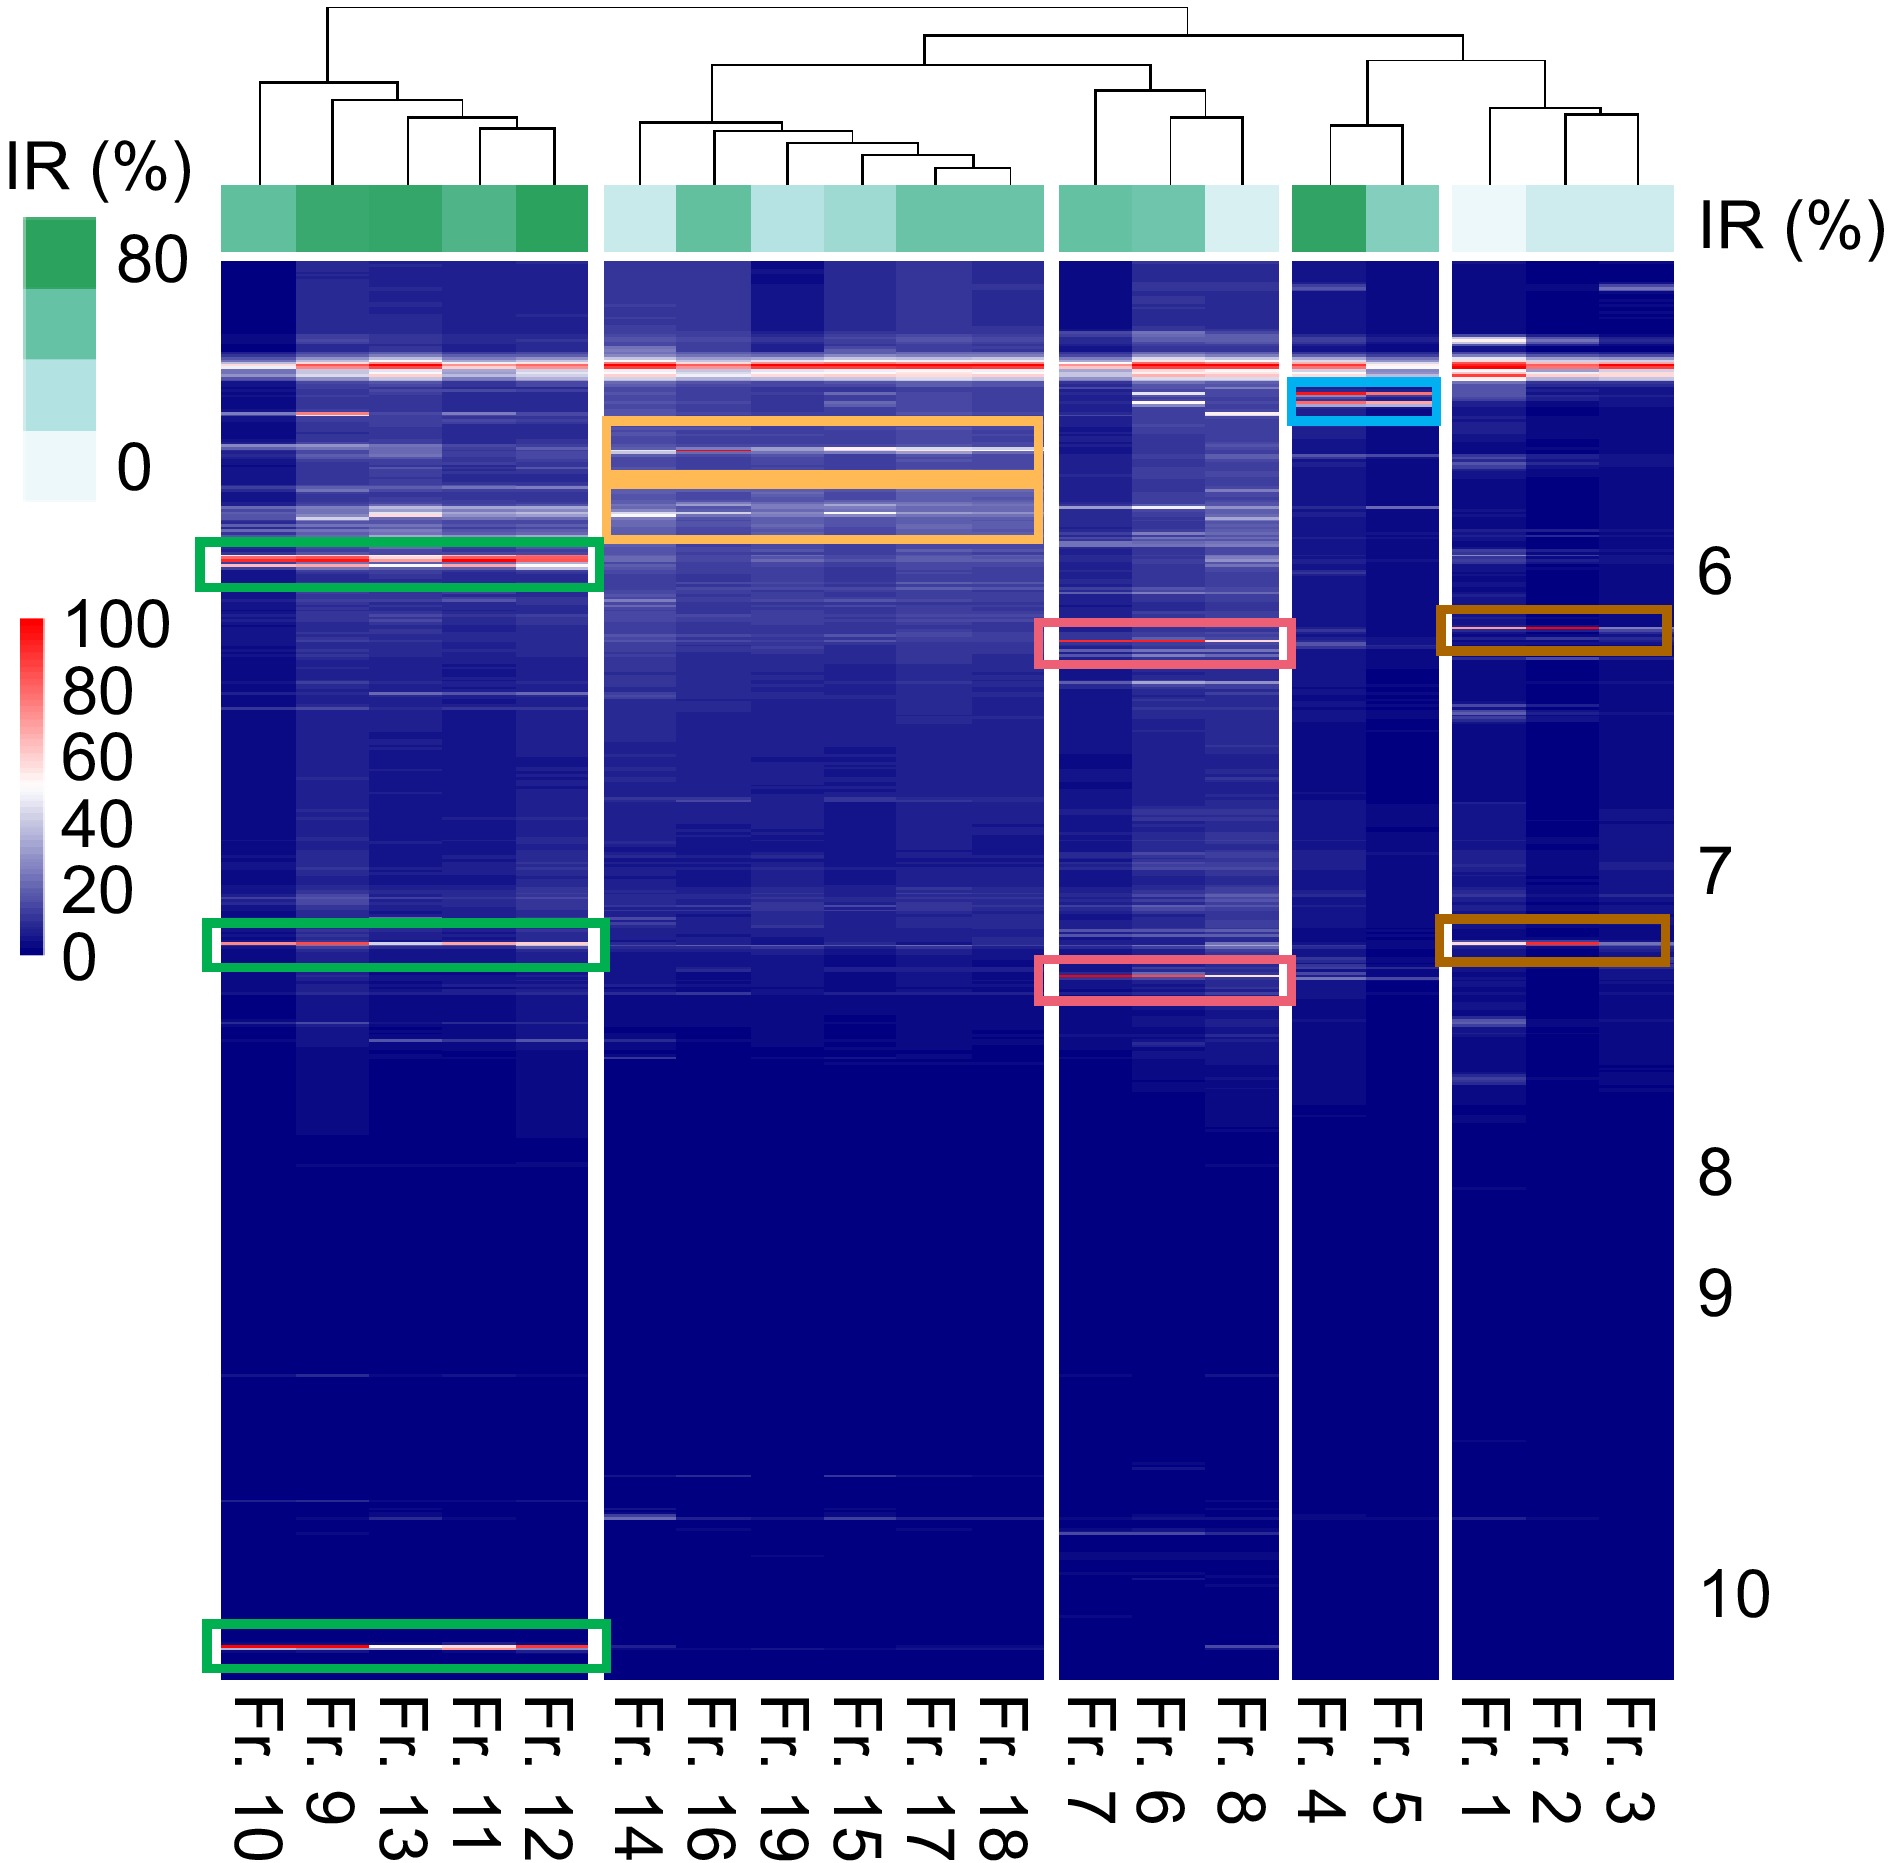
Figure 2.
Cluster heatmap of coffee diterpene fractions basing on 1H NMR data. The α-glucosidase inhibitory rate (IR, 50 μg/mL, n = 3) of each fraction are marked on the top. The darker the color indicates the stronger the activity.
-
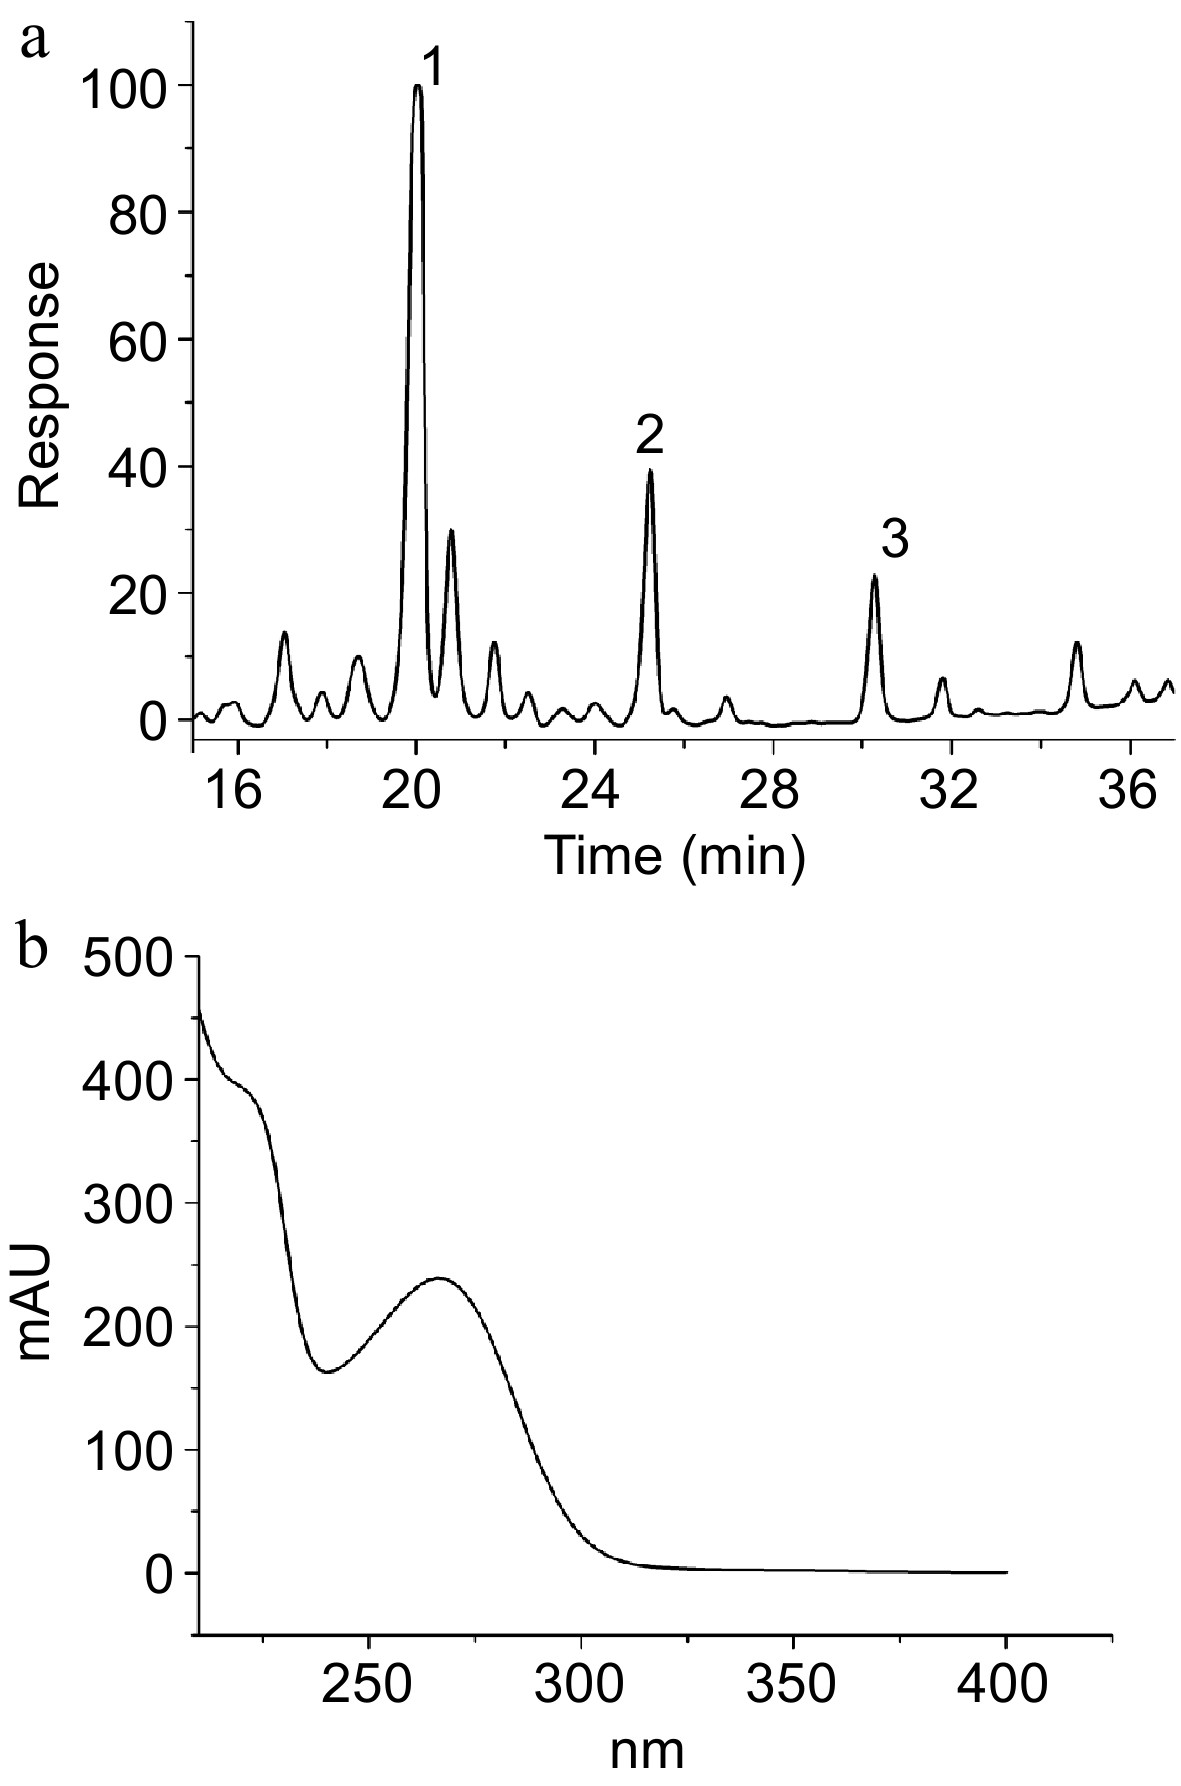
Figure 3.
(a) HPLC chromatogram of Fr.9. (b) UV spectrum of 1 (UVmax = 218 ± 5 nm, 265 ± 5 nm).
-
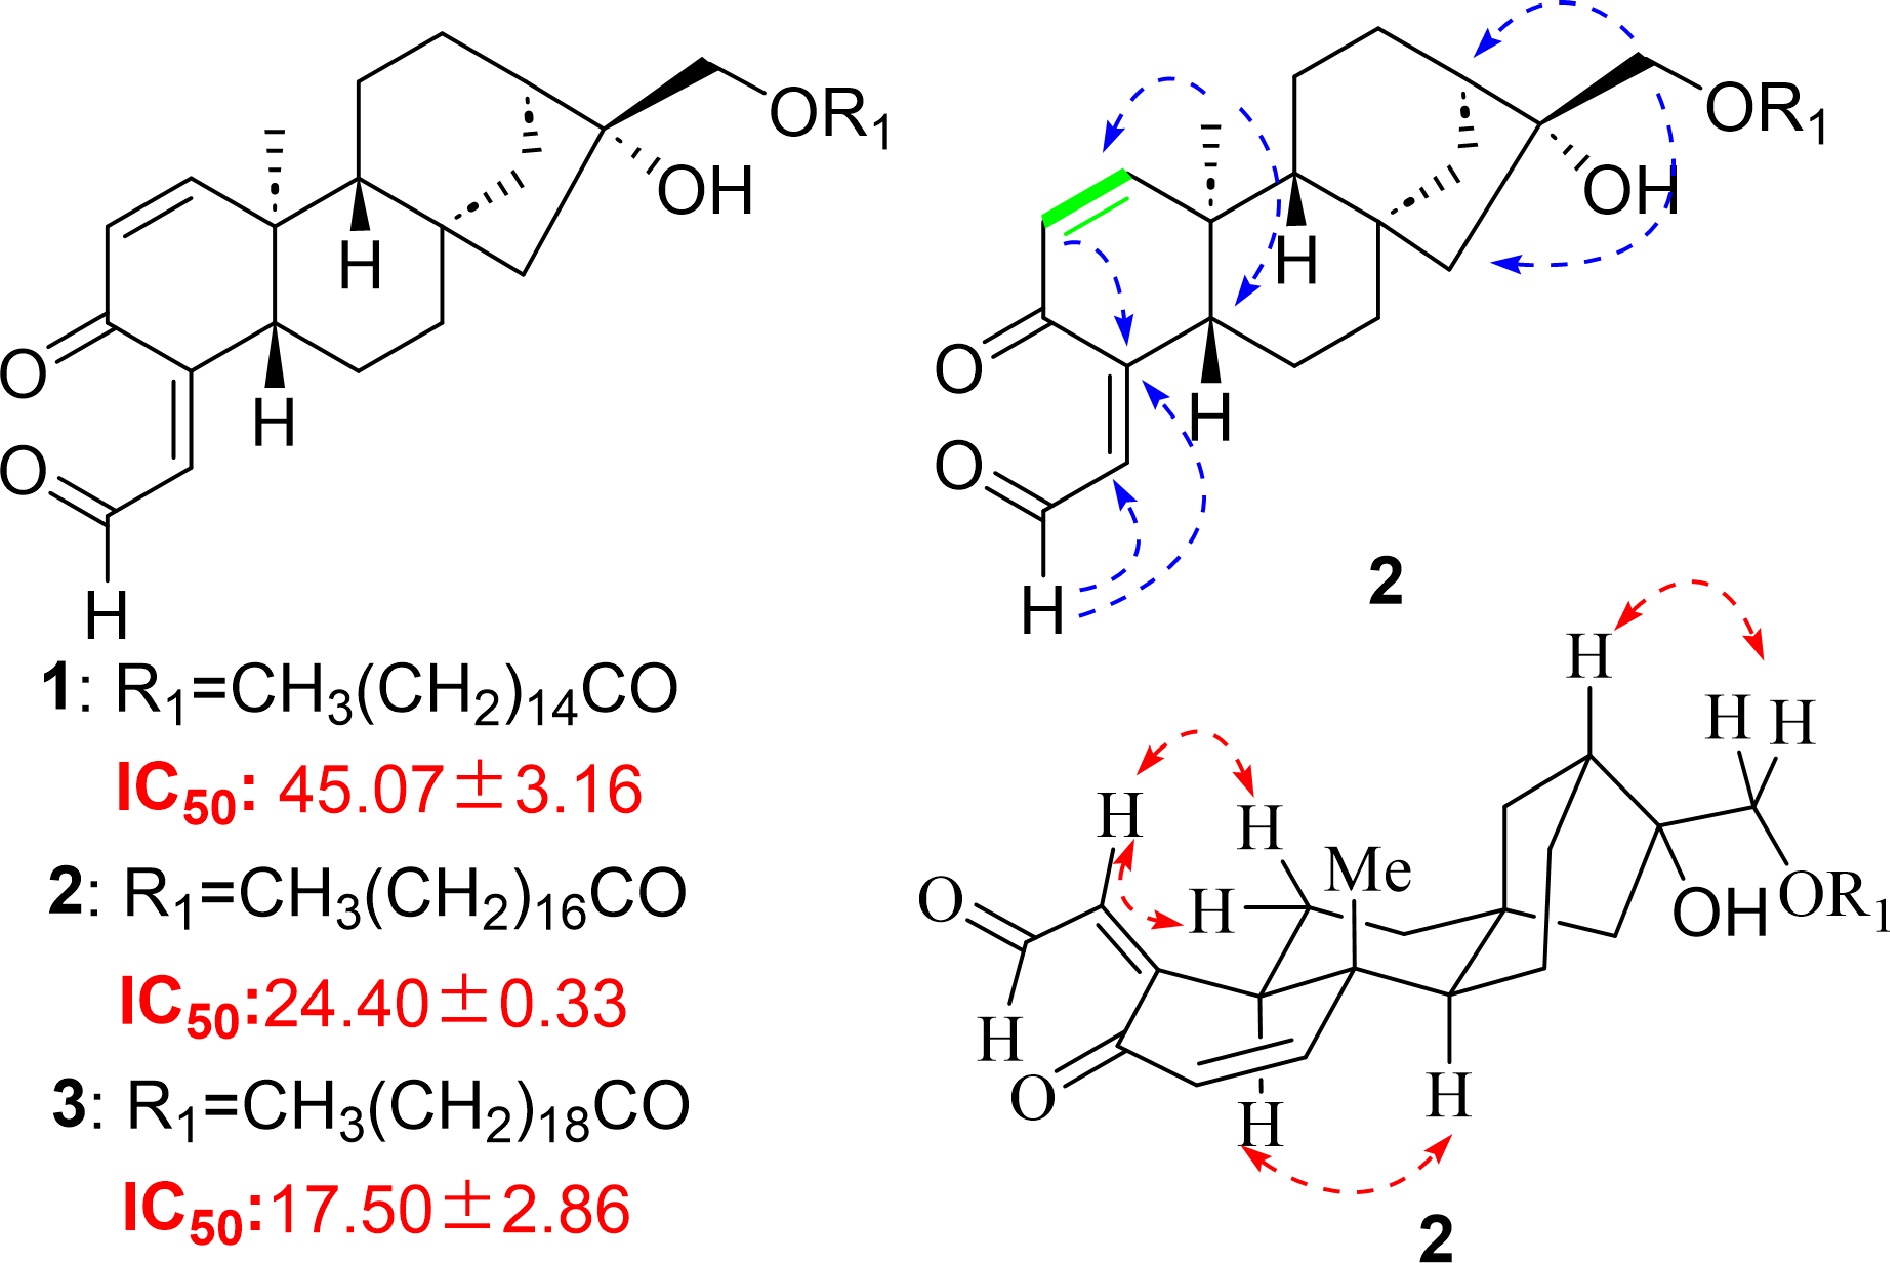
Figure 4.
Structures of compounds 1−3 and their IC50 to α-glucosidase (μM, data expressed as means ± SD, n = 3); Key 2D NMR correlations of compound 2.
-
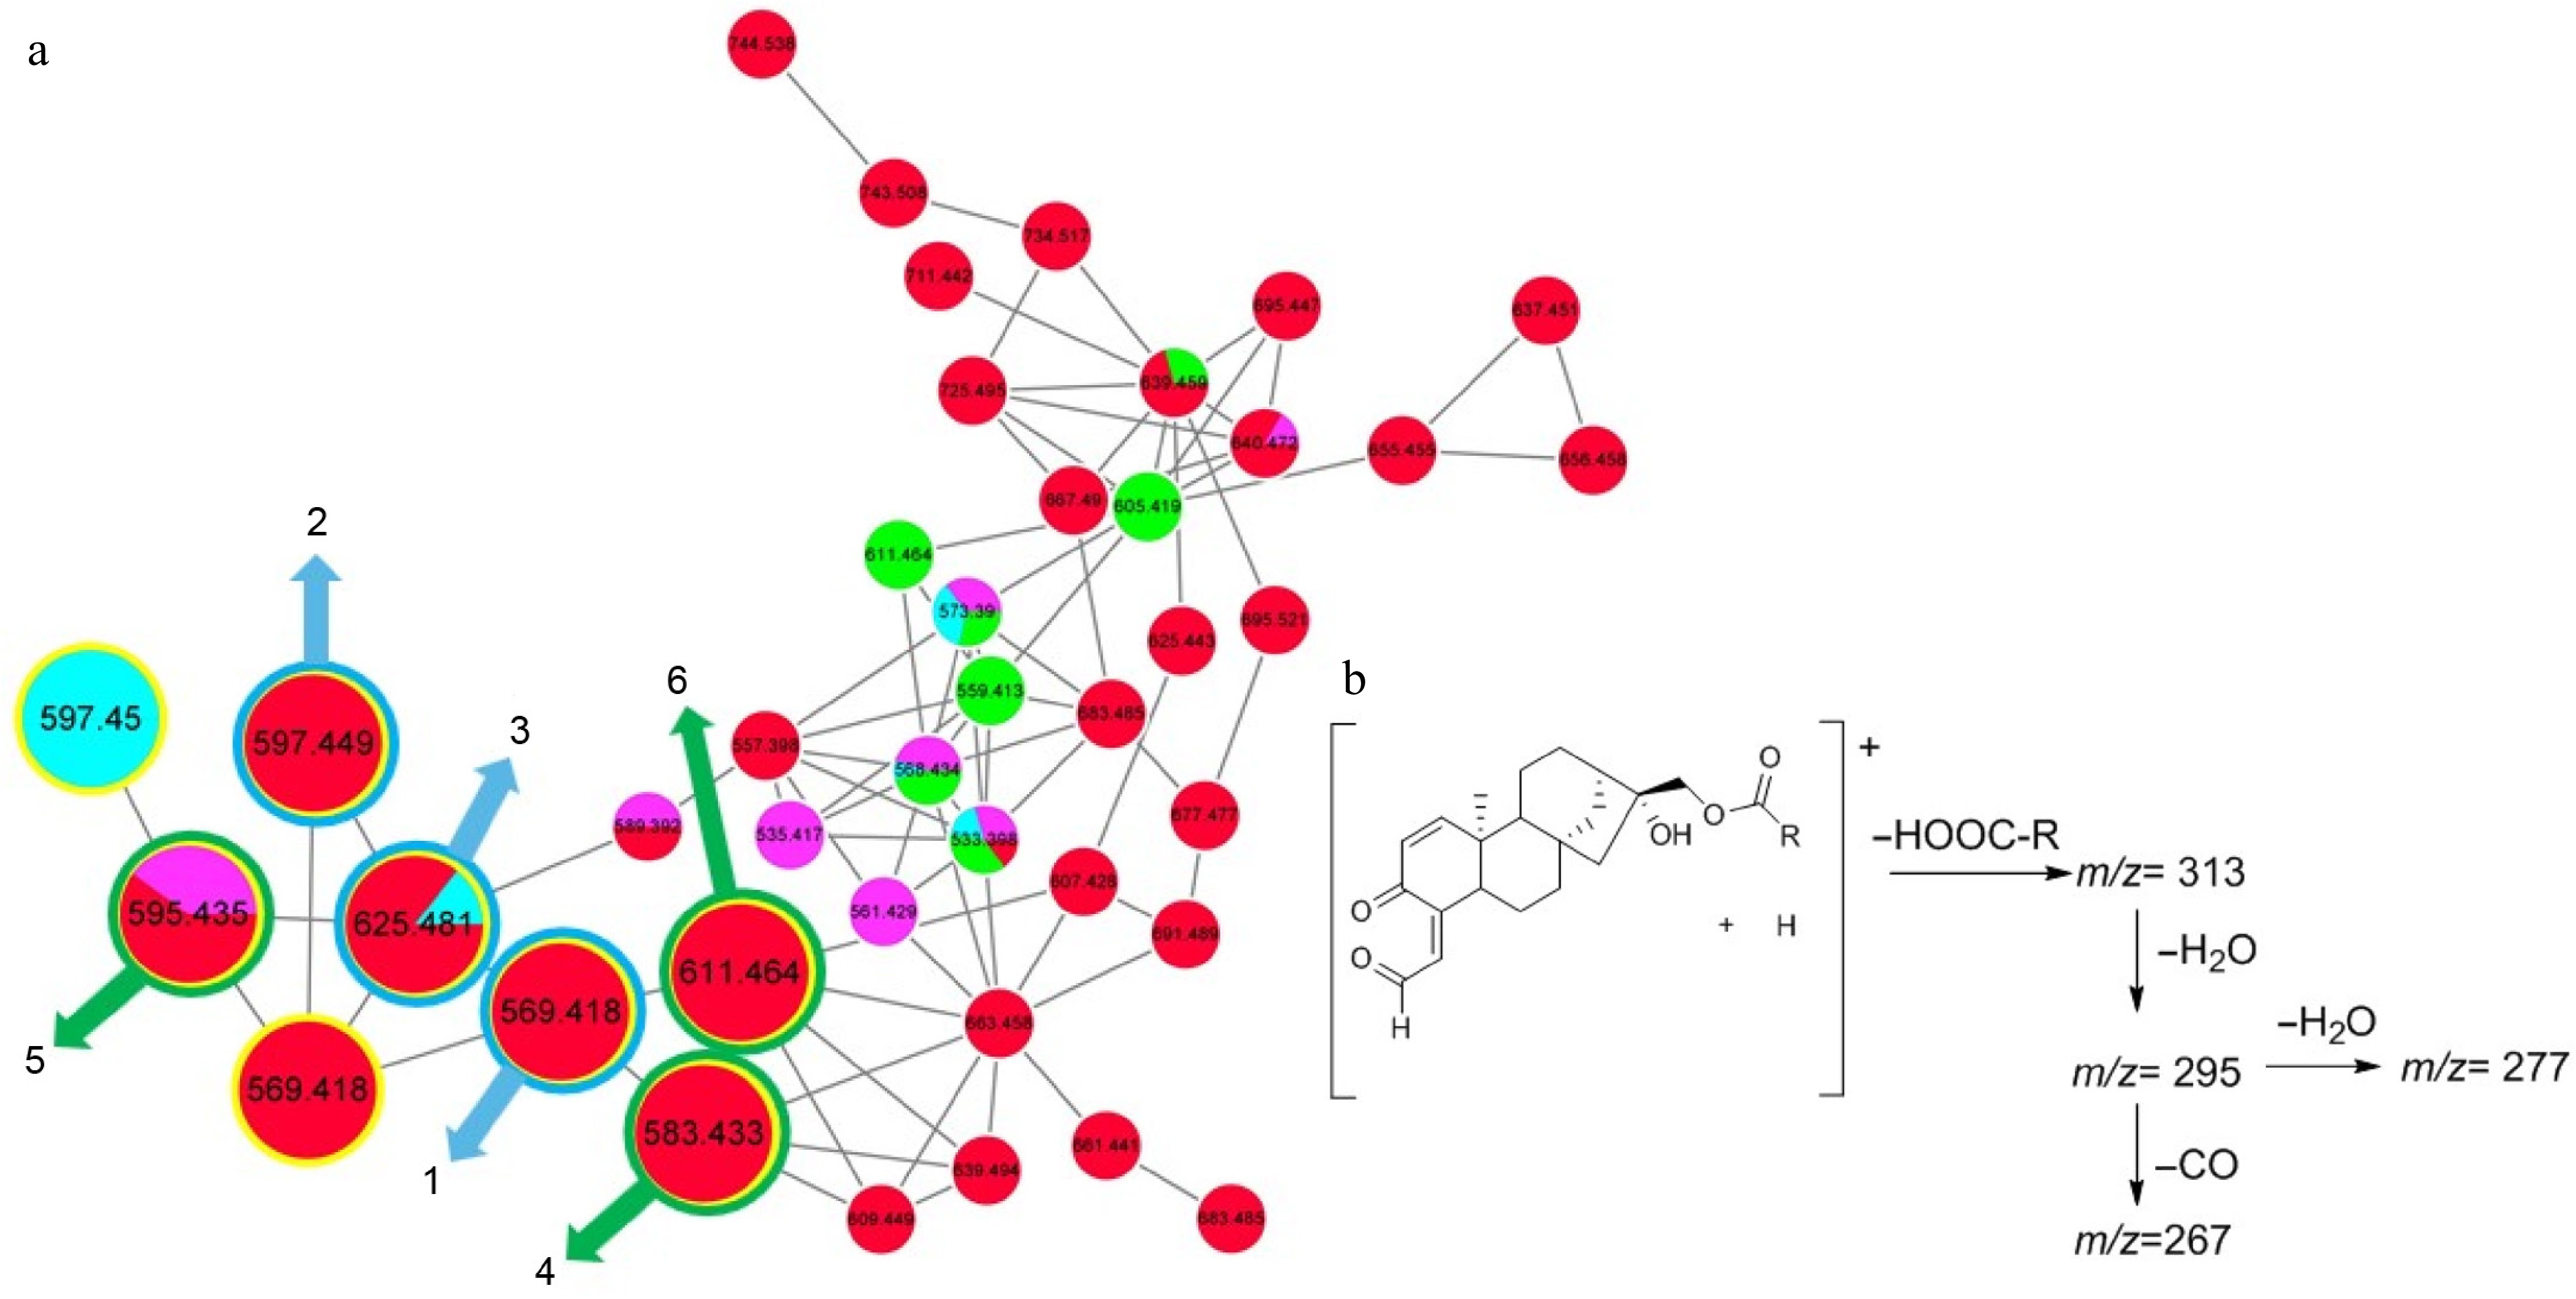
Figure 5.
(a) MN1 containing diterpenes (G1: Fr.1−Fr.5, green; G2: Fr.6-−Fr.8, blue; G3: Fr.9−Fr.13, red; G4: Fr.14−Fr.19, purple). (b) Possible formation pathways of characteristic fragments of compounds 1−6.
-
No. HRMS Formula Category Δ ppm 1 569.4178 C36H56O5 (M+H)+ 4.13 2 597.4492 C38H60O5 (M+H)+ 3.89 3 625.4799 C40H64O5 (M+H)+ 4.04 4 583.4329 C37H58O5 (M+H)+ 4.52 5 595.4339 C38H58O5 (M+H)+ 3.22 6 611.4650 C39H62O5 (M+H)+ 3.71 Table 1.
The HRESIMS data of compounds 1−6.
Figures
(5)
Tables
(1)