-
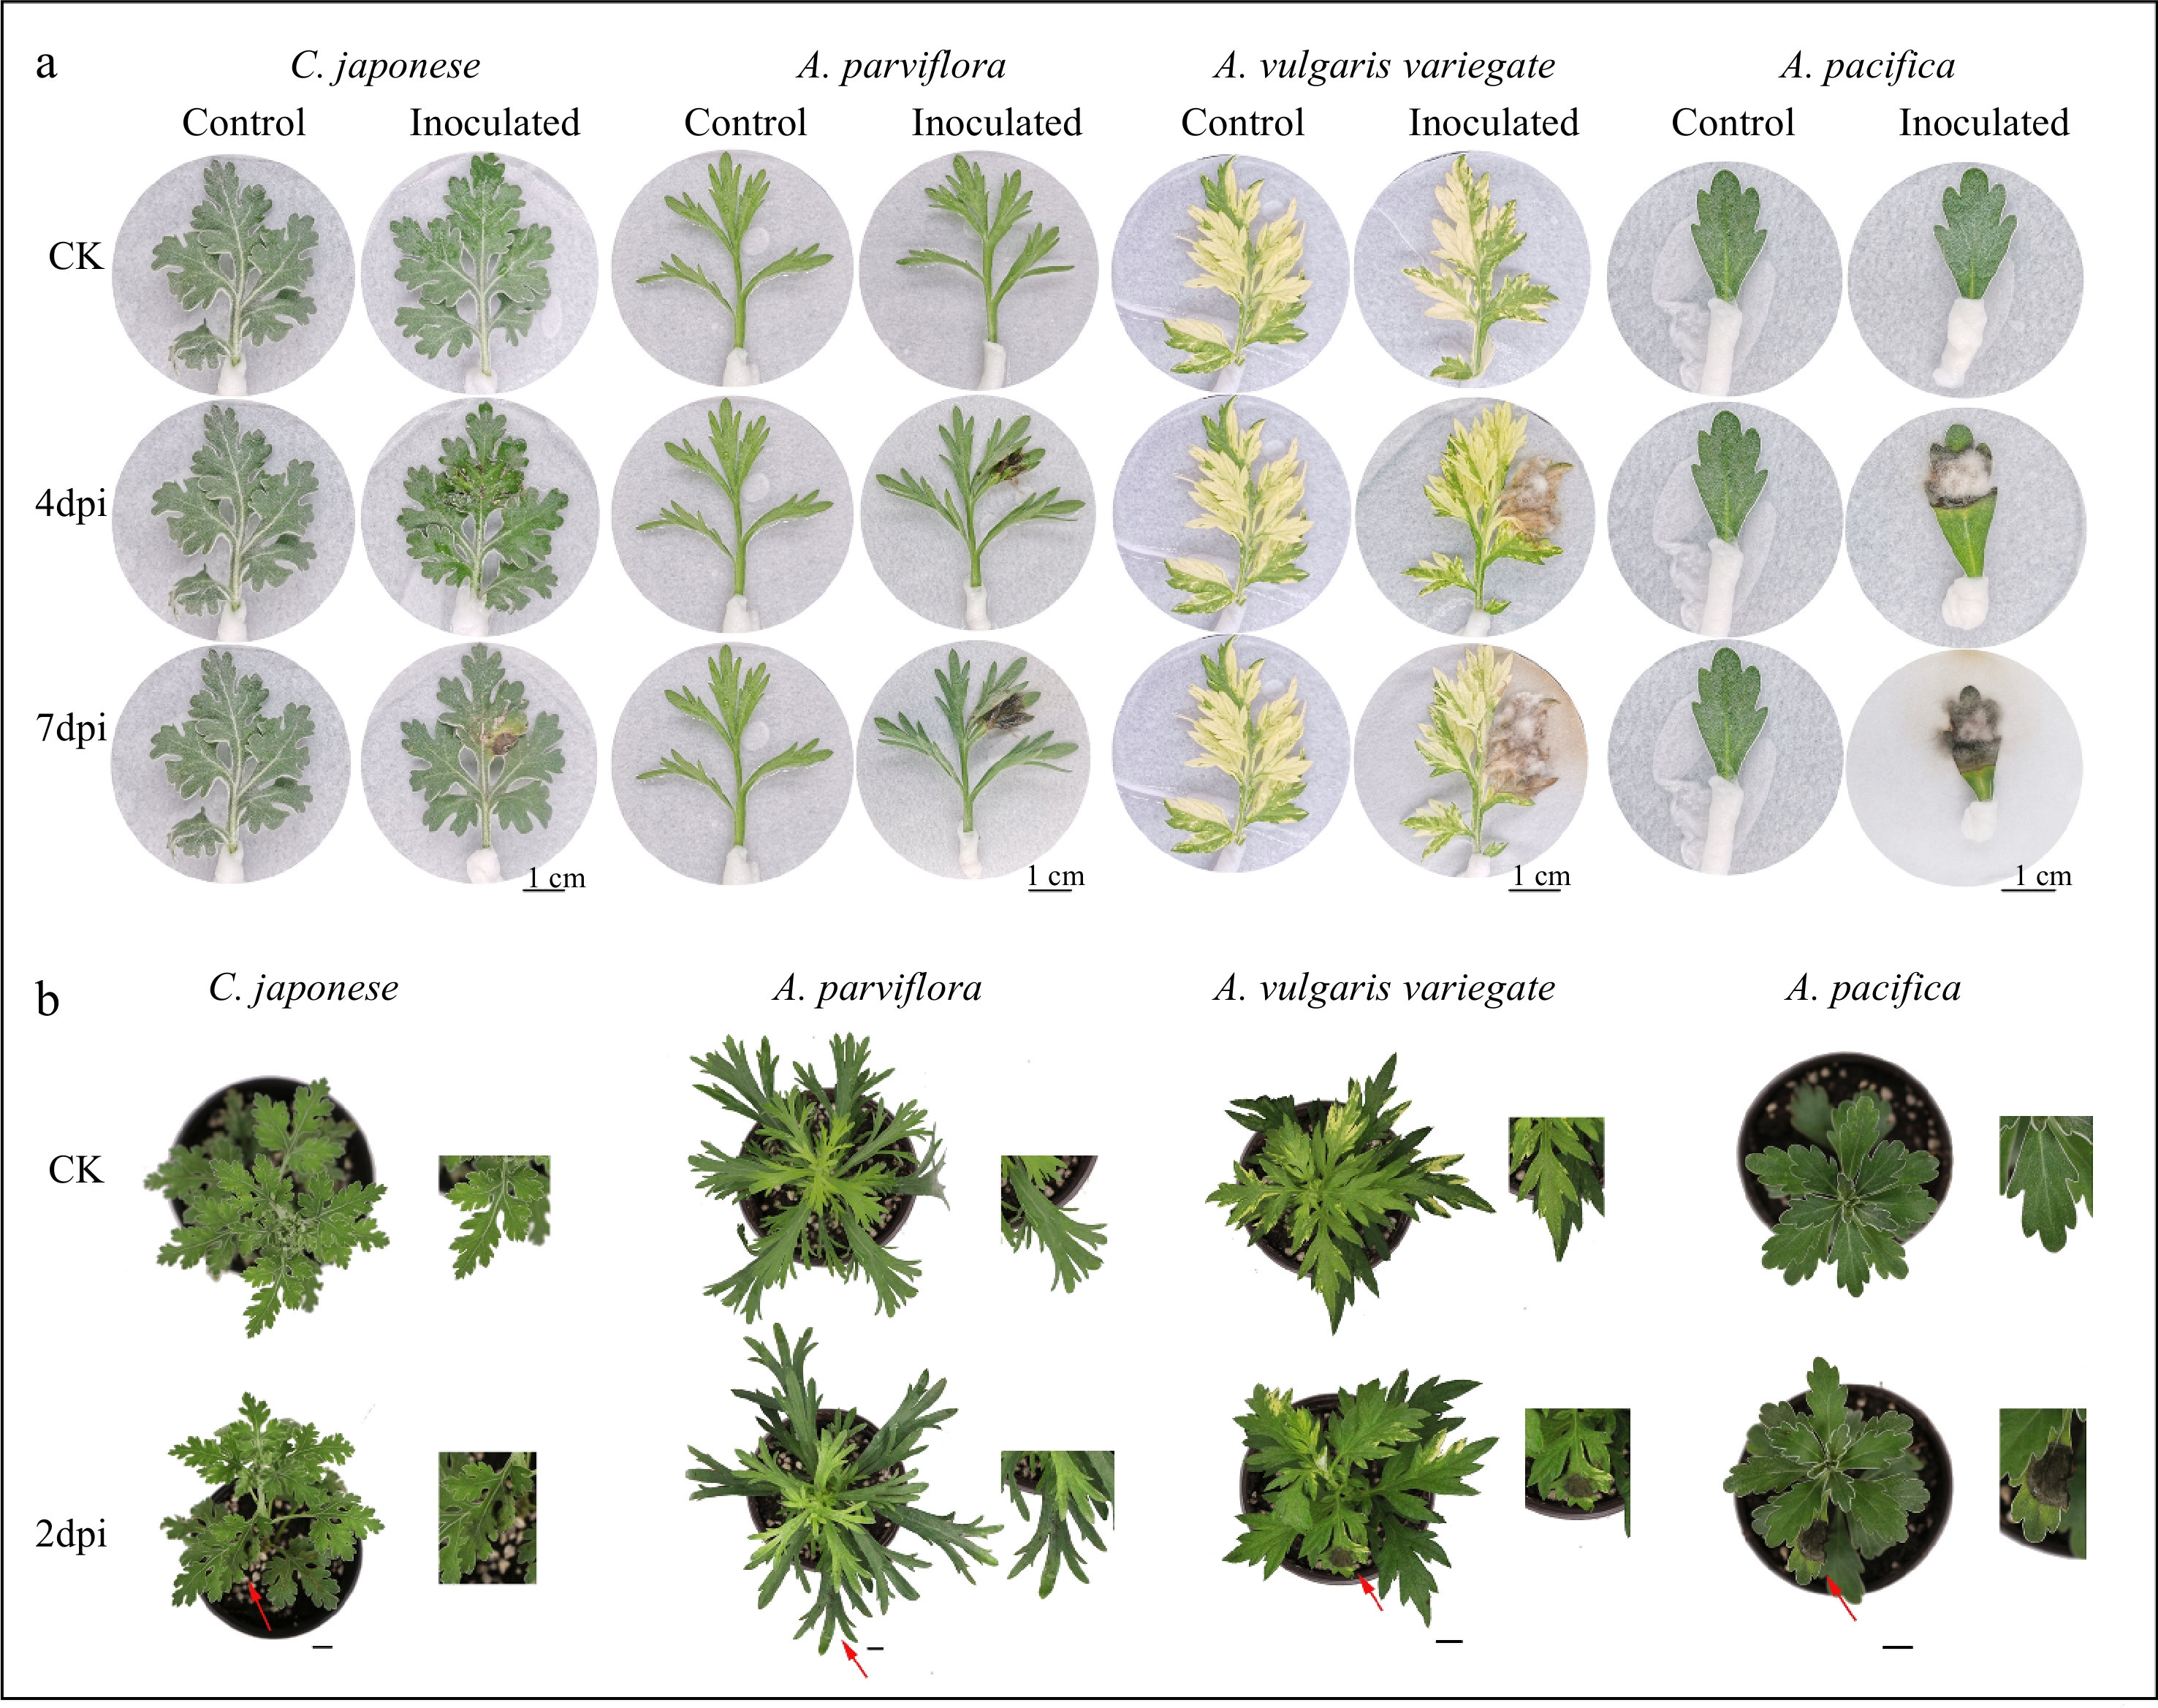
Figure 1.
Differences in disease phenotype of different plants after inoculation. From left to right: the disease degree of leaves deepens. n = 15. (a) Disease symptoms on 4 and 7 d after inoculation of isolated leaves. (b) Disease symptoms of whole plants at post 2 d inoculation. Scale bar = 1 cm.
-
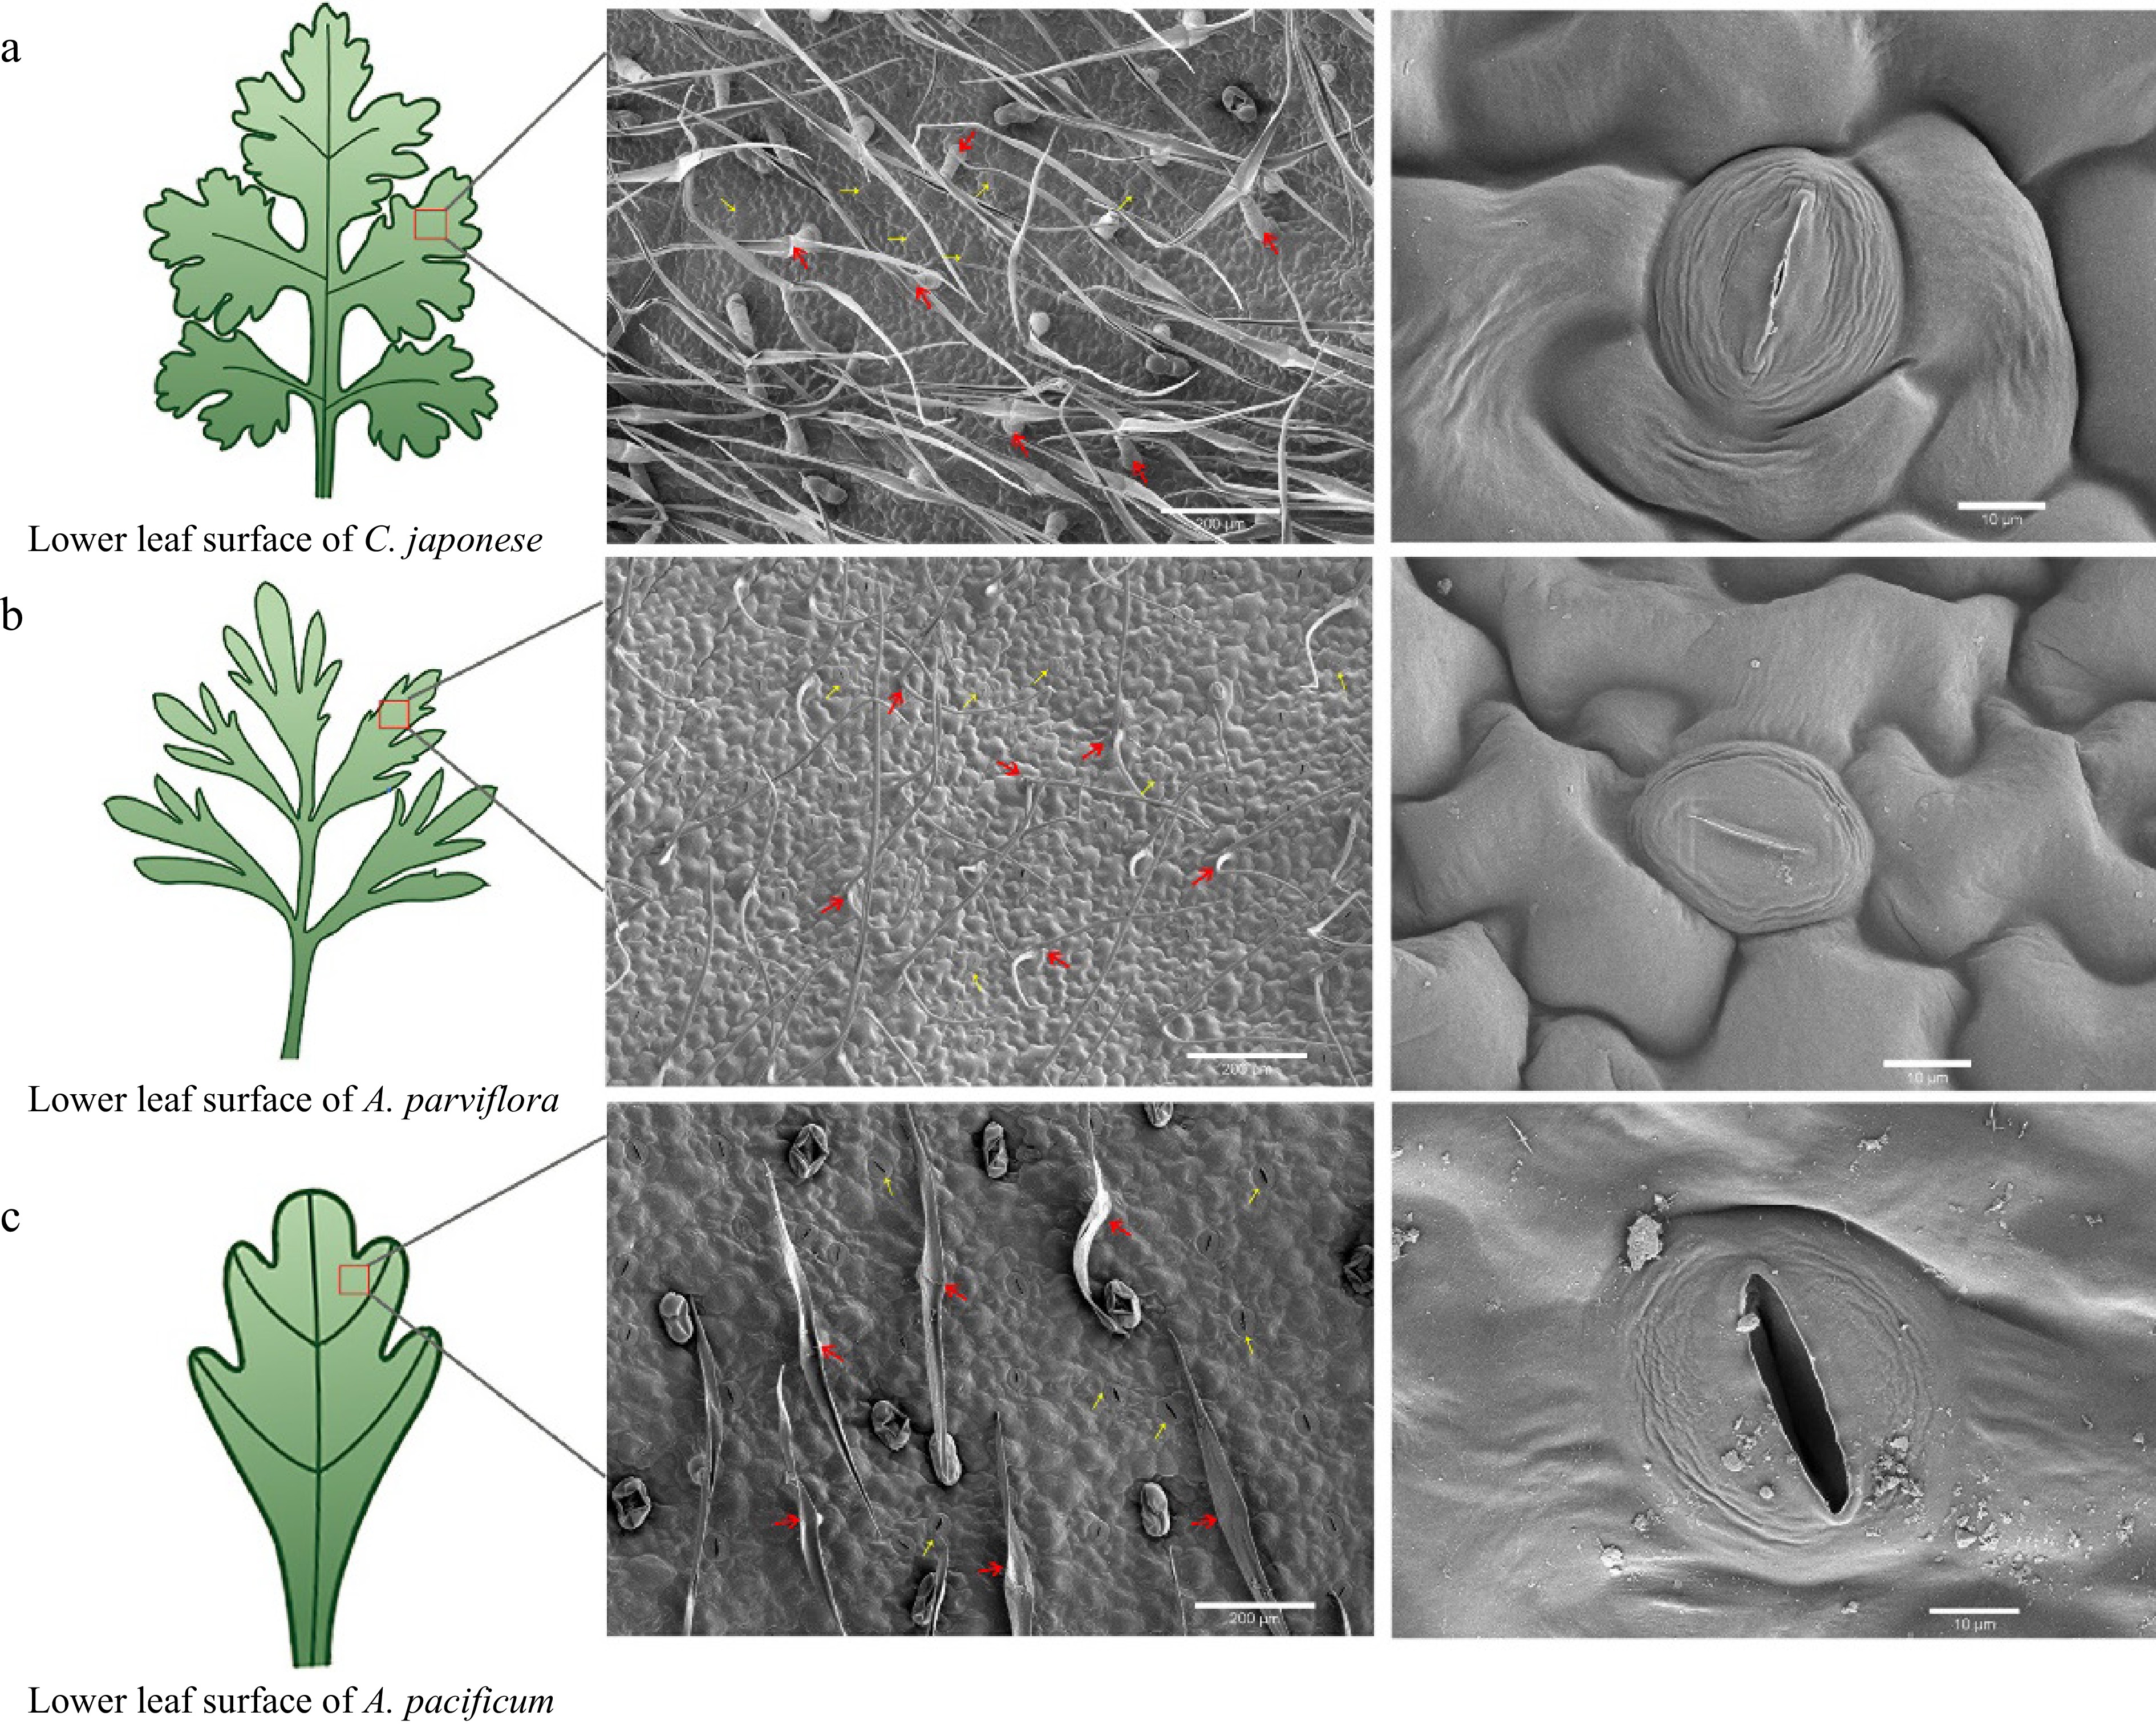
Figure 2.
Scanning electron microscopy (SEM) images of the lower epidermis of leaves from disease-resistant and susceptible materials. From left to right, the parts that were observed under the scanning electron microscope (red box part) showed the distribution and shape of trichome and stomata respectively. The red arrows indicate epidermal hairs, and the yellow arrows point to the stomata.
Figures
(2)
Tables
(0)