-
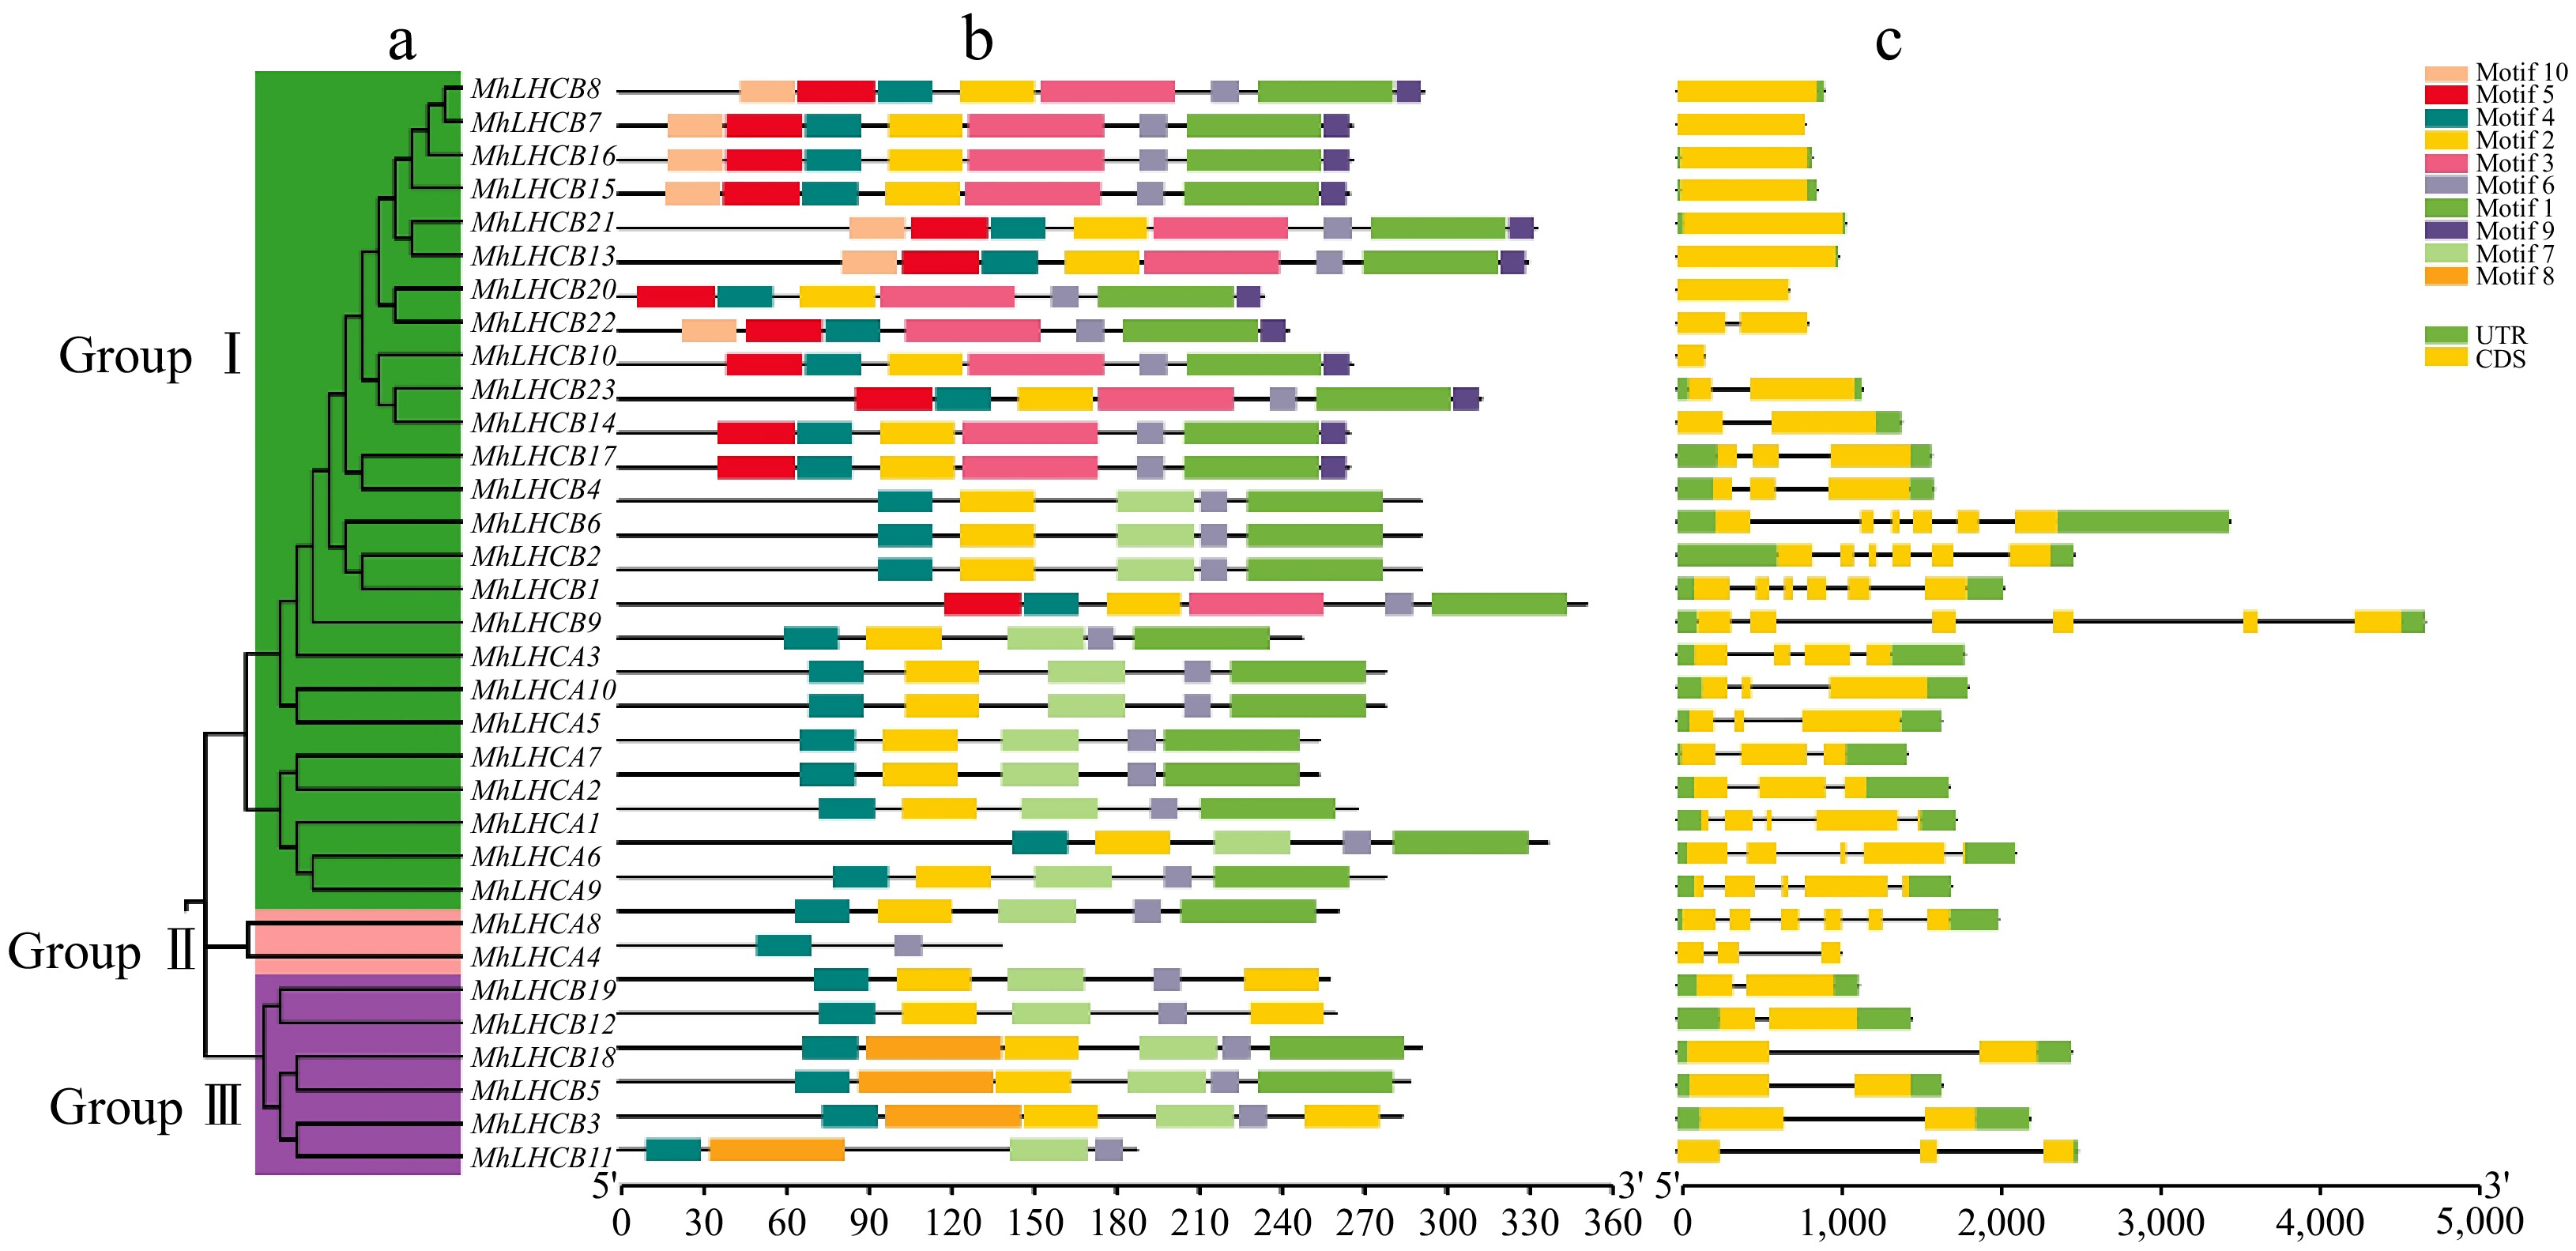
Figure 1.
Phylogenetic relationships, architecture of conserved protein motifs, and gene structure in MhLHC gene family from apple. (a) The phylogenetic tree was constructed based on the full-length sequences of MhLHC family proteins using MEGA-X software. Details of clusters are shown in different colors. (b) The motif composition of MhLHC proteins. The motifs, numbers 1−10, are displayed in different colored boxes. The scale at the bottom can be used to estimate the length of the protein. (c) Exon-intron structure of MhLHC genes family. Green boxes represent untranslated 5'- and 3'-regions; yellow boxes denote exons; black lines indicate introns.
-
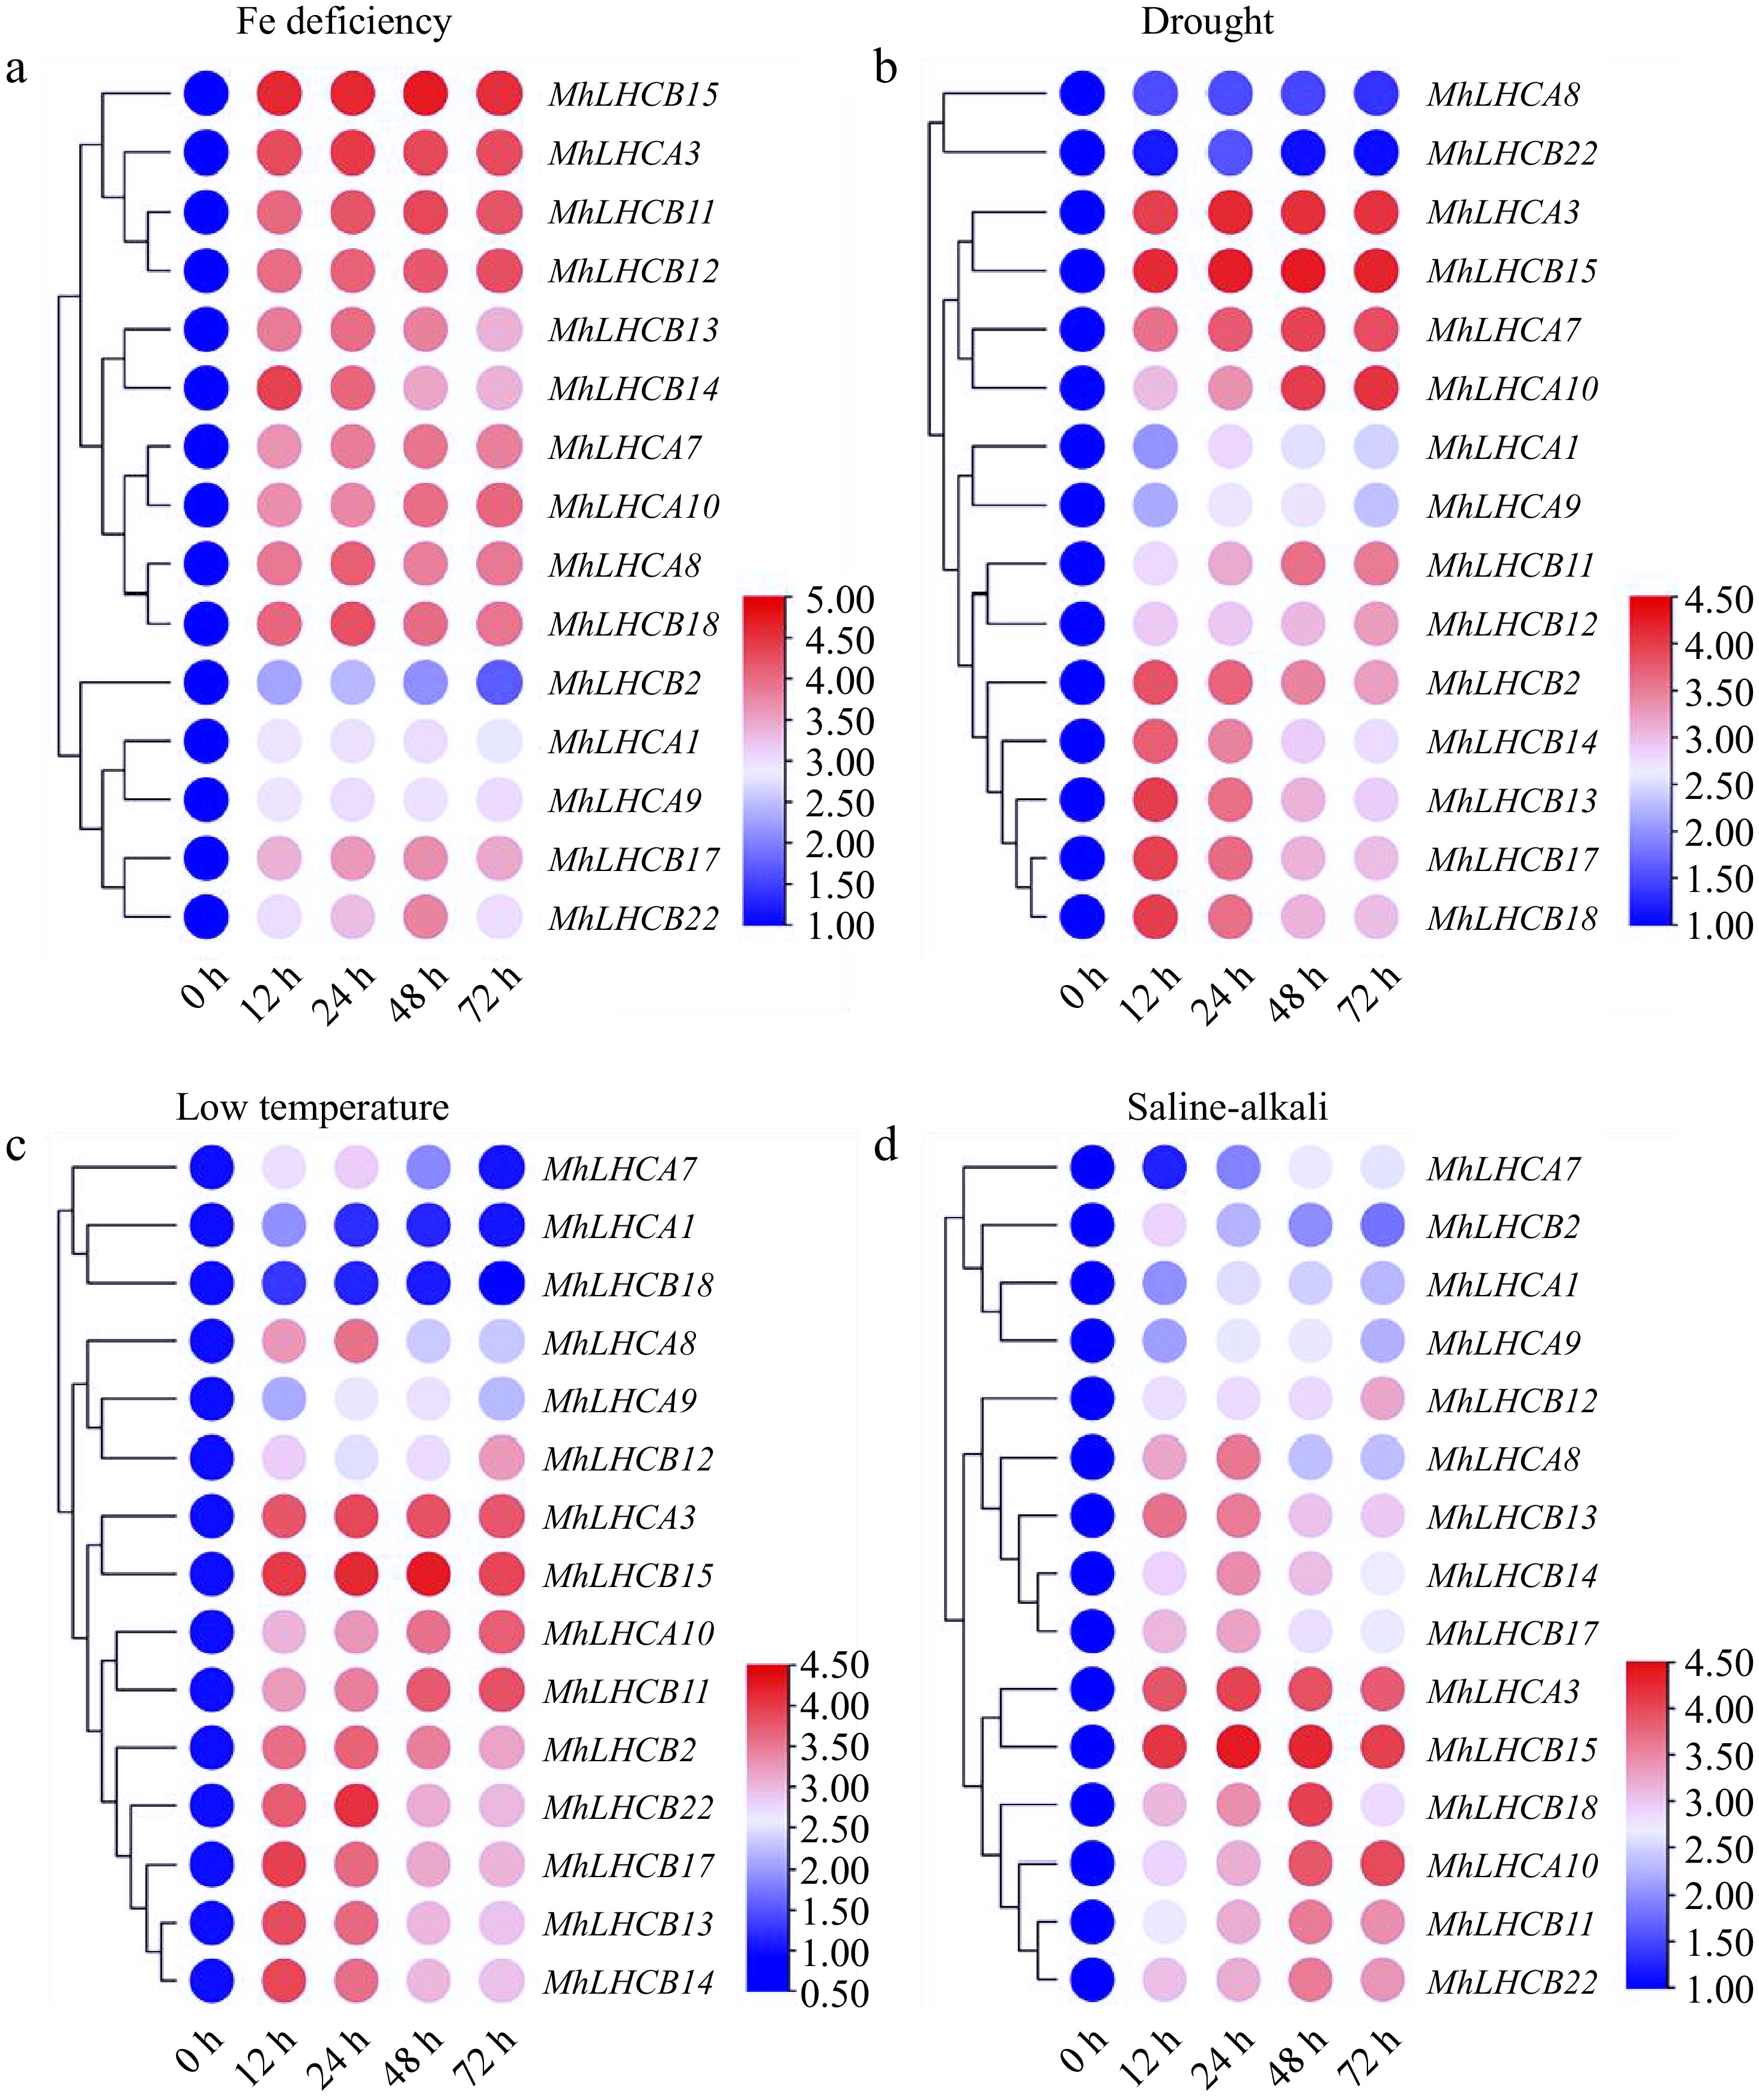
Figure 2.
Heat map relative expression levels of MhLHC genes in M. halliana leaf cultures on abiotic stress medium at 0, 12, 24, 48, and 72 h. (a) Fe deficiency (0 μM Fe), (b) drought stress (15% PEG 6000), (c) low temperature (4 °C), (d) saline-alkali stress (200 mmol/L NaCl + NaHCO3).
-
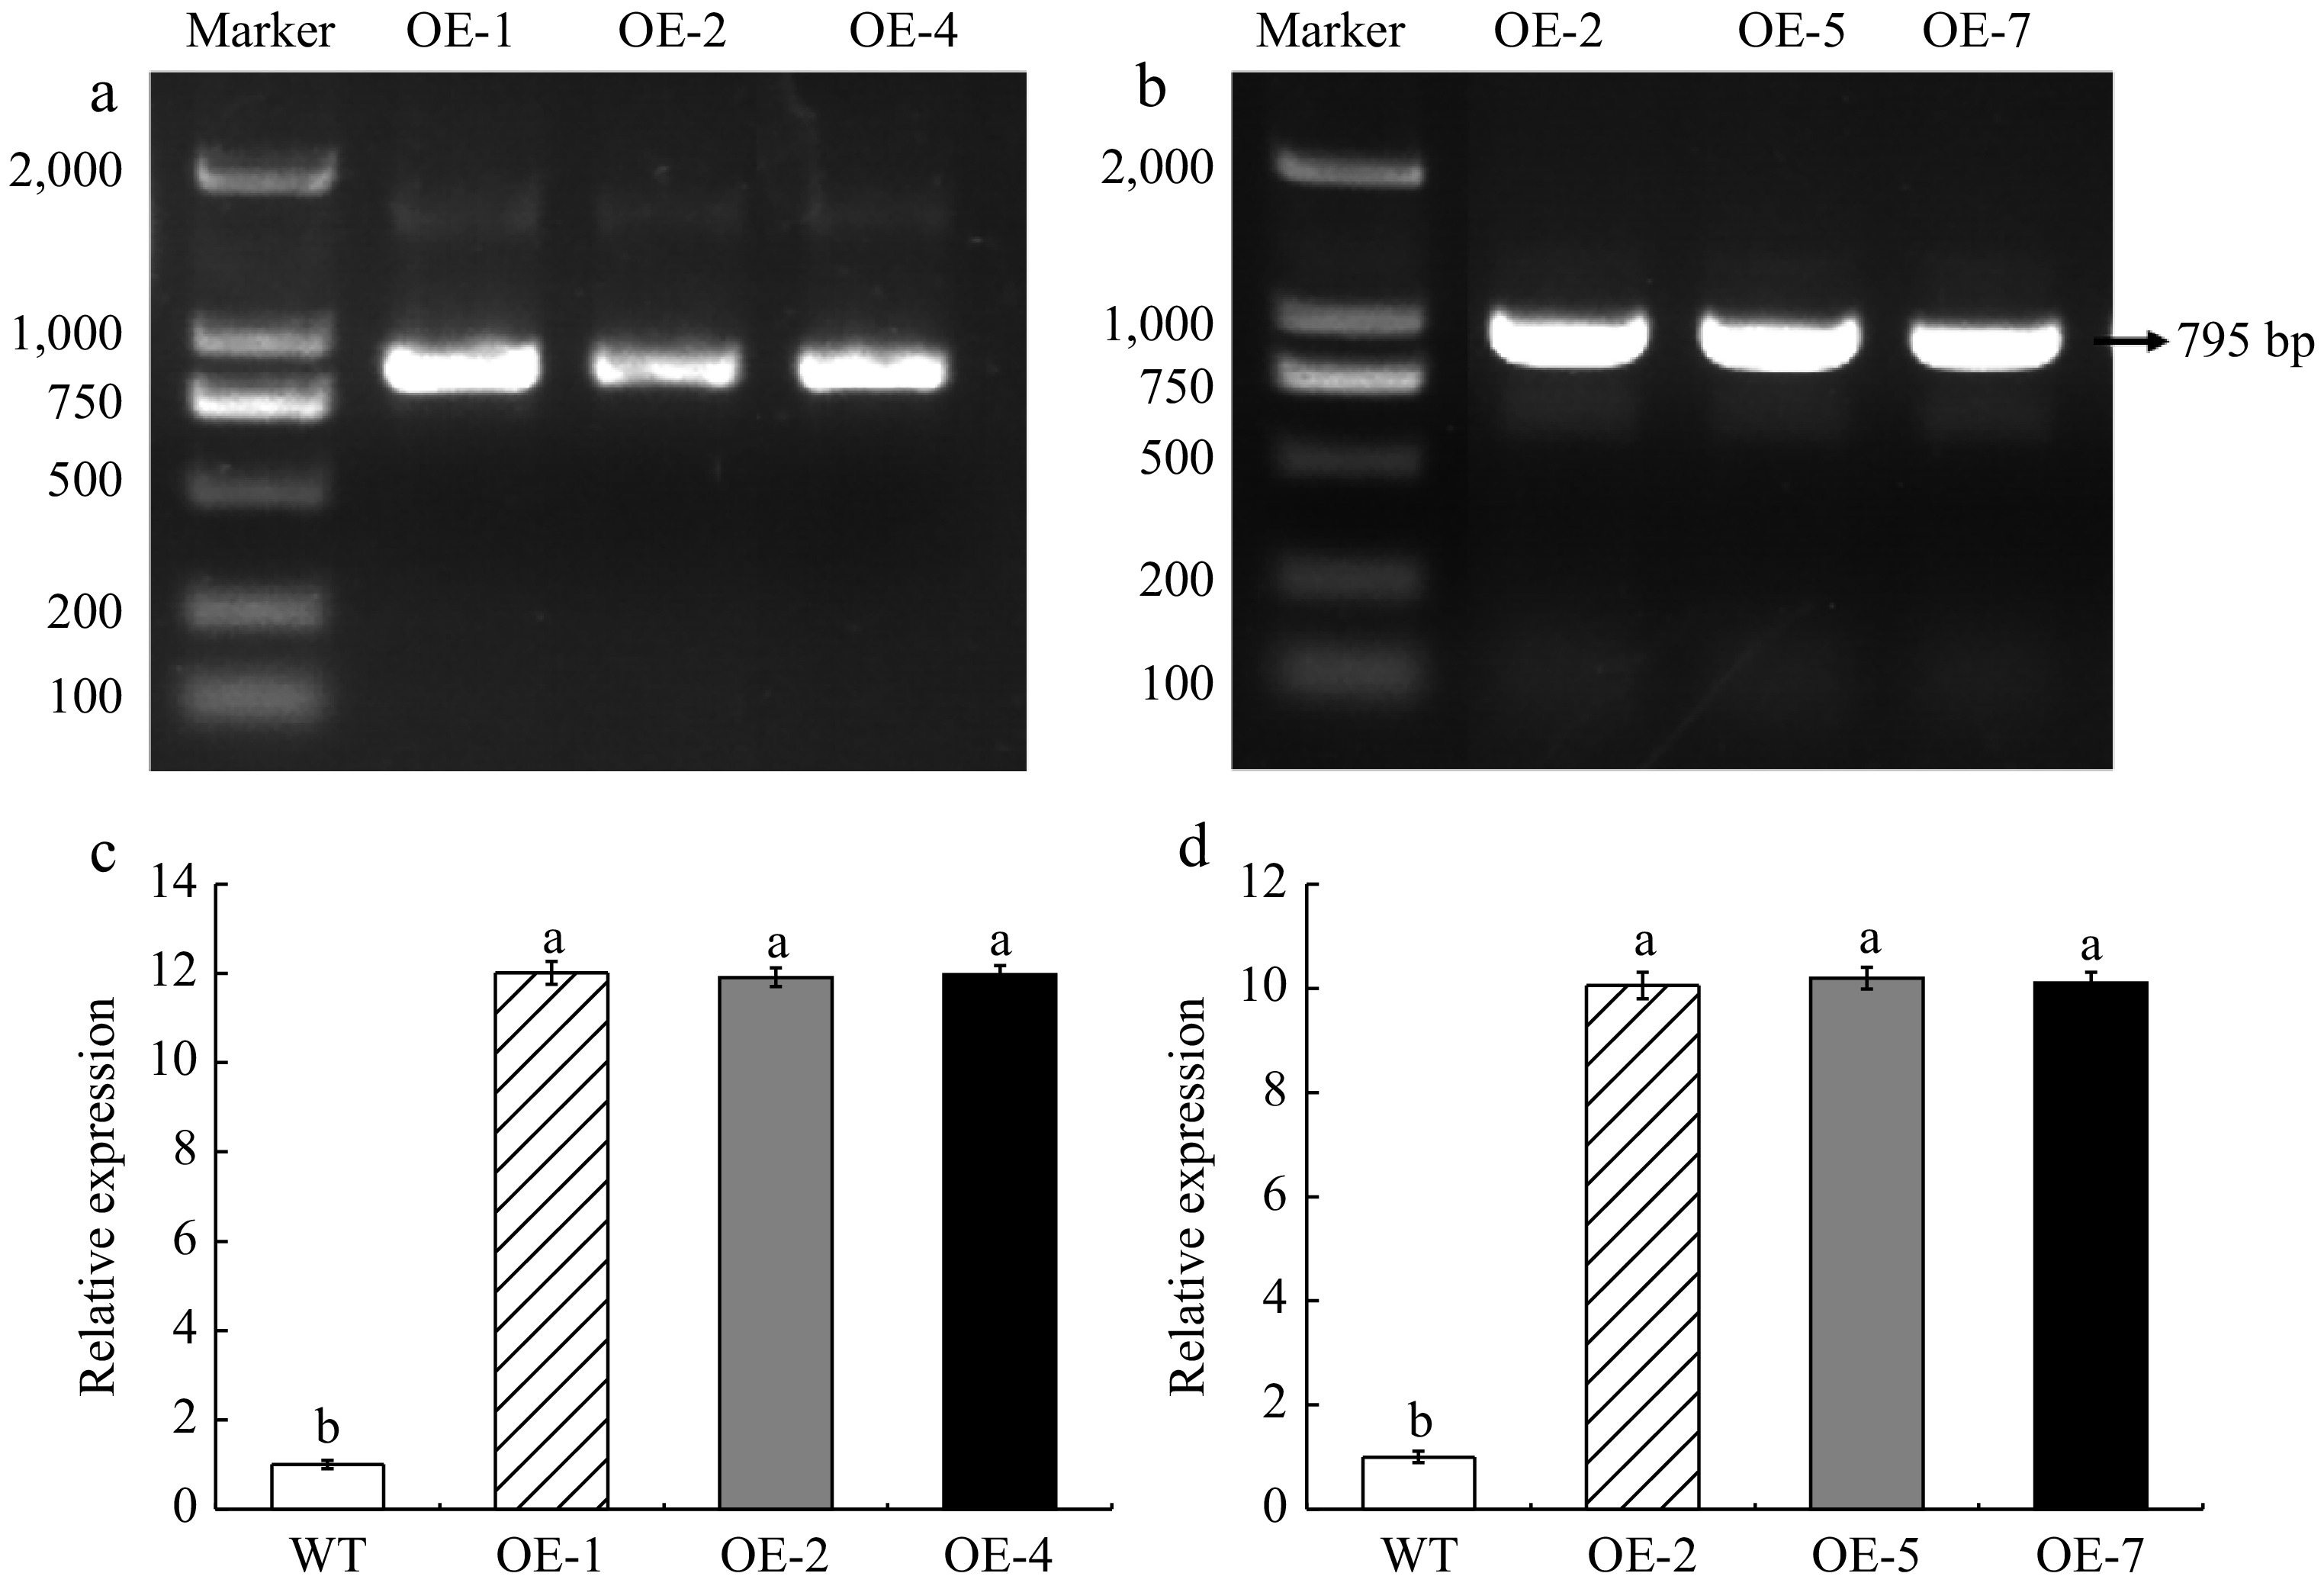
Figure 3.
Identification of genetically modified material. (a) DNA identification of transgenic A. thaliana. (b) DNA identification of overexpressed apple calli. (c) Expression level of MhLHCB15 in A. thaliana. (d) Expression level of MhLHCB15 in apple calli. Resistance of transgenic MhLHCB15 A. thaliana and apple calli to Fe (iron) deficiency stress. Different letters above the bars indicated signifcant differences (p < 0.05) as assessed by one-way ANOVA and the least significant difference (LSD) test.
-
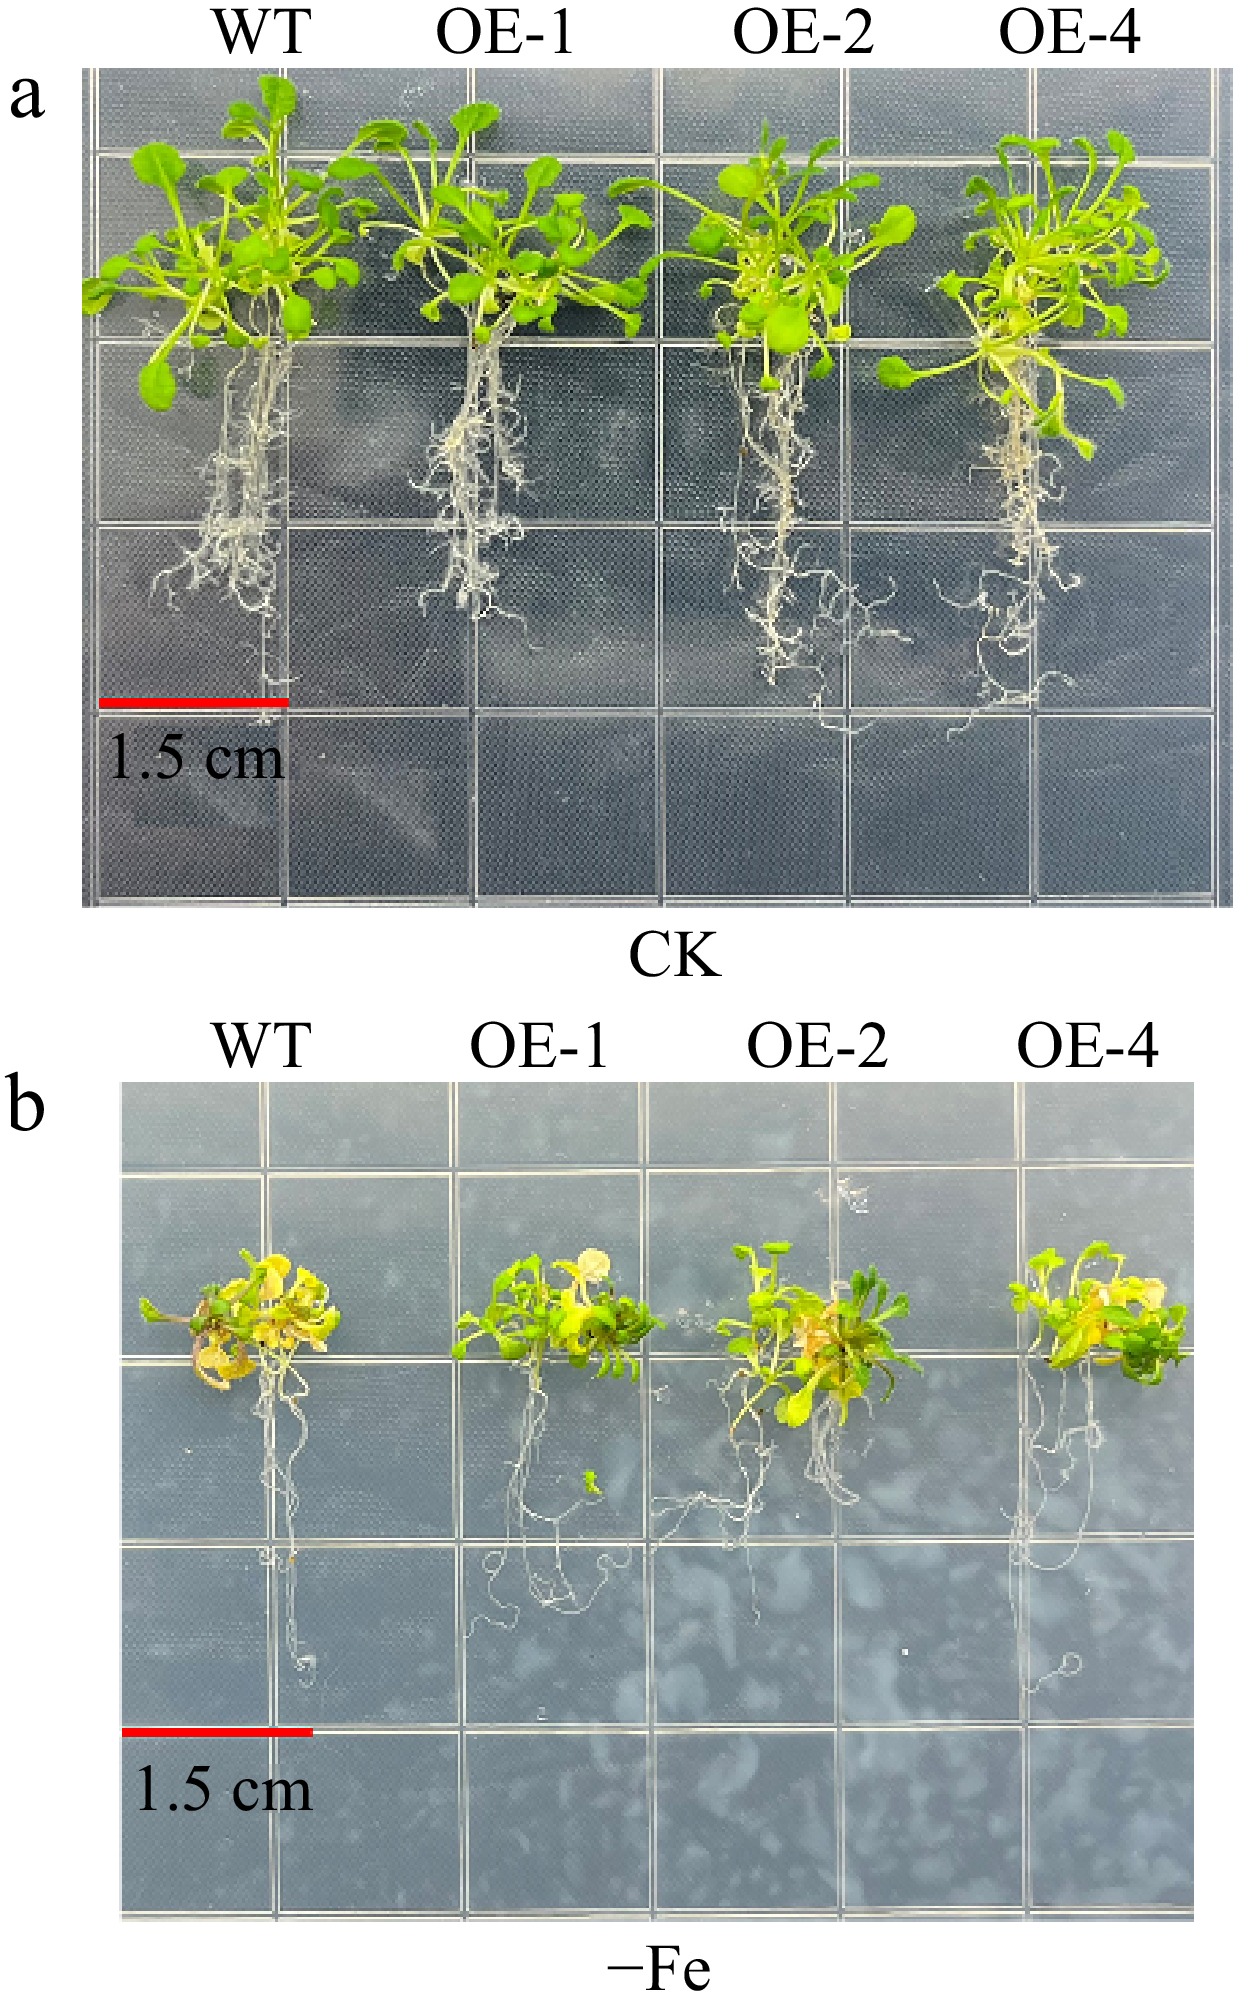
Figure 4.
The phenotypes of MhLHCB15 transgenic and wild-type (WT) A. thaliana grown for 20 d on Fe-sufficient or Fe-deficient medium. (a) Fe-sufficient (CK), (b) Fe-deficient (−Fe).
-
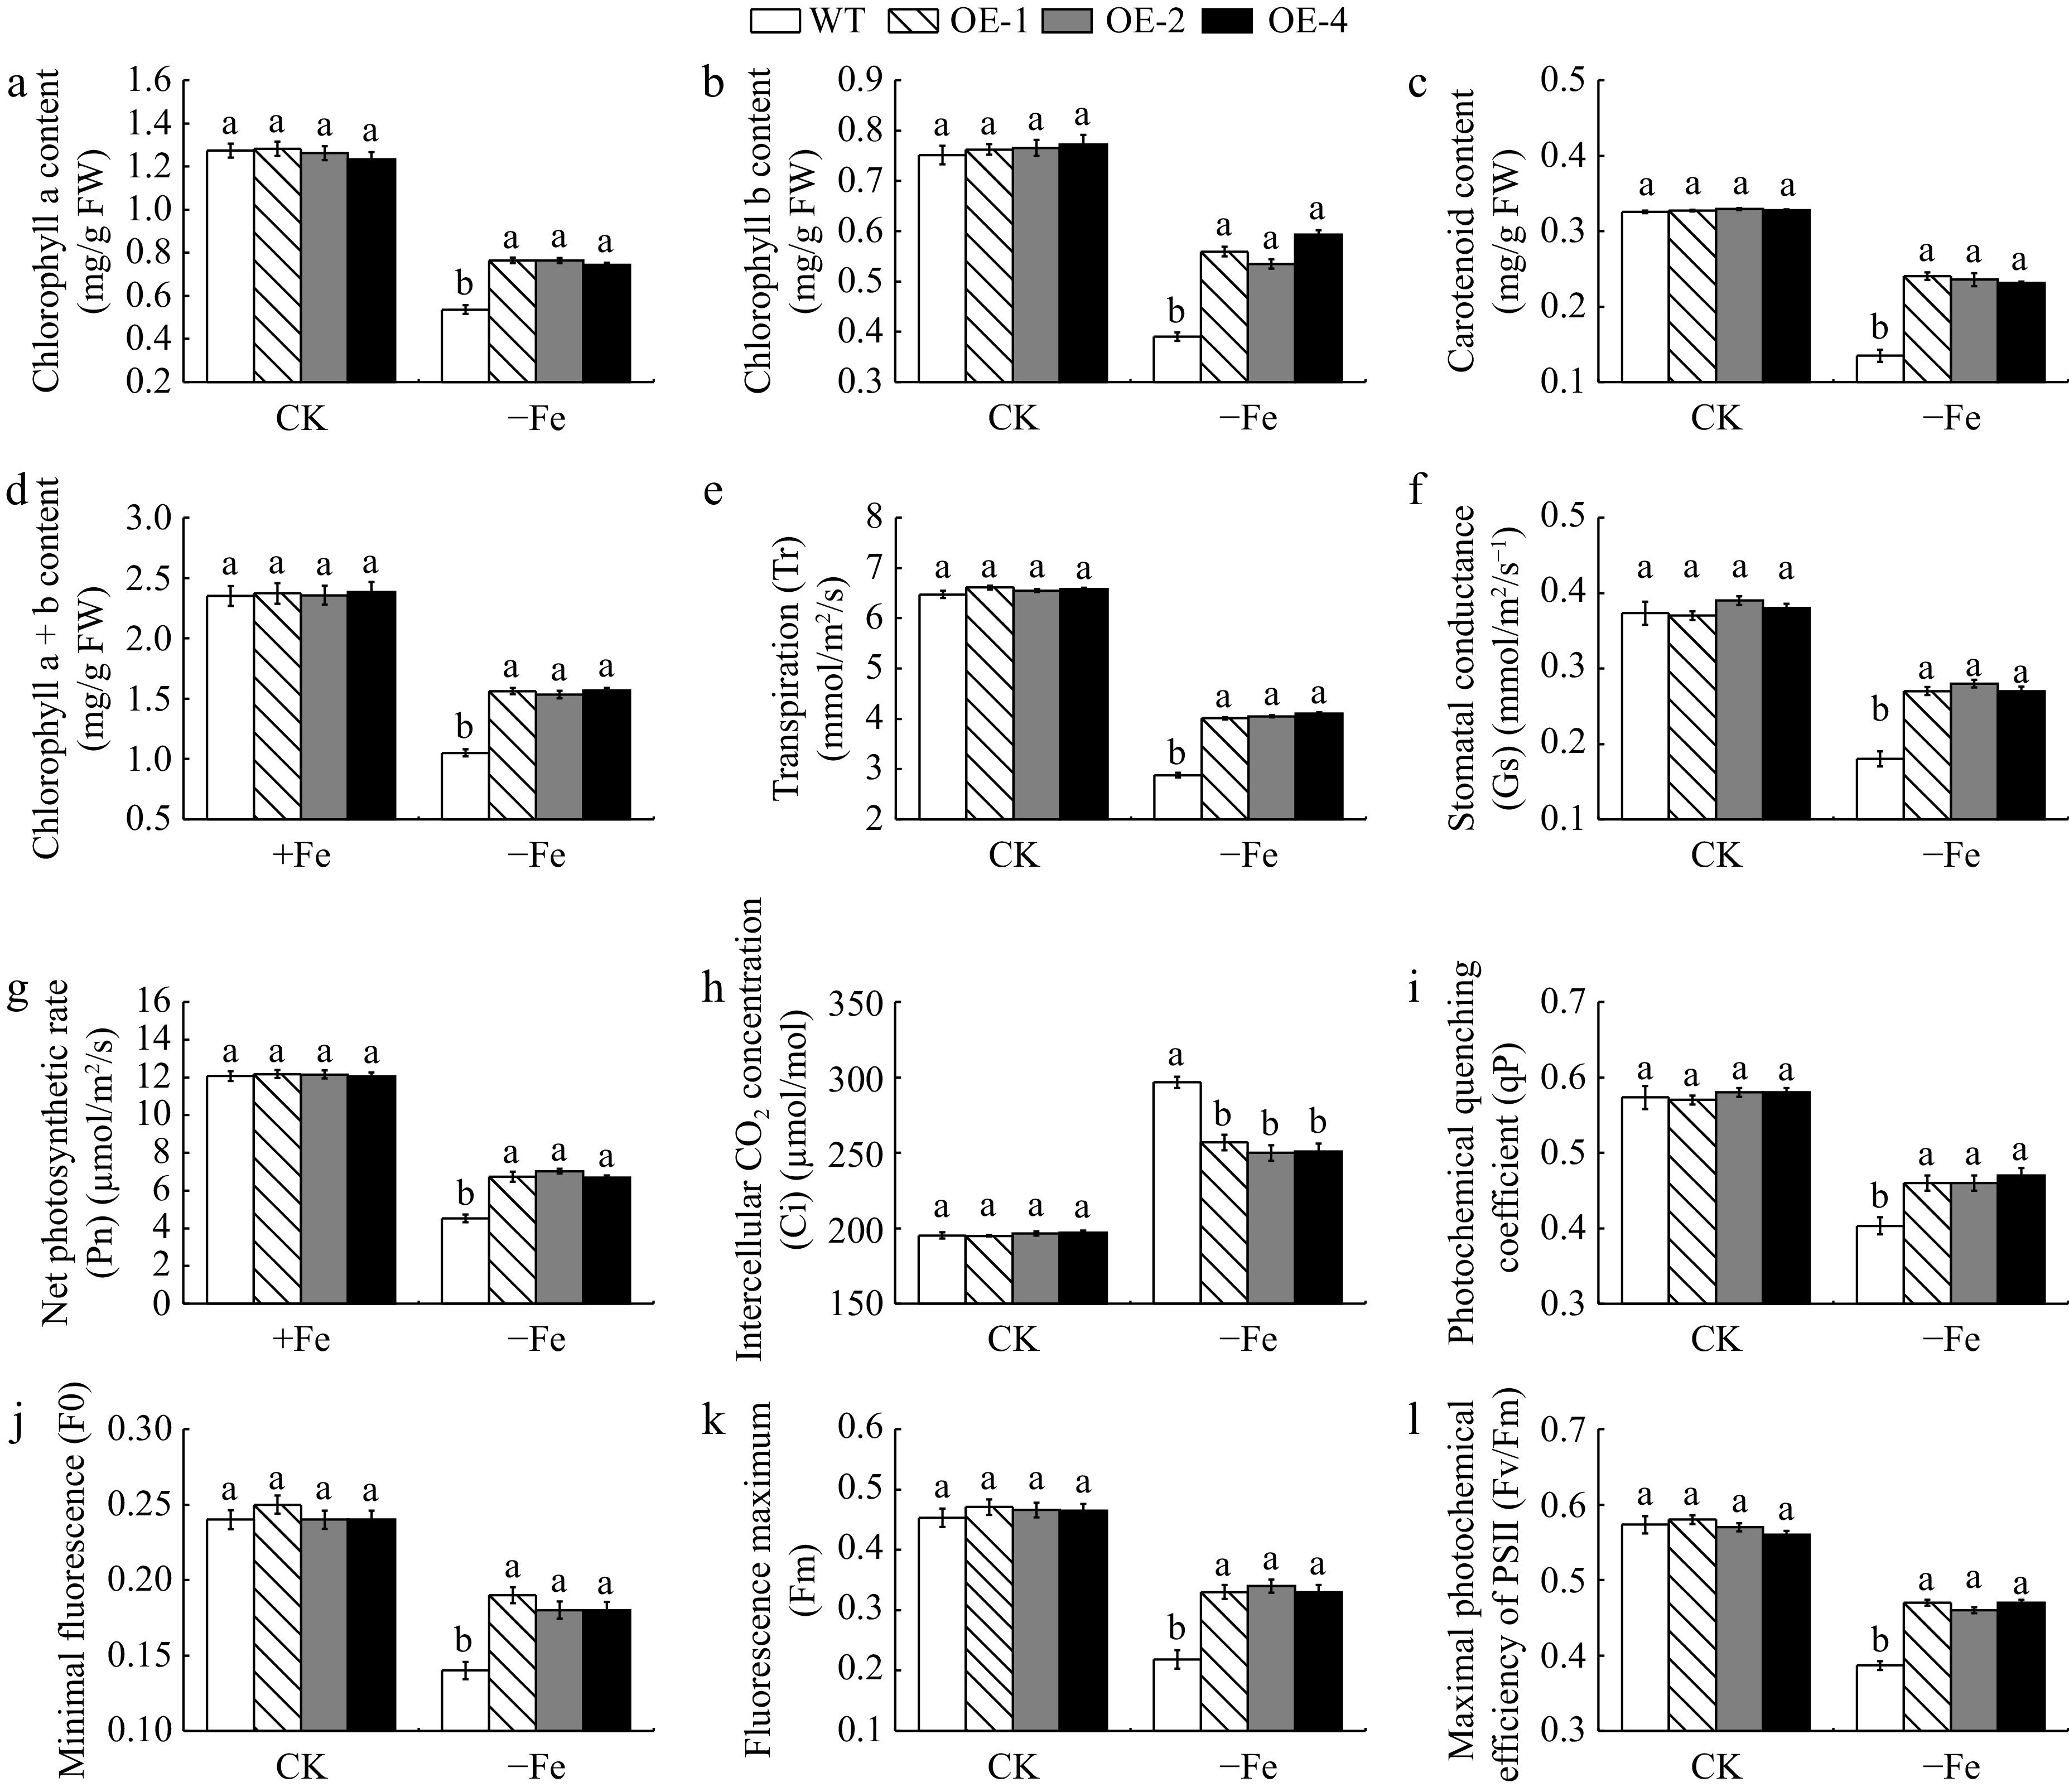
Figure 5.
The photosynthetic pigment content and photosynthetic fluorescence parameters of MhLHCB15 transgenic and wild type (WT) A. thaliana grown for 20 d under Fe-sufficient (CK) or Fe-deficient (−Fe) conditions. (a) Chlorophyll a content, (b) chlorophyll b content, (c) carotenoid content, (d) chlorophyll a+b content, (e) transpiration (Tr), (f) stomatal conductance (Gs), (g) net photosynthetic rate (Pn), (h) intercellular CO2 concentration (Ci), (i) photochemical quenching coefficient (qP), (j) minimal fluorescence (F0), (k) fluorescence maximum (Fm), (l) maximal photochemical efficiency of PSII (Fv/Fm). Different lowercase letters showed significant difference at the level of p < 0.05.
-
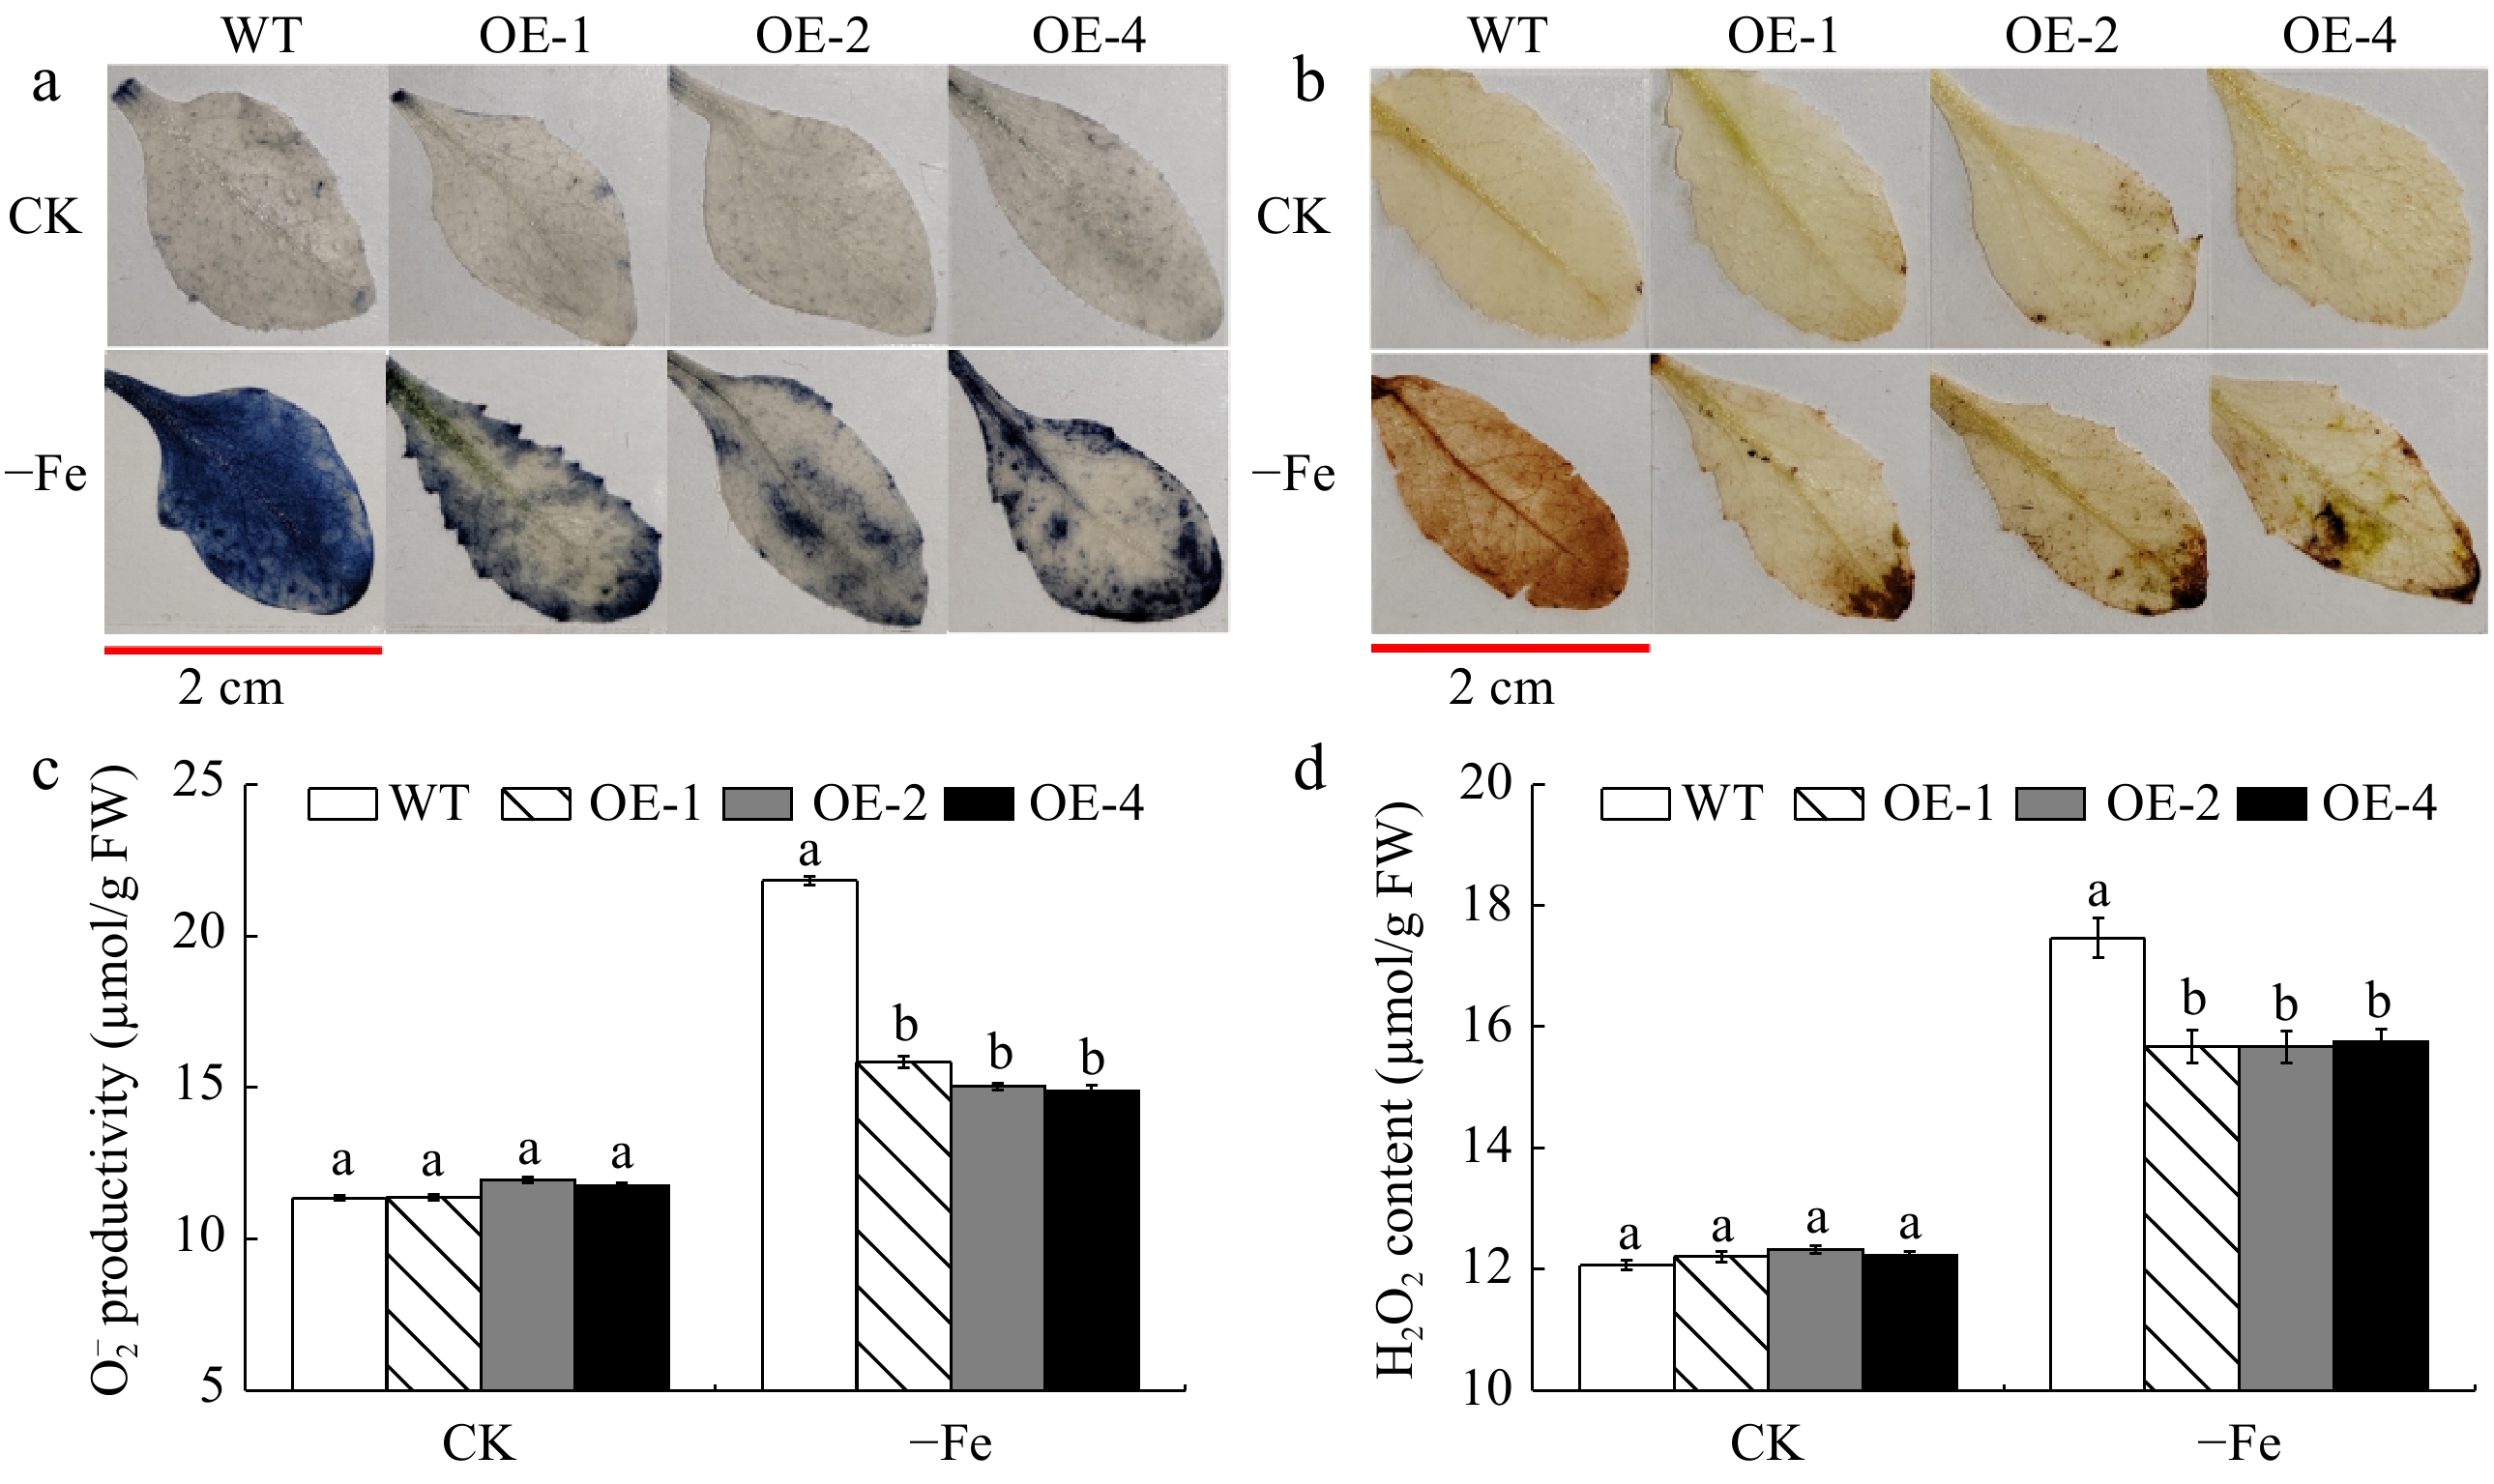
Figure 6.
The accumulation of reactive oxygen species (ROS) of MhLHCB15 transgenic and wild type (WT) A. thaliana grown for 20 d under Fe-sufficient (CK) or Fe-deficient (−Fe) conditions. (a) NBT staining, (b) DAB tissue staining, (c) O2− content, (d) H2O2 content.
-
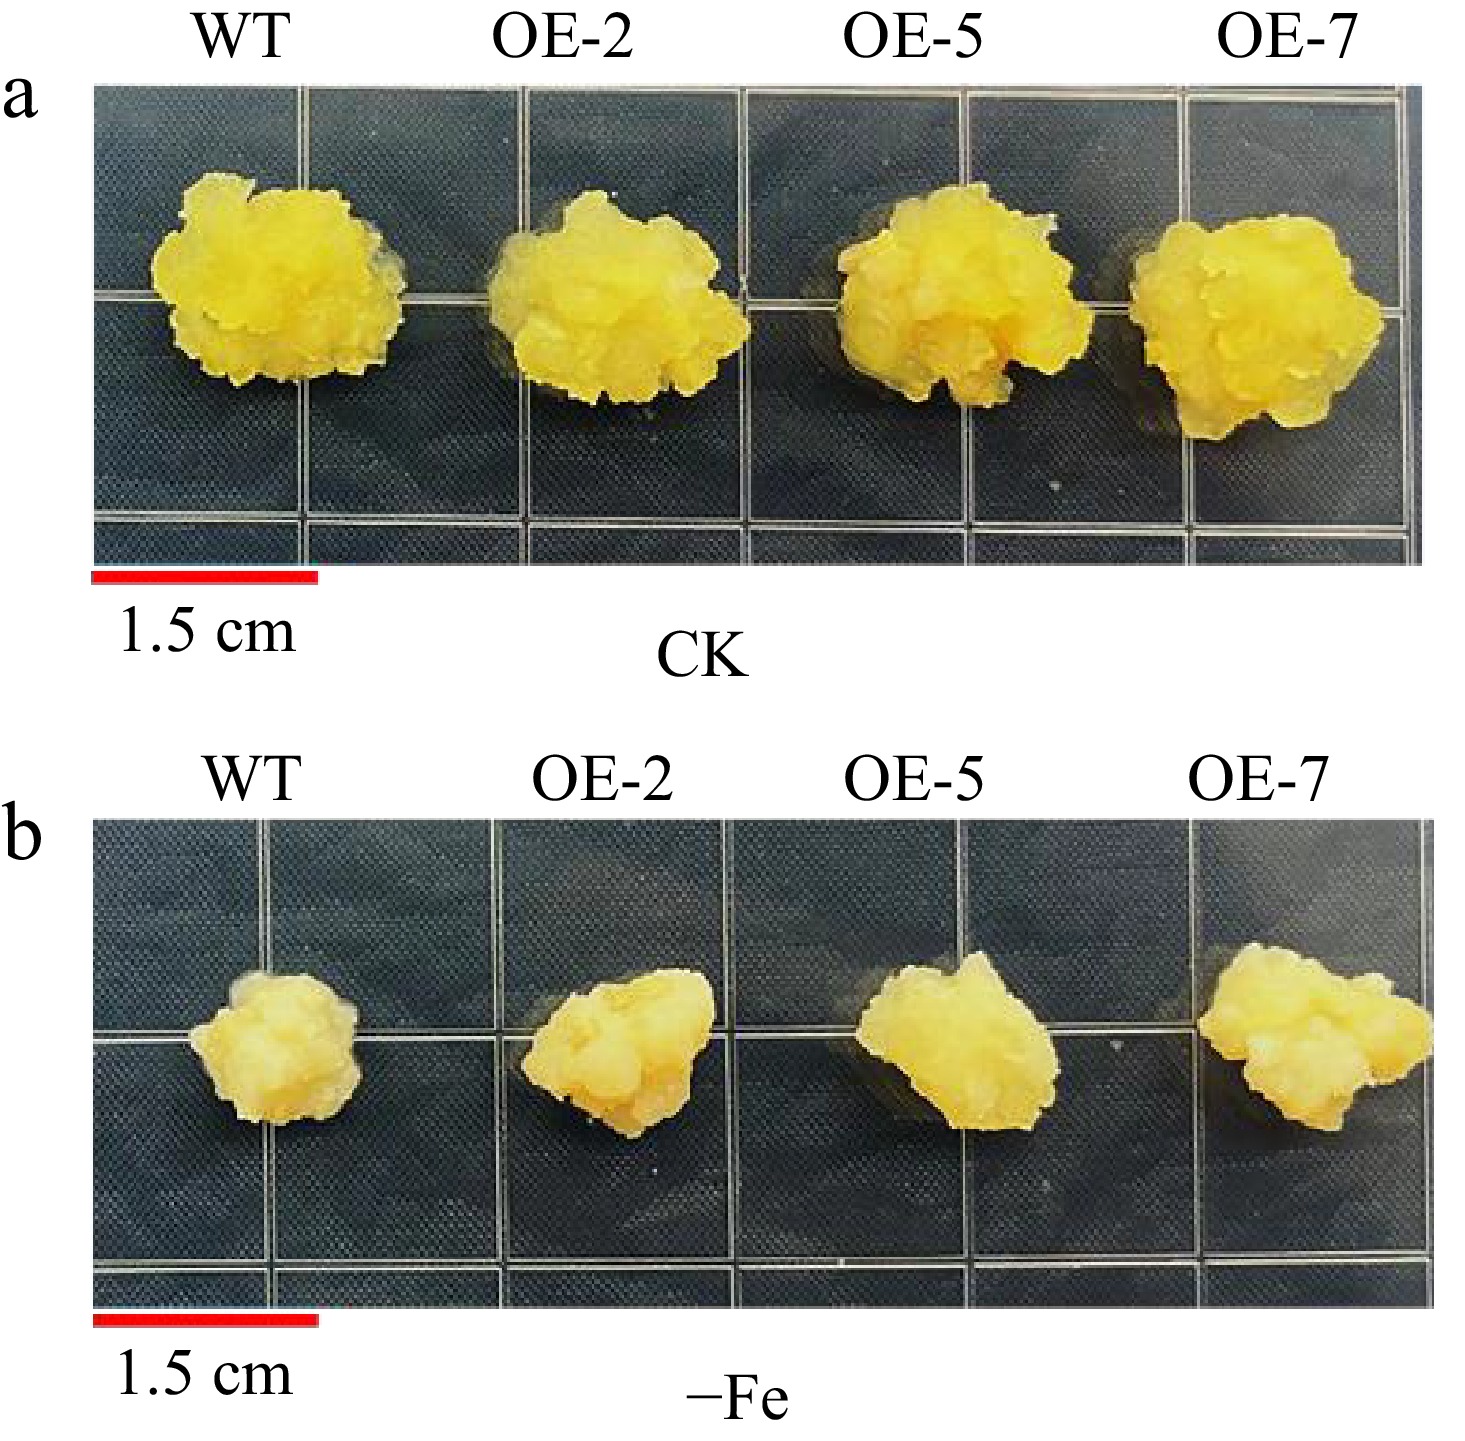
Figure 7.
Phenotypes of overexpressed MhLHCB15 and wild-type (WT) control apple calli grown on Fe-sufficient or Fe-deficient media for 20 d. (a) Fe-sufficient (CK), (b) Fe-deficient (−Fe).
-
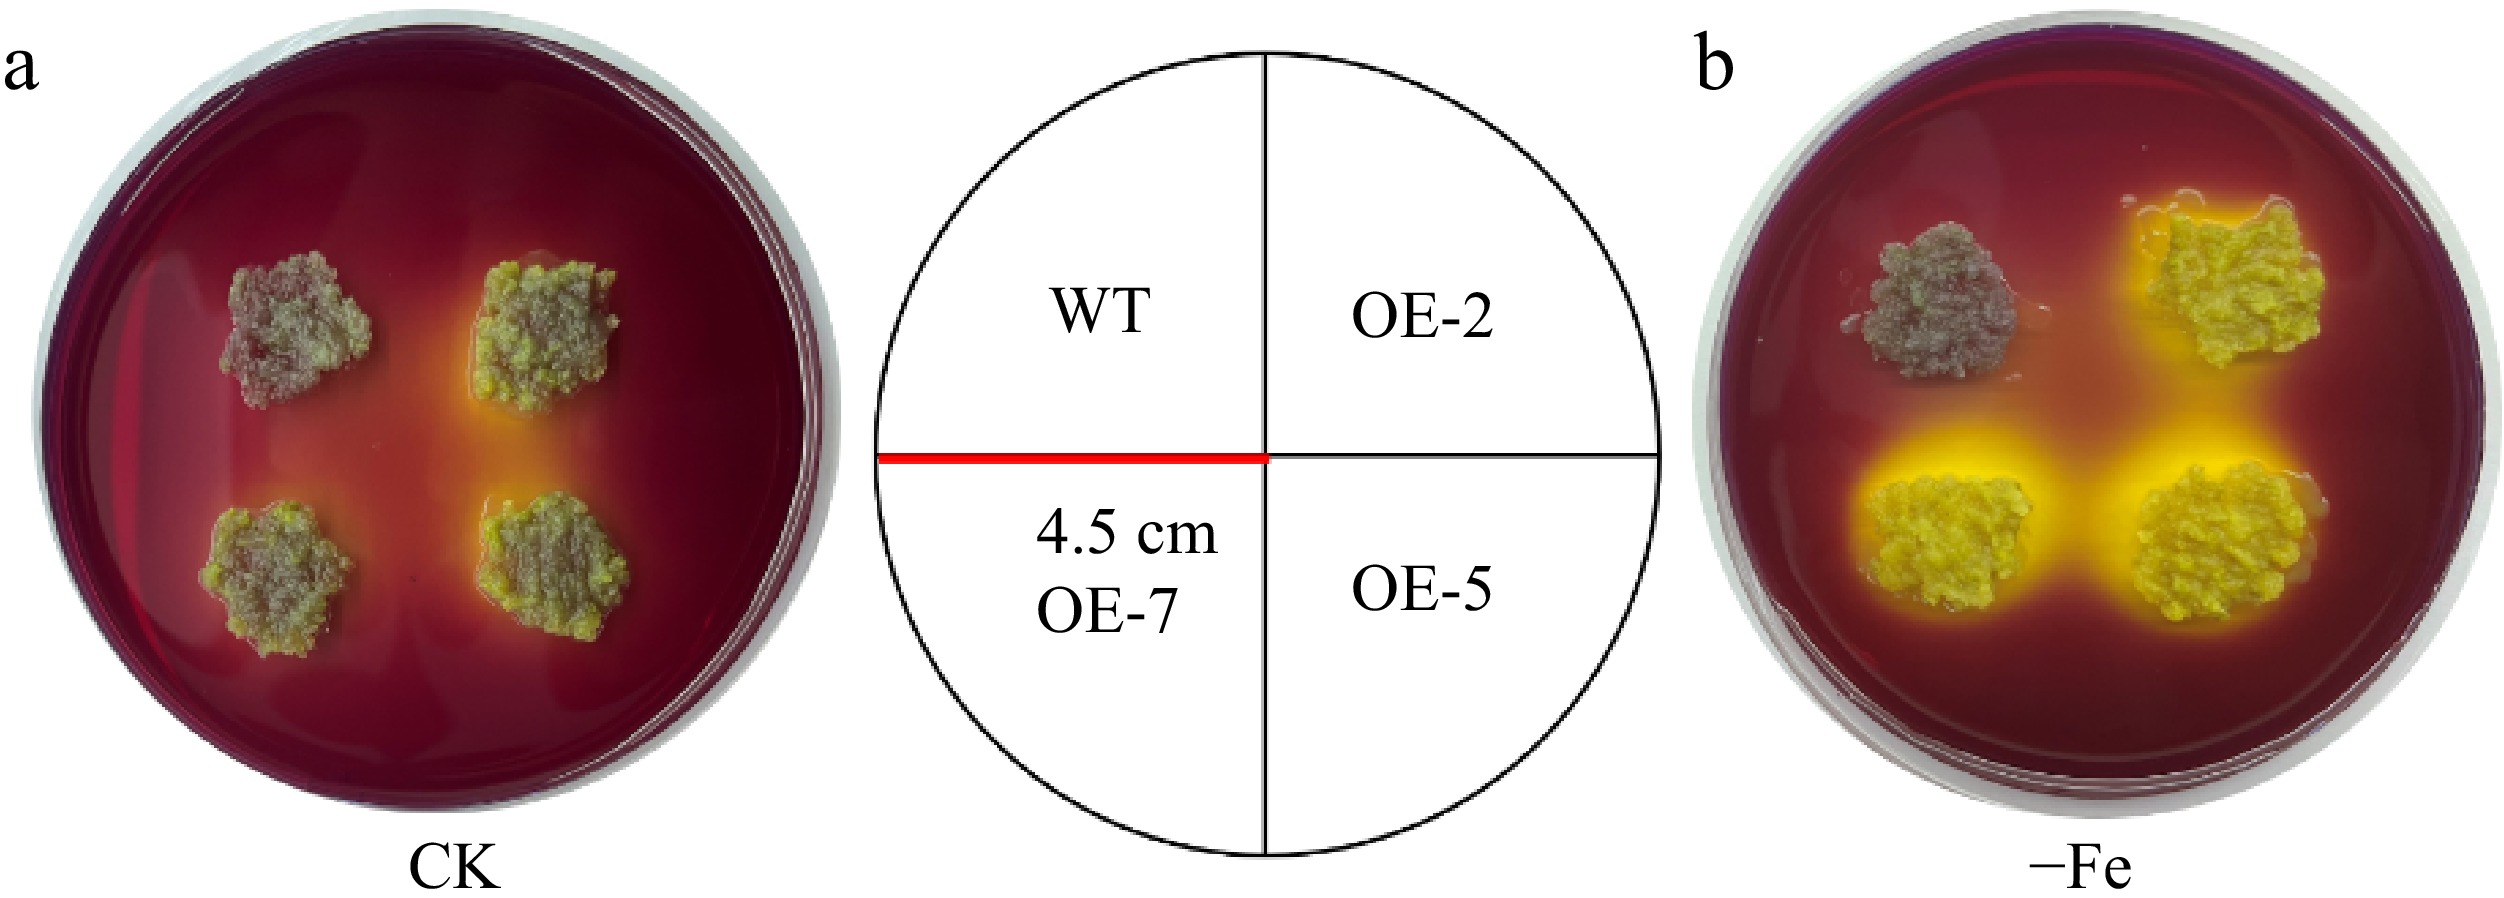
Figure 8.
Acidifcation analysis of overexpressed MhLHCB15 and wild-type (WT) control apple calli on medium containing the pH indicator dye bromocresol violet. A yellow color around apple calli indicates acidification. (a) Fe-sufficient (CK), (b) Fe-deficient (−Fe).
-
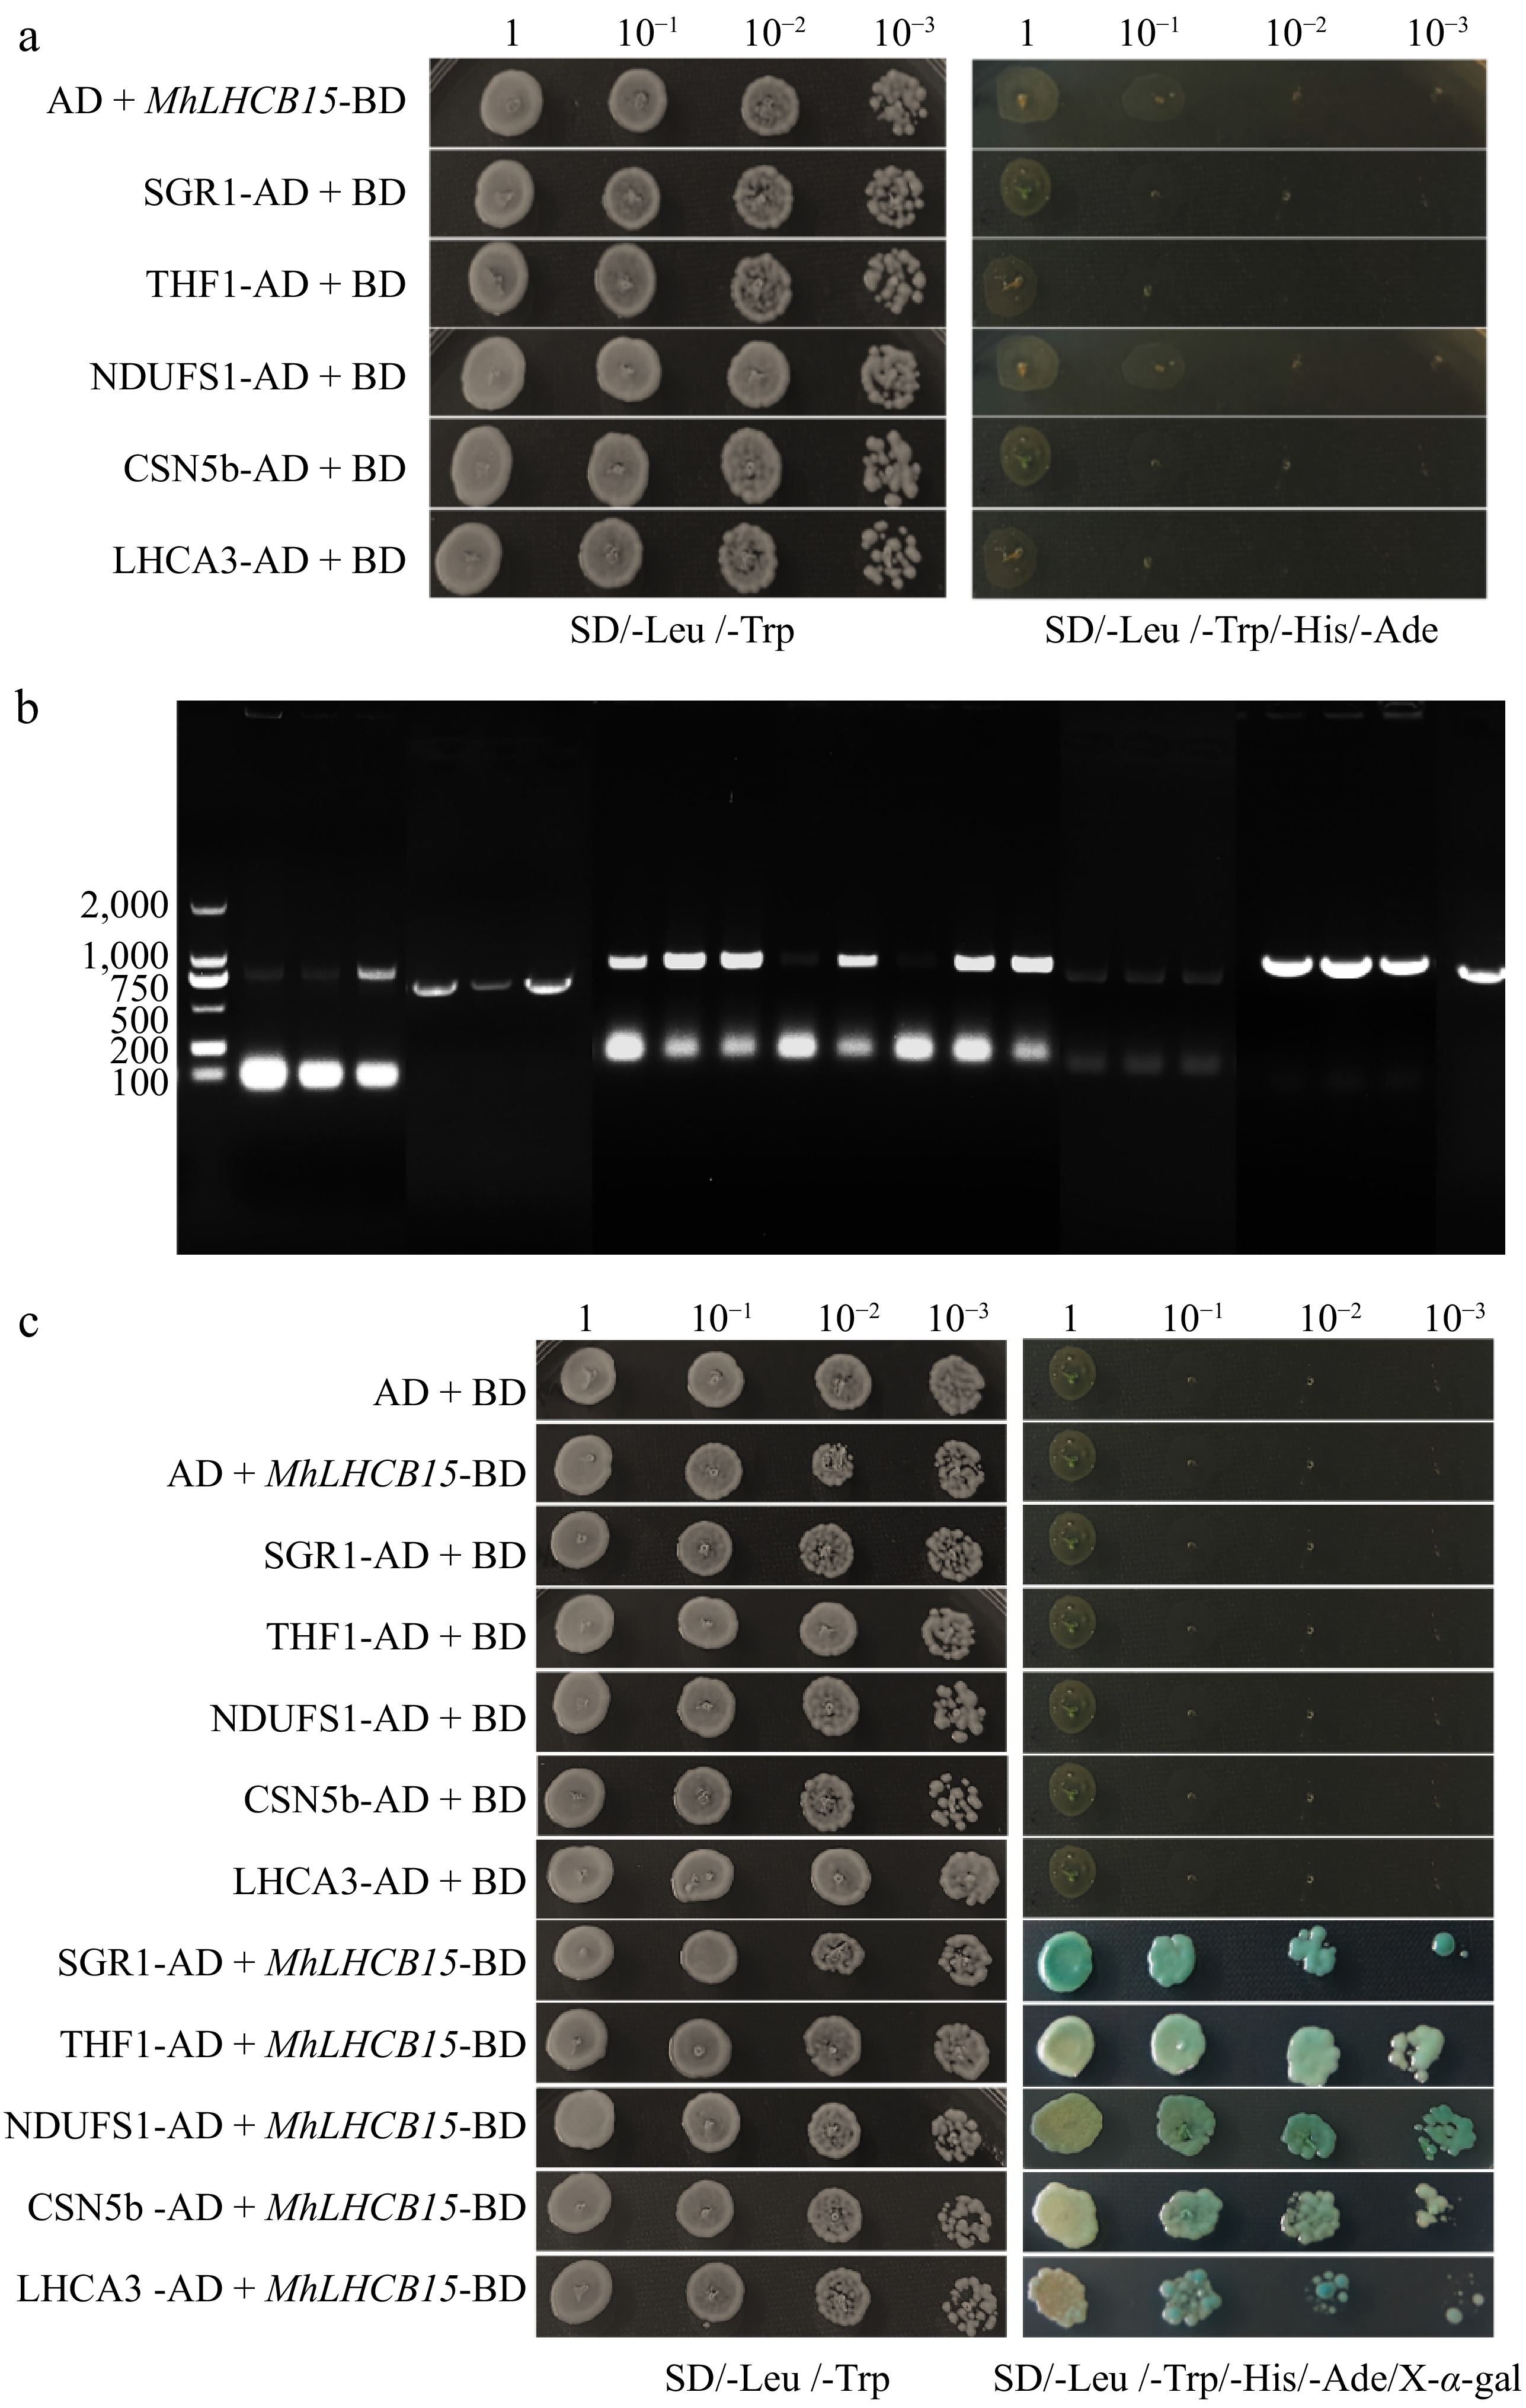
Figure 9.
(a) The self-activations test of MhLHCB15, SGR1, THF1, NDUFS1, CSN5b, and LHCA3 proteins, (b) amplified fragments of selected genes for MhLHCB15 library screening, (c) interaction verification between pGBKT7-MhLHCB15 and interacting protein.
-
Cis-acting element Sequence Start sites (bp) End sites (bp) Function G-box TACGTG +601 +607 Cis-acting regulatory element involved in light responsiveness LTR CCGAAA +342 +348 Cis-acting element involved in low-temperature responsiveness ABRE ACGTG +602 +607 Cis-acting element involved in the abscisic acid responsiveness AuxRR-core GGTCCAT +1,451 +1,458 Cis-acting regulatory element involved in auxin responsiveness P-box CCTTTTG +1,278 +1,285 Gibberellin-responsive element ARE AAACCA −1,067 −1,073 Cis-acting regulatory element essential for the anaerobic induction MBS CAACTG +1,334 +1,340 MYB binding site involved in drought-inducibility TGACG-motif TGACG −655 −660 Cis-acting regulatory element involved in the MeJA-responsiveness Table 1.
Cis-elements in the genomic sequence 2,000 bp upstream of the MhLHCB15.
Figures
(9)
Tables
(1)