-
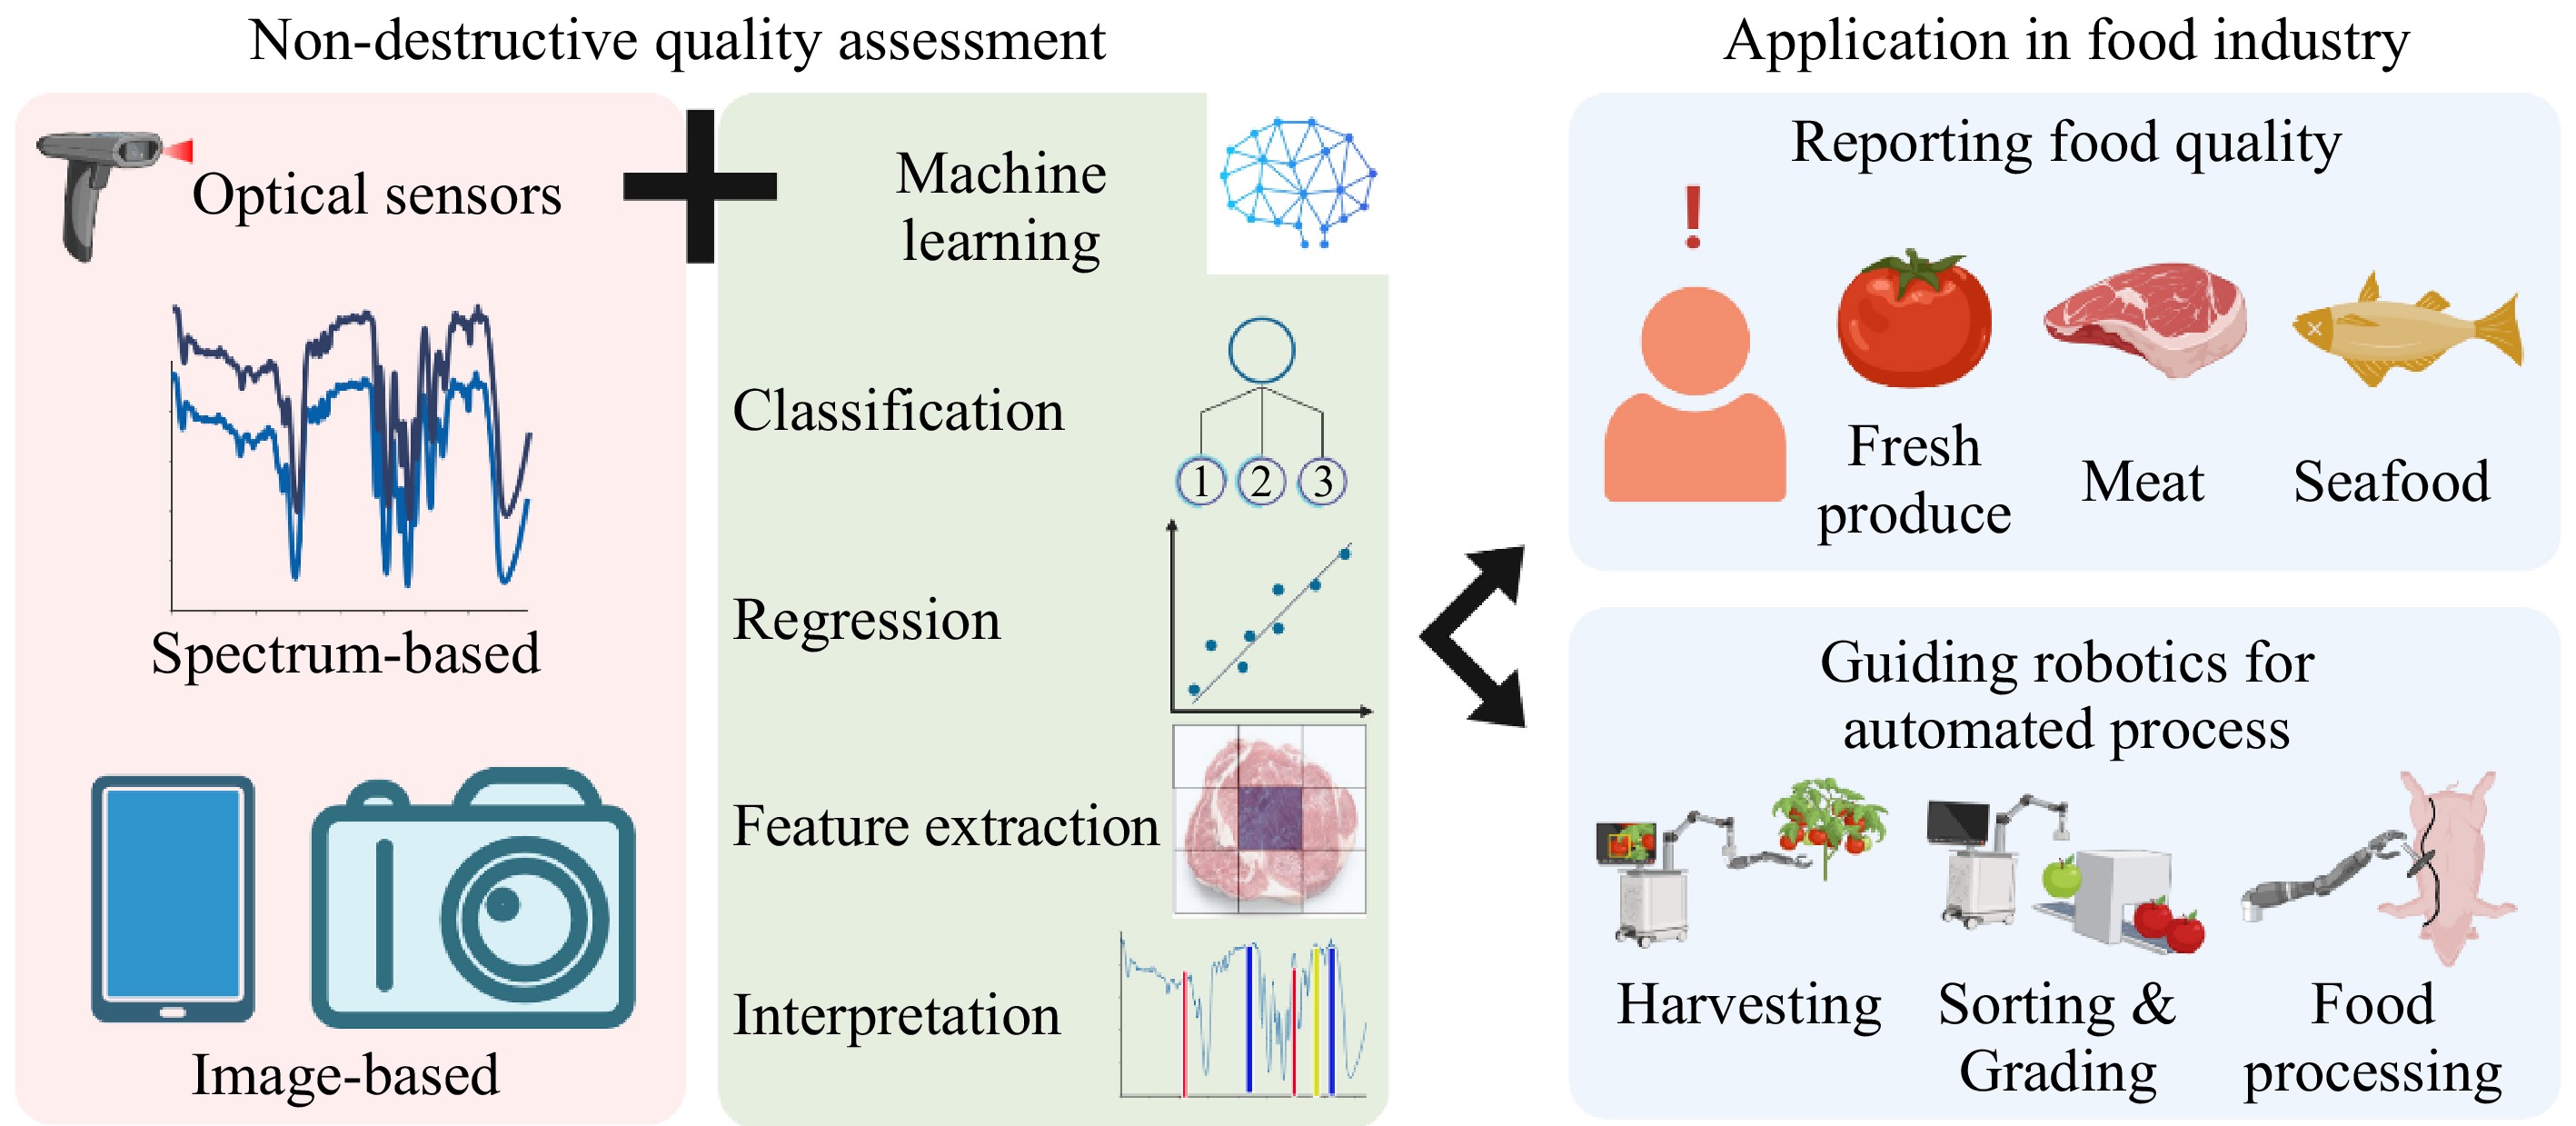
Figure 1.
Overview of non-destructive quality assessment using optical sensors and machine learning to report food quality and guide robotics for the automated process. This figure was created using BioRender.
-
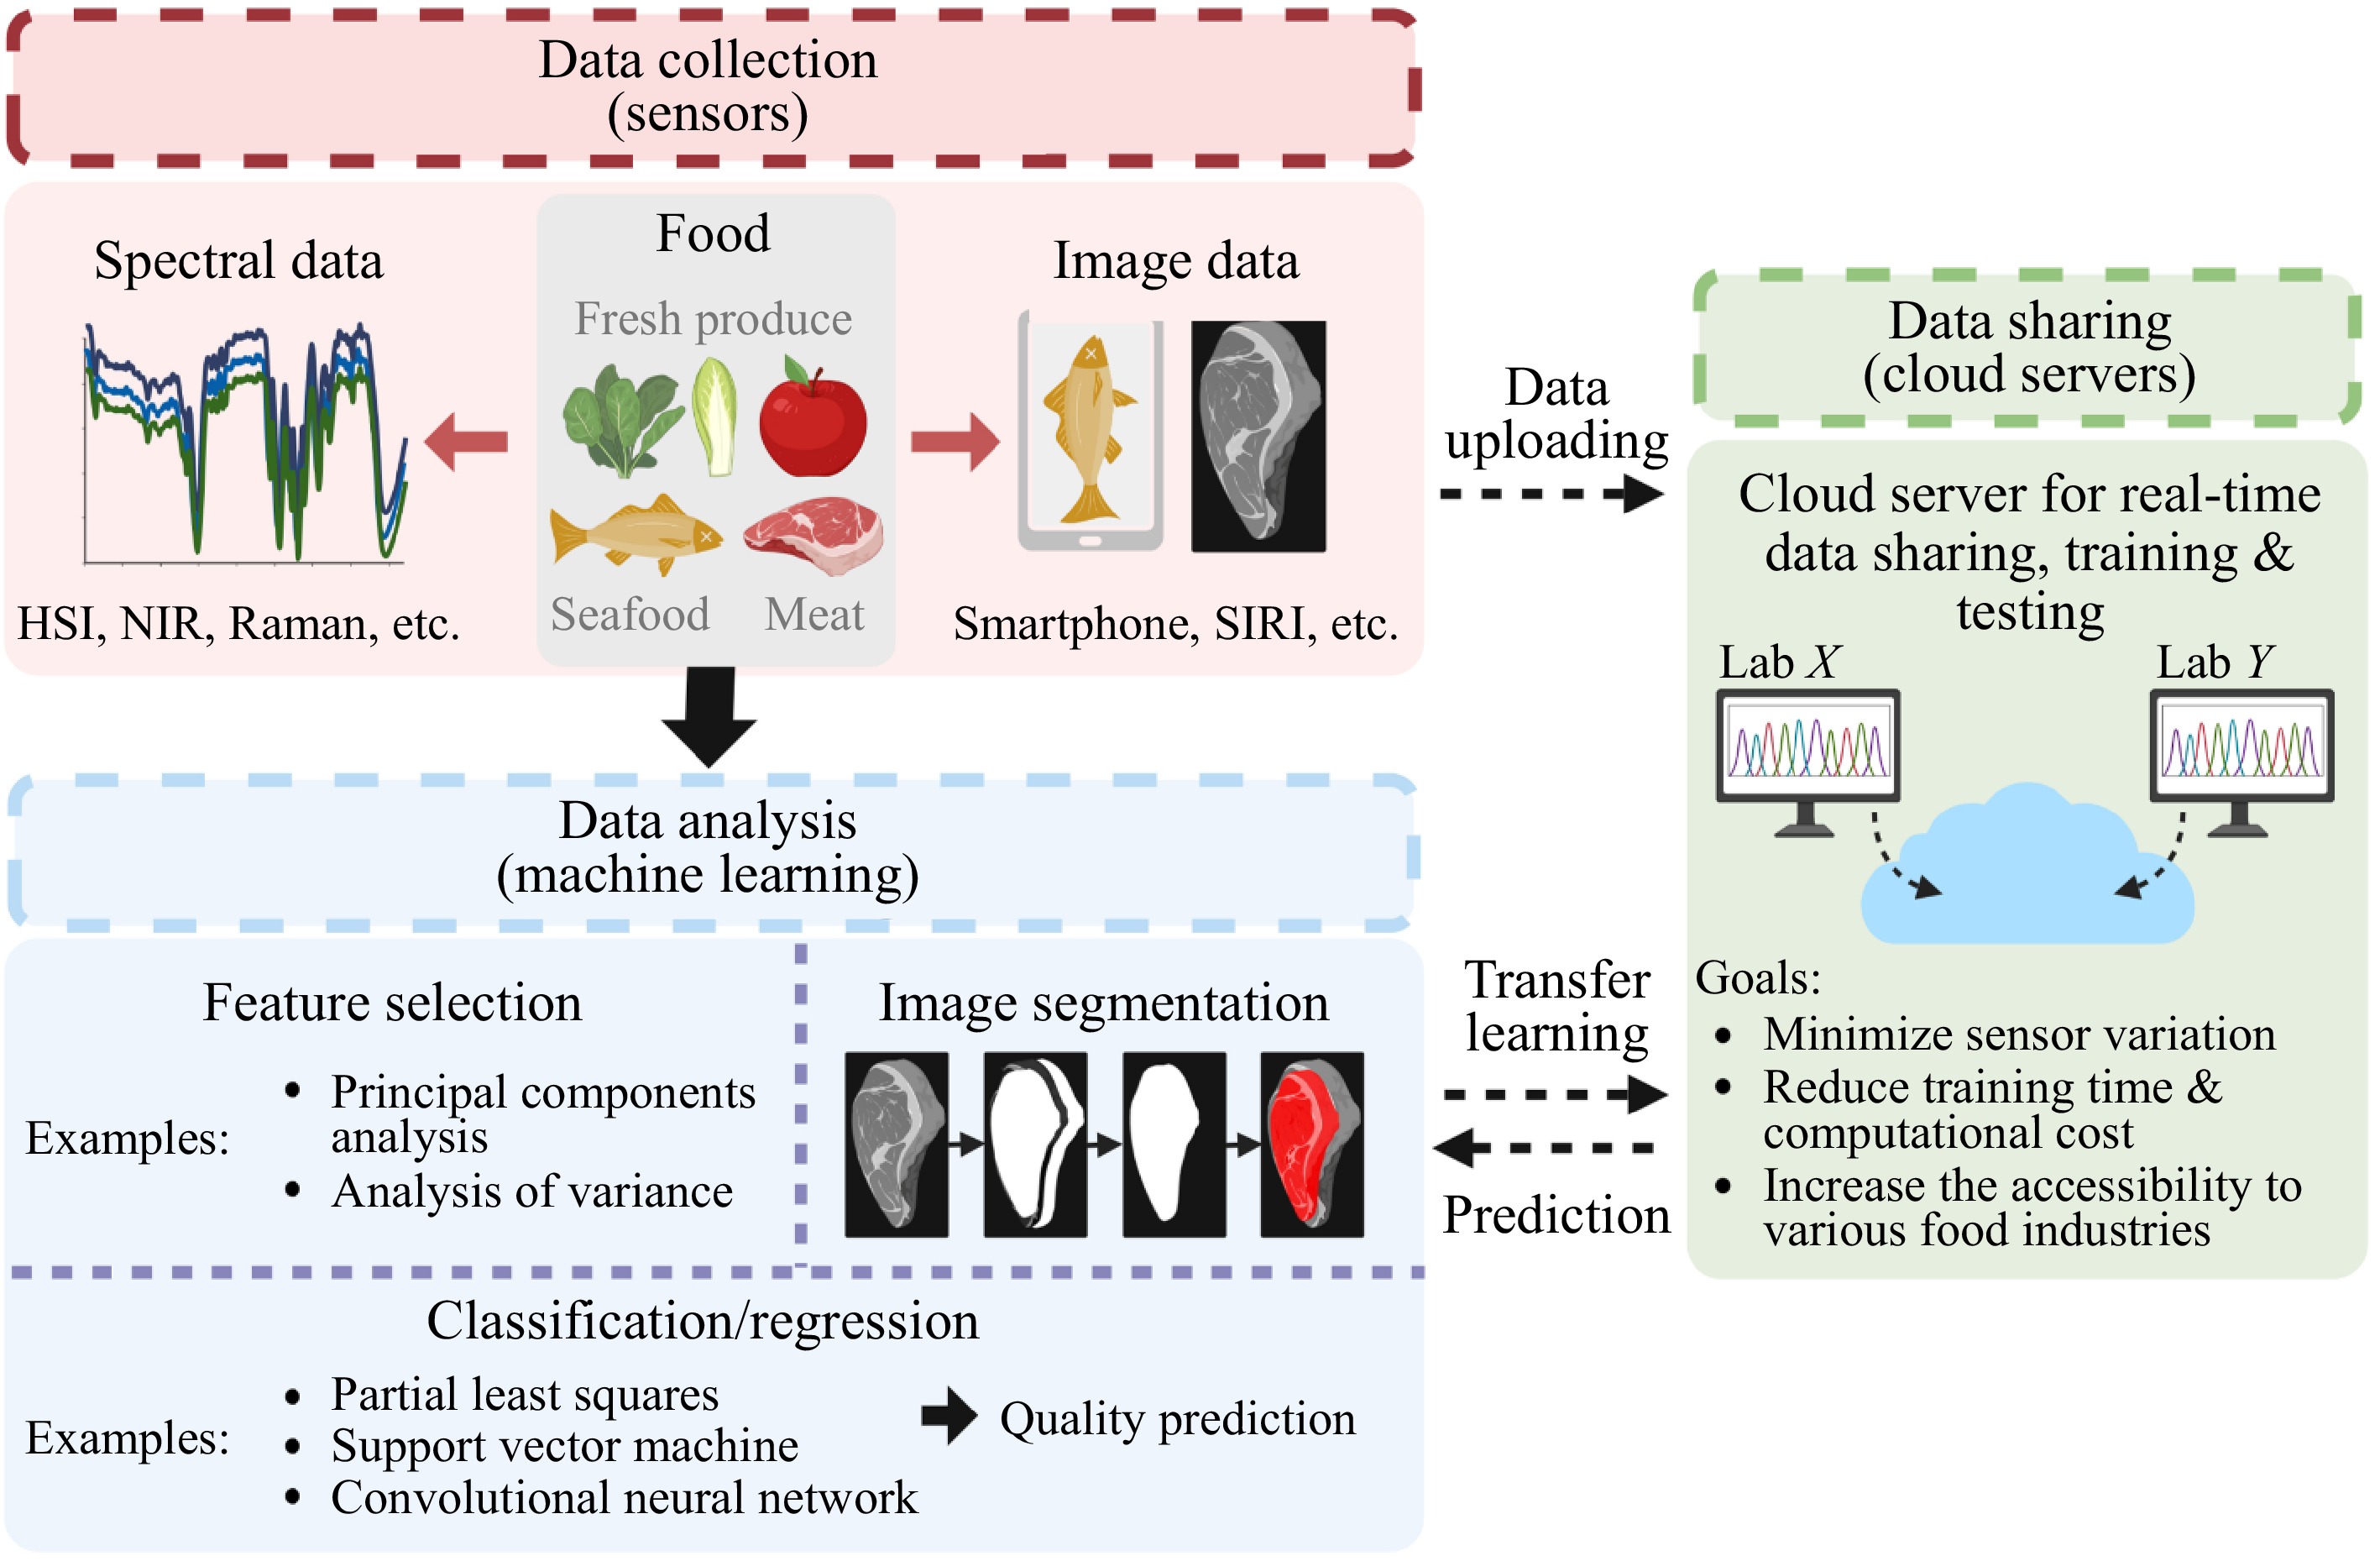
Figure 2.
Non-destructive food quality assessment using machine learning and optical sensors. The most common data collection methods are hyperspectral imaging (HSI), near-infrared (NIR) spectroscopy, Raman spectroscopy, smartphones, and structured-illumination reflectance imaging (SIRI). For the data analysis, feature selection is applied to select critical spectral features, while image segmentation is used to extract critical image features. A variety of machine learning models (either classification or regression models) are applied for food quality prediction. The data from different testing sites can be shared with cloud servers for model training and unknown sample testing. This figure was created using BioRender.
-
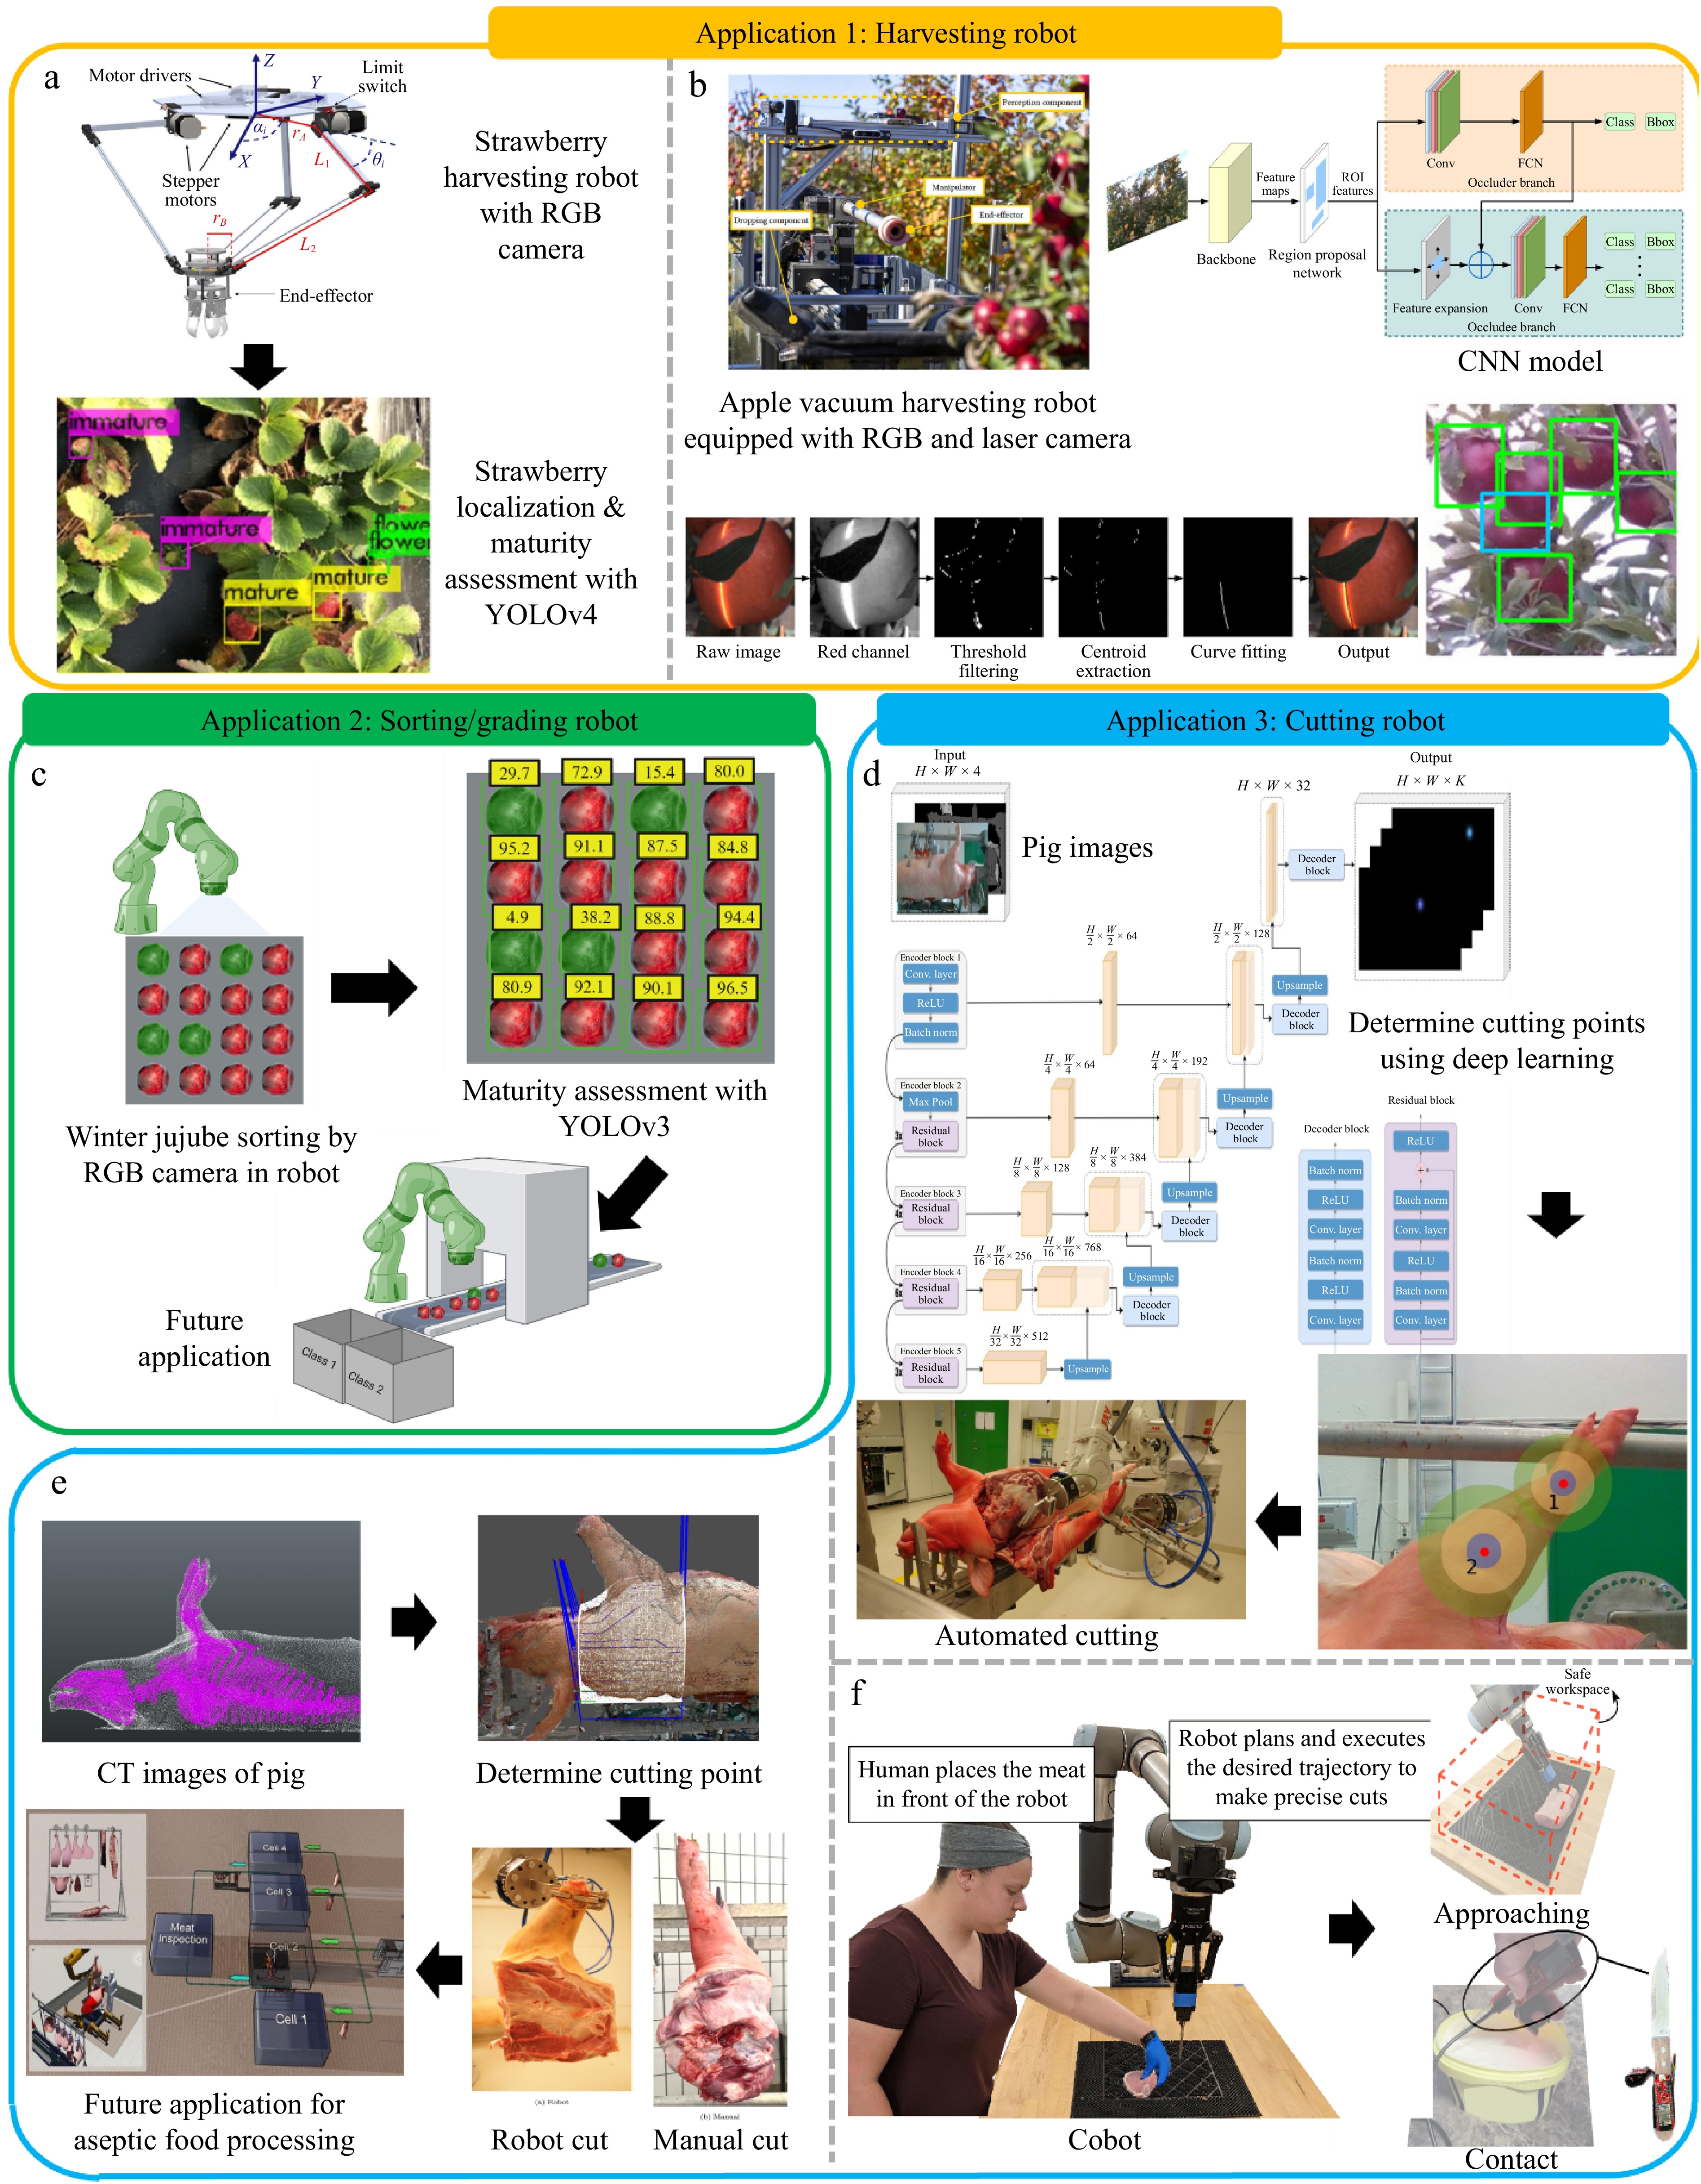
Figure 3.
Representative studies in applying computer vision, a subfield of artificial intelligence (AI) that combines machine learning and optical sensors, to determine food quality and then guide robotics for automated harvesting, sorting, grading, and processing. (a) Five-finger robot for harvesting strawberries using the YOLOv4 model. Reproduced from Tituaña et al.[42]. (b) Apple harvesting robots use a vacuum system and RGB and laser cameras that are controlled by mask-region-based convolutional neural network (Mask-RCNN) model. Reproduced from Zhang et al.[44]. (c) Sorting and grading robot for winter jujube using an RGB camera and the YOLOv3 model[45]. The image was created using BioRender. (d) Prediction of gripping point for automated meat cutting using RGB imaging, U-Net model, and robotics. Reproduced from Manko et al.[47]. (e) Determination of cutting trajectories using computed tomography (CT) imaging and U-Net model for aseptic automation system. Reproduced from de Medeiros Esper et al.[48]. (f) Working safety evaluation of meat cutting cobot using proximity sensors and random forest model to prevent undesired contact with human workers. Reproduced from Wright et al.[50]. (a), (b), (d), (e) and (f) are licensed under Creative Commons Attribution 4.0 International License.
-
Food Quality indicators Type of optical
sensorsaMachine learning models Results (R2 or accuracy) Ref. Feature extraction Classification/Regression Application #1: Food quality assessment Spinach and Chinese cabbage Storage time based on color and textile HSI camera Gradient-weighted class activation mapping (Grad-CAM) [Classification]
Logistic regression (LR), support vector machine (SVM), random forest (RF)
, one dimensional-convolutional neural network (1D-CNN), AlexNet, long short-term memory (LSTM)Accuracies for spinach:
LR: 75%, SVM: 80.36%, RF: 51.79%, AlexNet: 82.14%, ResNet: 78.57%, LSTM: 82.14%, CNN: 82.14%, CNN-LSTM: 85.17%
Accuracies for Chinese cabbage:
LR: 83.93%, SVM: 82.14%, RF: 64.29%, AlexNet: 78.57%, ResNet: 71.43%, LSTM: 78.57%, CNN: 82.14%, CNN-LSTM: 83.93%[18] Apples Total soluble solids contents NIR spectrometer Automatic encoder neural network [Regression] Partial least square (PLS) R2: 0.820 – 0.953 [19] Beef Thawing loss, water content, color Raman spectrometer Ant colony optimization (ACO), uninformative variable elimination (UVE), competitive adaptive reweighted sampling (CARS) [Regression] PLS R2 for PLS: 0.374 – 0.775
ACO-PLS: 0.479 – 0.793
UVE-PLS: 0.928 – 0.994
CARS-PLS: 0.609 – 0.971[27] Beef Muscle segmentation, marbling Structured-illumination reflectance image camera Unet++, DeepLabv3+, SegFormer, ResNeXt101 [Classification] Regularized linear discriminant analysis Accuracy for whole image: 77.45% – 84.47%;
Segmented image: 83.19% – 88.72%
Selected feature in segmented image: 90.85%[29] Seabass fillet Storage days that are determined based on TVB-N and protein Raman spectrometer ANOVA [Classification] SVM, CNN Accuracy for whole spectrum: SVM: 81.4%, CNN: 86.2%;
Accuracy for selected spectral features: SVM: 83.8%, CNN: 90.6%[36] Fish Storage days that are determined based on fisheye Smartphone camera VGG19, SqueezeNet [Classification] LR, SVM, RF, k-nearest neighbor (kNN), artificial neural network (ANN) Accuracy for VGG19 extraction with LR: 65.9%, SVM: 74.3%, RF: 68.3%, kNN: 67.8%, ANN: 77.3%
Accuracy for SqueezeNet extraction with
LR: 64.0%, SVM: 57.6%, RF: 64.5%, kNN: 63.0%, ANN: 72.9%[38] Application #2: Pre- and post-harvest processing with robotics Strawberry Maturity RGB camera YOLOv4 [Classification] YOLOv4 Success rate for harvesting in lab: 60.00 – 100, in fields: 37.50 – 94.00 [42] Apple Maturity RGB camera, laser camera YOLOv3 [Classification] YOLOv3 Success rate for harvesting in fields: 65.2% – 85.4% [44] Winter jujube Maturity RGB camera YOLOv3 [Classification] YOLOv3 Success rate for grading: 97.28% [45] Pork Cutting point RGB camera U-Net [Classification] U-Net Performance for object detection:
Mean average precision: 0.963 – 0.984, mean average recall: 0.974 – 0.994[47] Pork Cutting and grasping point CT camera U-Net, mask-region-based convolutional neural network (Mask-RCNN), ICNet [Classification] U-Net, Mask-RCNN, ICNet Accuracy for object detection:
U-Net: 0.904, Mask-RCNN: 0.920, ICNet: 0.979[48] Pork loin Cutting, slicing, trimming RGB camera, proximity sensor [Classification] RF Accuracy for contact detection: 90.43% – 98.14%, approach detection: > 99.9% [50] a Full name of optical sensors: hyperspectral imaging (HSI), near-infrared (NIR), computed tomography (CT). Table 1.
Applications of optical sensors and machine learning in food quality assessment for reporting food quality and guiding robotics-driven food processing.
Figures
(3)
Tables
(1)