-
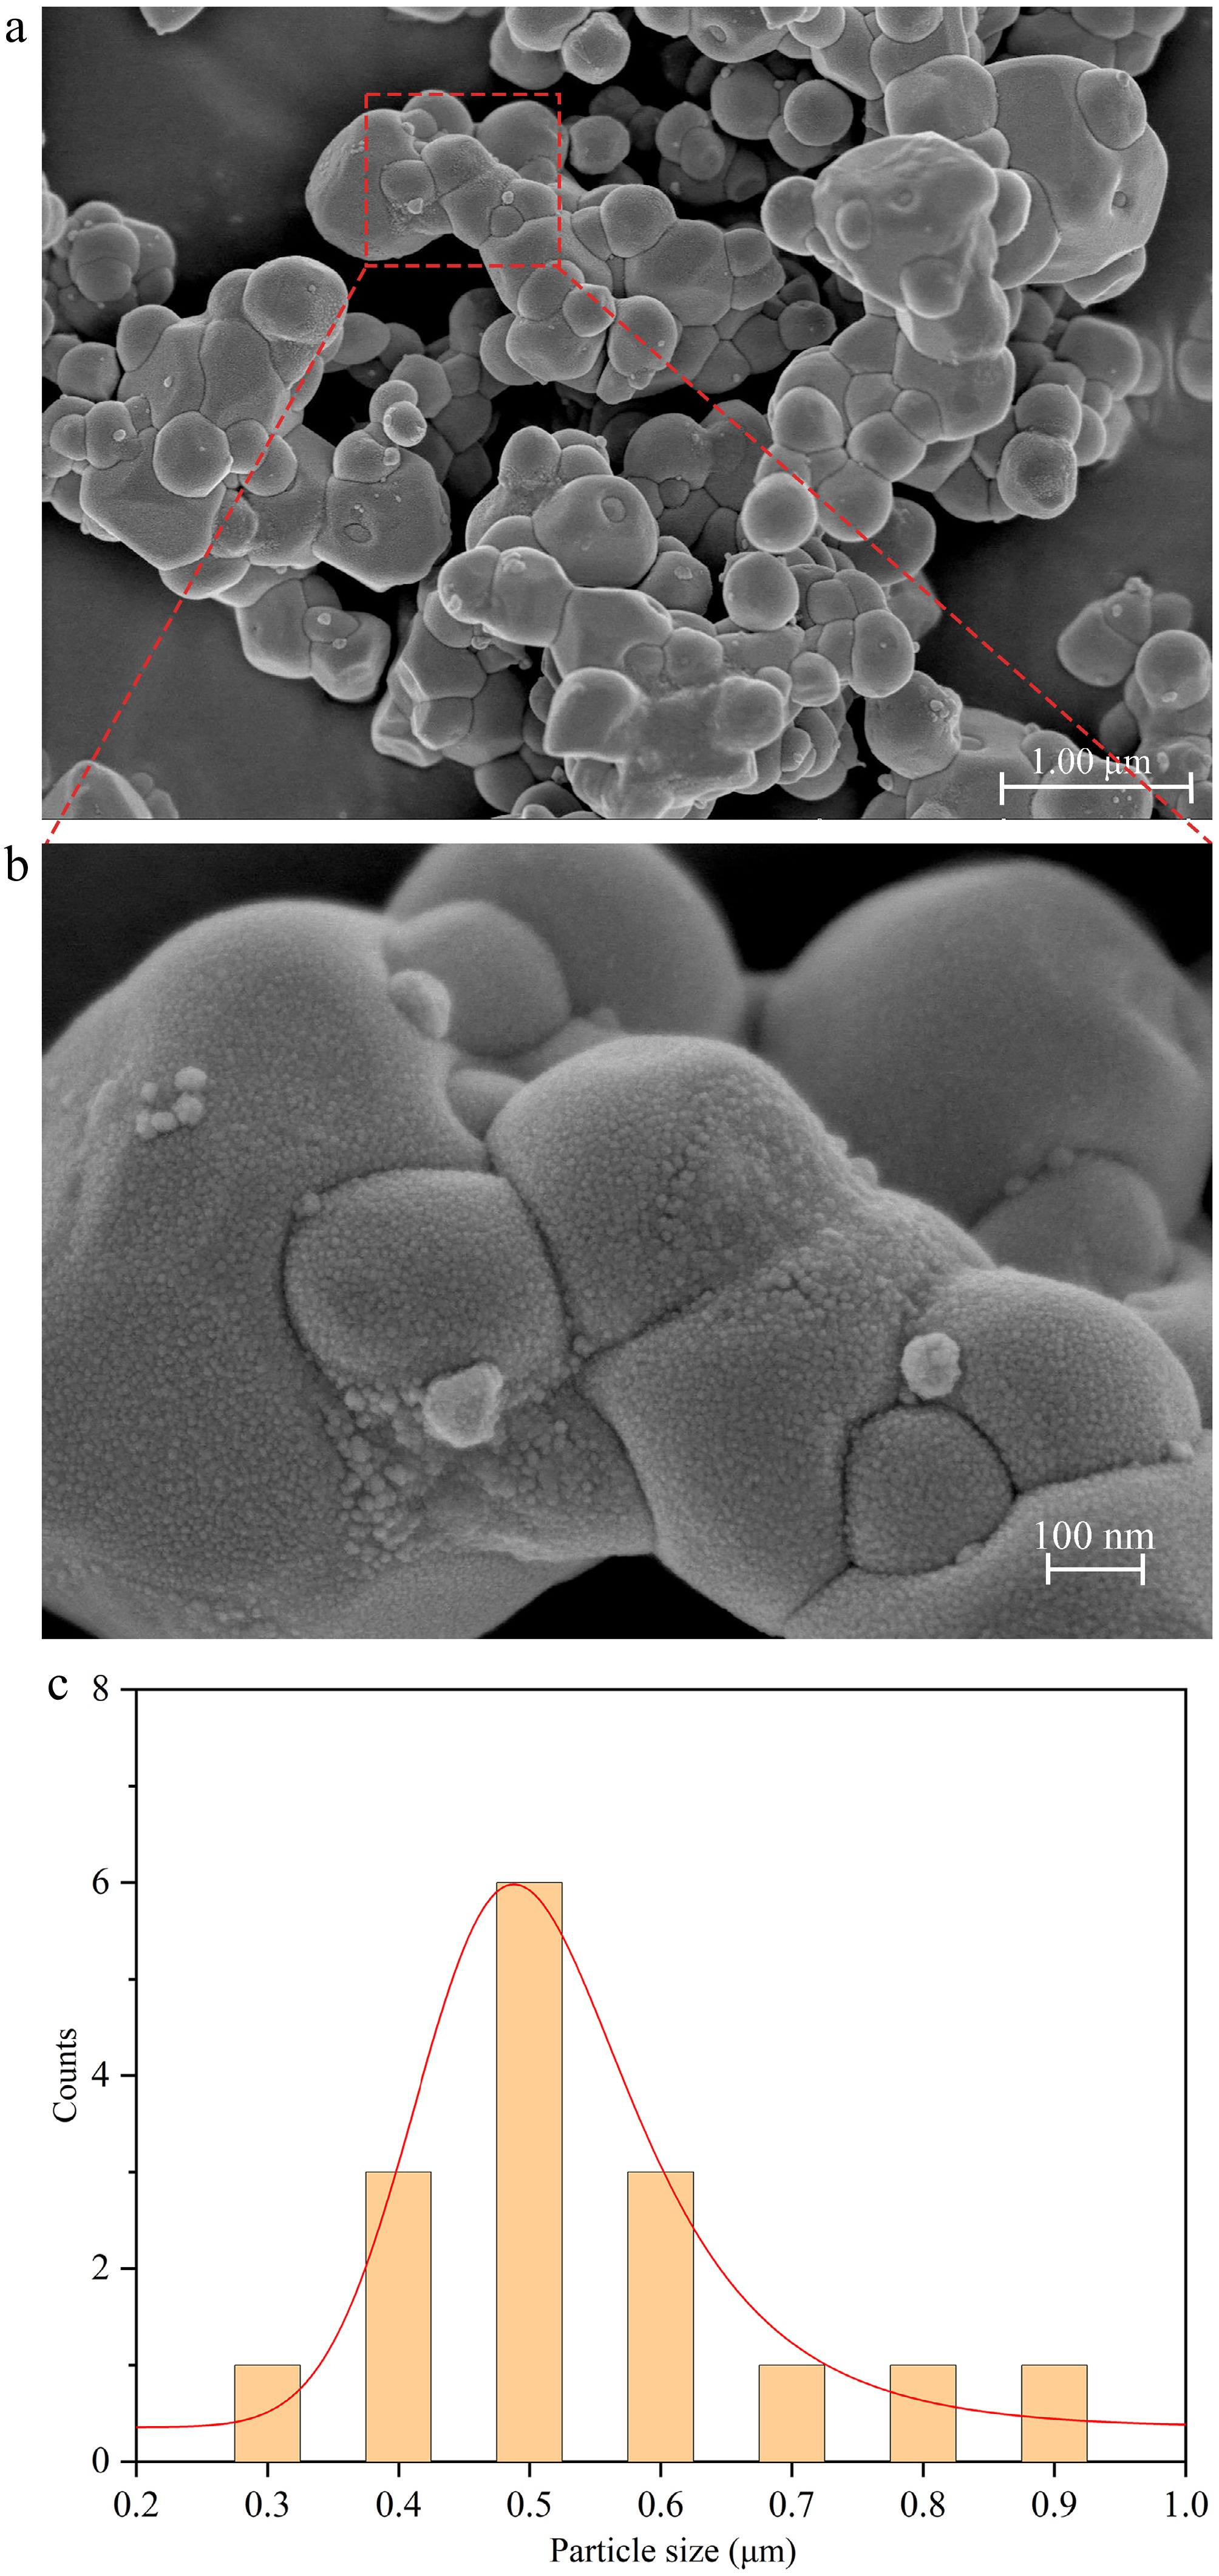
Figure 1.
(a), (b) Images of Ag3PO4 NPs captured by FE-SEM at various magnifications. (c) Particle size distribution of Ag3PO4 NPs.
-
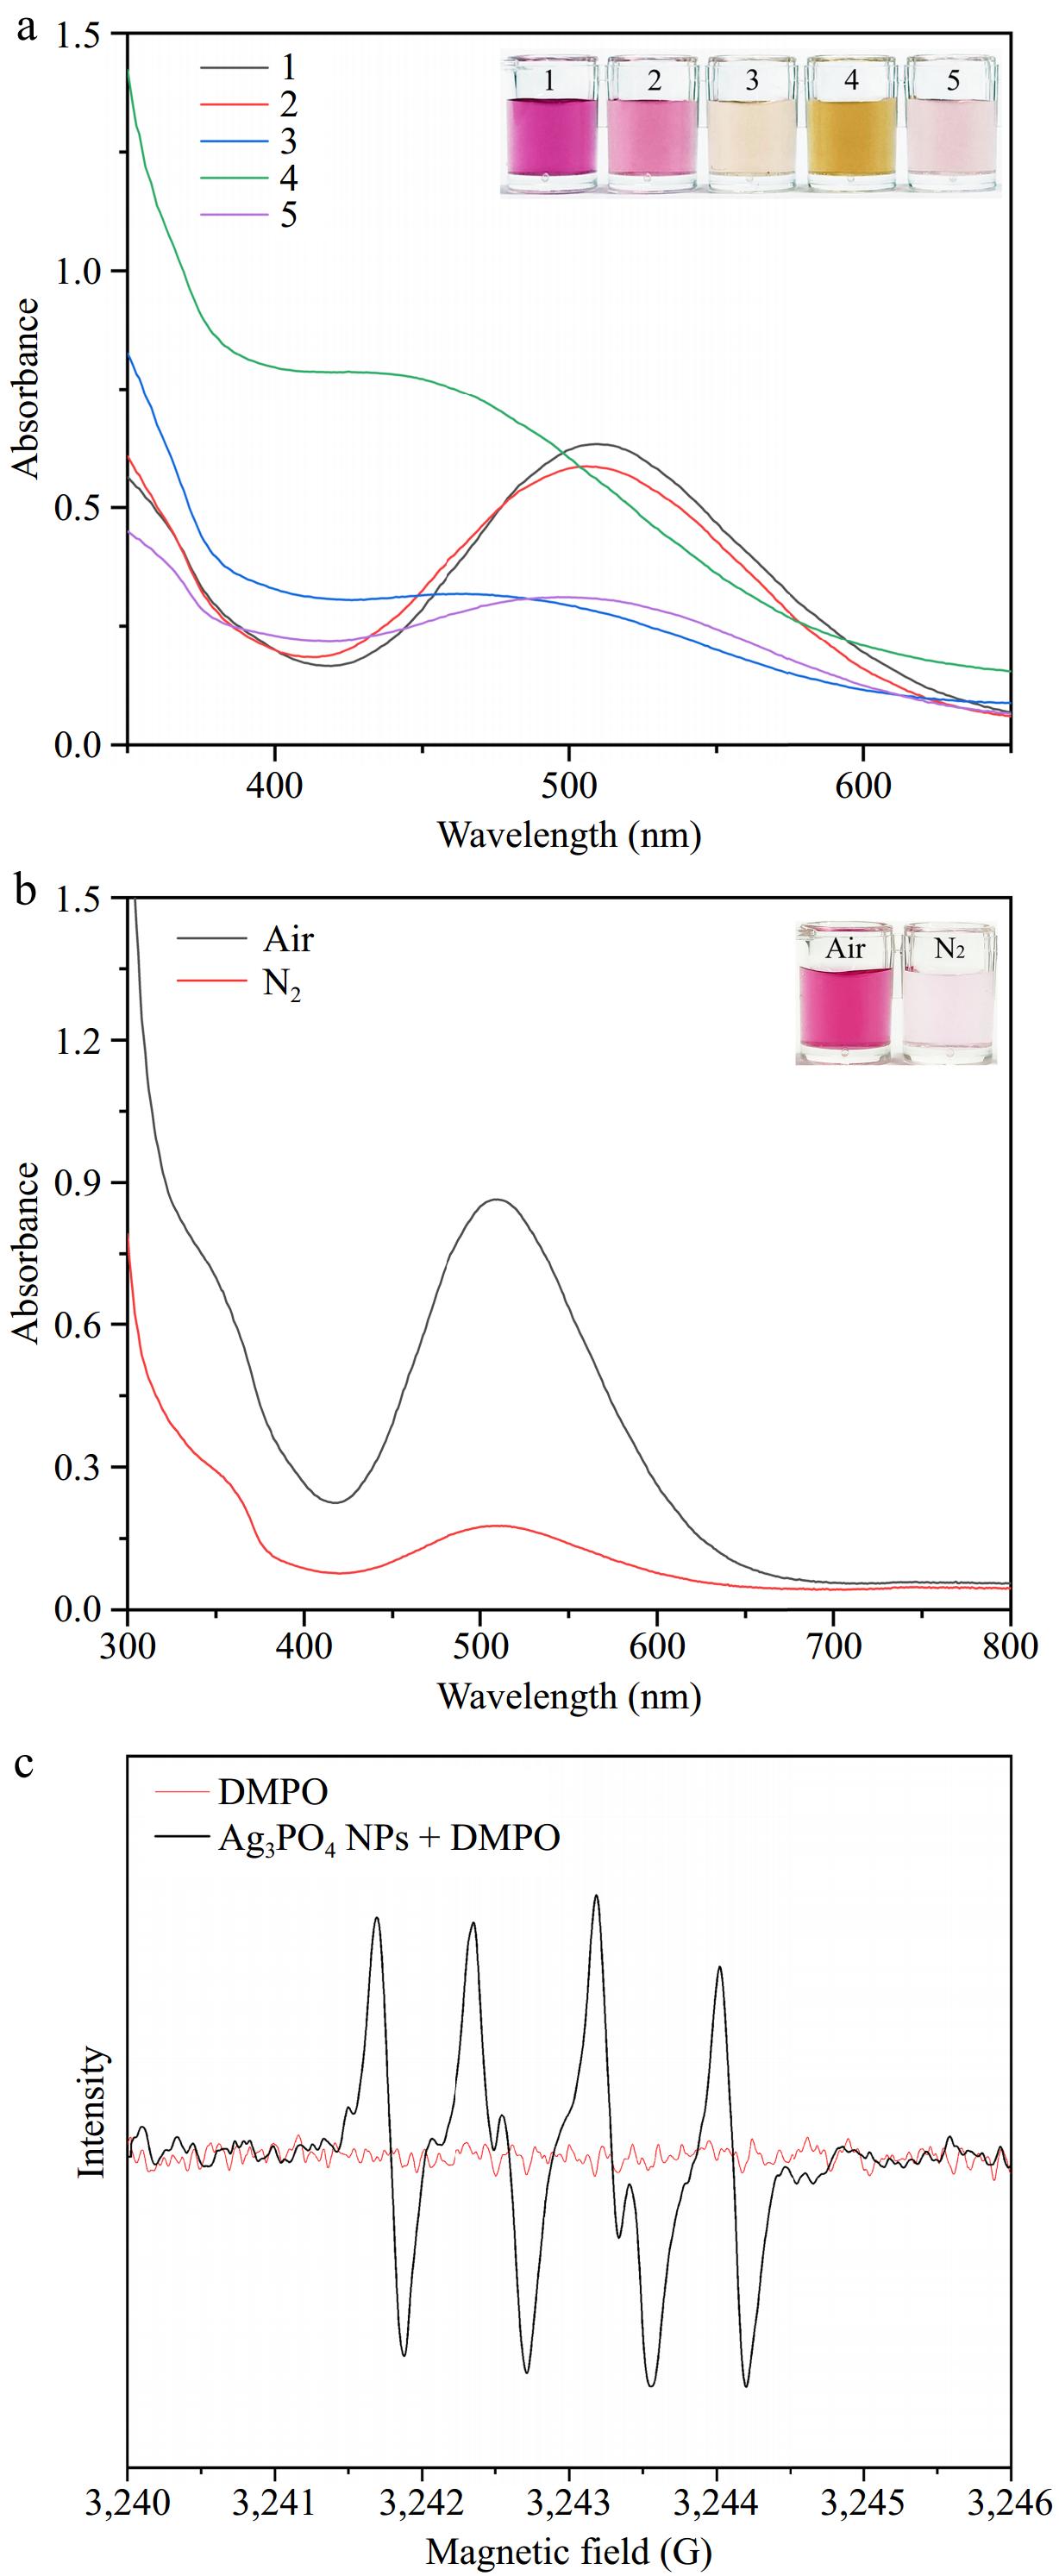
Figure 2.
(a) Visual images and the spectra of absorption for various reaction solutions. Sample 1: 2,4-DP; Sample 2: phenol; Sample 3: 3-aminophenol; Sample 4: 2-nitroresorcinol; Sample 5: catechol. (b) Color variation of the mixture containing 4-AAP, 2,4-DP, and Ag3PO4 NPs in Air- or N2-saturated buffers. (c) EPR spectra of O2·− generated by Ag3PO4 NPs.
-
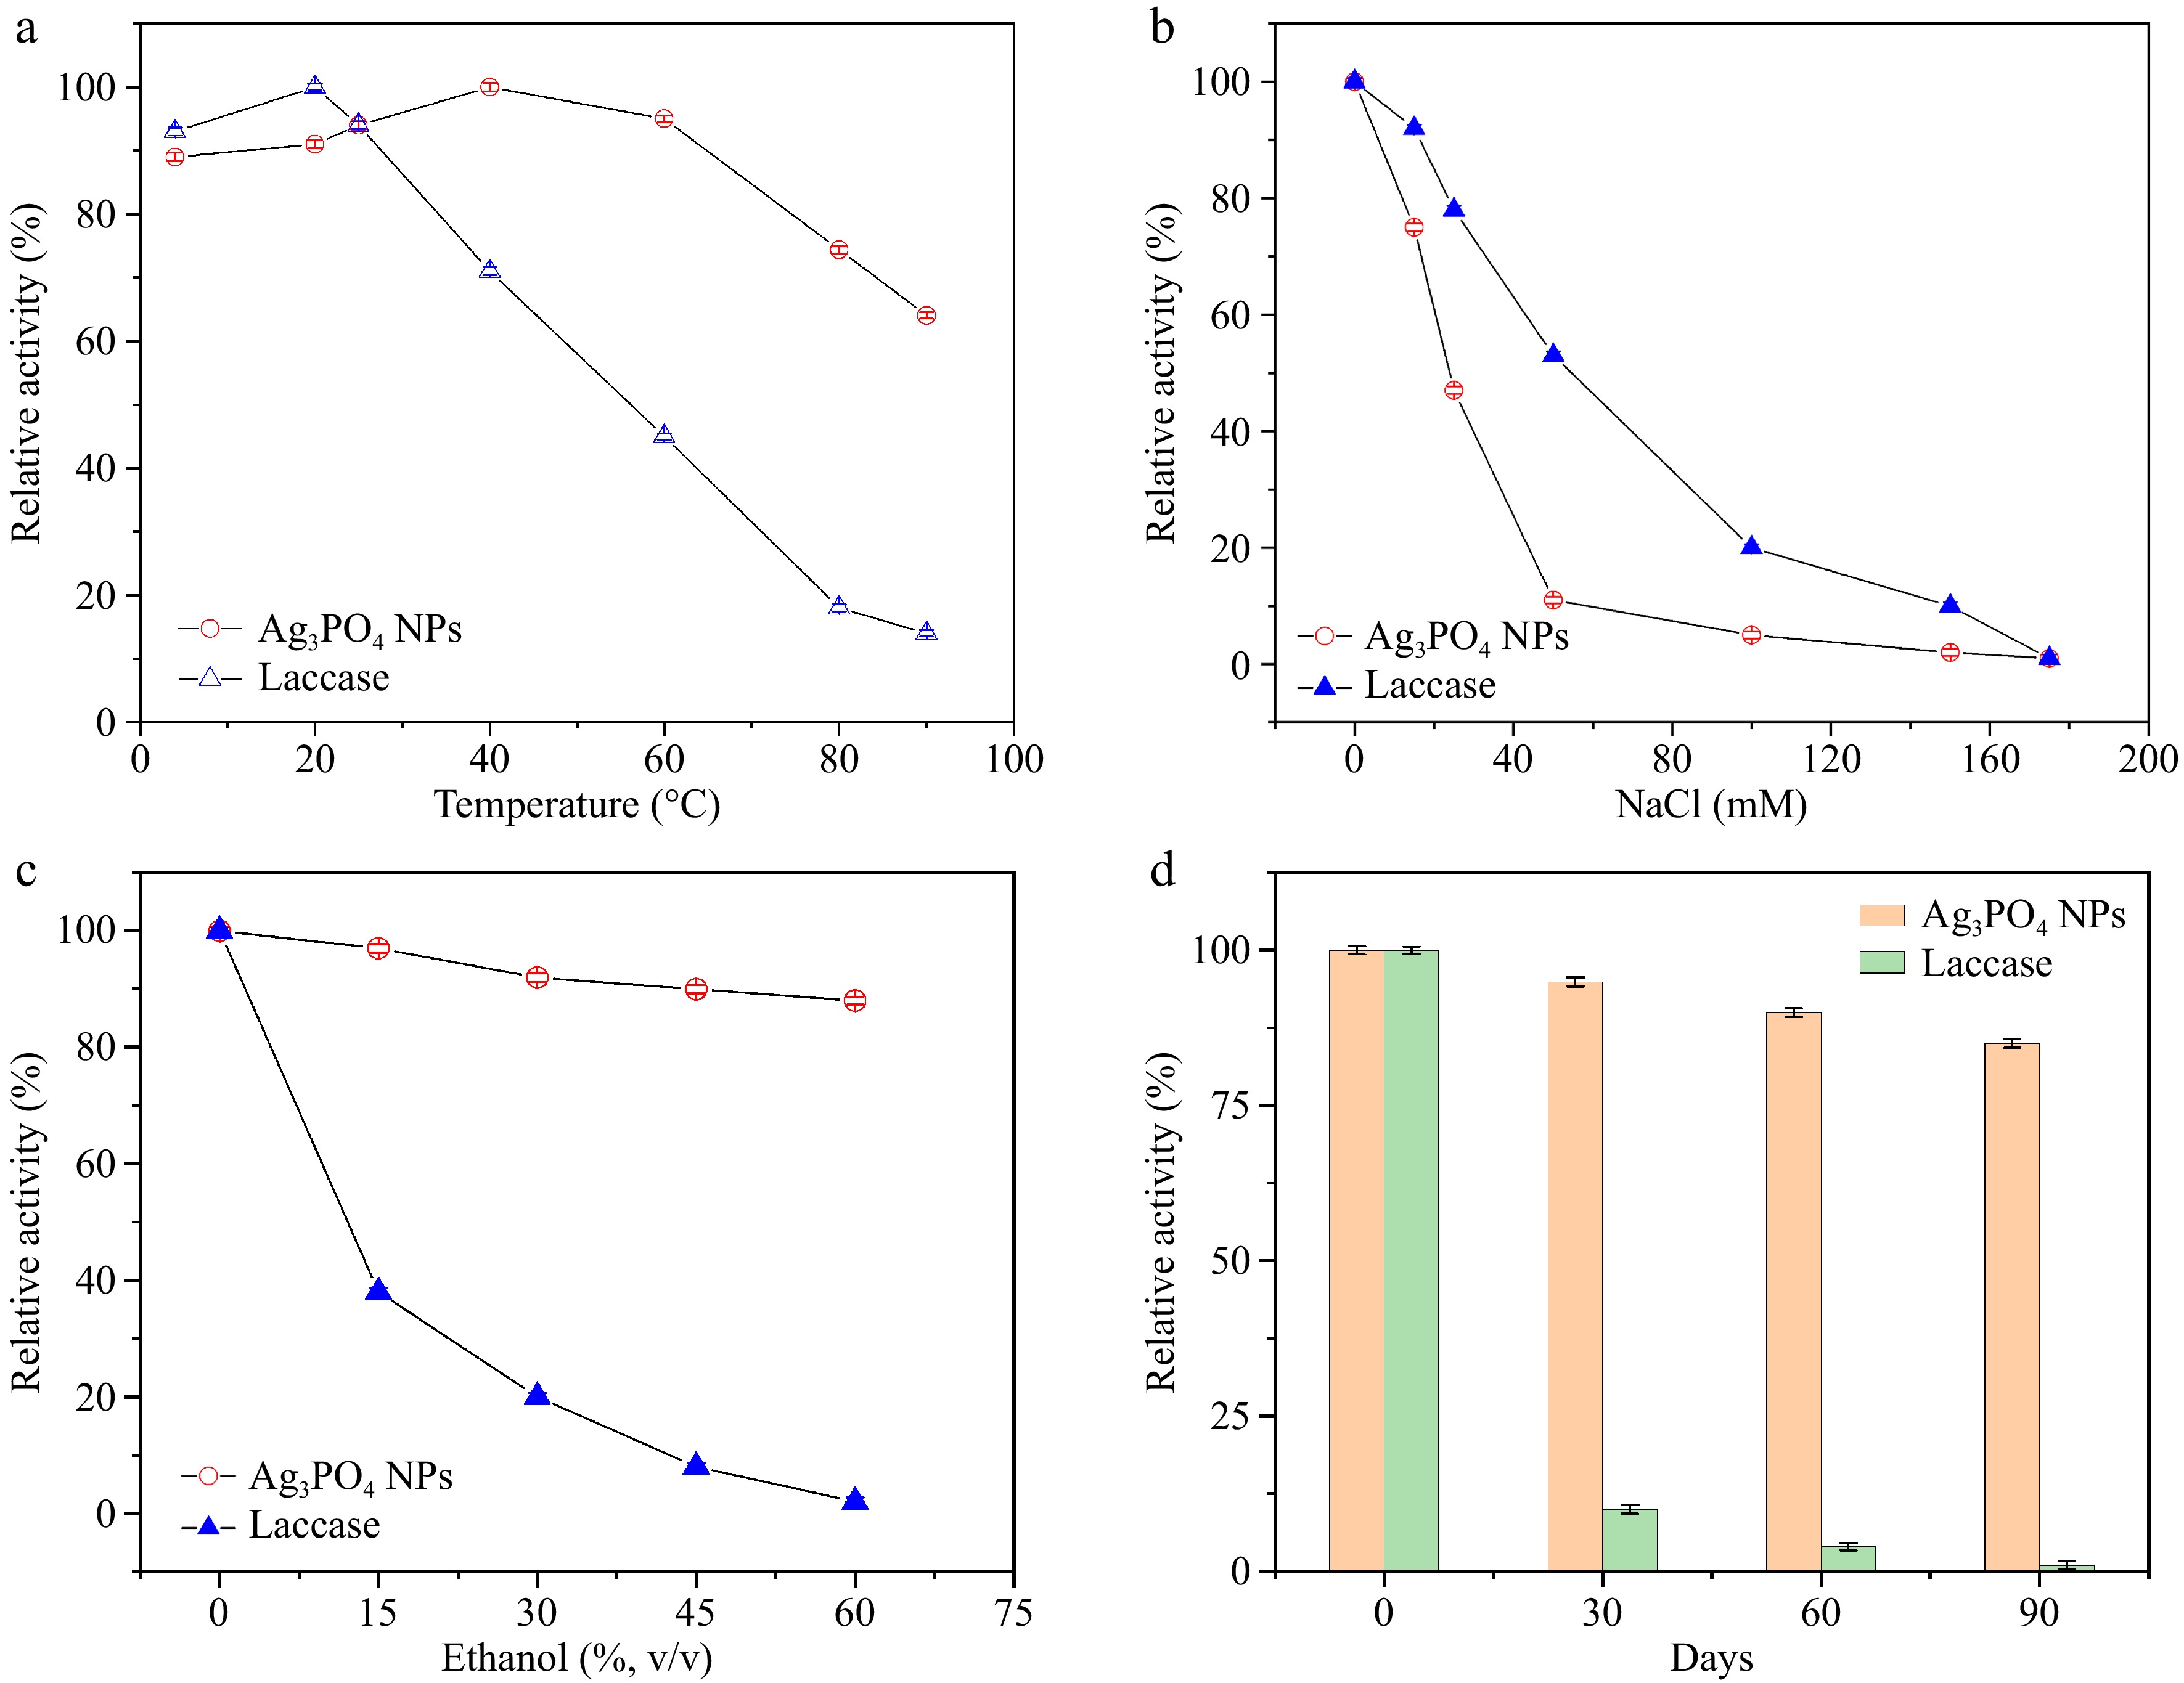
Figure 3.
(a) Impact of temperature on catalytic activity of Ag3PO4 NPs, and laccase. (b) Influence of NaCl concentration on laccase-mimicking catalytic activity of Ag3PO4 NPs. (c) Ethanol tolerance of Ag3PO4 NPs, and laccase. (d) Effect of long-term storage on catalytic activity of Ag3PO4 NPs and laccase.
-
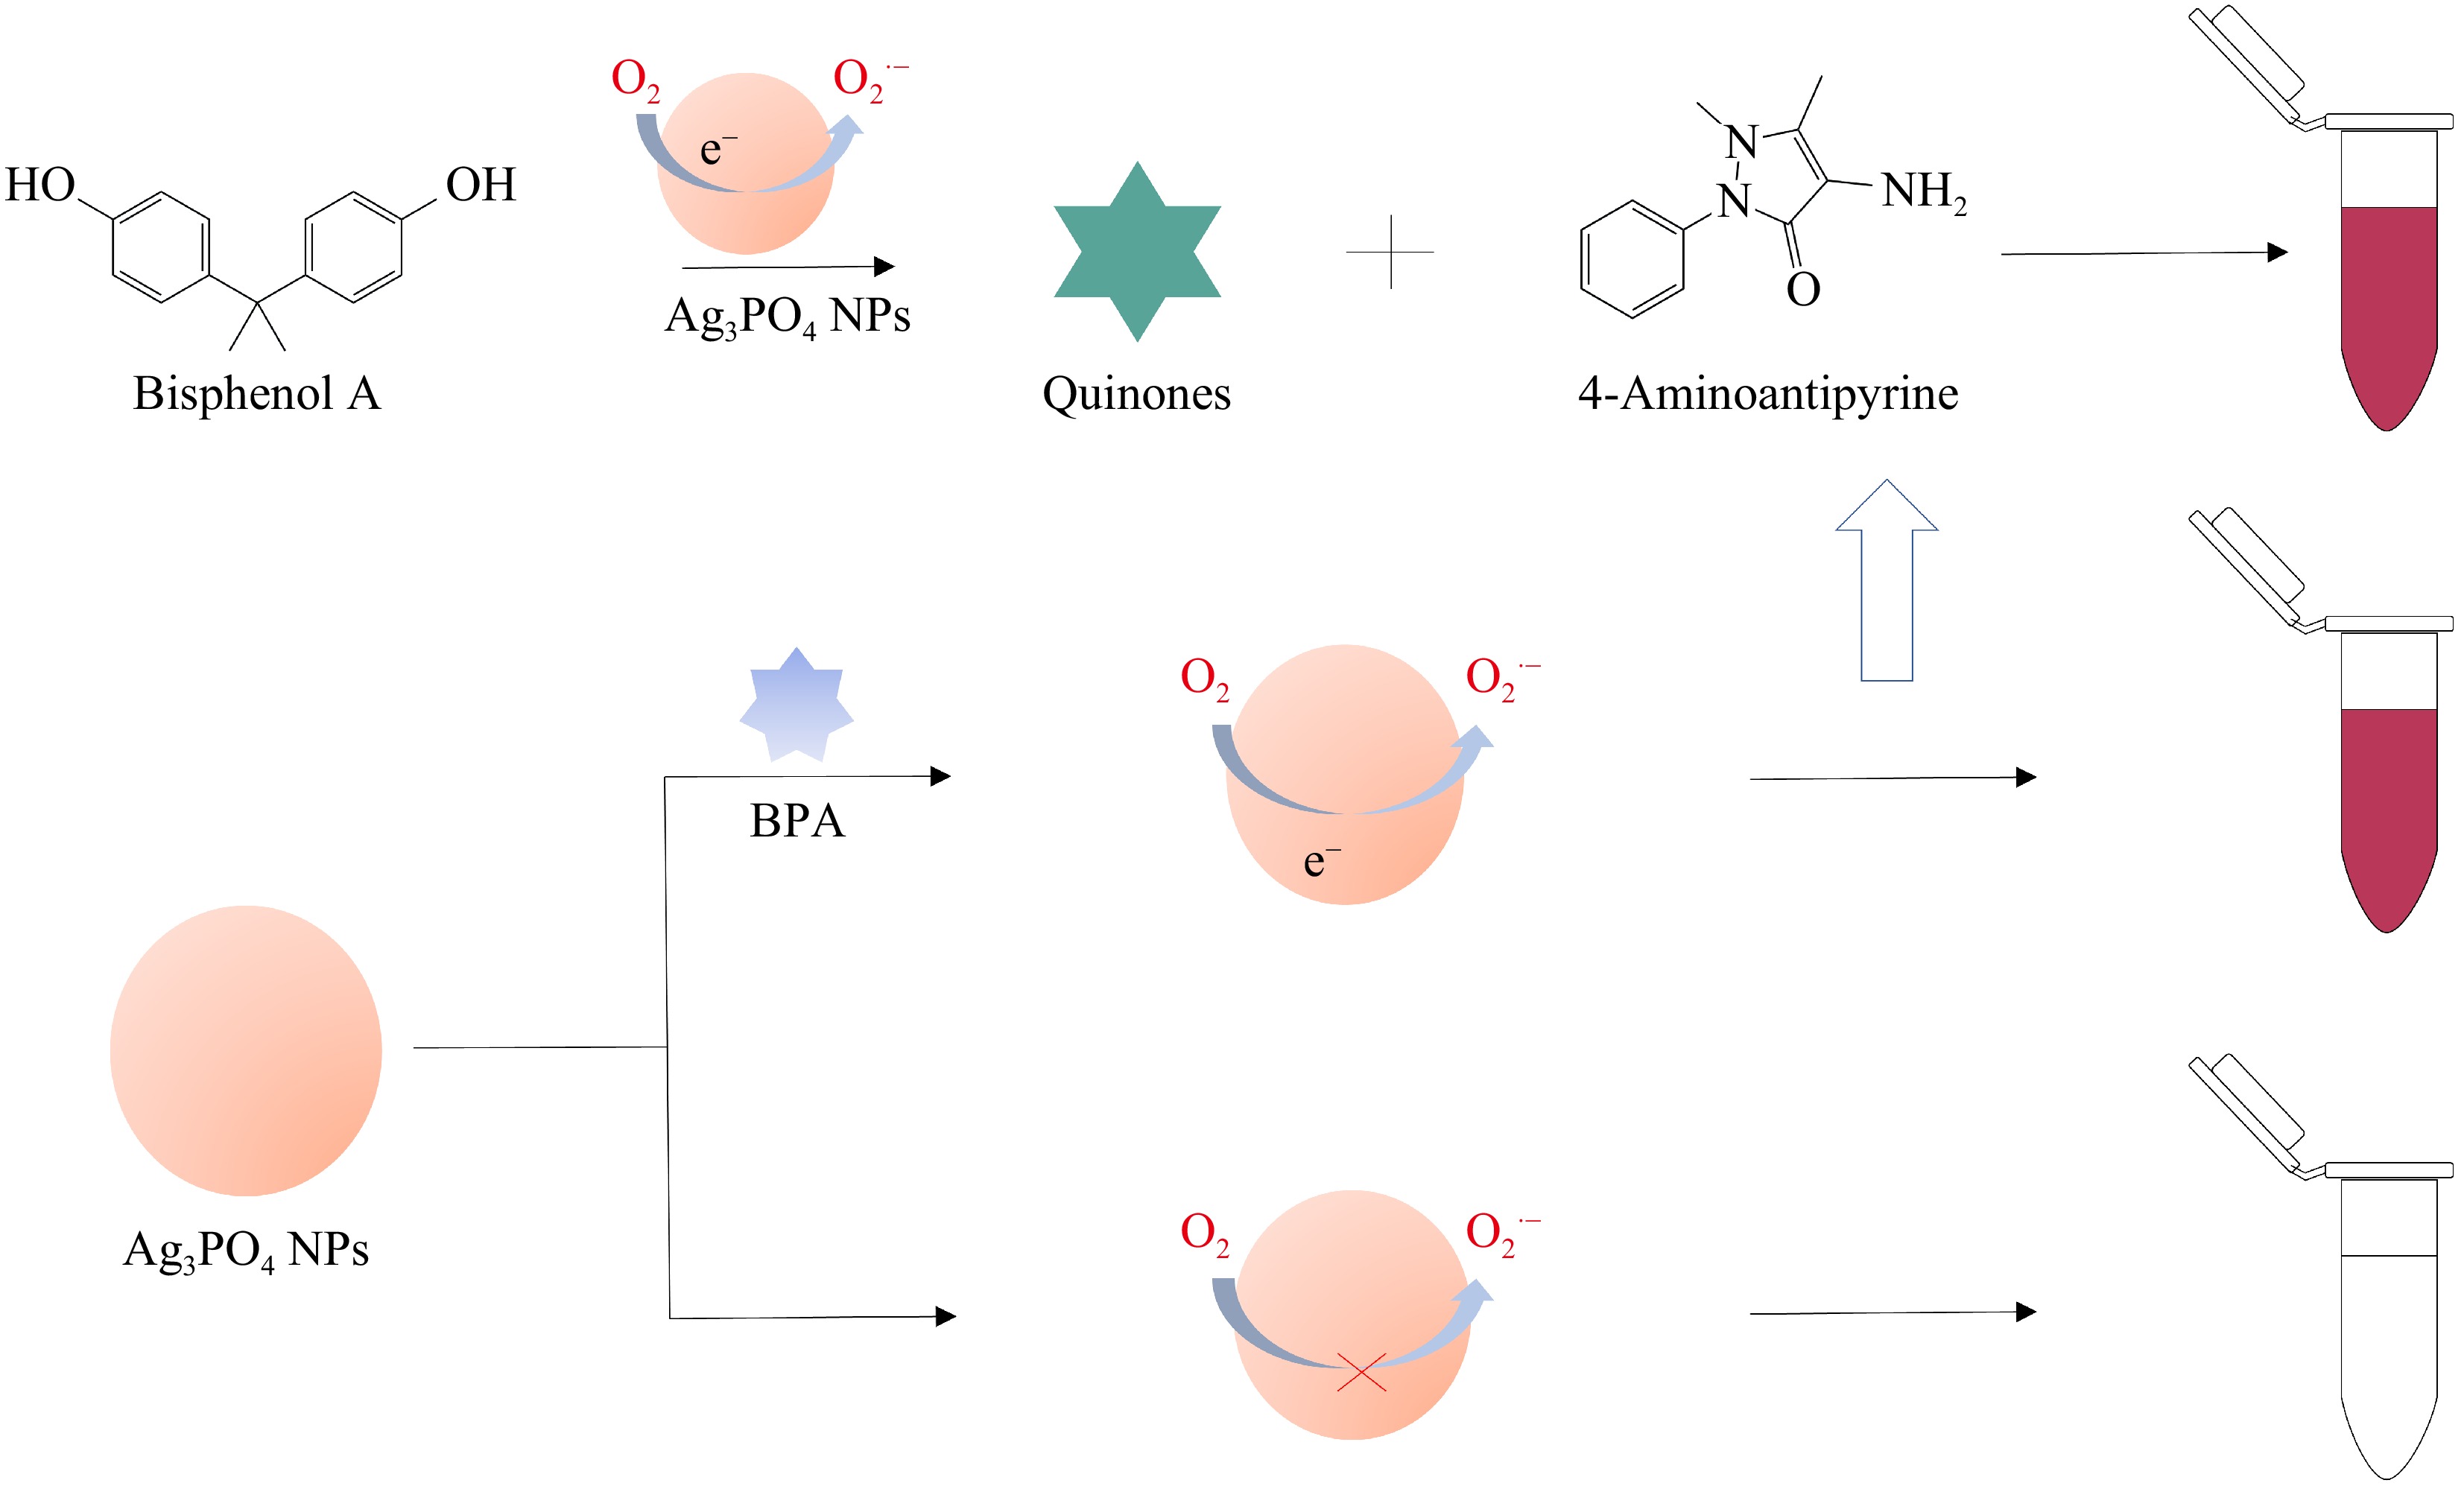
Figure 4.
Illustration of BPA detection using laccase-mimicking activity of Ag3PO4 NPs.
-
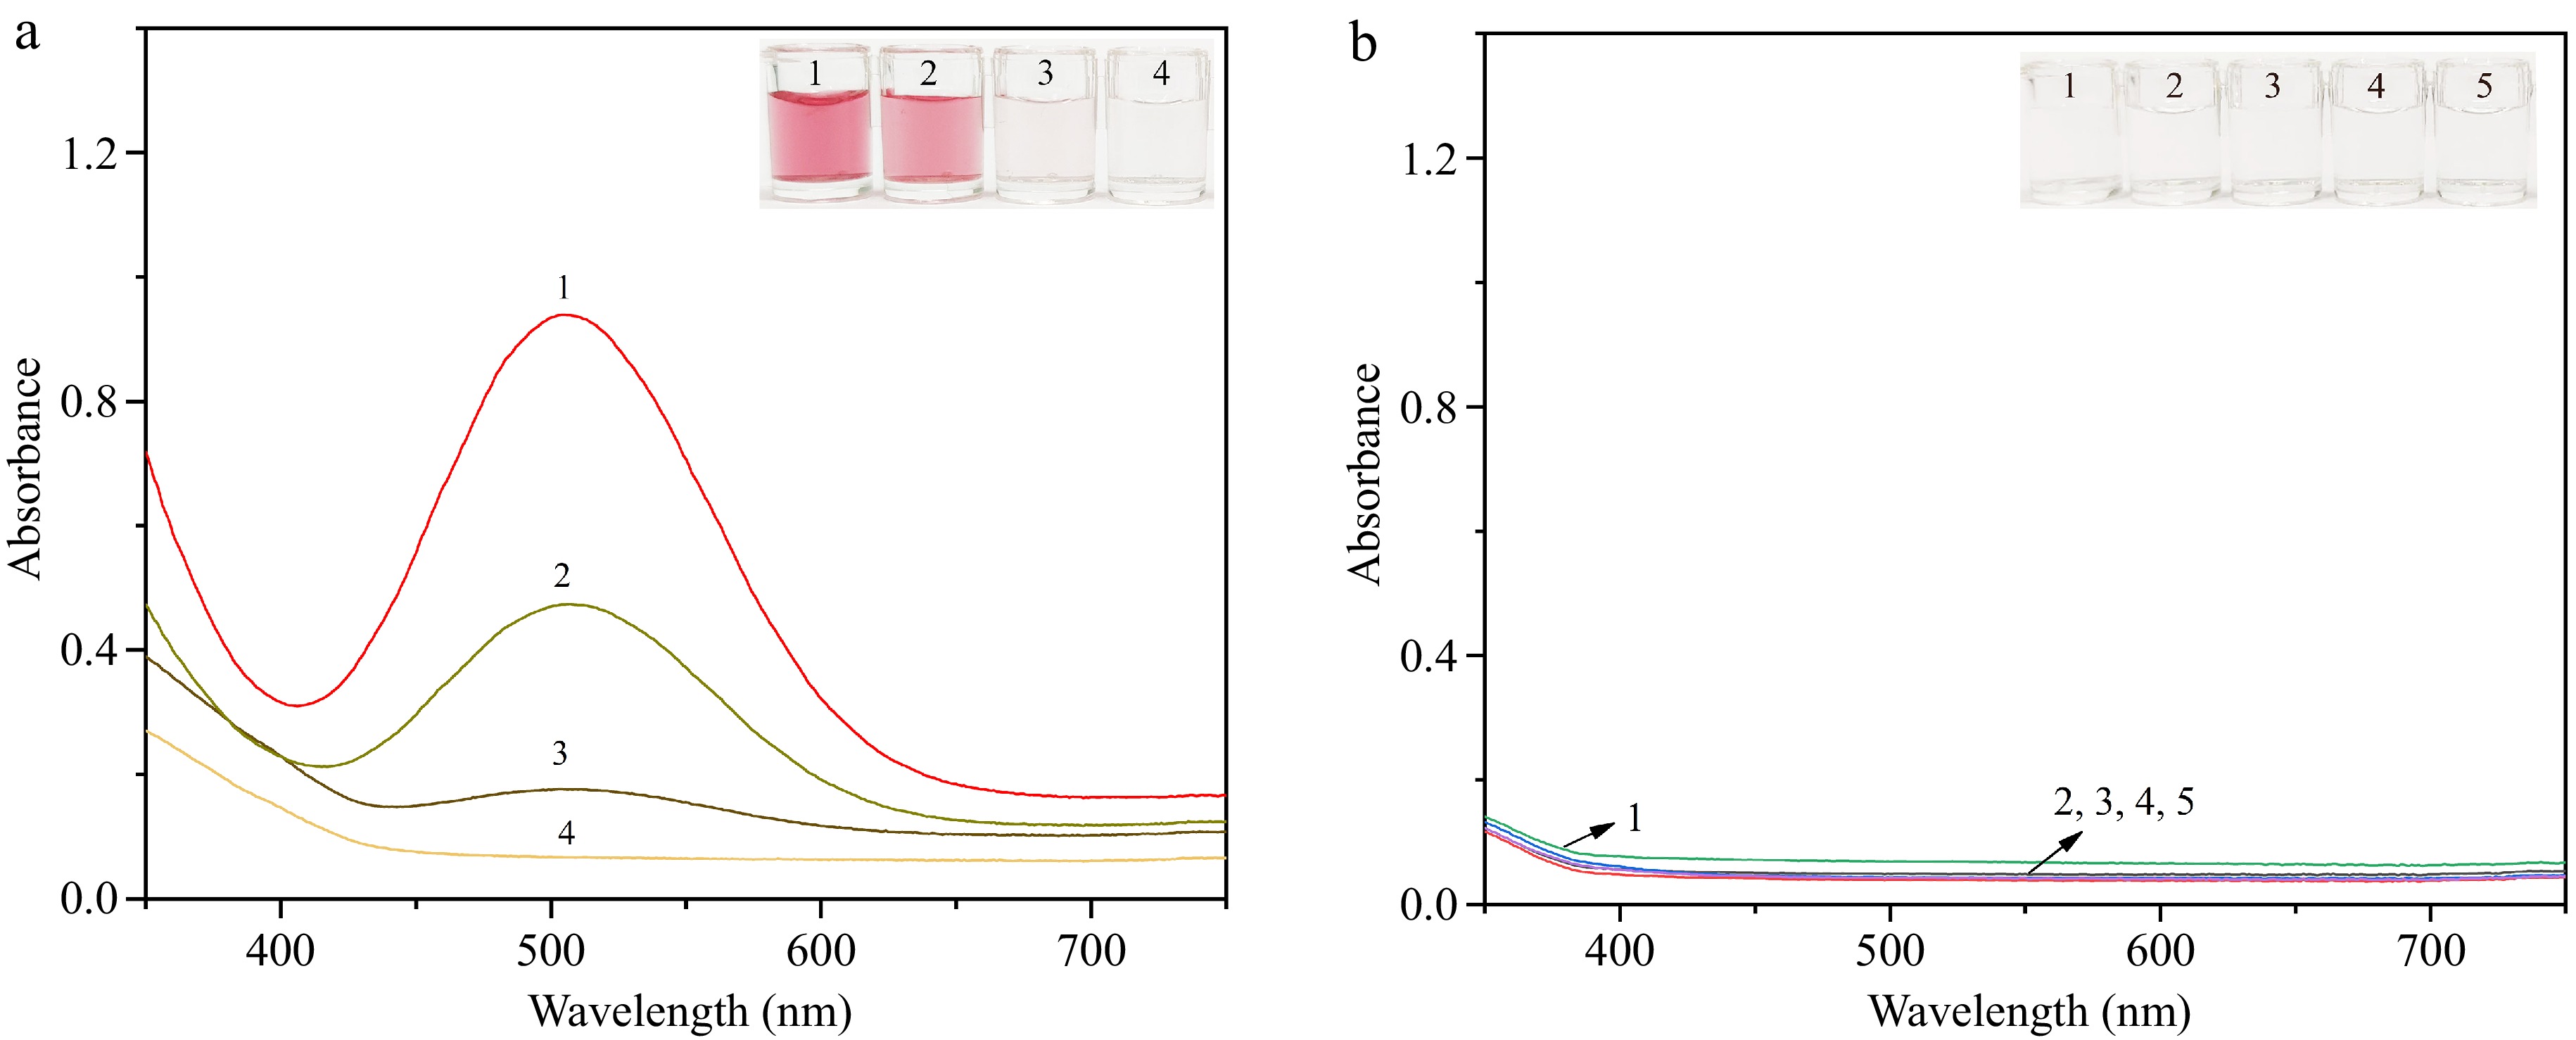
Figure 5.
(a) Visual representation and absorption spectrum profiles of solutions containing varied substances. Sample 1: Ag3PO4 NPs + 0.2 mg·mL−1 BPA + 4-AAP; Sample 2: Ag3PO4 NPs + 0.02 mg·mL−1 BPA + 4-AAP; Sample 3: Ag3PO4 NPs + 0.002 mg·mL−1 BPA + 4-AAP; Sample 4: Ag3PO4 NPs + 4-AAP. (b) Visual image and absorption spectra of the solution containing different substances. Sample 1: Ag3PO4 NPs; Sample 2: 0.2 mg·mL−1 BPA; Sample 3: 4-AAP; Sample 4: Ag3PO4 NPs + 0.2 mg·mL−1 BPA; Sample 5: 0.2 mg·mL−1 BPA + 4-AAP.
-
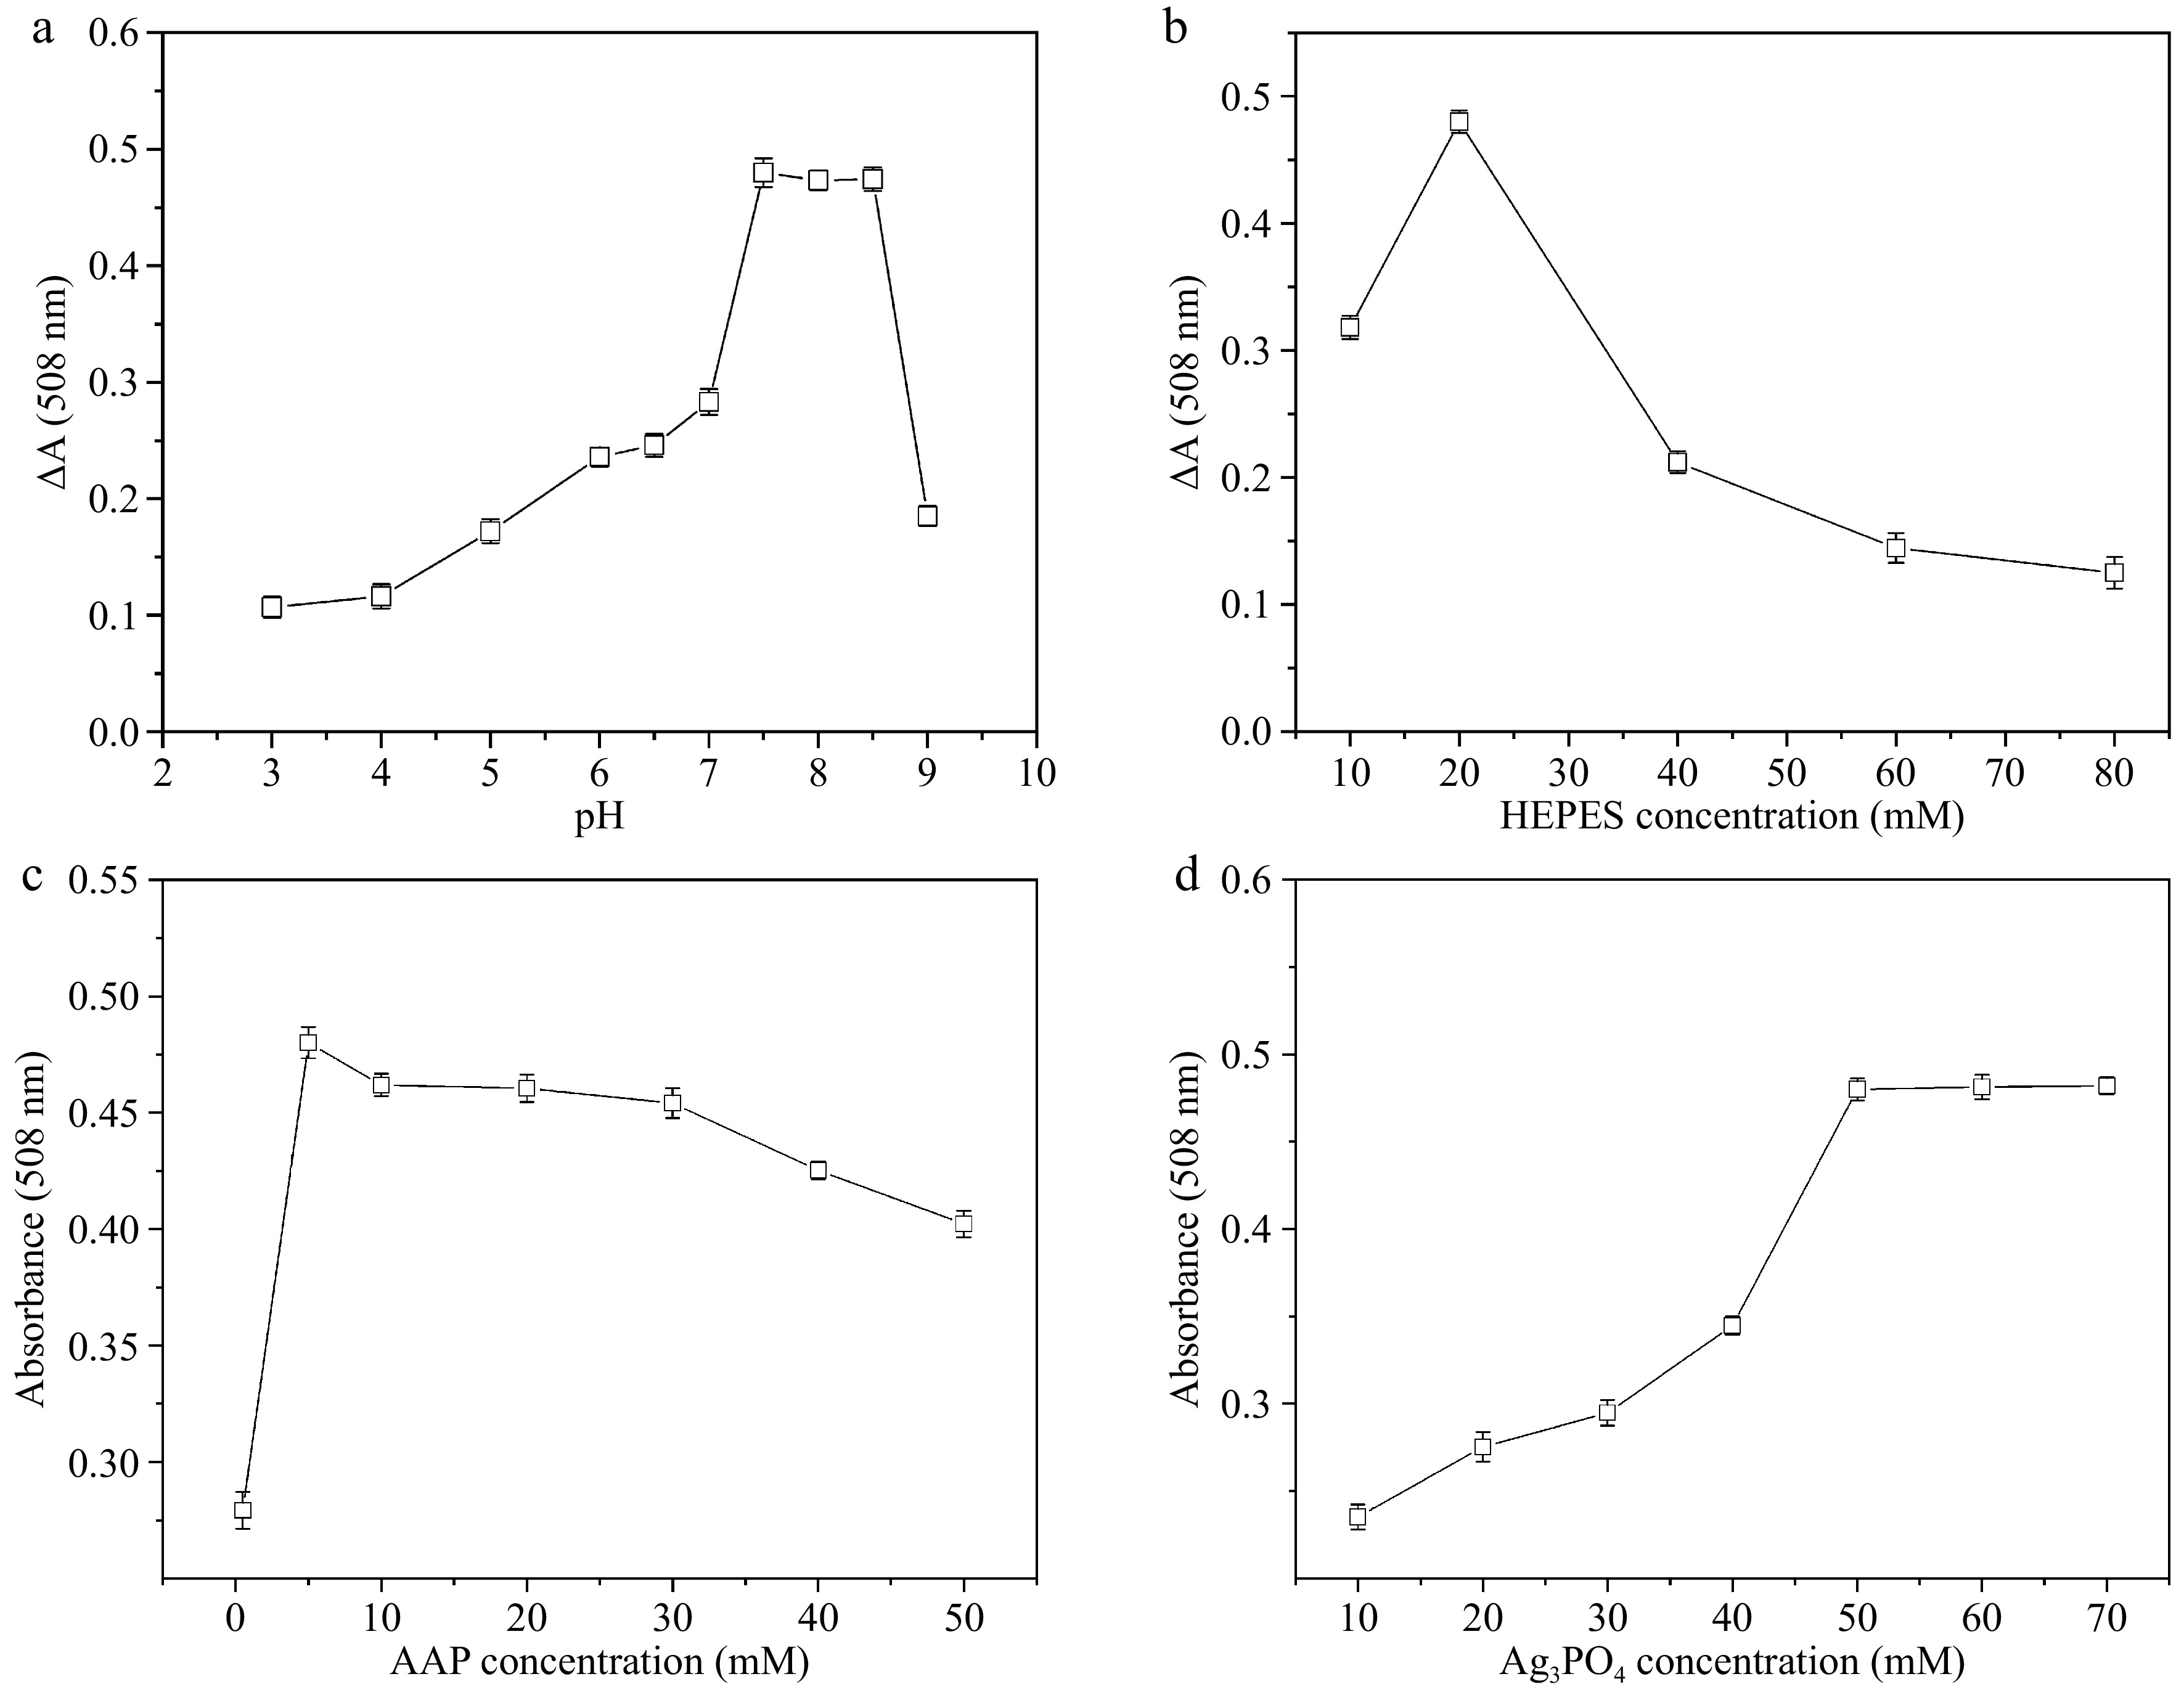
Figure 6.
Effect of (a) pH, (b) HEPES buffer concentration, (c) 4-AAP concentration, (d) Ag3PO4 NPs concentration on ΔA.
-
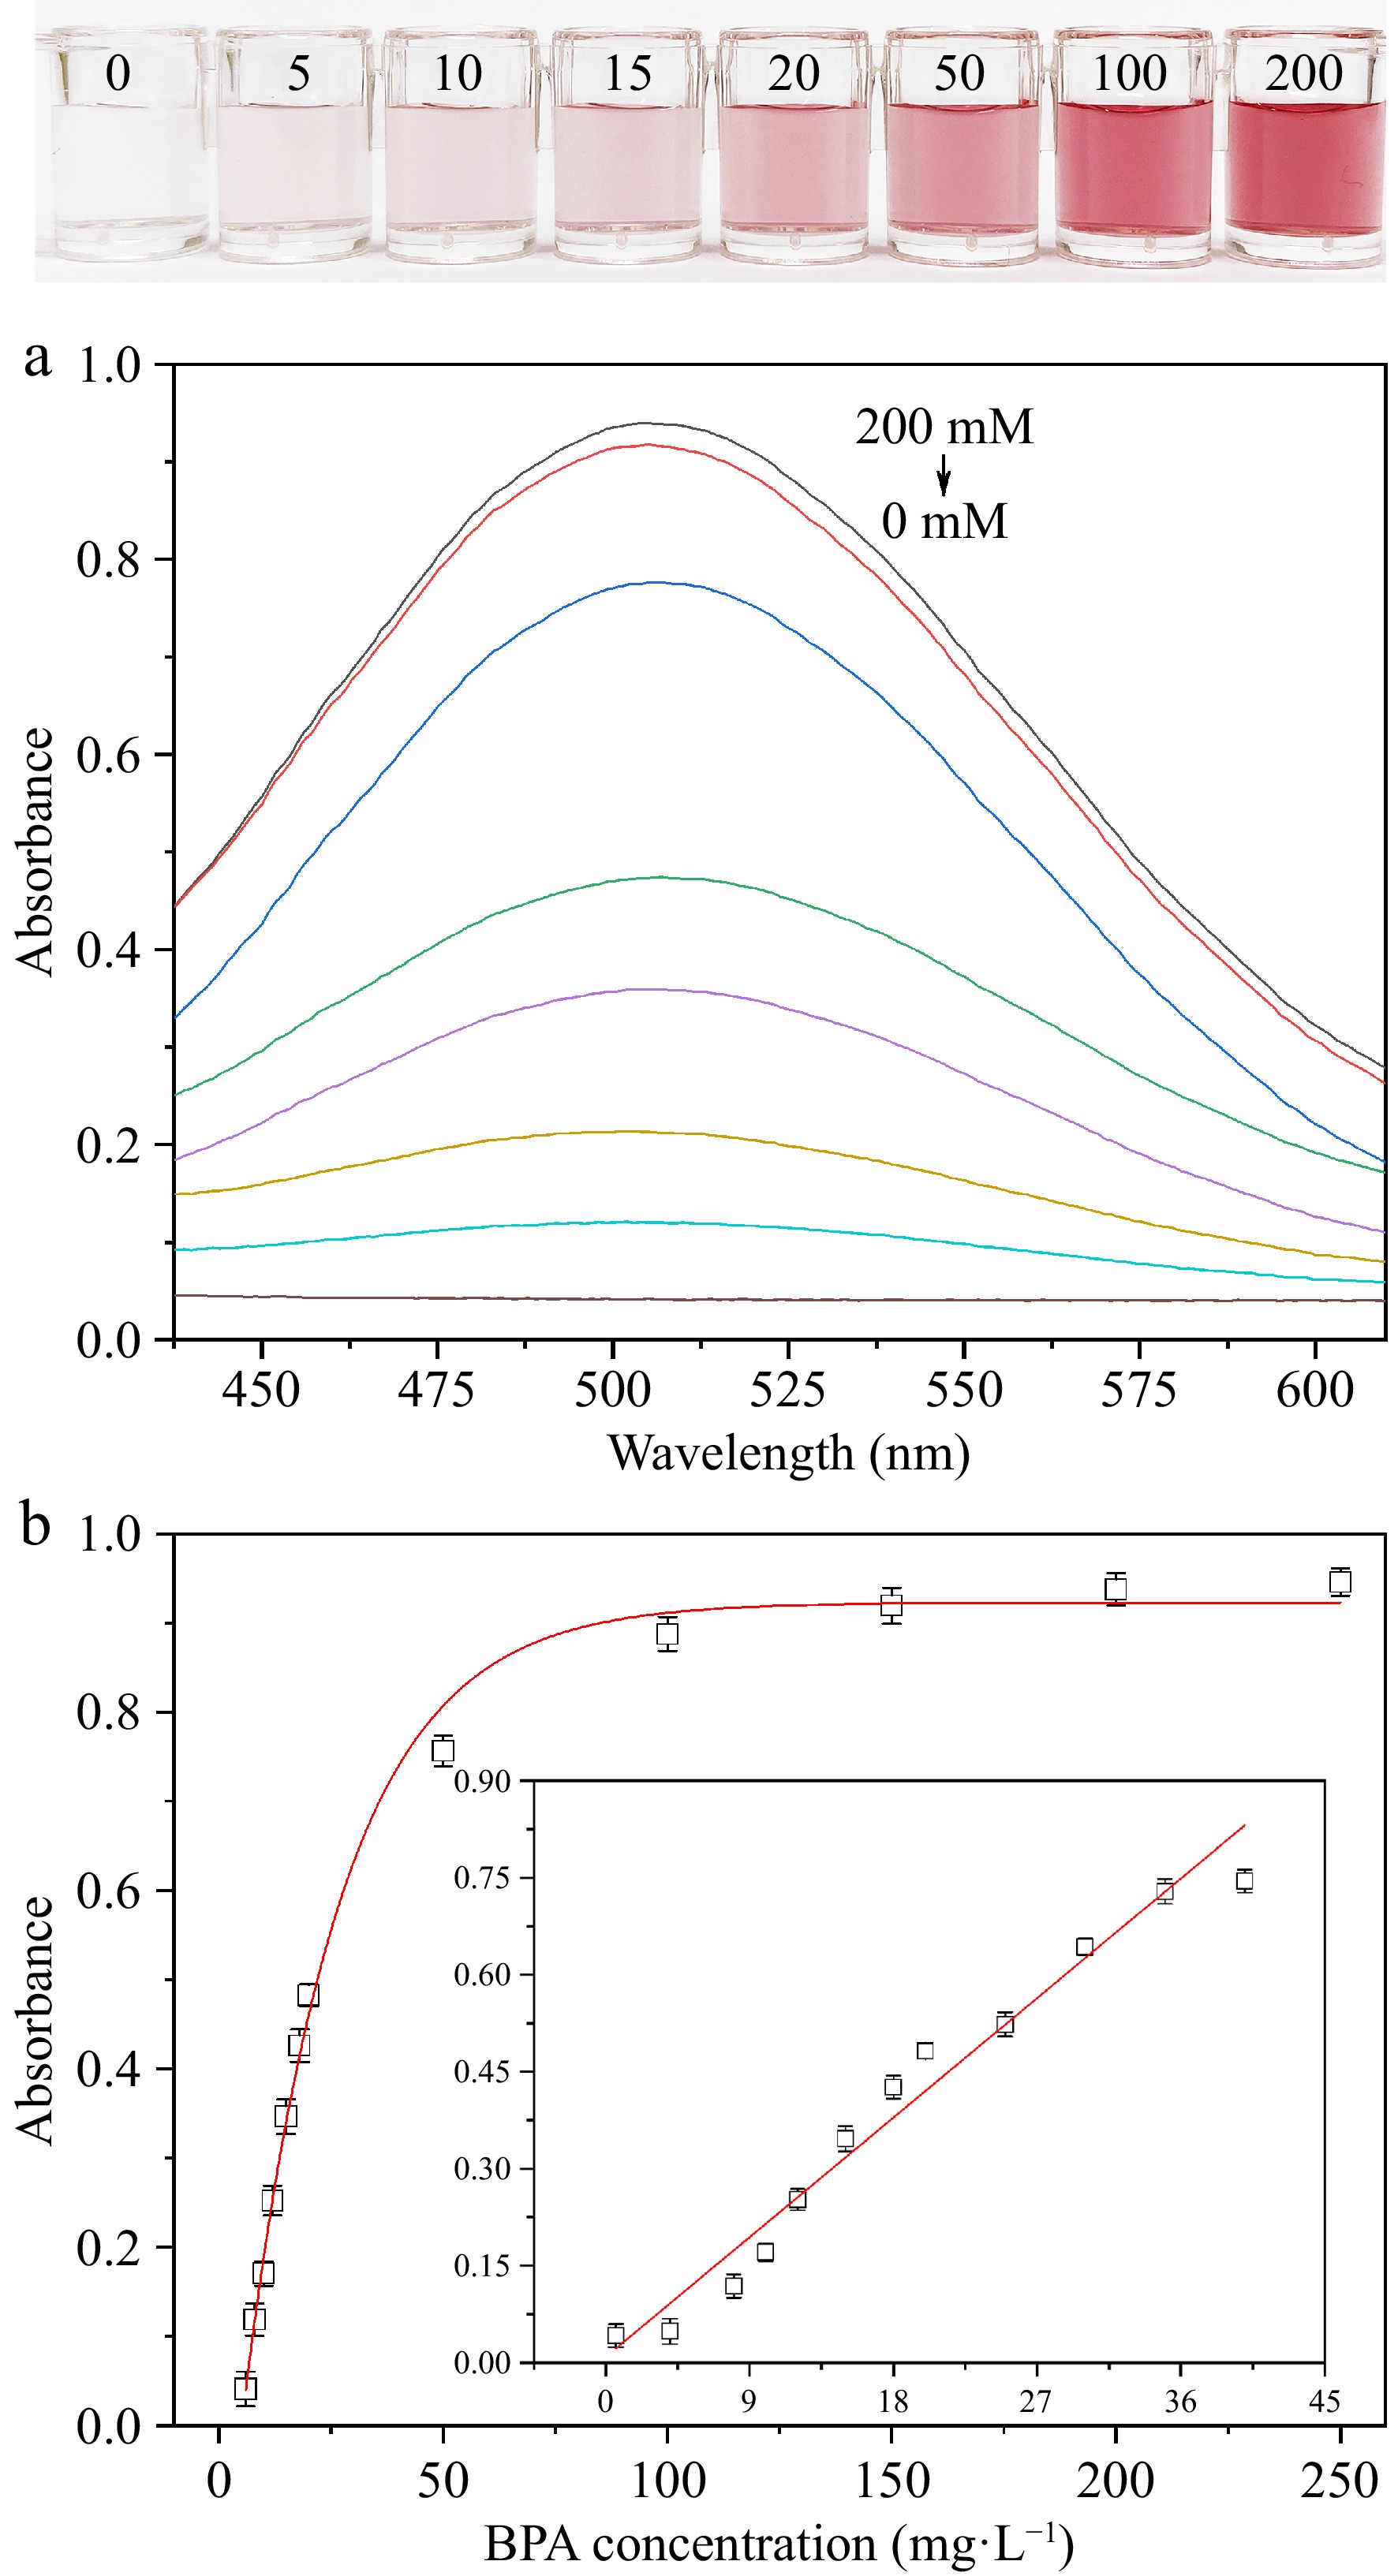
Figure 7.
(a) BPA sensitivity absorption spectrum. (b) Visual image and ΔA at 508 nm of the laccase-mimicking catalytic system added with different quantities of BPA.
-
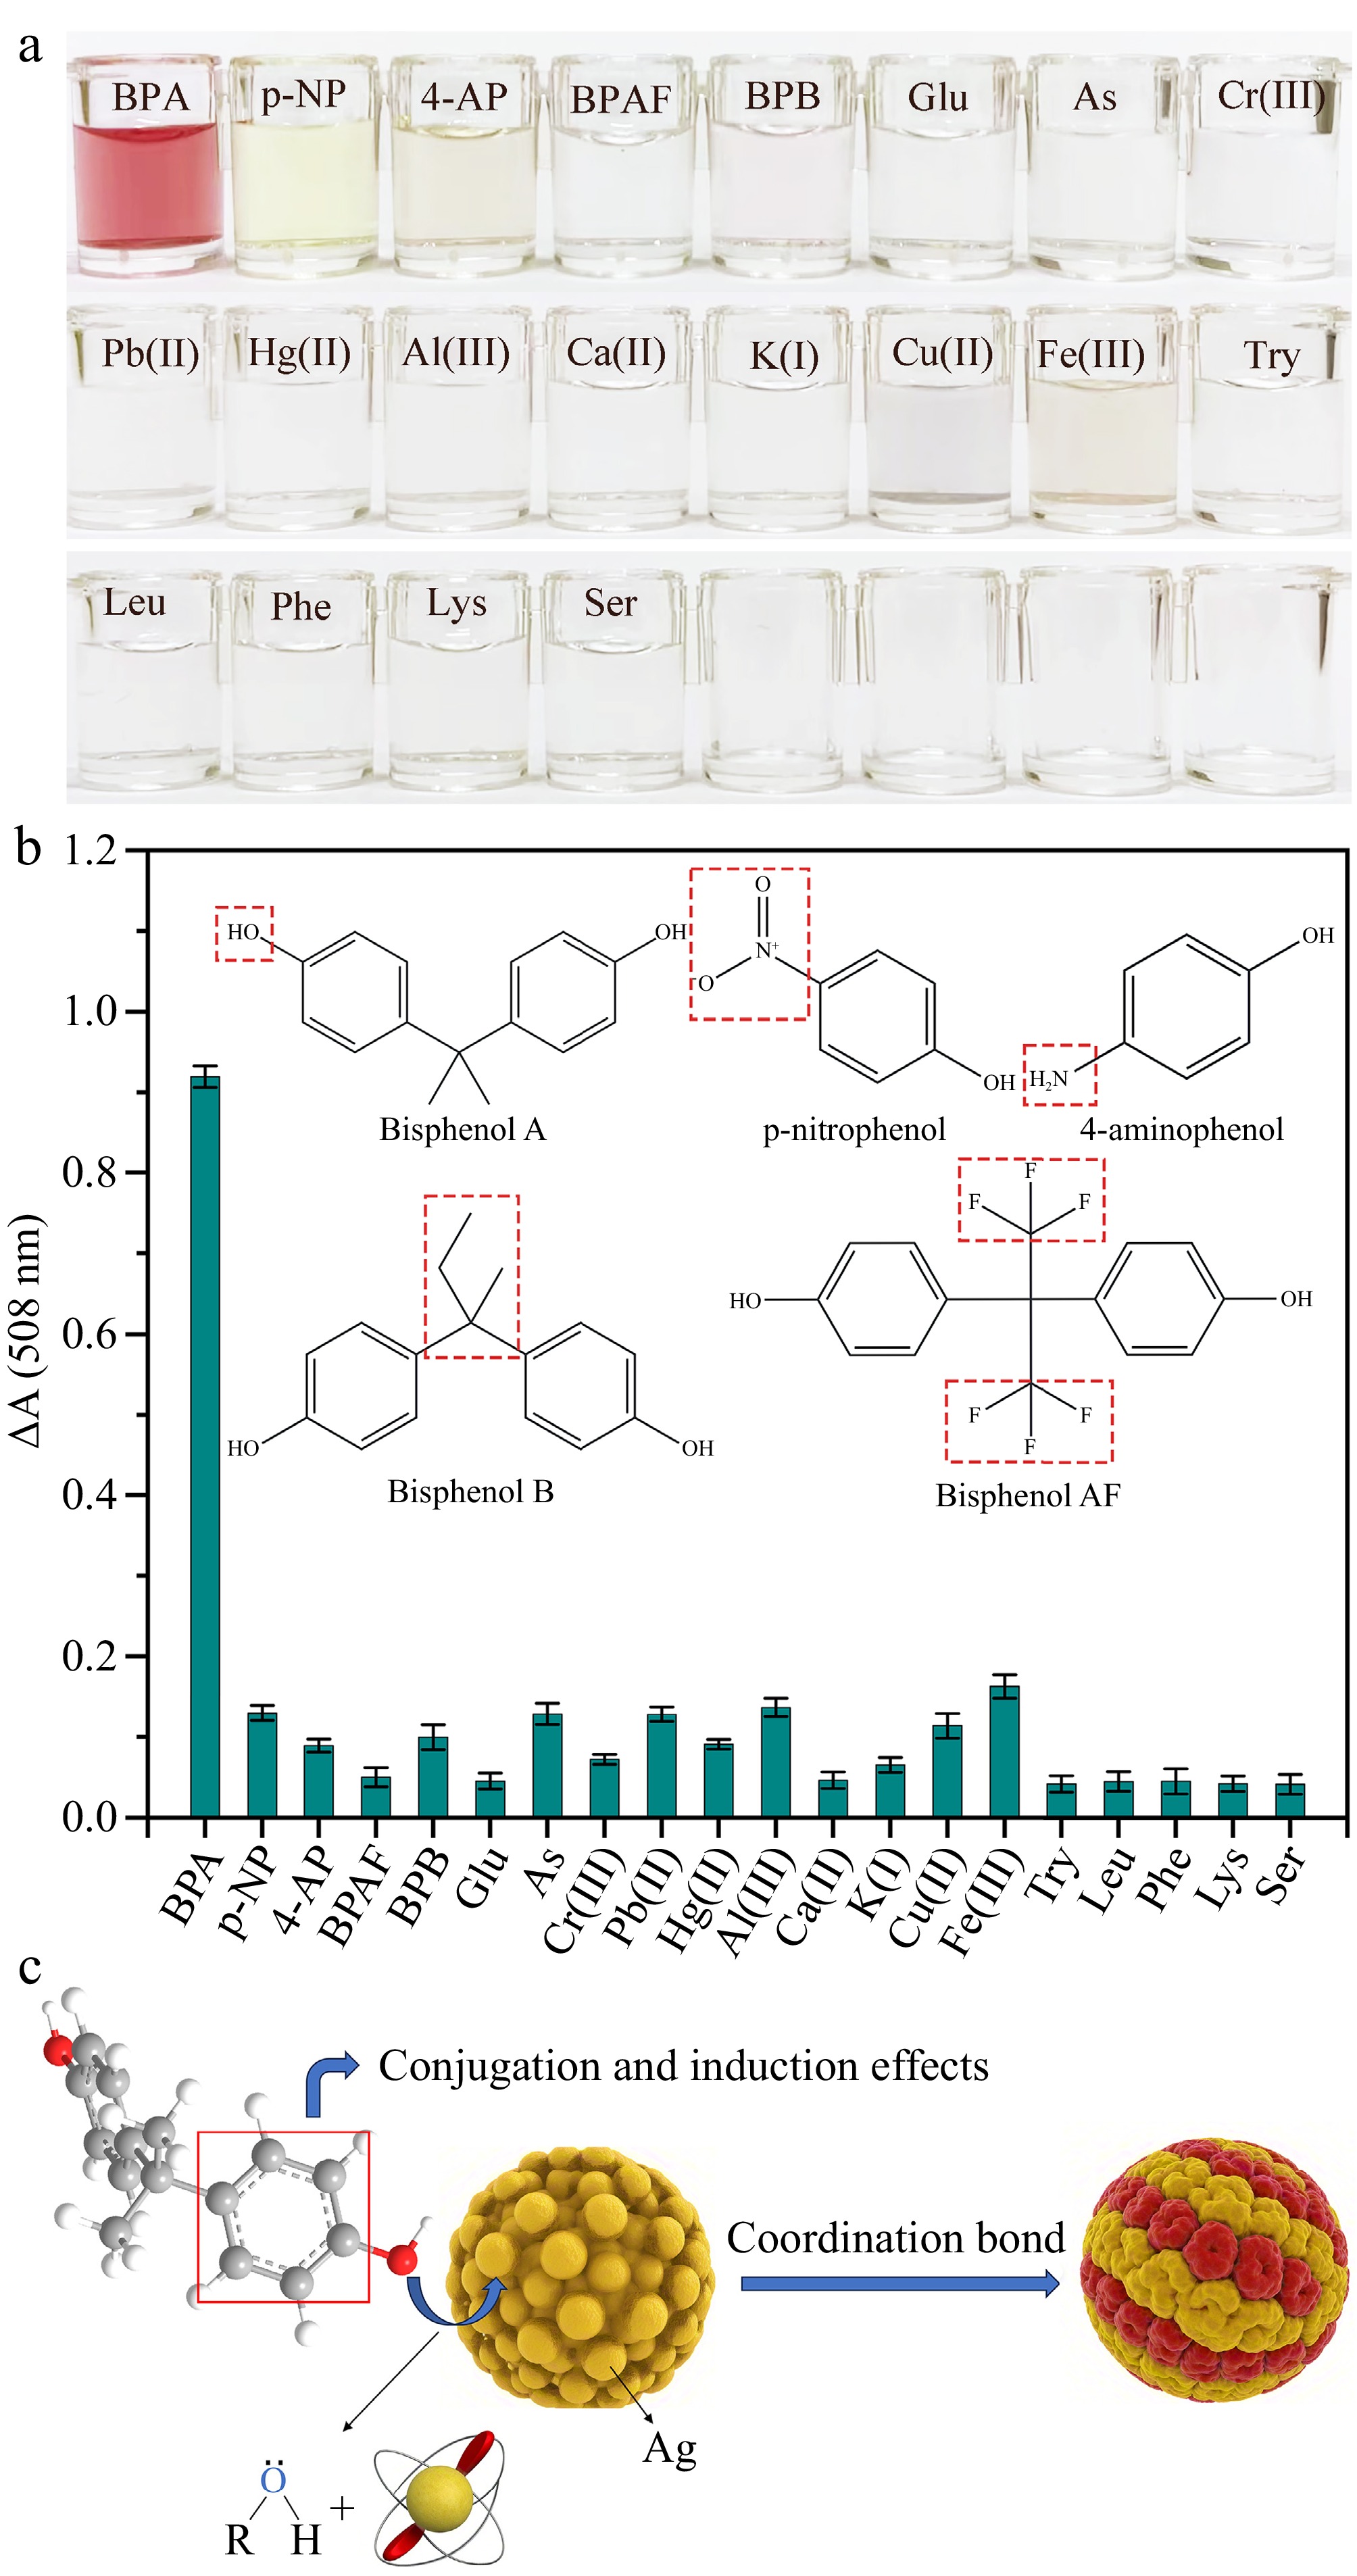
Figure 8.
(a), (b) Visual image and ΔA at 508 nm of the laccase-mimicking catalytic system added with 0.2 mg·mL−1 of BPA and different competitive substances. (c) Schematic illustration of the coordination between BPA and Ag3PO4 NPs.
-
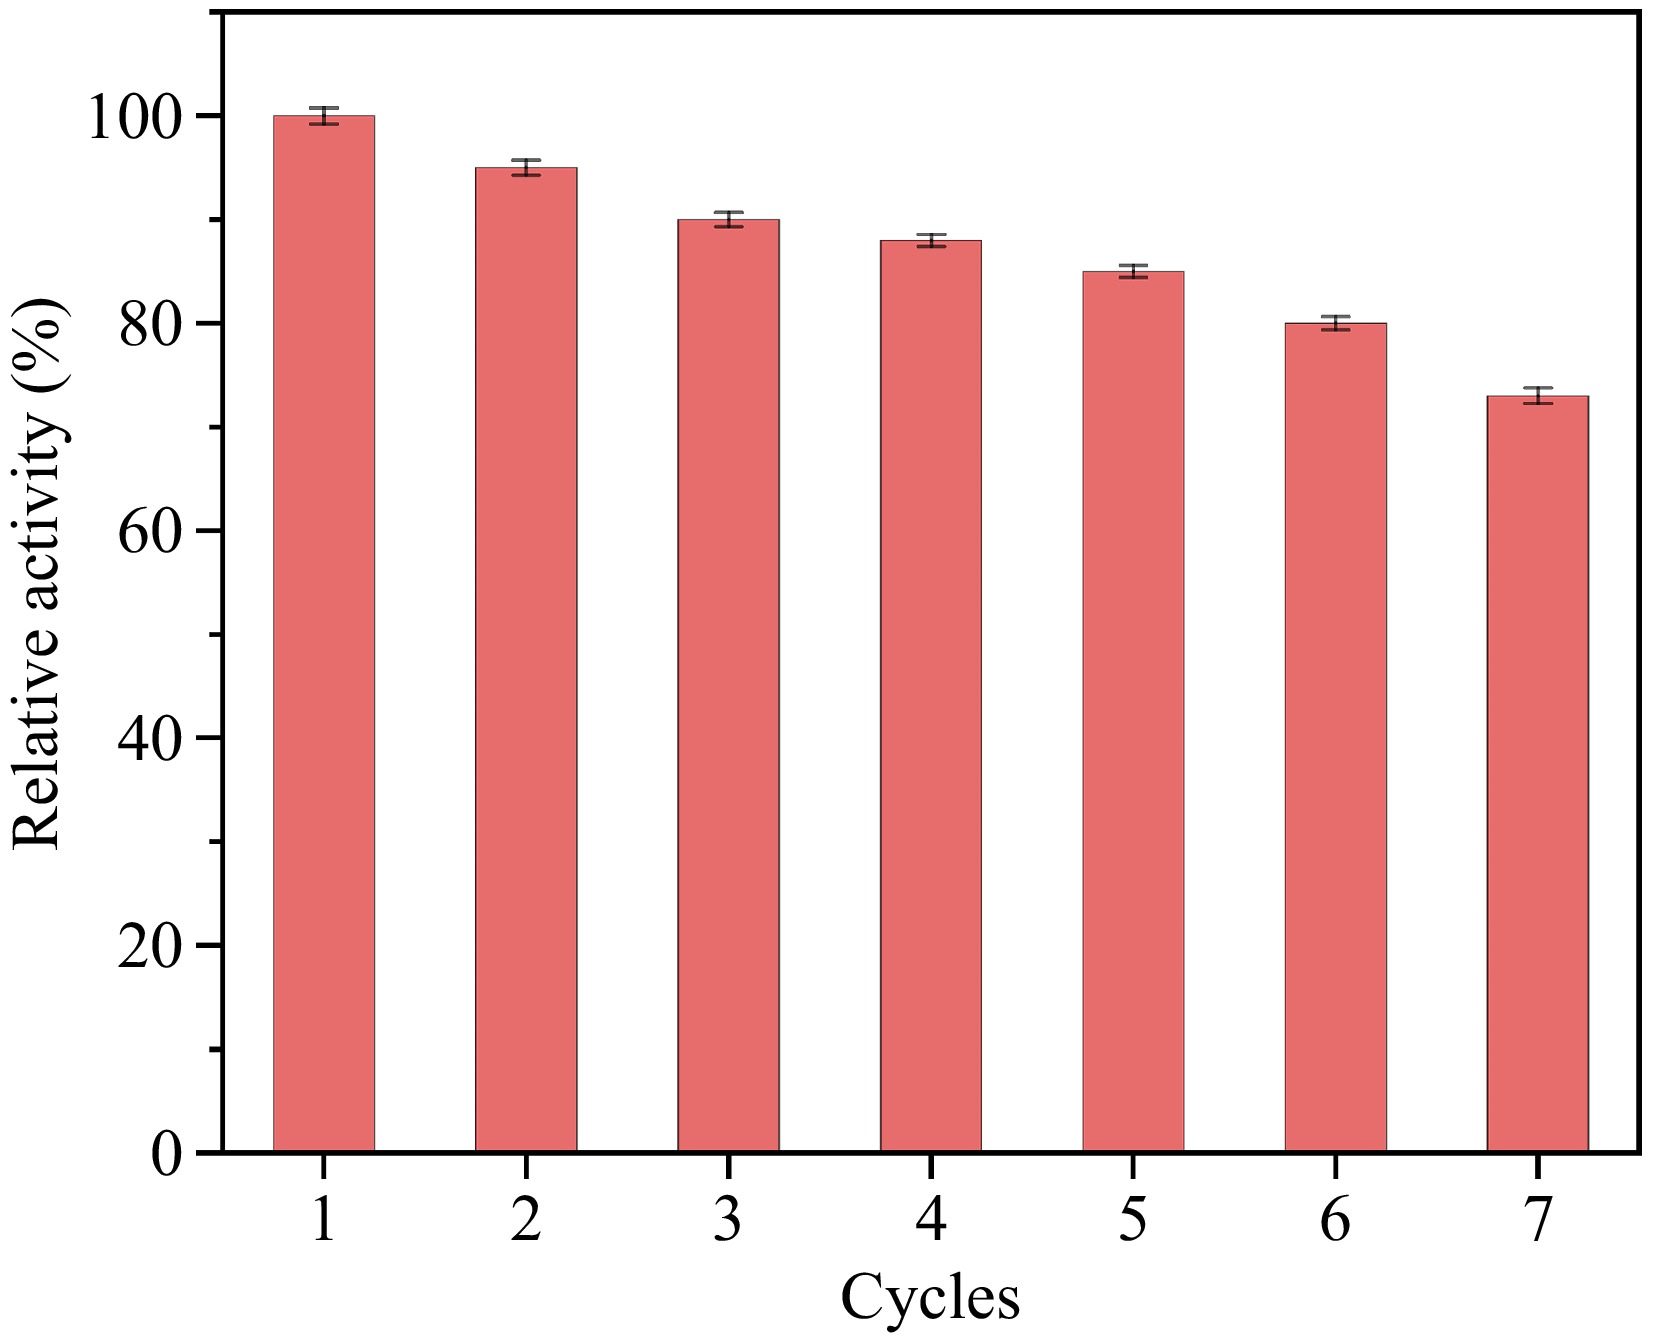
Figure 9.
The recyclability of Ag3PO4 NPs. The activity of 100% is set where absorbance is highest and the relative activities of other samples are calculated based on this standard. The Ag3PO4 NPs are recovered through centrifugation at 10,000 rpm for 10 min, washed with double-distilled water, and then re-disperse.
-
Table 1.
Comparison of similar methods for BPA detection.
-
Sample Spiked
(mg·L−1)This method LC-MS/MS Found
(mg·L−1)Recovery
(%)RSD
(%)Found
(mg·L−1)Recovery
(%)RSD
(%)Tap water 10.0 9.1 91.0 3.5 8.3 83.0 3.7 20.0 19.5 97.5 4.7 18.7 93.5 3.2 30.0 29.3 97.7 6.2 29.6 98.7 4.5 Bottled water 10.0 9.4 94.0 4.9 8.7 87.0 2.7 20.0 19.0 95.0 3.8 18.5 92.5 3.3 30.0 28.4 94.7 5.1 29.3 97.7 5.0 Bottled honey 10.0 9.7 97.0 5.8 9.2 92.0 2.9 20.0 20.2 101.0 4.9 18.9 94.5 3.6 30.0 28.9 96.3 6.0 29.2 97.3 5.5 Table 2.
Determination of BPA in actual samples.
Figures
(9)
Tables
(2)