-
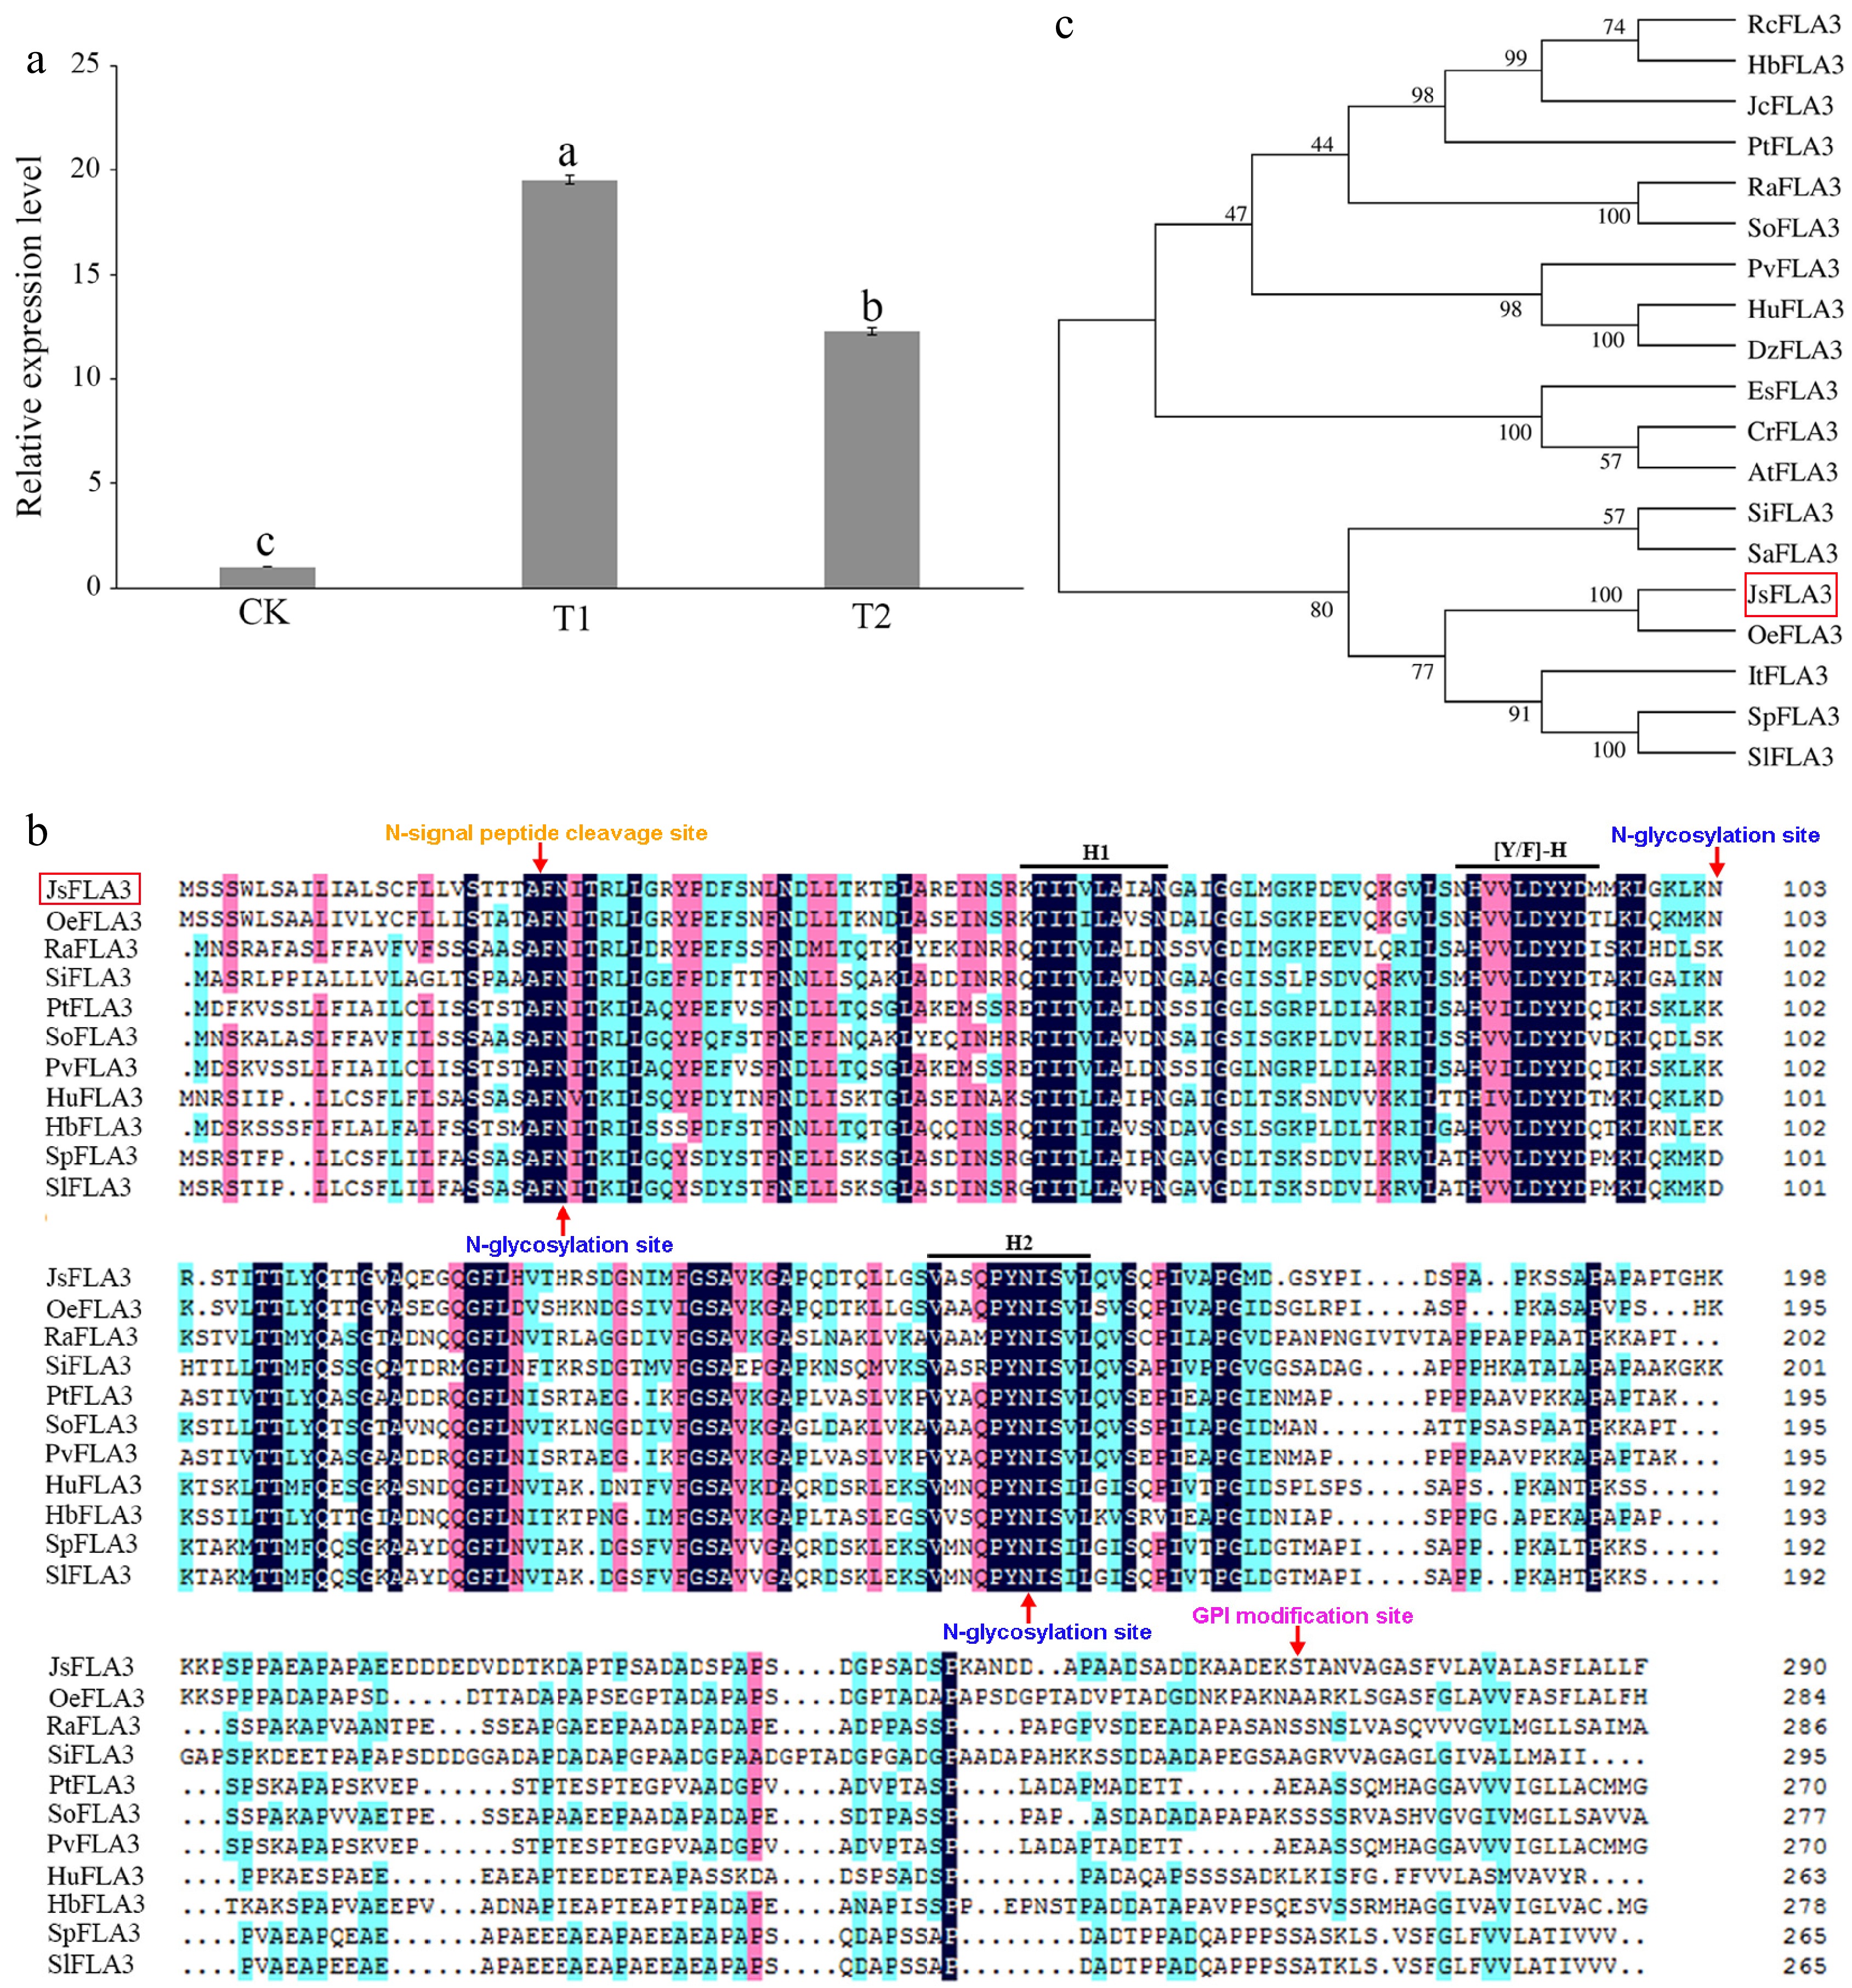
Figure 1.
Characterization of the JsFLA3. (a) Expression pattern analysis of JsFLA3 in stigma among T1, T2, and CK. CK, T1, and T2 represented stigmas at 0, 1, and 6 h after pollination, respectively. Values are shown as mean ± SE (n = 3). Columns headed by a different letter indicate significantly different JsFLA3 transcript abundances (p < 0.05). (b) Amino acid comparison between JsFLA3 and FLA3 homologs from other species. H1, [Y/F]-H, and H2 indicated three conserved domains of JsFLA3 and FLA3 homologs. (c) Phylogenetic tree of FLA3s. Oe, Olea europaea var. sylvestris; Ra, Rhodamnia argentea; Si, Setaria italic; Pt, Populus trichocarpa; So, Syzygium oleosum; Pv, Pistacia vera; Hu, Herrania umbratica; Hb, Hevea brasiliensis; Sp, Solanum pennellii; Sl, Solanum lycopersicum; Rc, Ricinus communis; Jc Jatropha curcas; Dz, Durio zibethinus; Es, Eutrema salsugineum; Cr, Capsella rubella; At, Arabidopsis thaliana; Sa, Striga asiatica; It, Ipomoea triloba. The bootstrap values were shown at the nodes. The red box indicated JsFLA3.
-
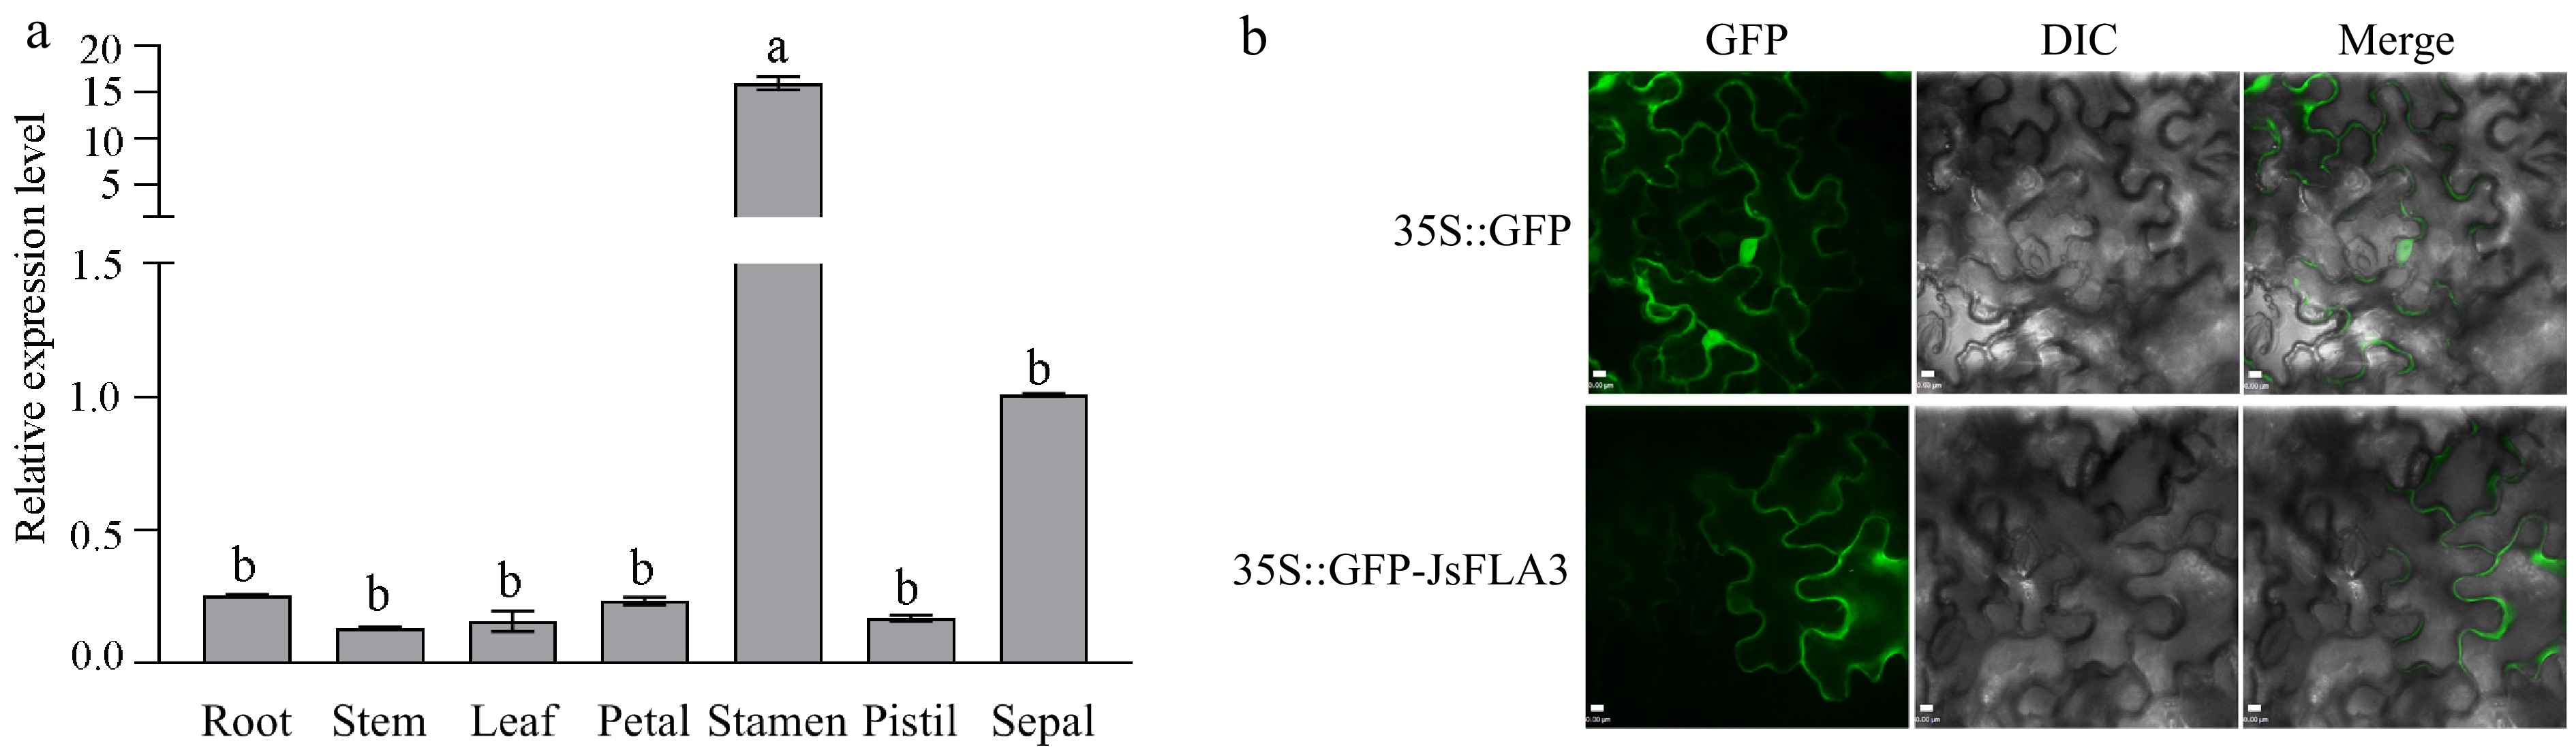
Figure 2.
The expression pattern analysis of JsFLA3. (a) Differential expression pattern analysis of JsFLA3 in various tissues of J. sambac 'Danbanmoli'. Values are shown as mean ± SE (n = 3). Columns headed by a different letter indicate significantly different JsFLA3 transcript abundances (p < 0.05). (b) Subcellular location of JsFLA3 in N. benthamiana epidermal cells. GFP, images photographed in the green fluorescence channel; DIC, images photographed in bright light channel; Merge, overlay plots. 35S::GFP, empty vector pORE-R4; 35S::GFP-JsFLA3, vector pORE-R4-JsFLA3. Bar: 50 μm.
-
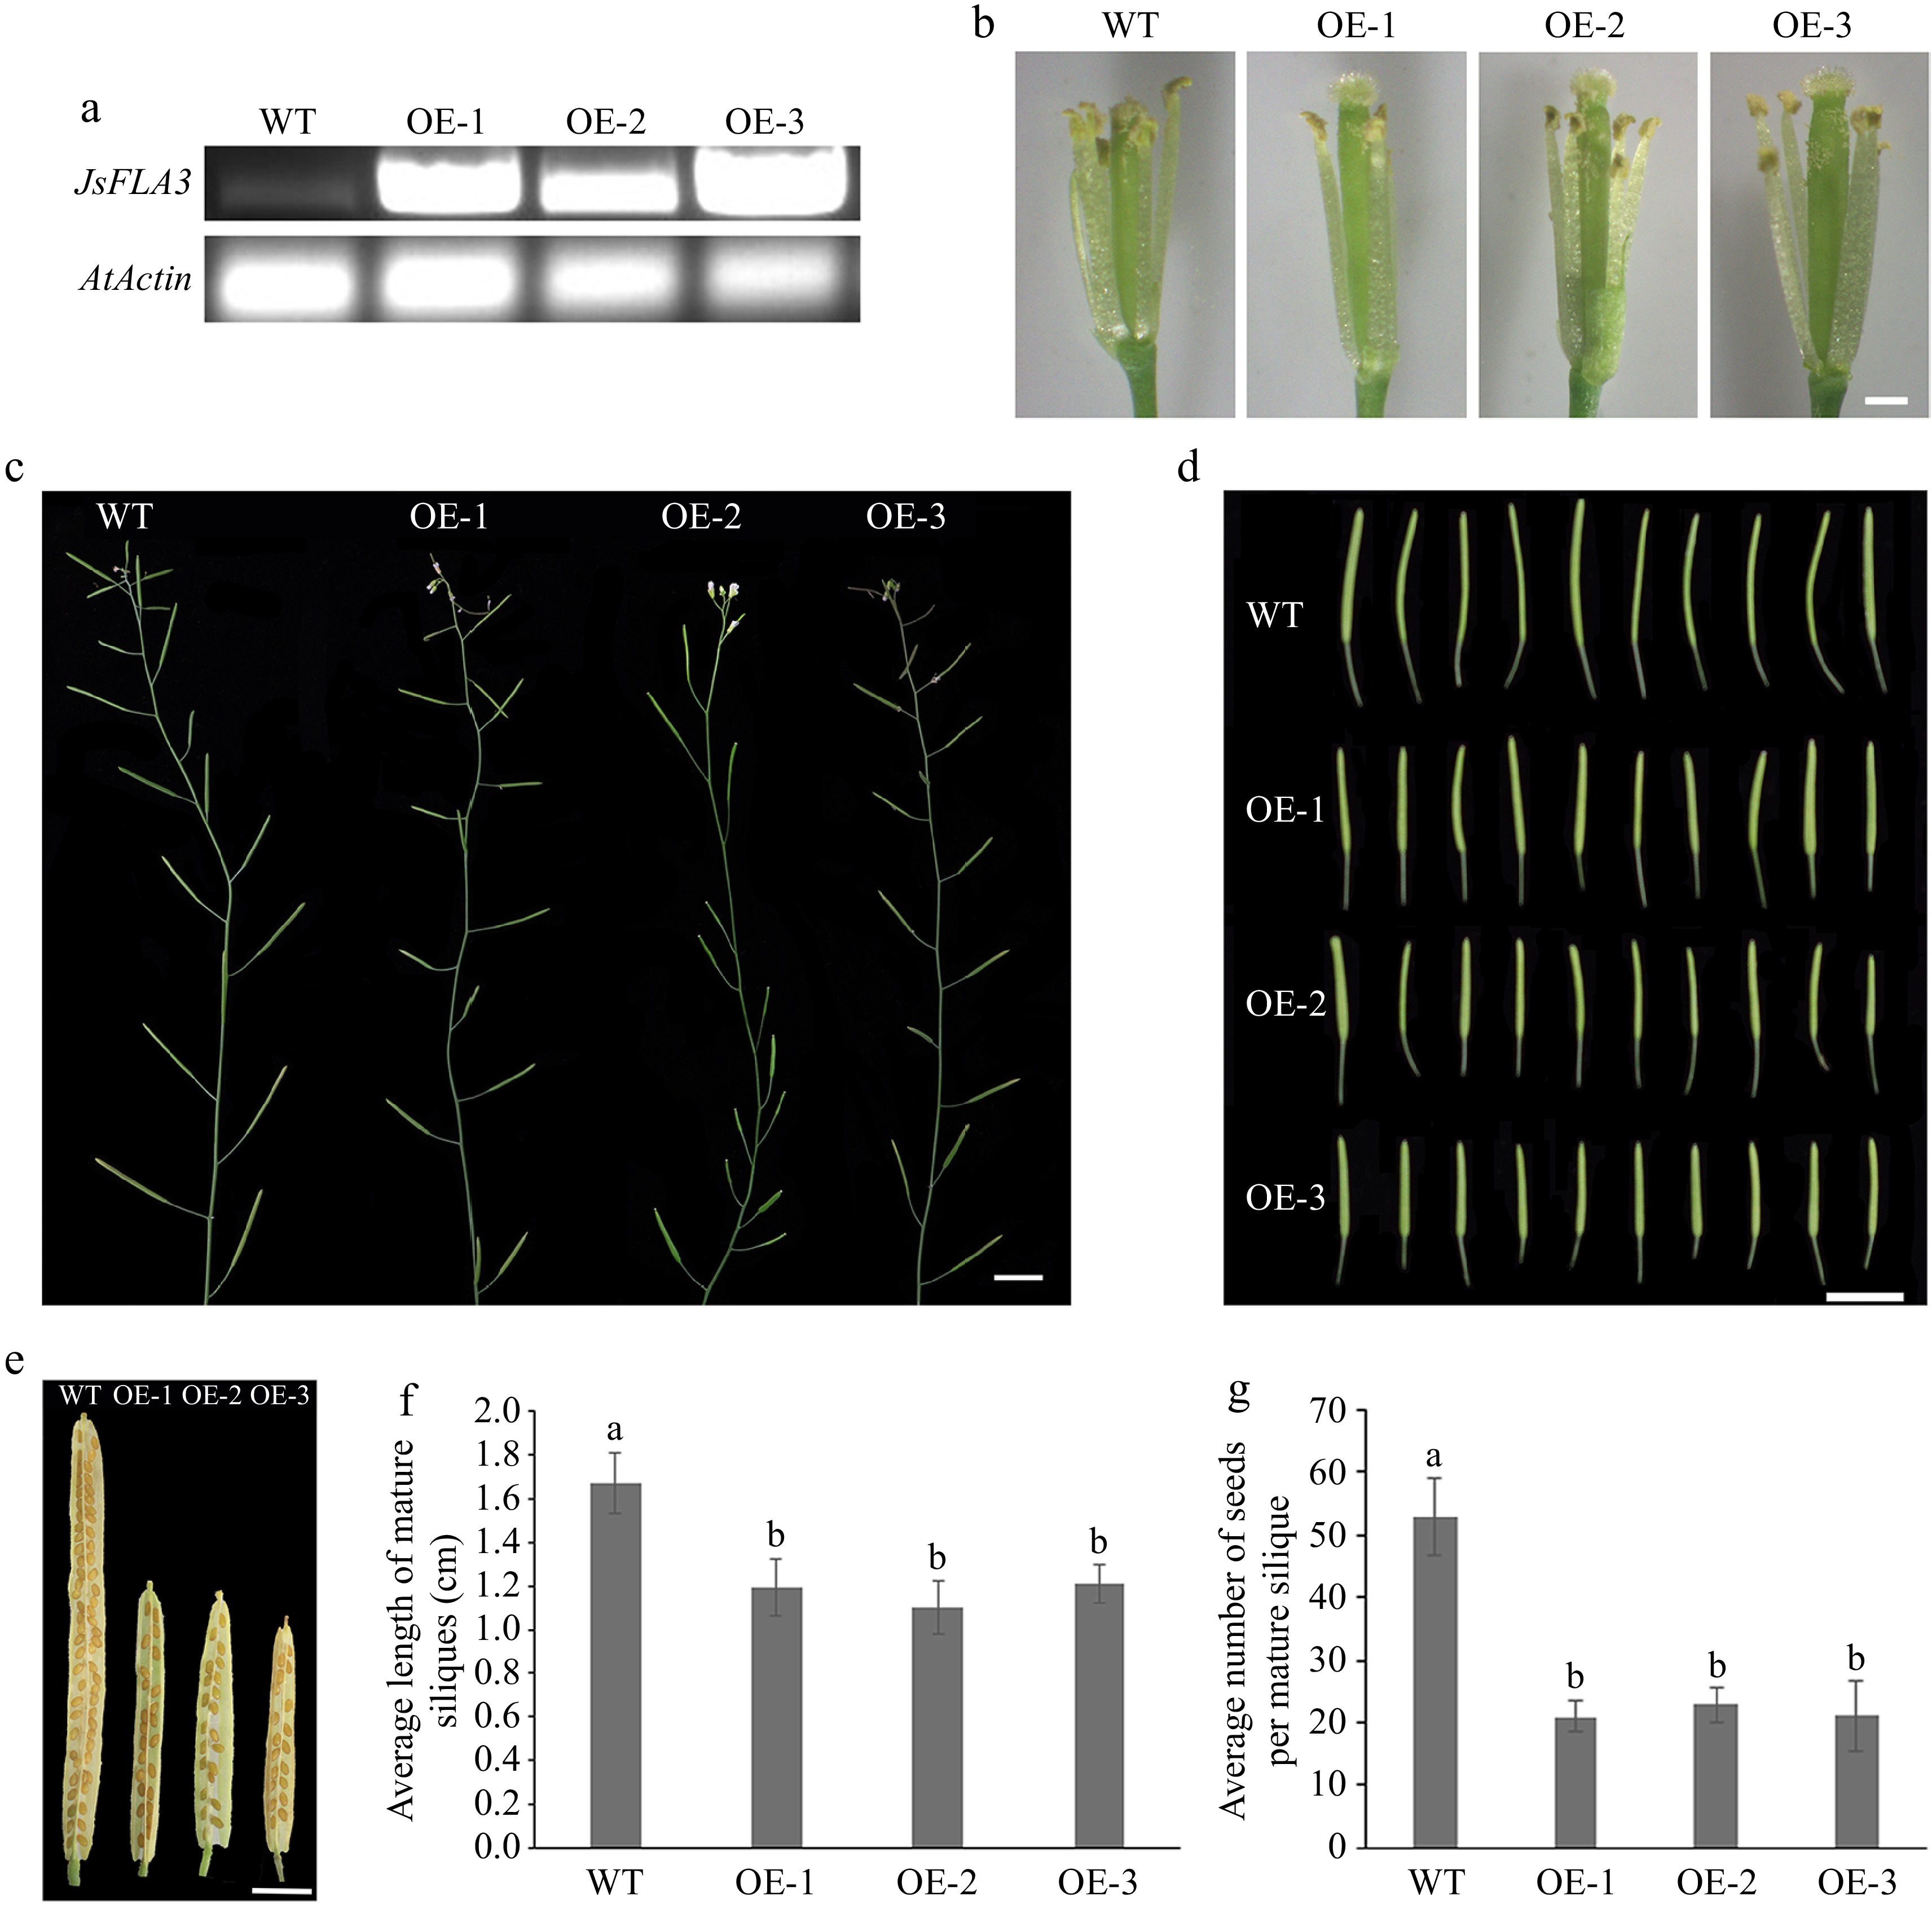
Figure 3.
Fertility analysis of ectopic expression of JsFLA3 in A. thaliana. (a) RT-PCR identification of the transgenic lines OE-1, 2, 3. (b) The appearance of stamen filament of WT and OE florets at anthesis stage. Bar: 0.5 mm. (c) The silique development of WT and OE plants. Bar: 1 cm. (d) The phenotype of the fifth silique. Bar: 1 cm. (e) The siliques of WT and OE plants. Bar: 1 mm. (f) Mature siliques length in WT and OE plants. Columns headed by a different letter indicate significantly different mature siliques length (p < 0.05). (g) Seed numbers per silique in WT and OE plants. Values are shown as mean ± SE (n = 30). Columns headed by a different letter indicate significantly different seed numbers per silique (p < 0.05). WT, wild-type A. thaliana; OE, overexpression transgenic A. thaliana.
-
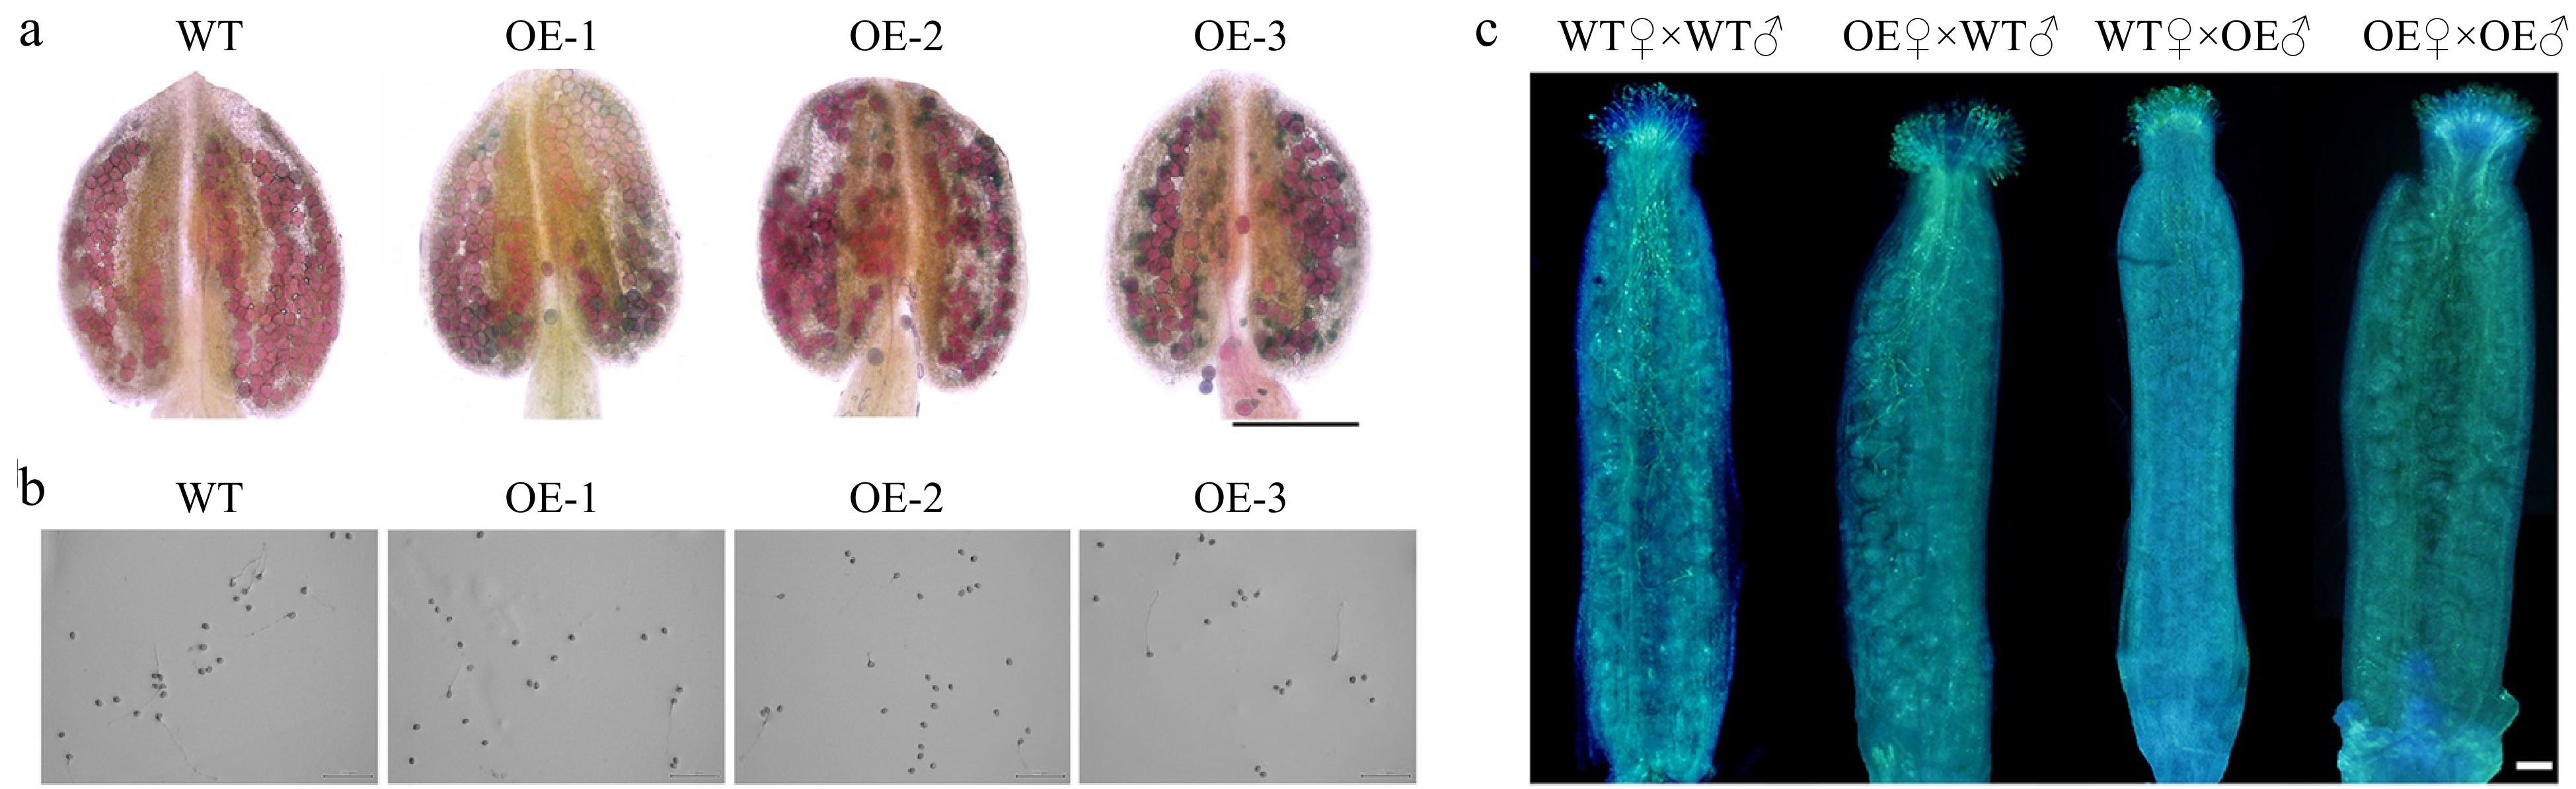
Figure 4.
Analysis of mature pollen in wild-type (WT) and overexpression (OE) transgenic A. thaliana. (a) Alexander staining of pollen grains in WT and OE plants. Bar: 200 μm. (b) In vitro germination of WT and OE pollen grains for 4 h. Bar: 200 μm. (c) Reciprocal crosses between WT and OE plants of A. thaliana, showing the pollen tube growth at 4 h after pollination. WT♀ × WT♂, WT plants were used as both the female receptors and male donors; OE♀ × WT♂, OE and WT plants were used as the female receptors and male donors, respectively; WT♀ × OE♂, WT and OE plants were used as the female receptors and male donors, respectively; OE♀ × OE♂, OE plants were used as both the female receptors and male donors. Bar: 100 μm.
-
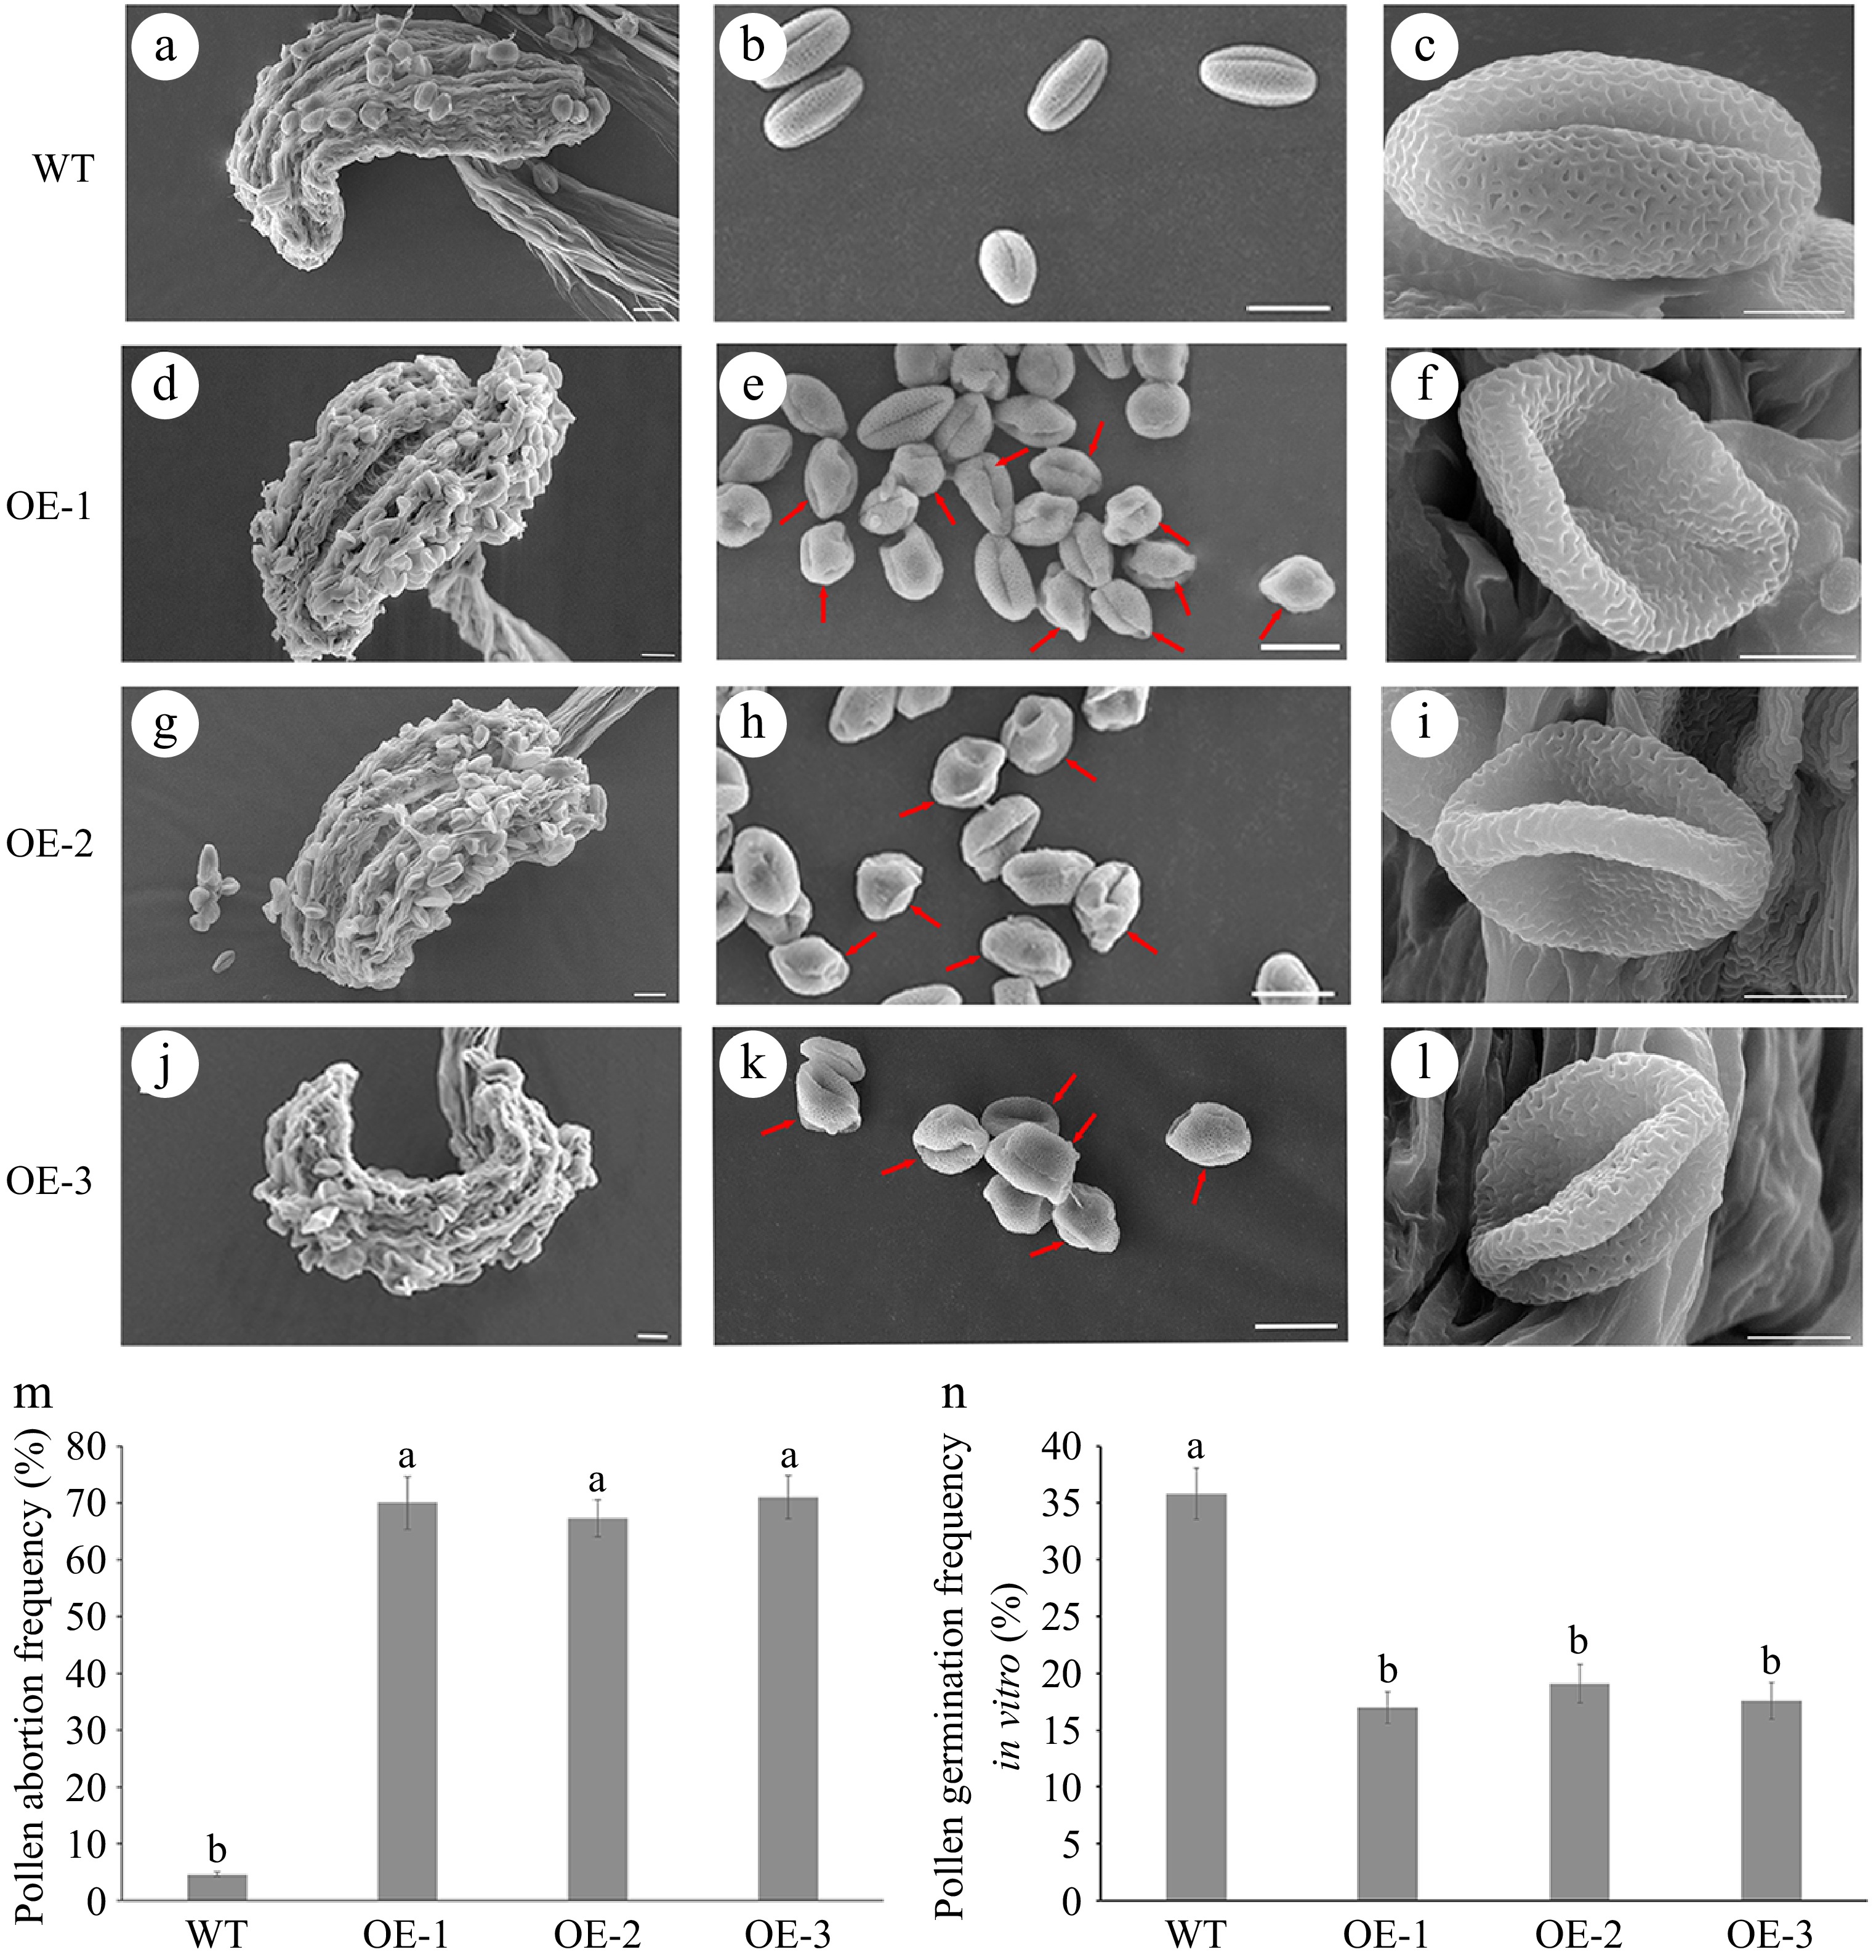
Figure 5.
Observation under scanning electron microscope (SEM) of mature pollen in wild-type (WT) and overexpressed JsFLA3 (OE) A. thaliana. (a), (d), (g), (j) SEM of anthers from WT and OE plants. Bar: 20 μm. (b), (e), (h), (k) SEM of mature pollen in WT and OE plants. Bar: 20 μm. (c), (f), (i), (l) Magnified pictures of b, e, h, k. Bar: 5 μm. (m) The frequency of pollen abortion in WT and OE plants. Columns headed by a different letter indicate significantly different pollen abortion frequency (p < 0.05). (n) The frequency of pollen germination of WT and OE plants in vitro. Values are shown as mean ± SE (n = 1,000). Columns headed by a different letter indicate significantly different pollen germination frequency (p < 0.05).
-
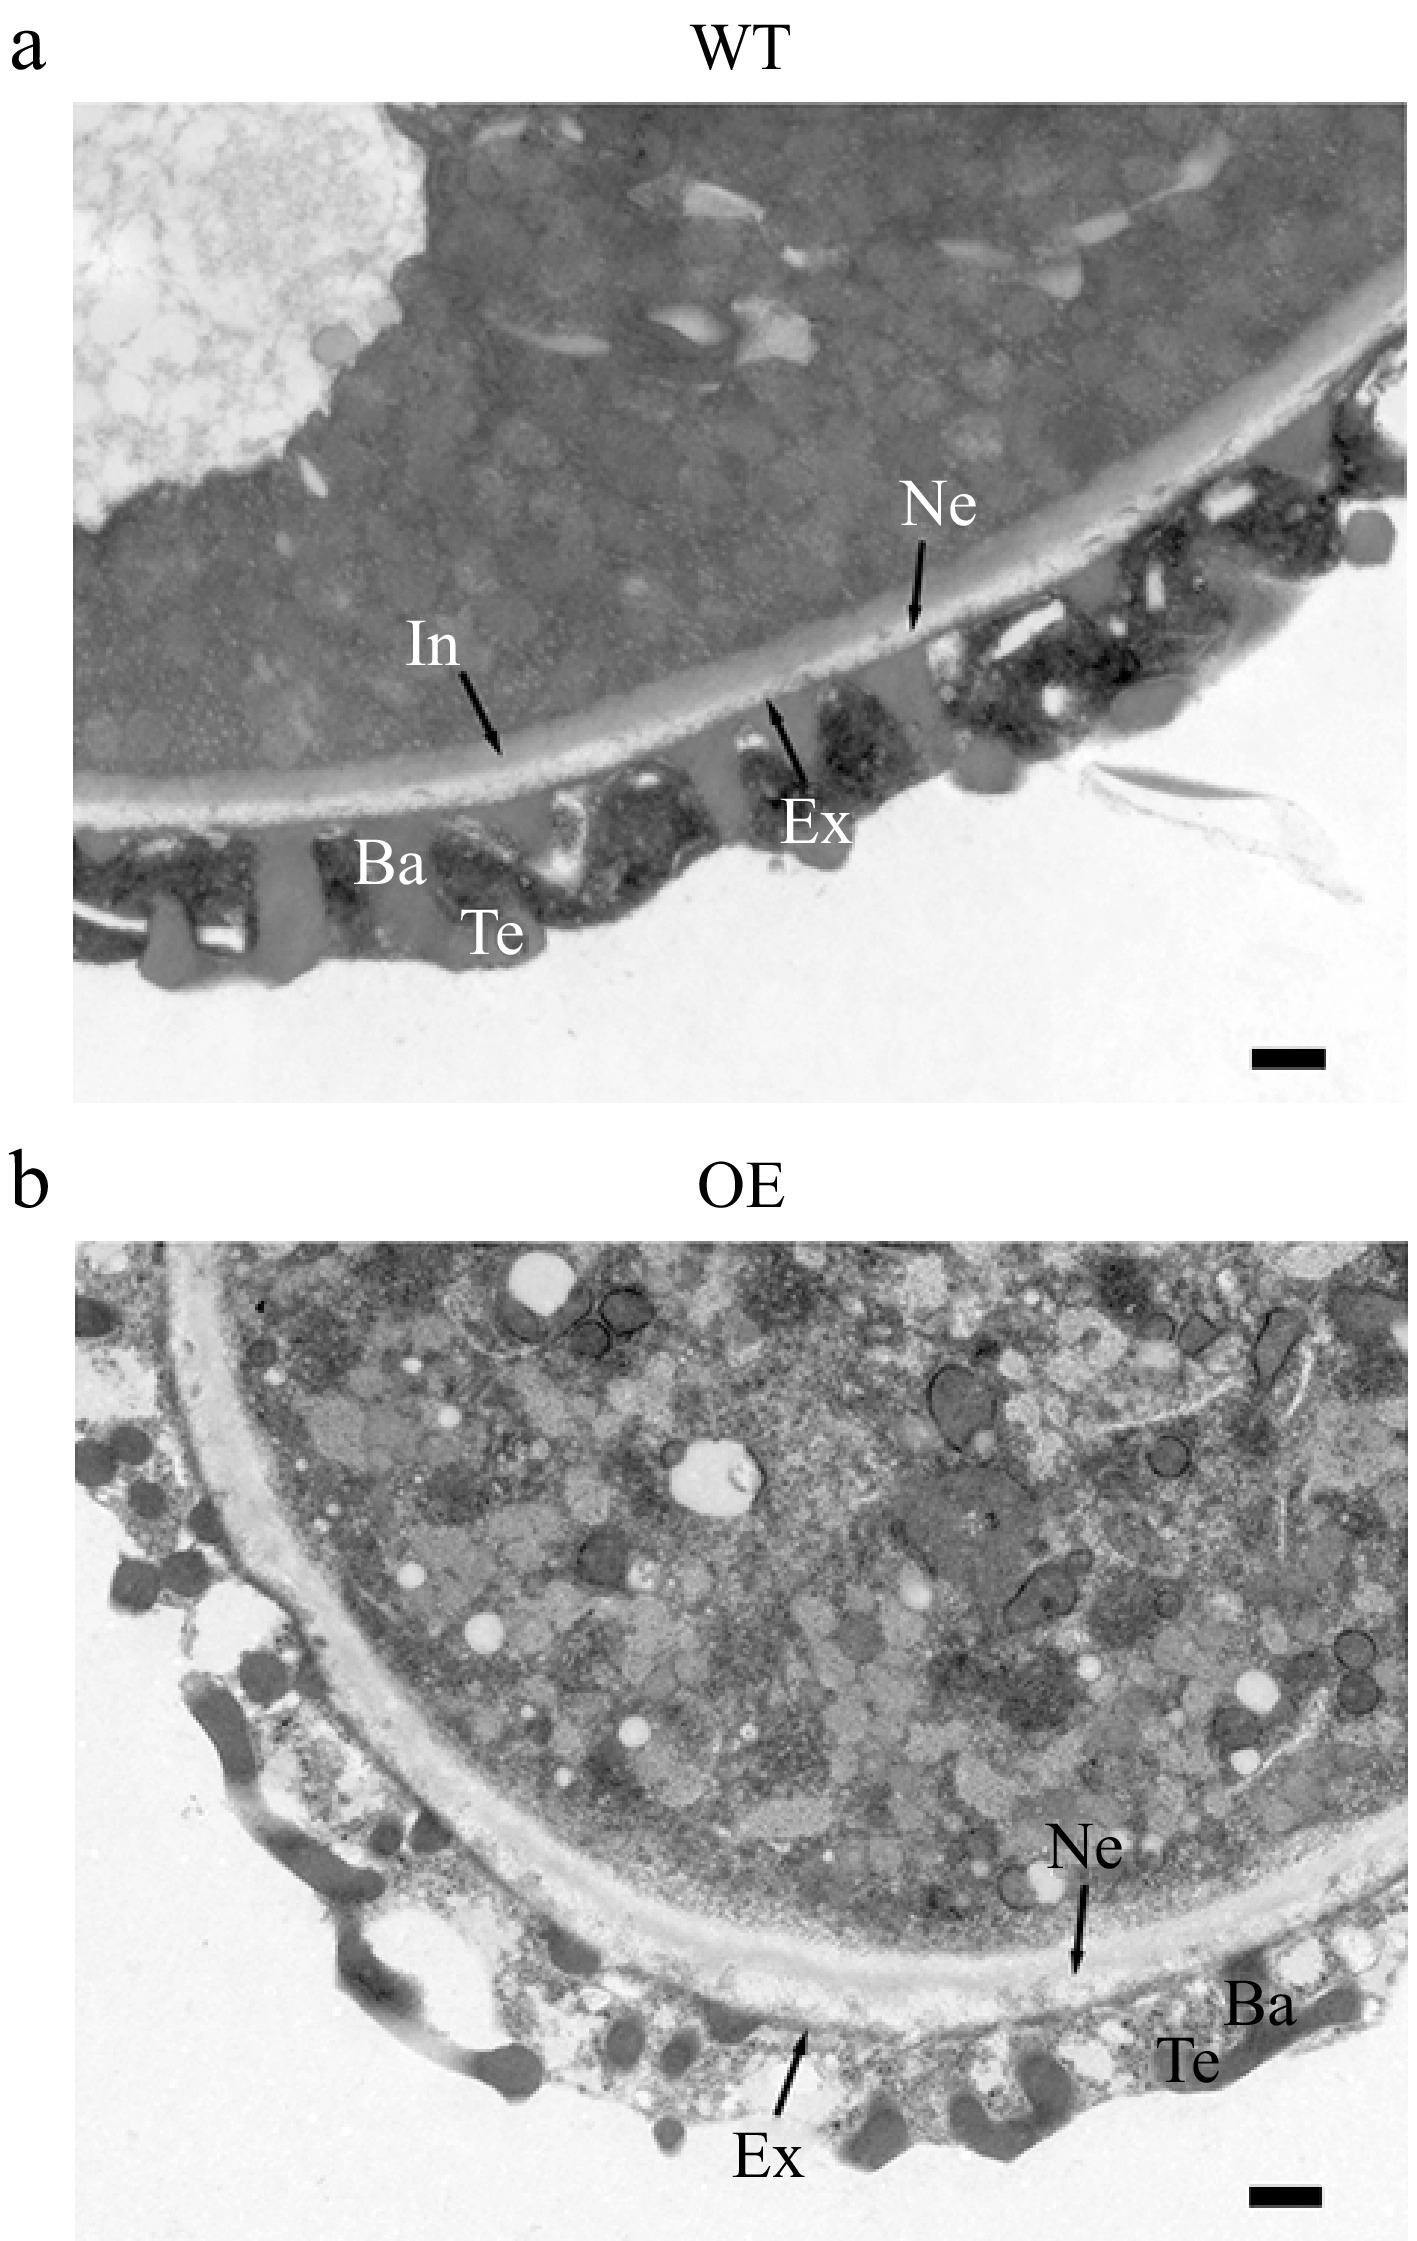
Figure 6.
Observation under transmission electron microscope of mature pollen cell wall of wild-type (WT) and overexpressed JsFLA3 (OE) A. thaliana. (a) WT. (b) OE. Ba, baculum; Ex, exine; Ne, nexine; Te, tectum; In, intine. Bar: 500 nm.
-
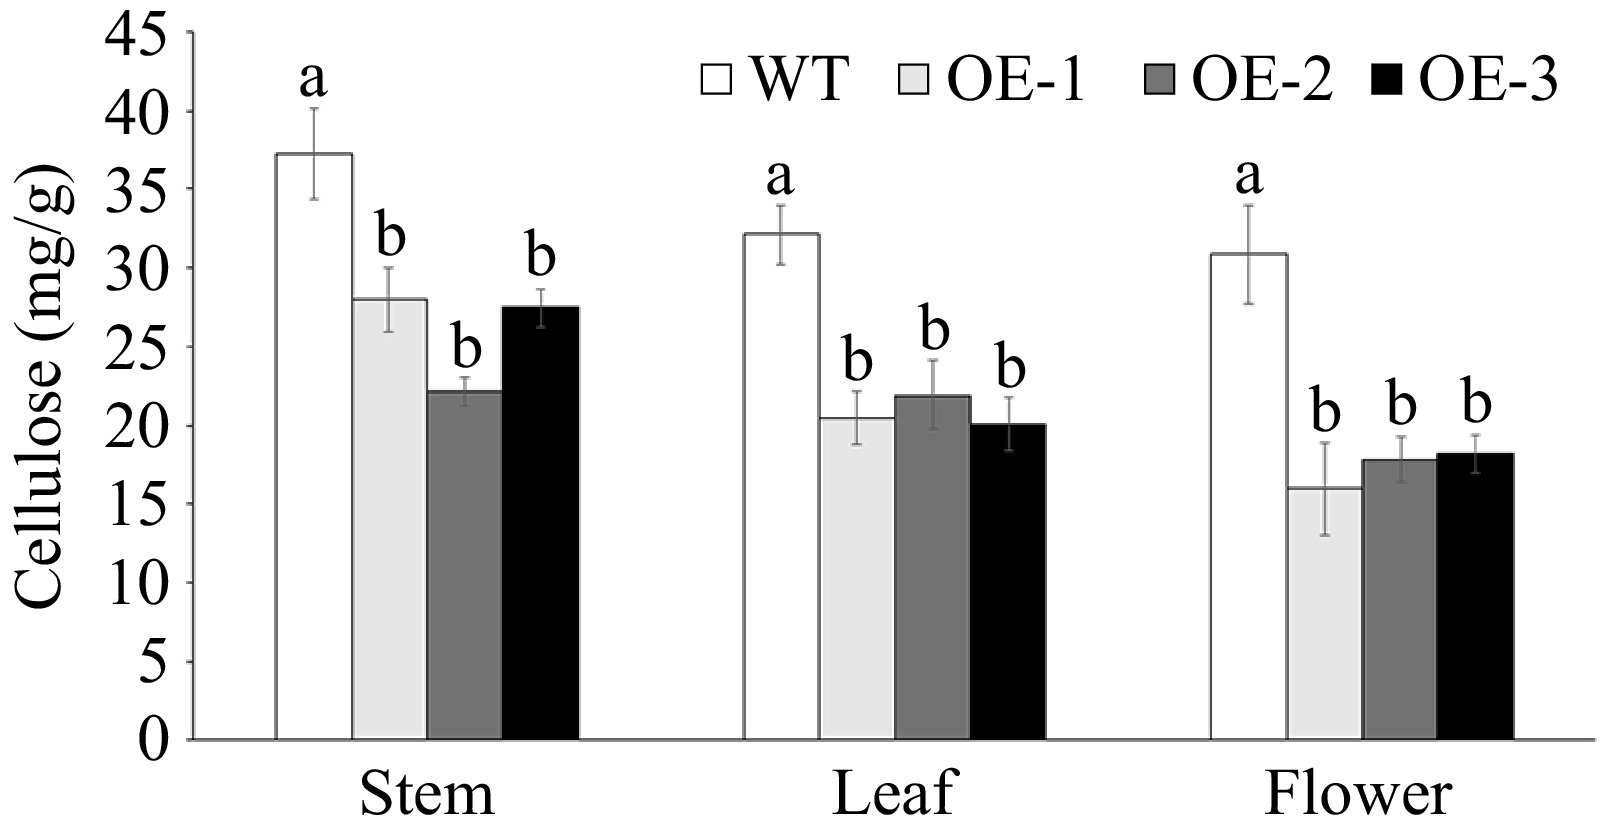
Figure 7.
Cellulose content assay in various tissues of wild-type (WT) and overexpressed JsFLA3 (OE) A. thaliana. Values are shown as mean ± SE (n = 4). Columns headed by a different letter indicate significantly different cellulose content (p < 0.05).
-
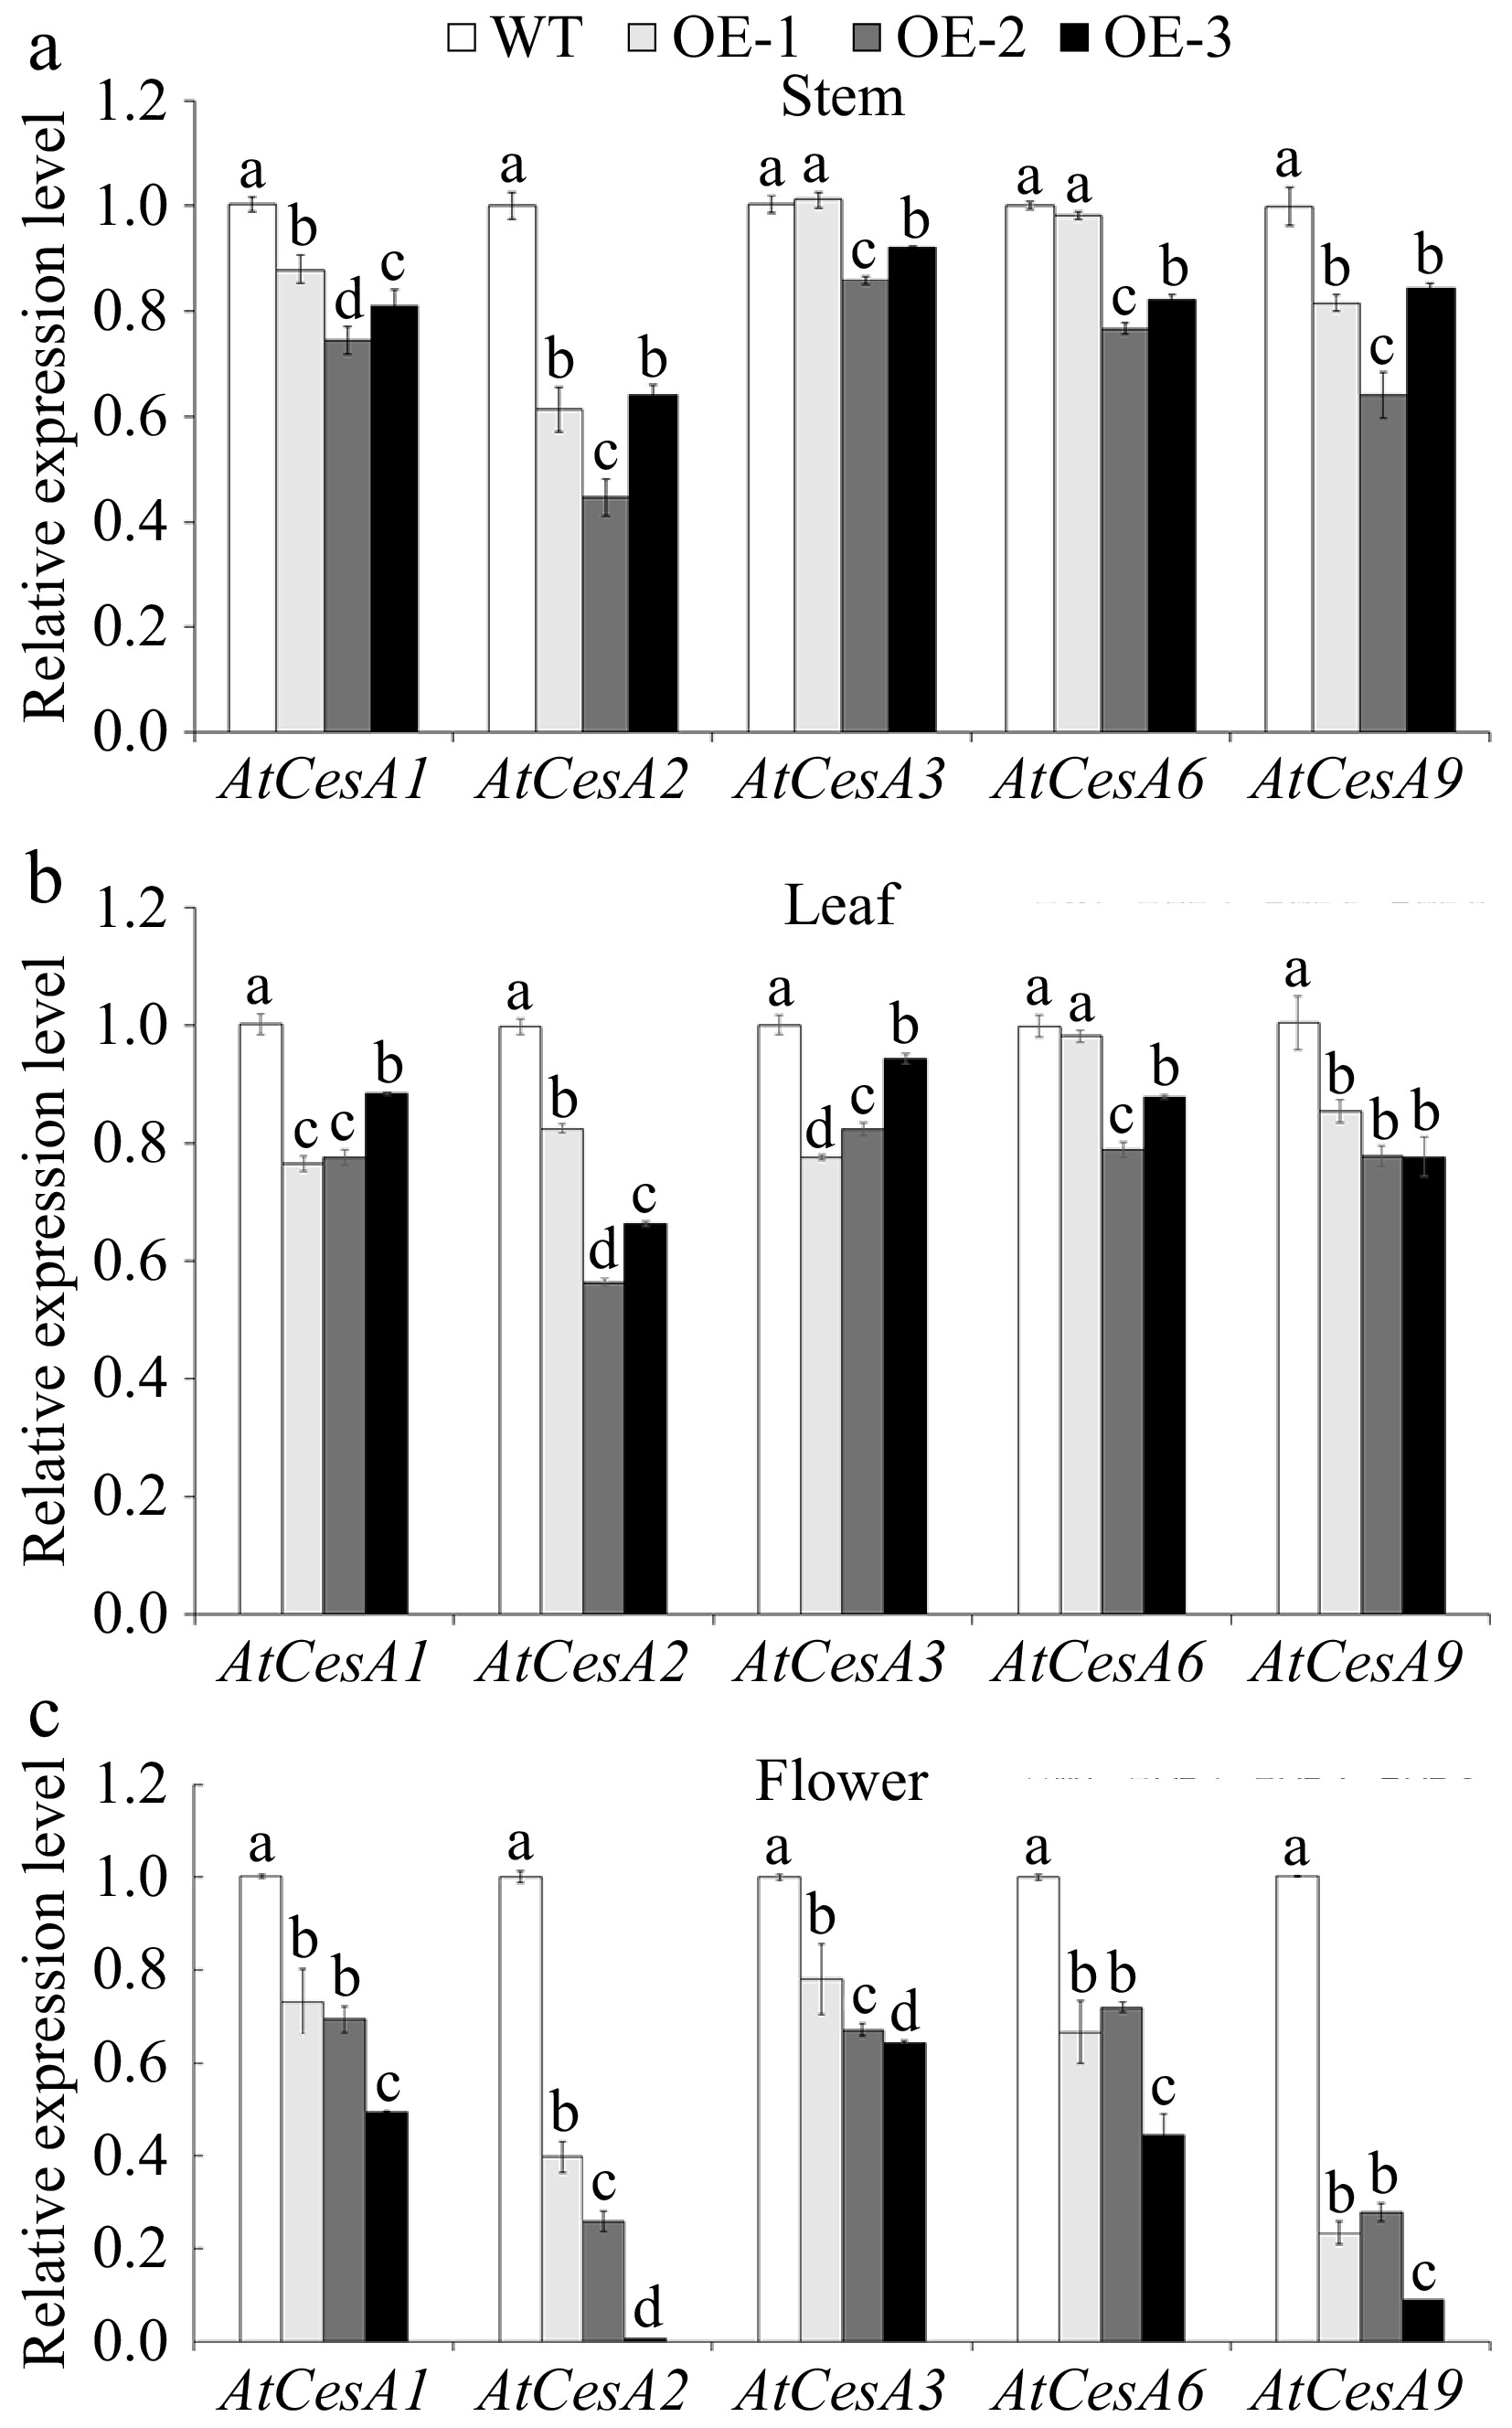
Figure 8.
The relative expression level of AtCesAs in various tissues of wild-type (WT) and overexpressed JsFLA3 (OE) Arabidopsis. (a) Stem. (b) Leaf. (c) Flower. Values are shown as mean ± SE (n =3). Columns headed by a different letter indicate significantly different AtCesAs transcript abundances (p < 0.05).
Figures
(8)
Tables
(0)