-
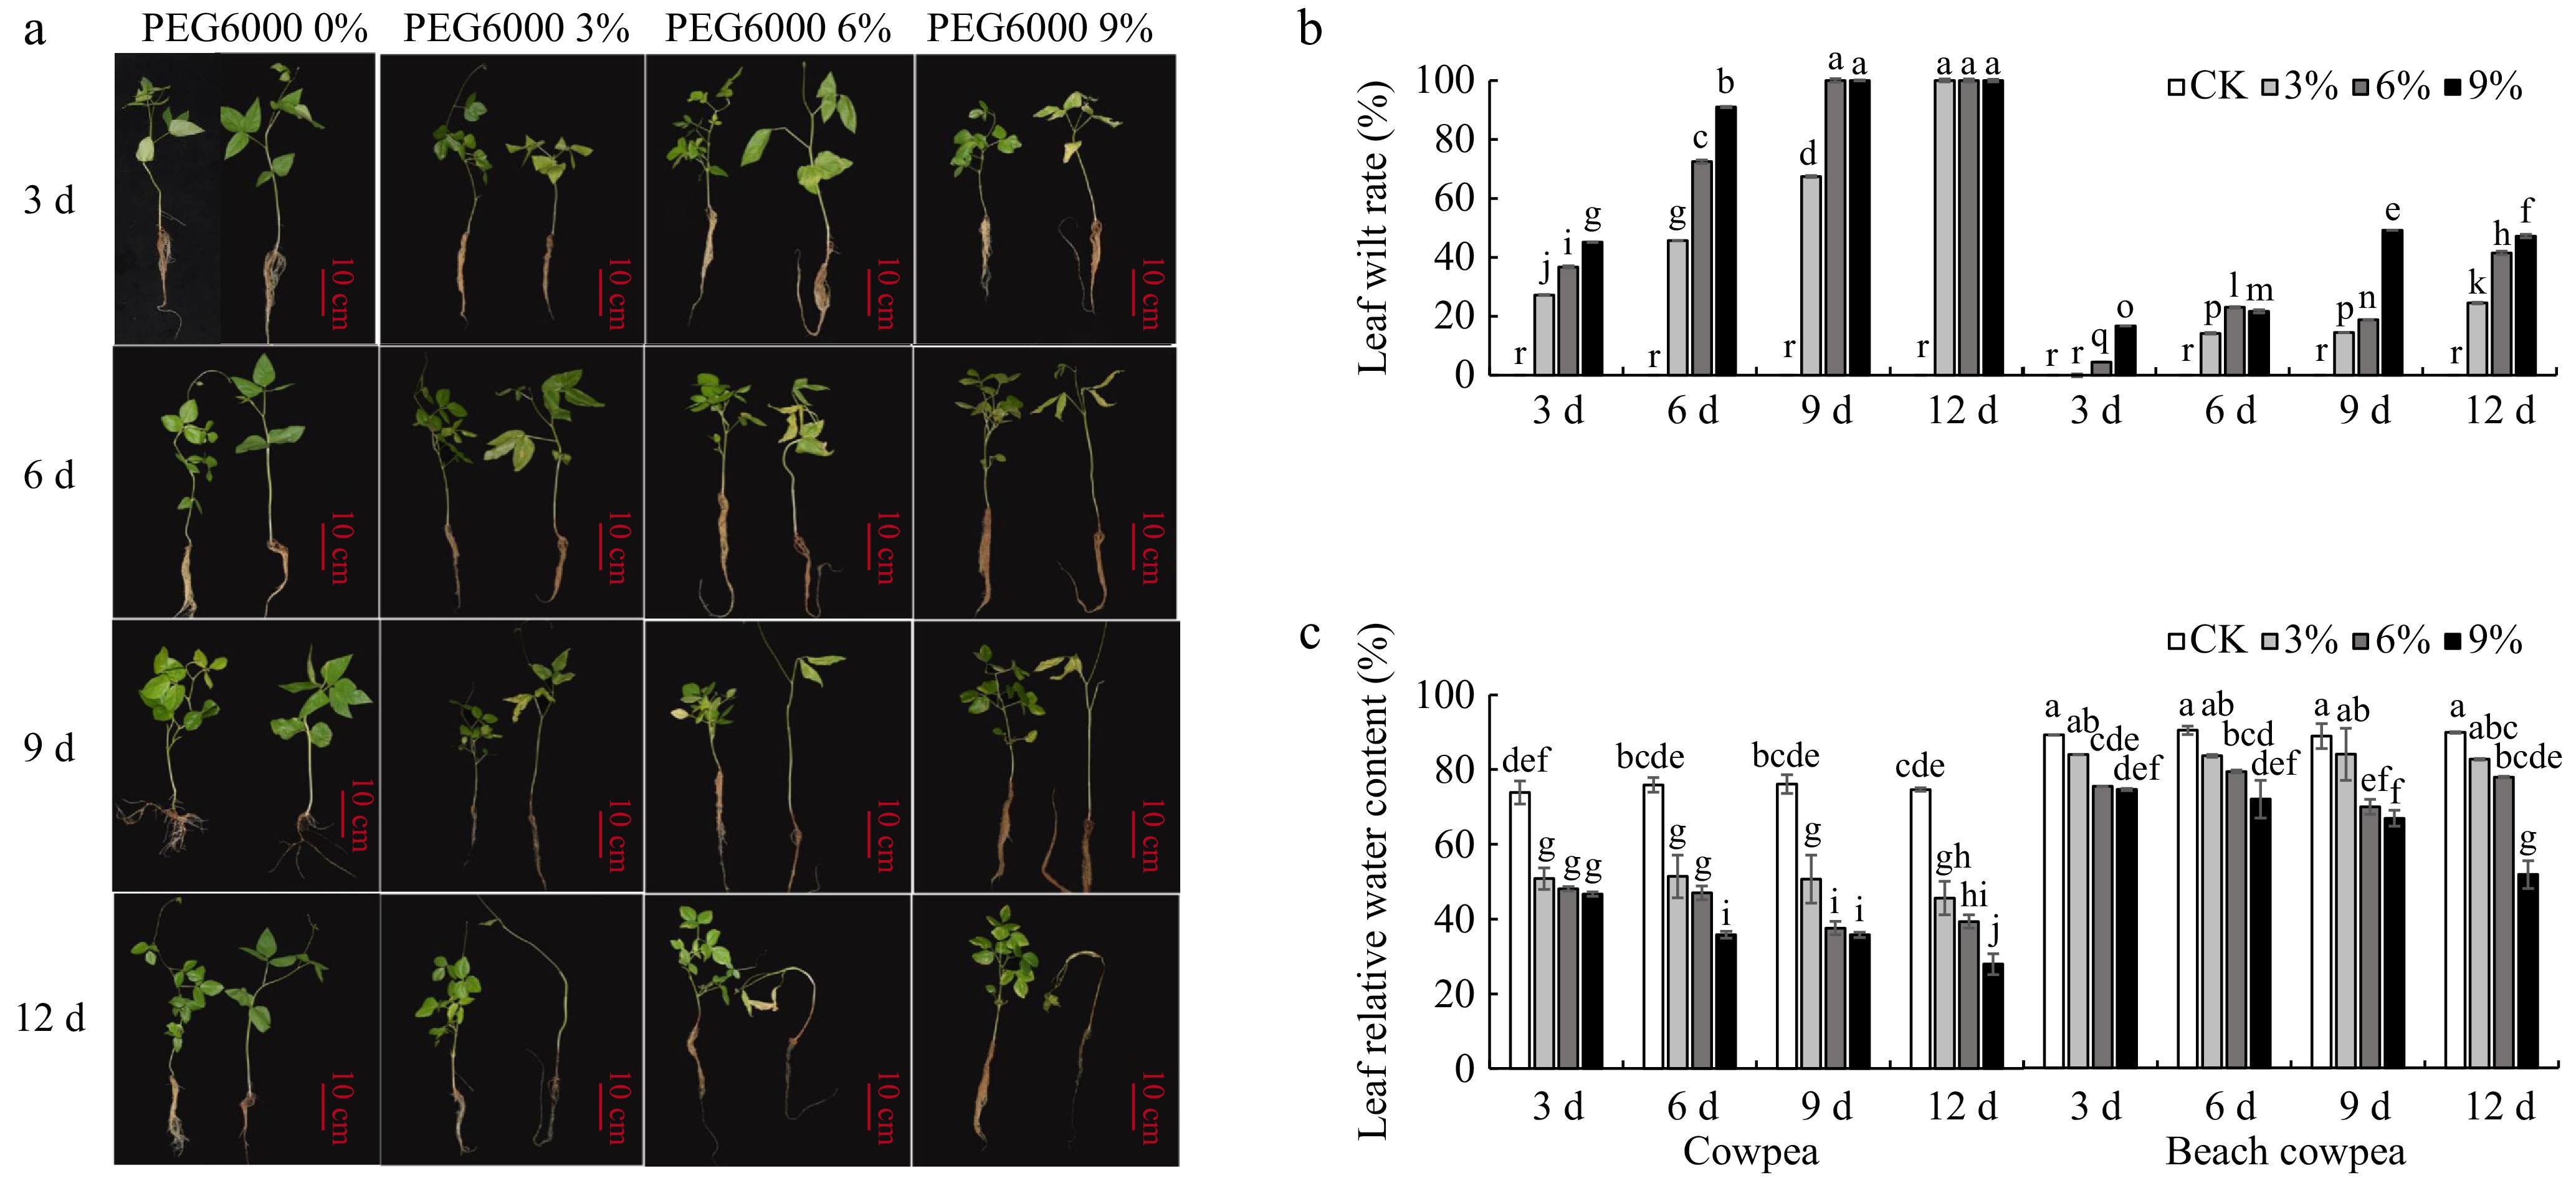
Figure 1.
(a) Effects of PEG6000-simulated drought stress on phenotypic morphology, (b) leaf relative water content, and (c) foliage senescence rate in cowpea and beach cowpea plants. Different concentrations of PEG6000 (0%, 3%, 6%, 9%) were applied for 3, 6, 9, and 12 d to assess the drought adaptation abilities of the two Vigna species. Each experiment included three biological replicates. Different letters indicate statistically significant differences (p ≤ 0.05).
-

Figure 2.
The enhanced drought tolerance observed in beach cowpea is associated with root activity rather than other root morphological disparities. Varying concentrations of PEG6000 (0%, 3%, 6%, 9%) were applied for 3, 6, 9, and 12 d to beach cowpea and cowpea plants to assess the effects of drought stress on their (a) root length, (b) root surface area, (c) root volume, and (d) root activities. Each experiment included three biological replicates. Different letters indicate statistically significant differences (p ≤ 0.05).
-
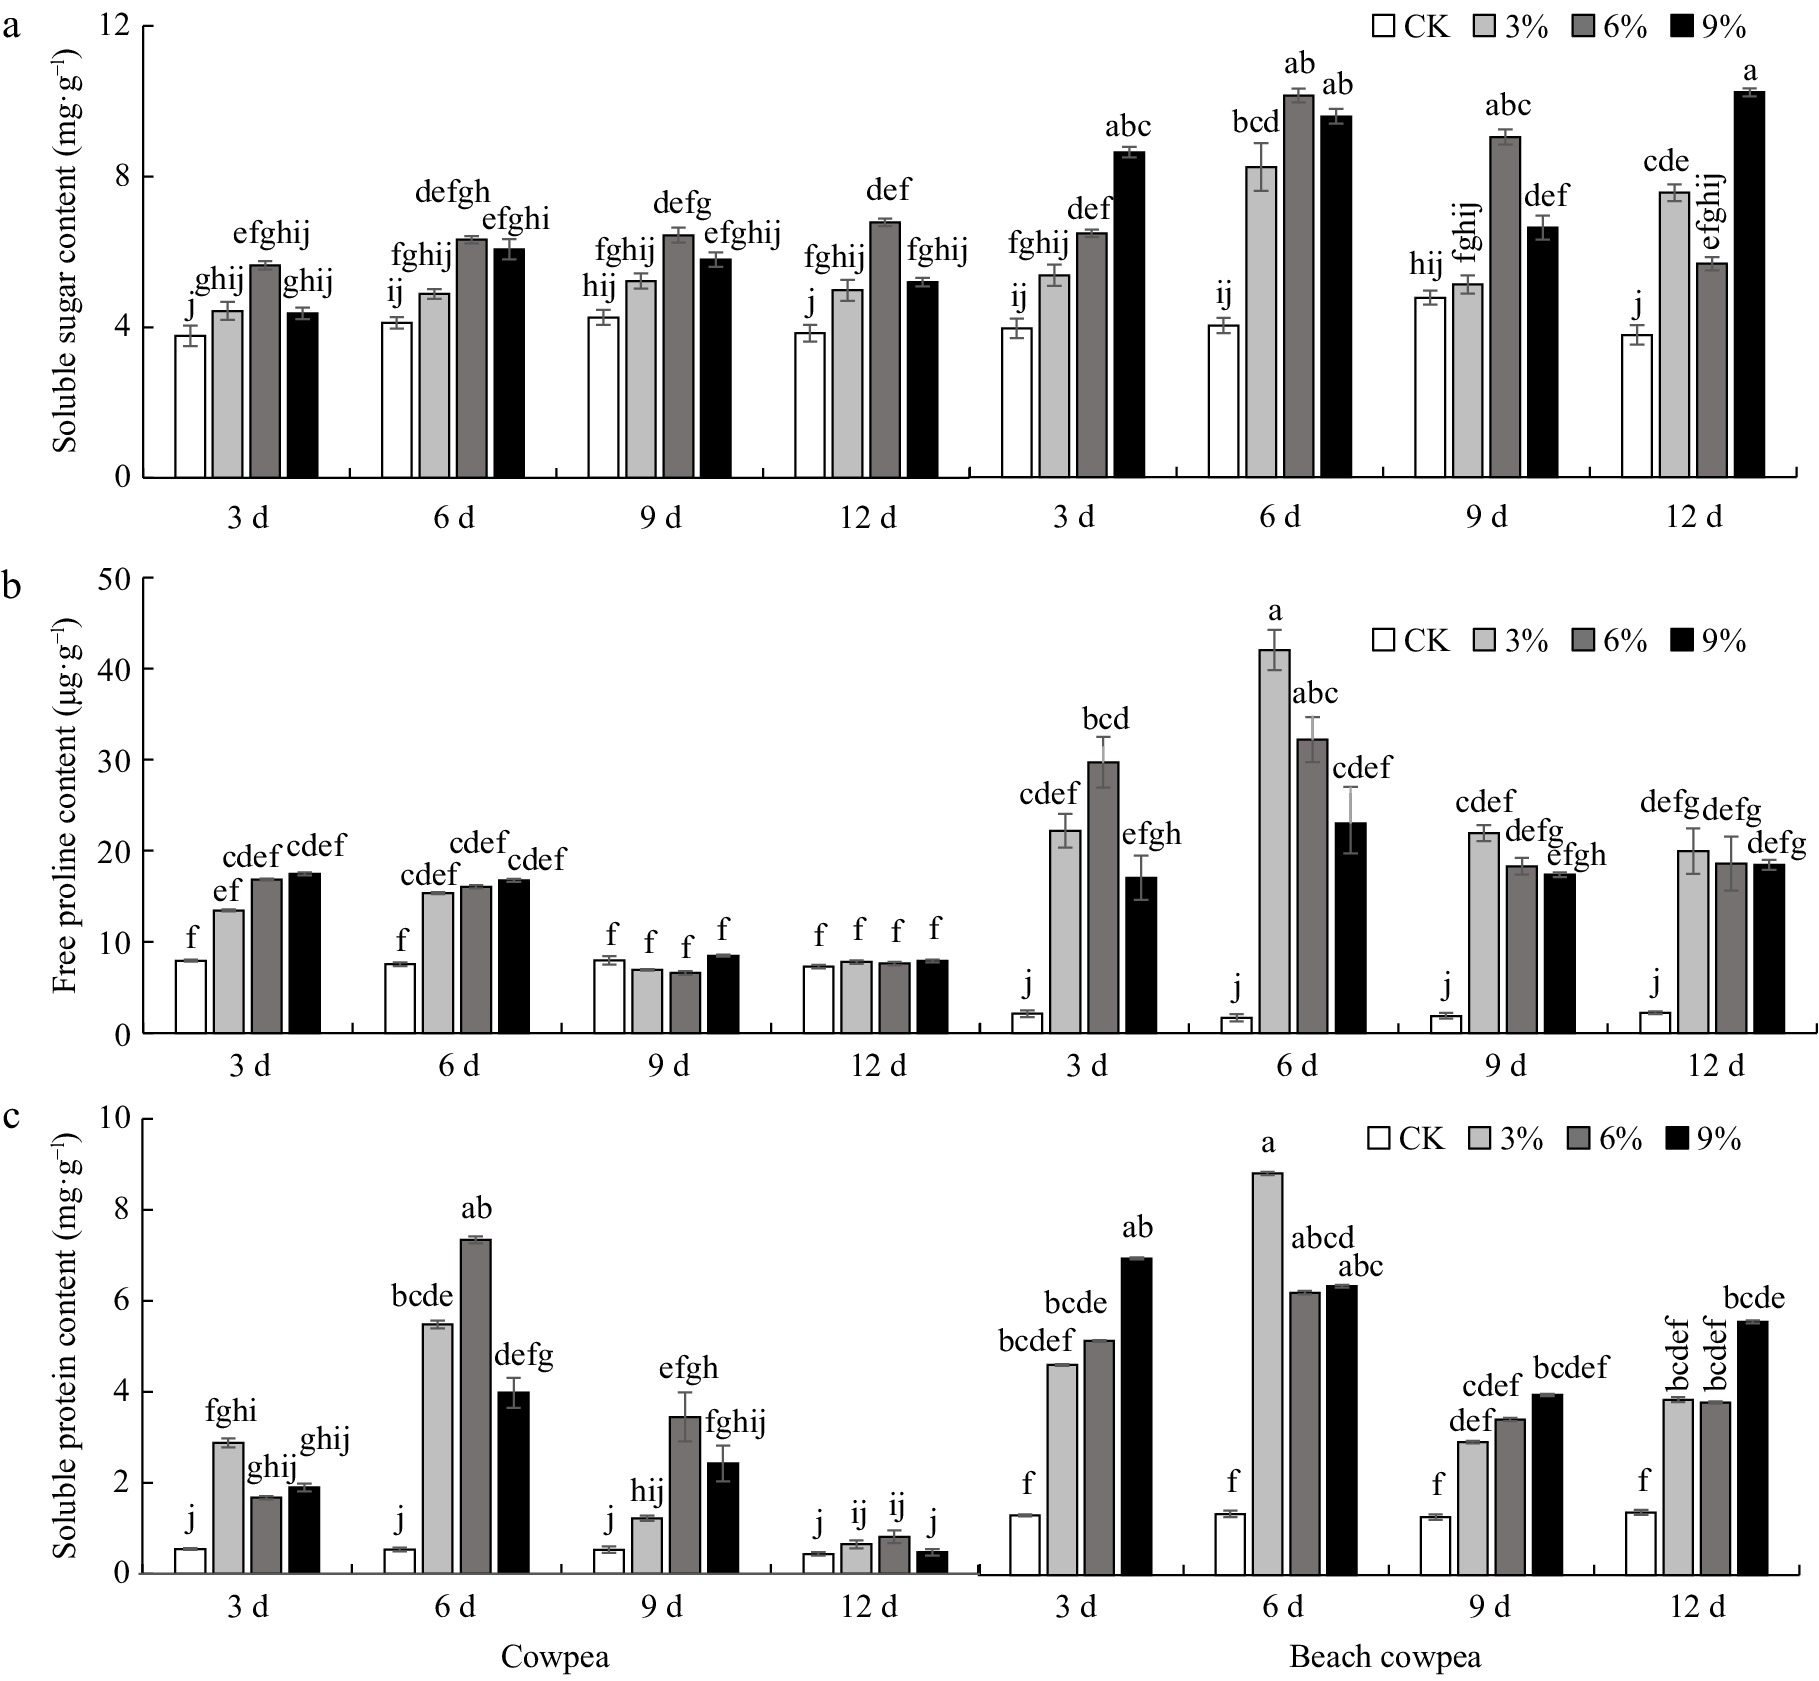
Figure 3.
Beach cowpea roots contain higher concentrations of osmolytes than cowpea roots under PEG6000-simulated drought stress. The concentrations of osmolytes, including (a) soluble sugars, (b) soluble proteins, and (c) proline, were evaluated in the roots of the two Vigna plants treated with 0%, 3%, 6%, and 9% PEG6000 for 3, 6, 9, and 12 d. Each experiment included three biological replicates. Different letters indicate statistically significant differences (p ≤ 0.05).
-
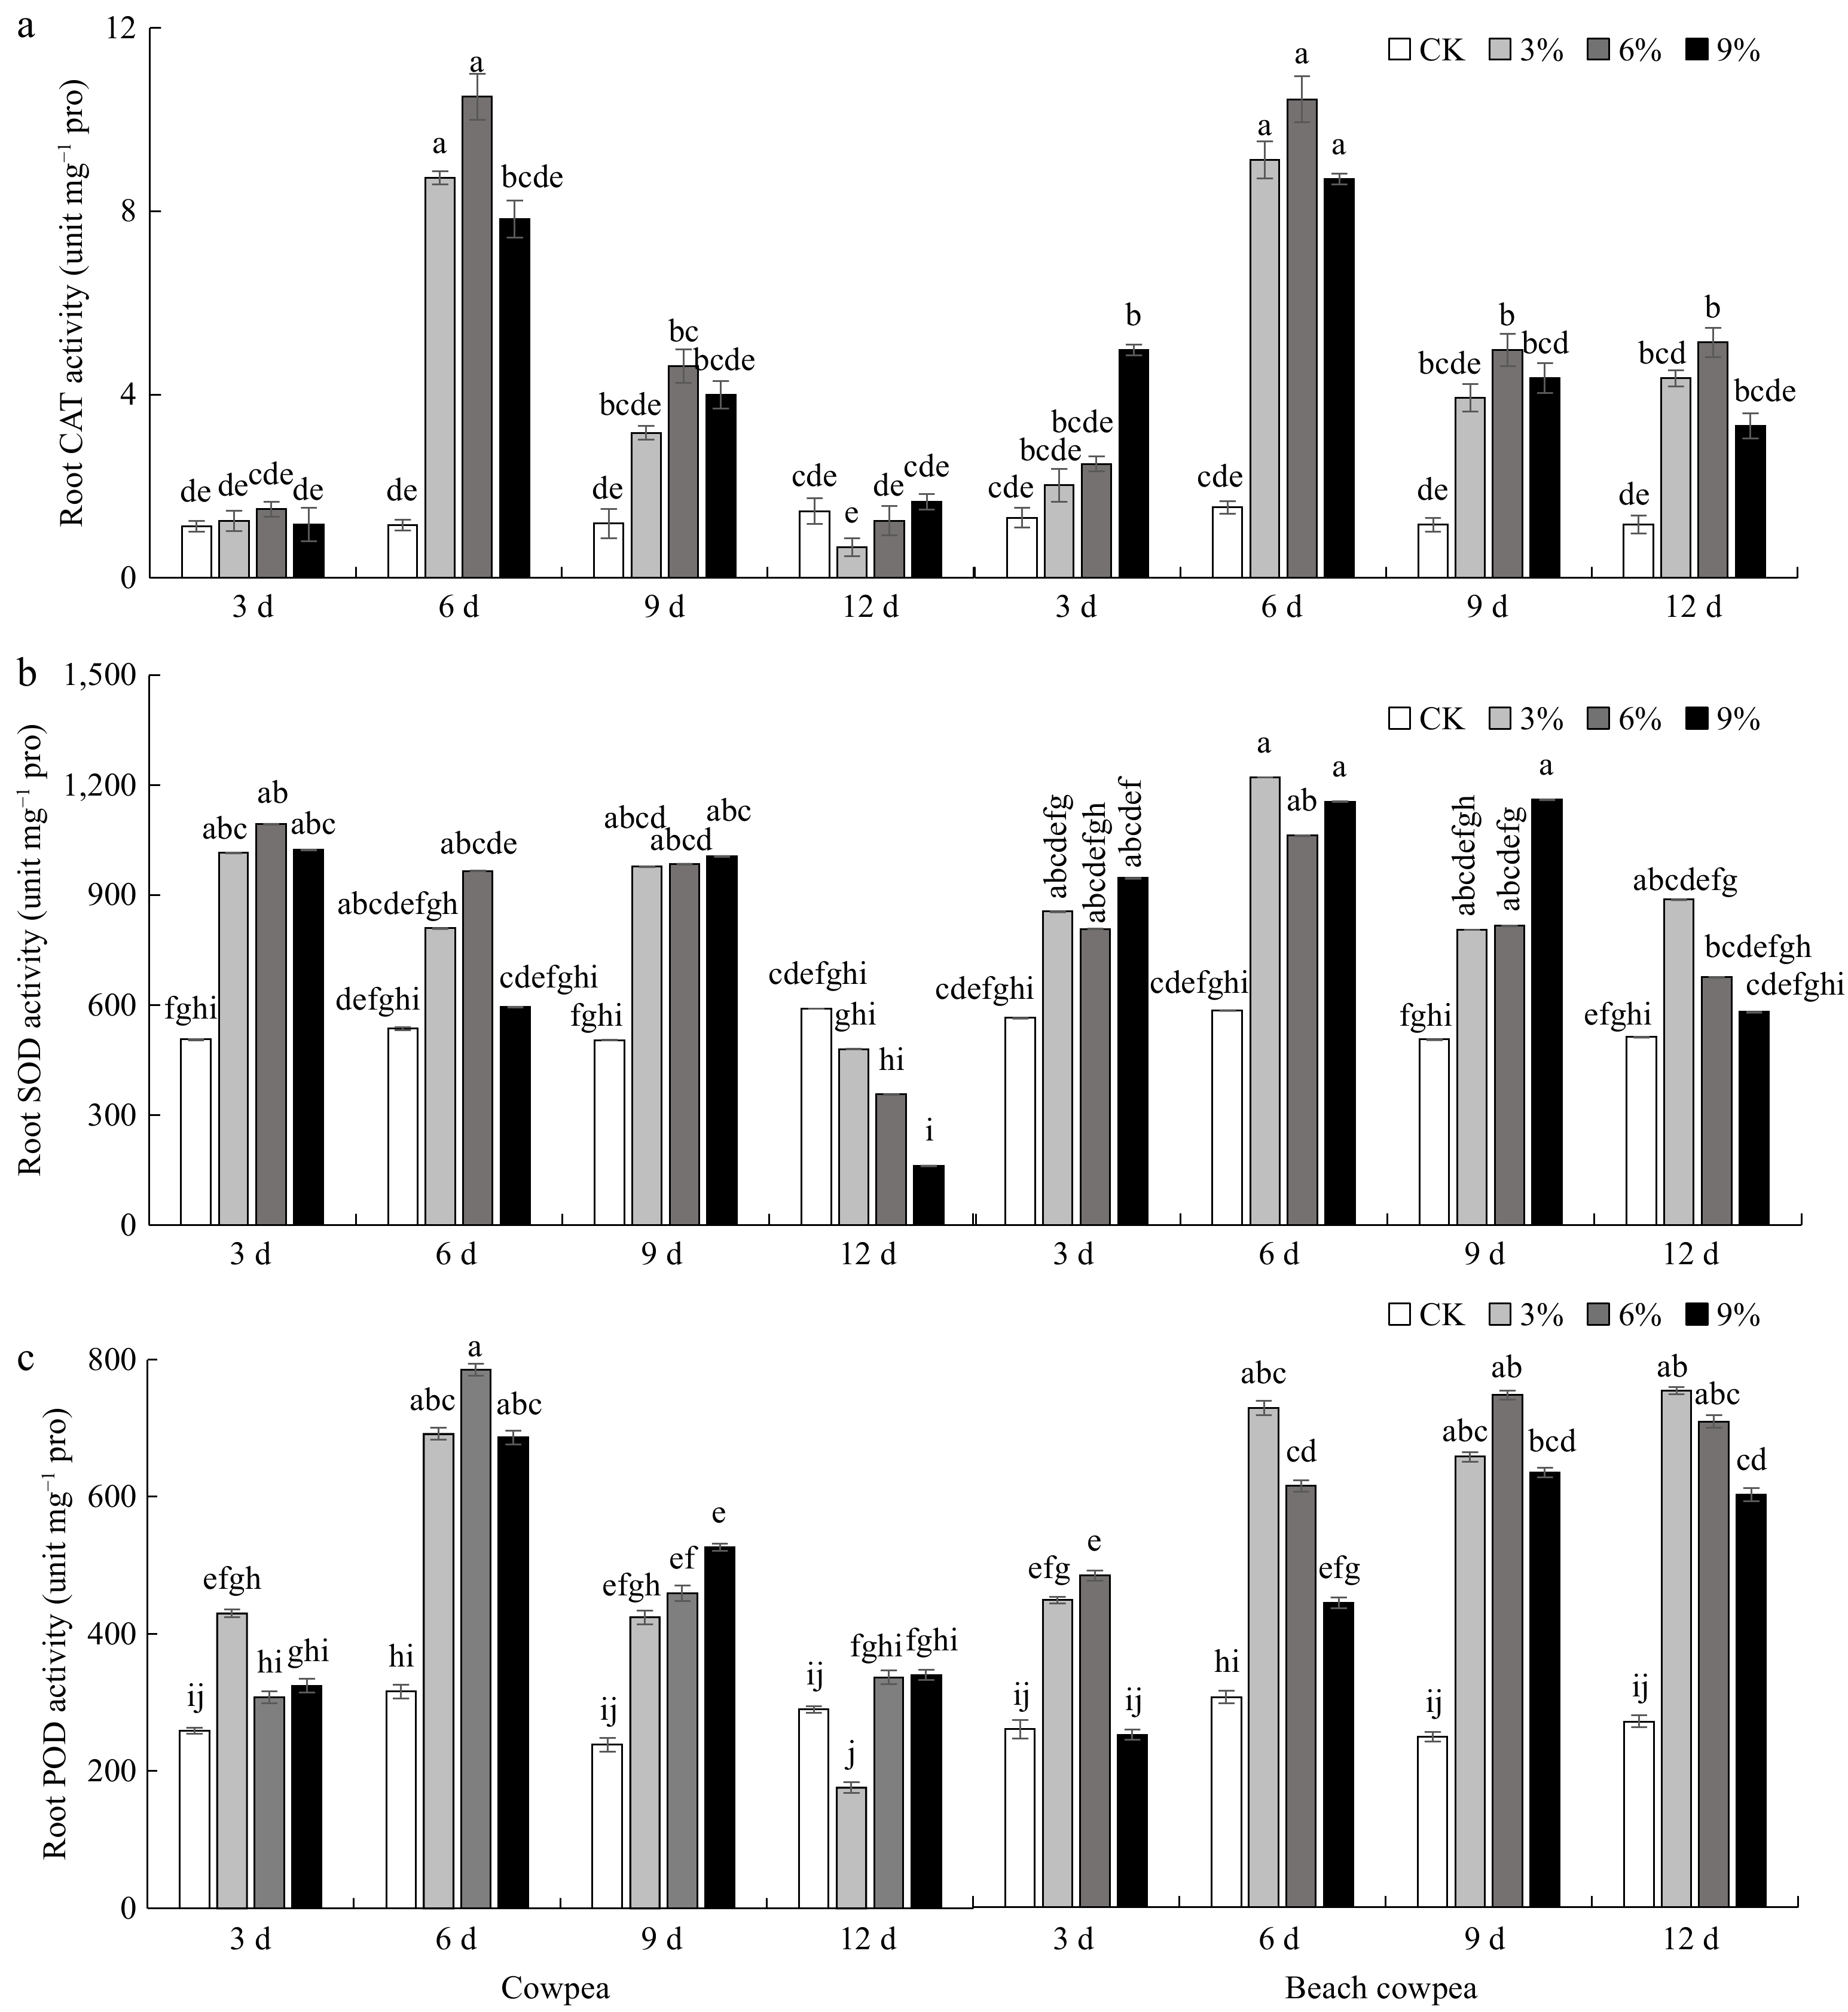
Figure 4.
Beach cowpea roots contain higher activities of antioxidant enzymes than cowpea roots under PEG6000-simulated drought stress. The activities of (a) catalase (CAT), (b) superoxide dismutase (SOD), and (c) peroxidase (POD), were determined in the roots of the two Vigna plants treated with 0%, 3%, 6%, and 9% PEG6000 for 3, 6, 9, and 12 d. Each experiment included three biological replicates. Different letters indicate statistically significant differences (p ≤ 0.05).
-
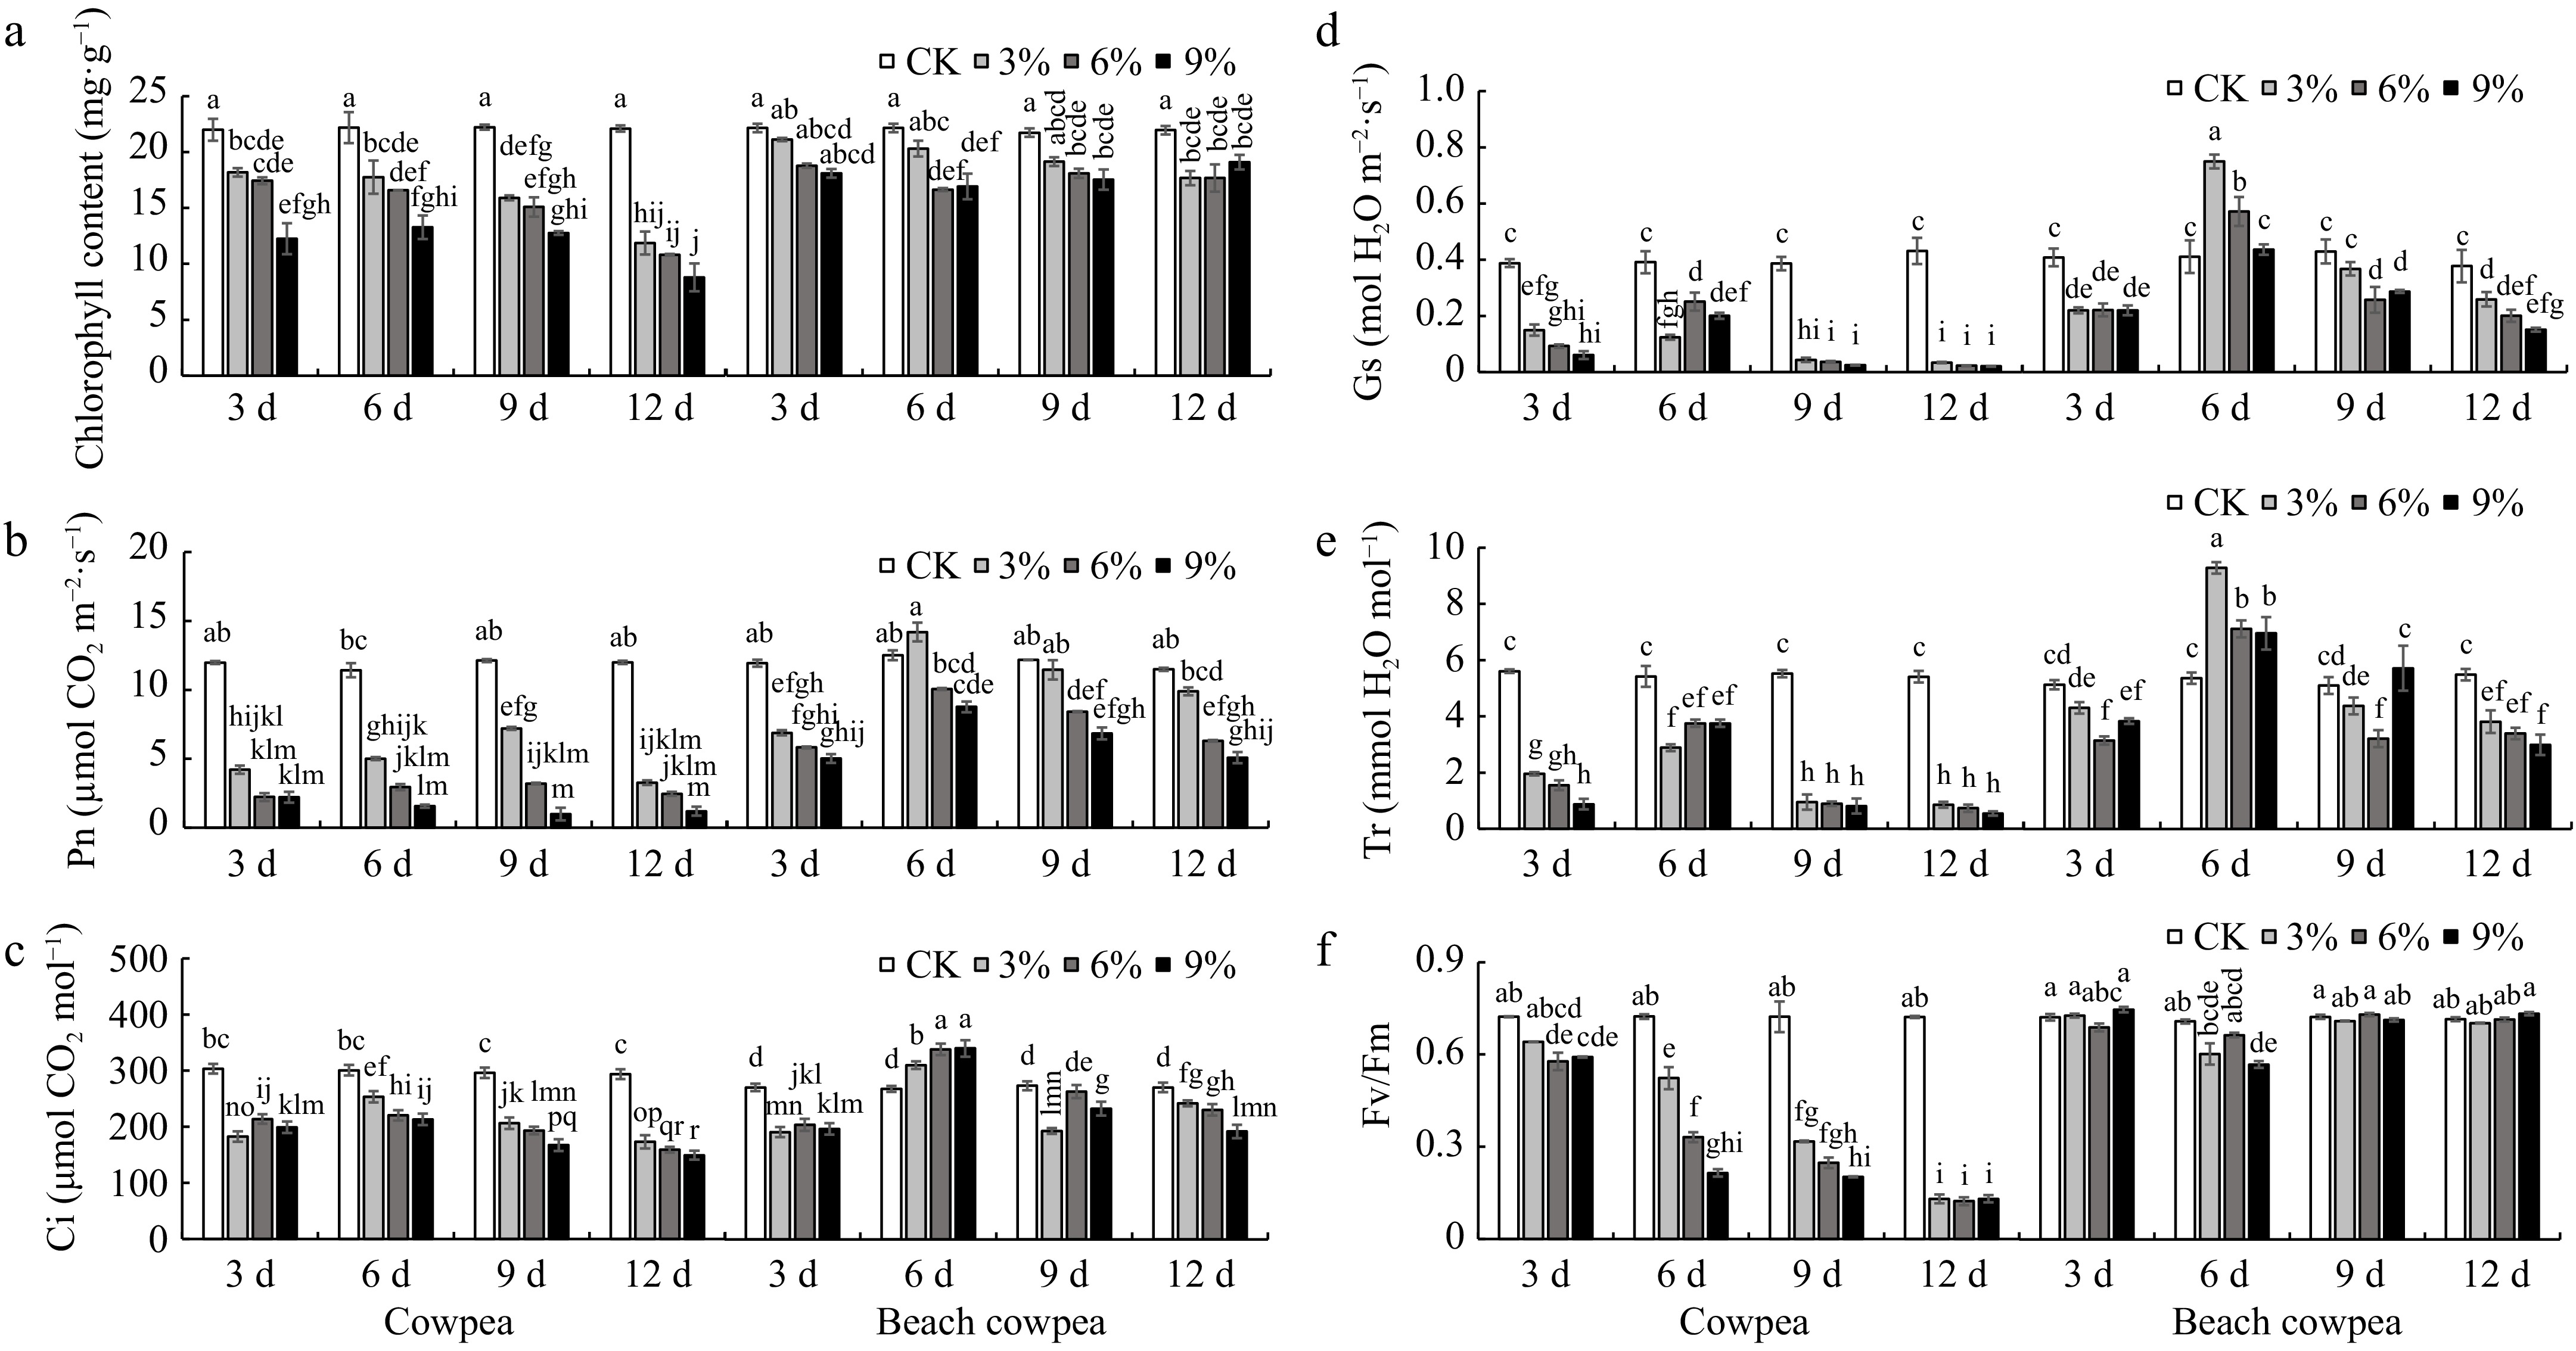
Figure 5.
Beach cowpea maintains higher chlorophyll content and more robust photosynthetic activity than cowpea under PEG6000-simulated drought stress. The effects of PEG6000-simulated drought stress on (a) total chlorophyll content; photosynthetic parameters including (b) photosynthetic rate (Pn), (c) intercellular CO2 concentration (Ci), (d) stomatal conductance (Gs), and (e) transpiration rate (Tr); (f) Fv/Fm ratio (variable to maximum fluorescence), were evaluated in leaves of cowpea and beach cowpea plants treated with 0%, 3%, 6%, and 9% PEG6000 for 3, 6, 9, and 12 d. Each experiment included three biological replicates. Different letters indicate statistically significant differences (p ≤ 0.05).
-
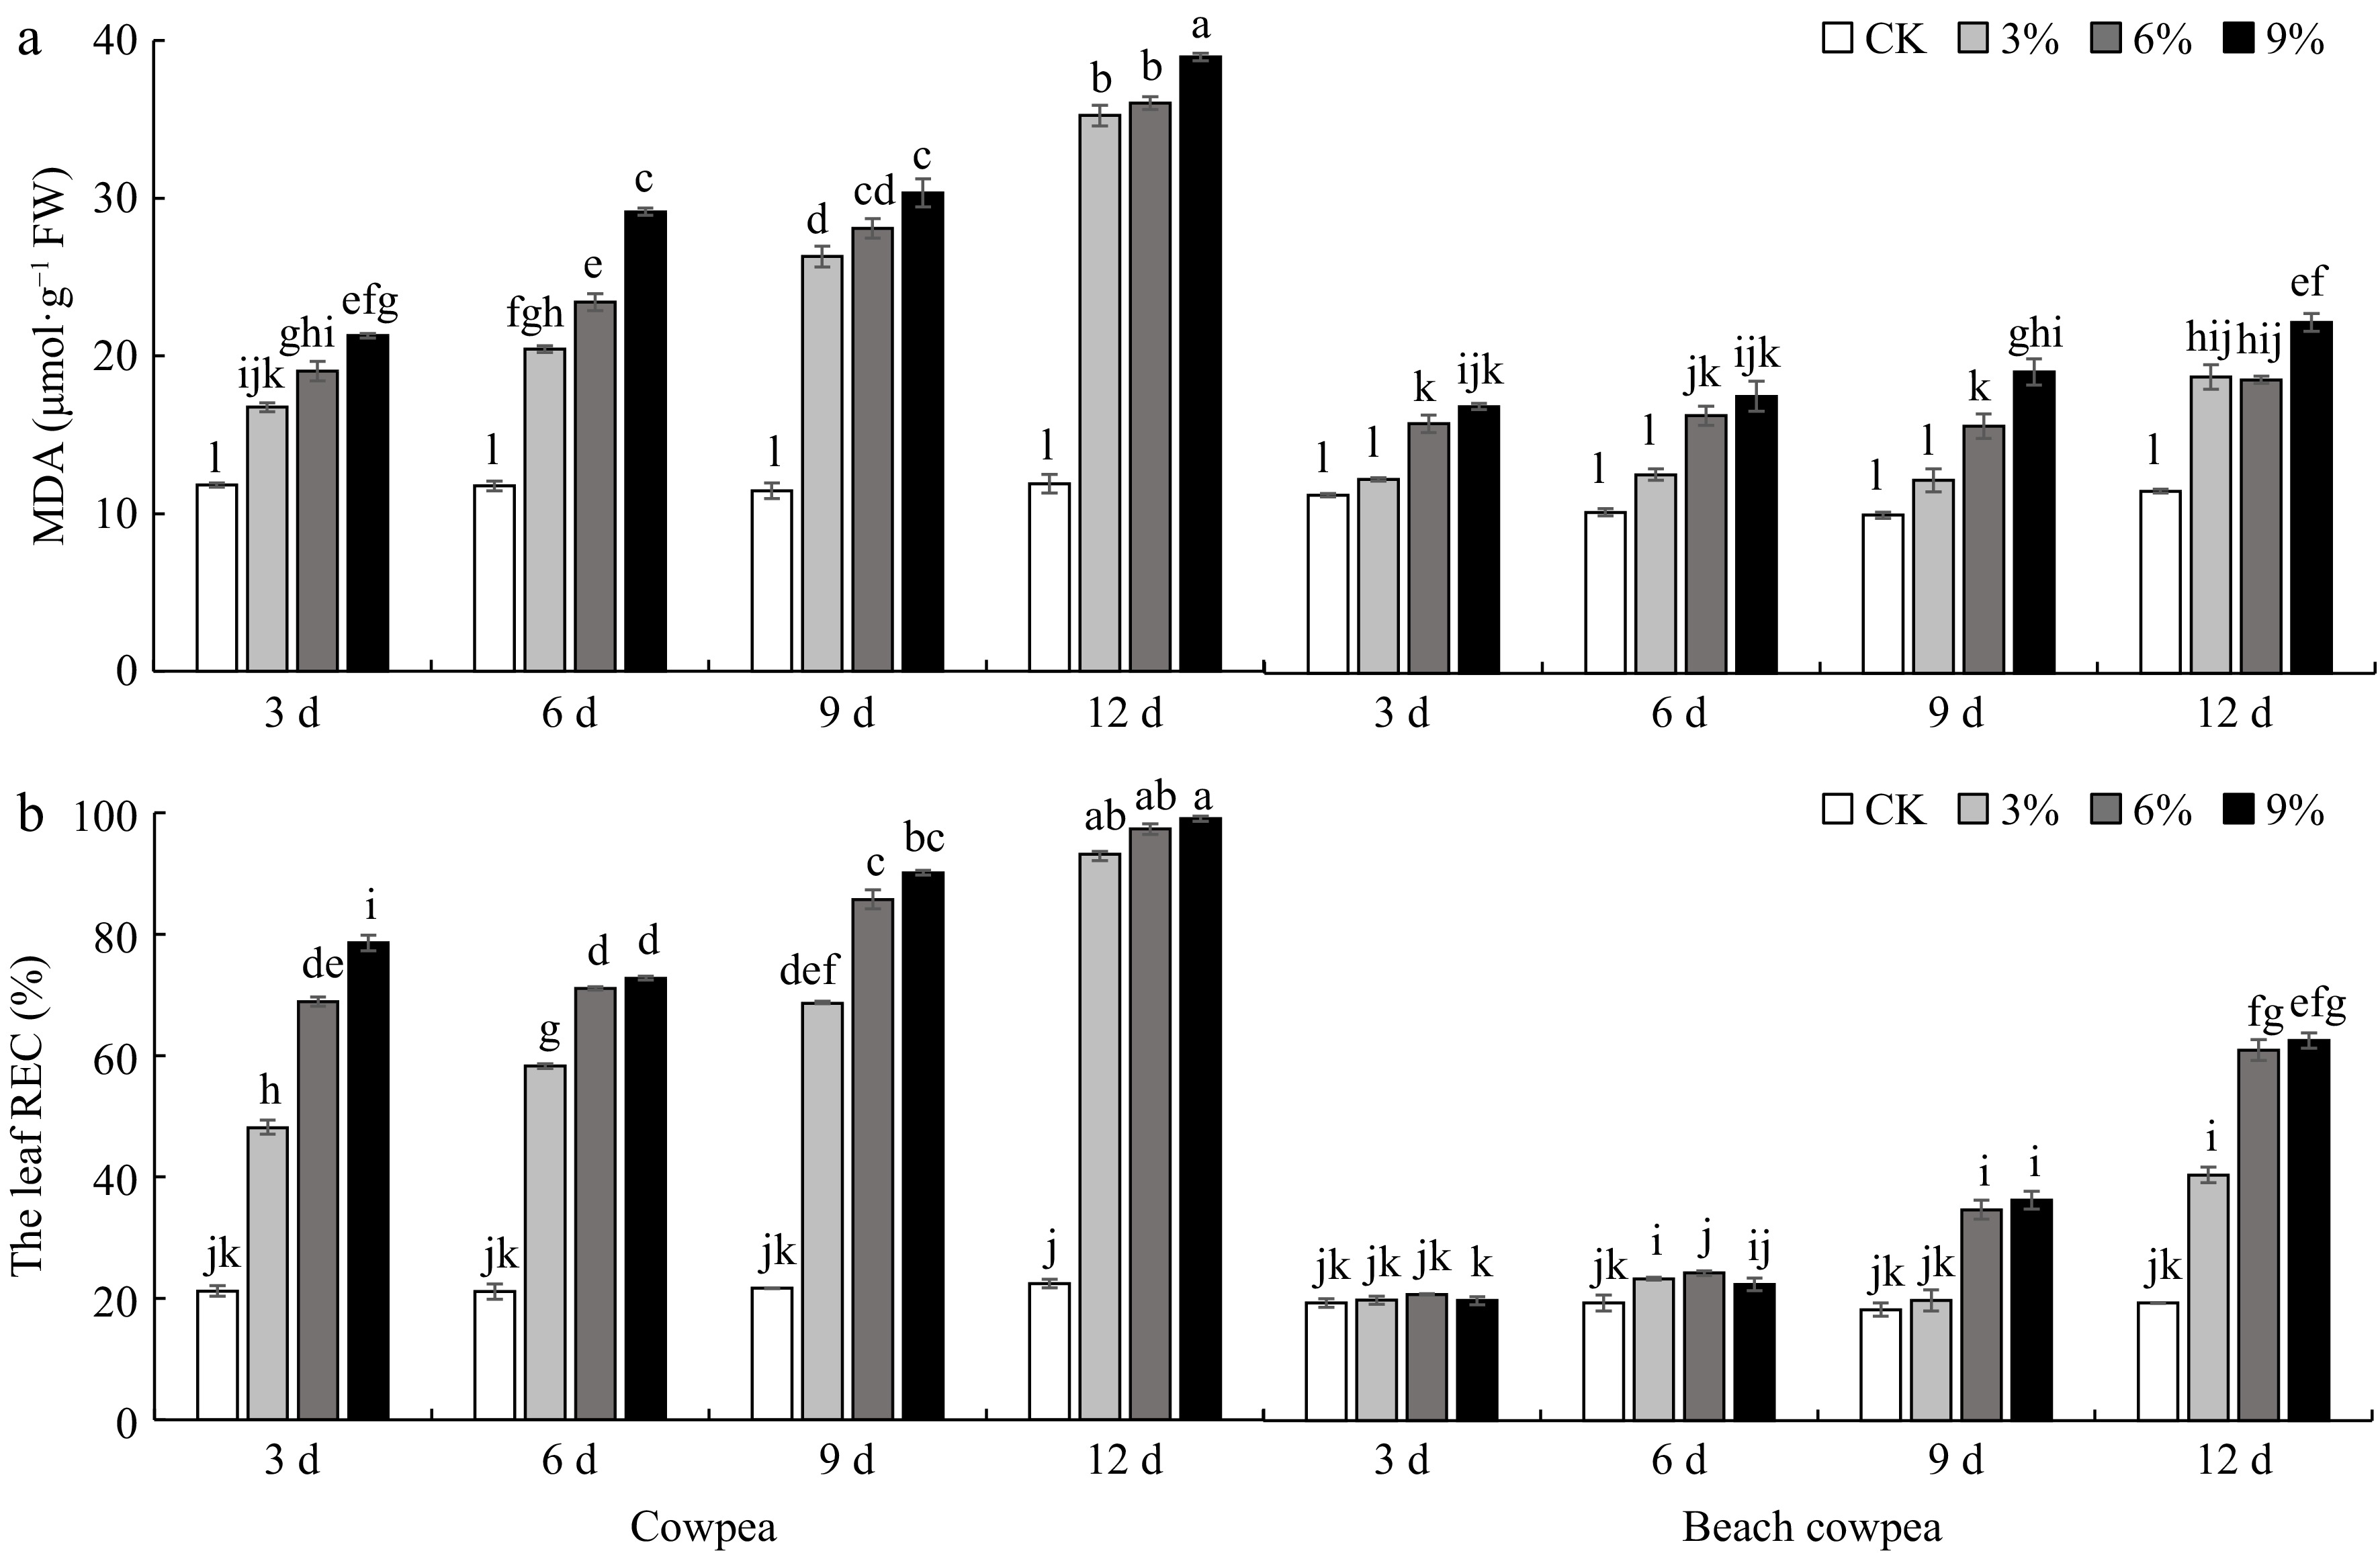
Figure 6.
Beach cowpea leaves contain lower levels of (a) Malondialdehyde (MDA), and (b) Relative electrical conductivity (REC) than cowpea under PEG6000-simulated drought stress. MDA and REC were used to evaluate the stress levels in leaves of cowpea and beach cowpea plants treated with 0%, 3%, 6%, and 9% PEG6000 for 3, 6, 9, and 12 d. Each experiment included three biological replicates. Different letters indicate statistically significant differences (p ≤ 0.05).
-
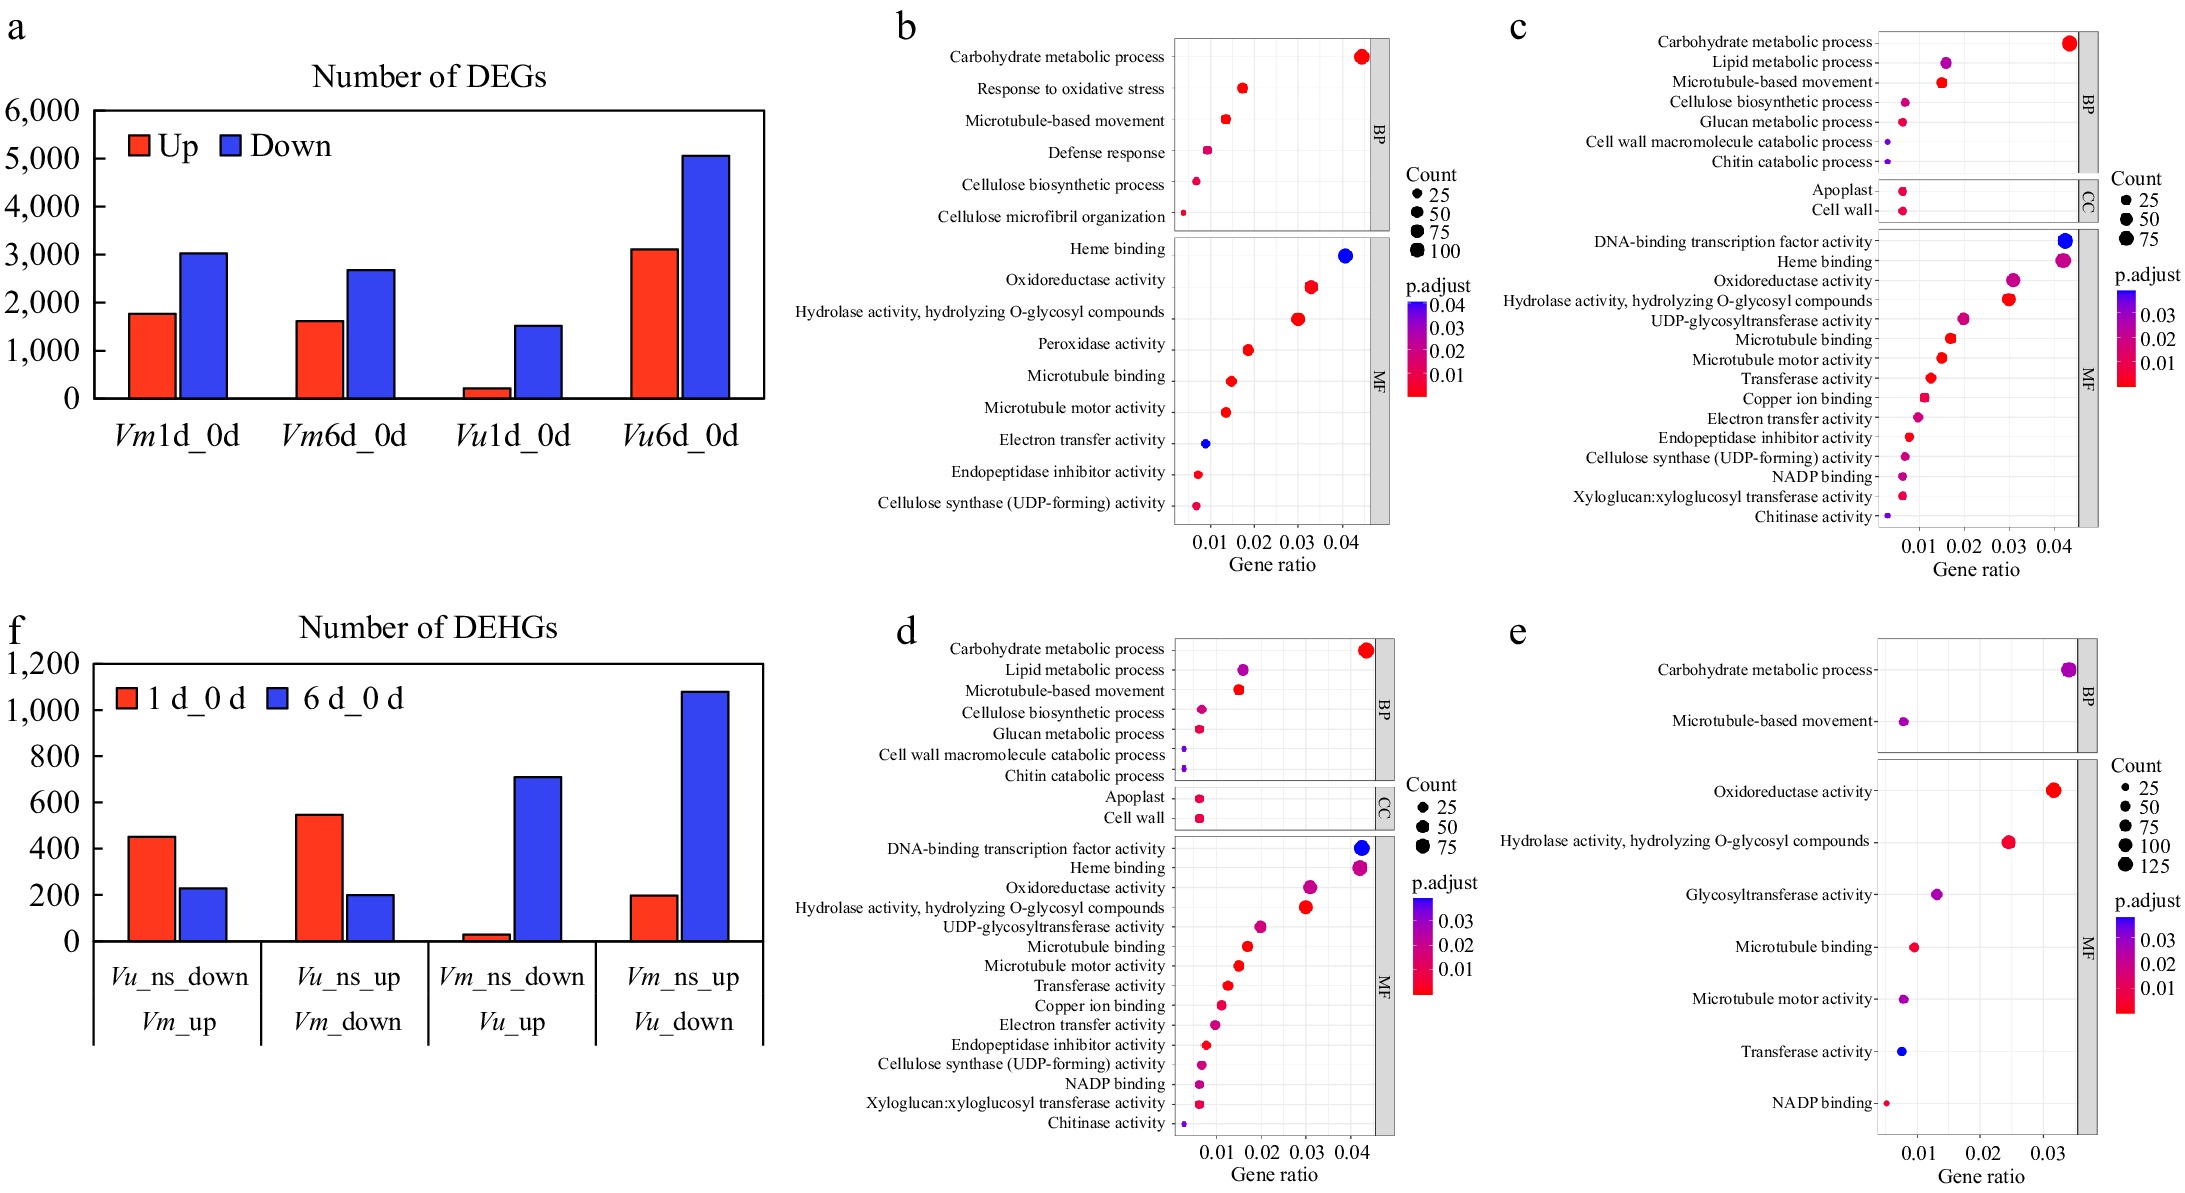
Figure 7.
Transcriptional changes of Vm and Vu genes in roots under drought treatments. (a) The number of DEGs in the comparisons Vm0d_Vm1d, Vm0d_Vm6d, Vu0d_Vu1d, and Vu0d_Vu6d. (b)−(e) Show the GO functional annotation of DEGs in the comparisons Vm0d_Vm1d, Vm0d_Vm6d, Vu0d_Vu1d, and Vu0d_Vu6d, respectively. (f) The number of DEHGs in the comparisons Vm_up/Vu_ns_down, Vm_down/Vu_ns_up, Vu_up/Vm_ns_down, and Vu_down/Vm_ns_up for the 1-d and 6-d treatments.
-
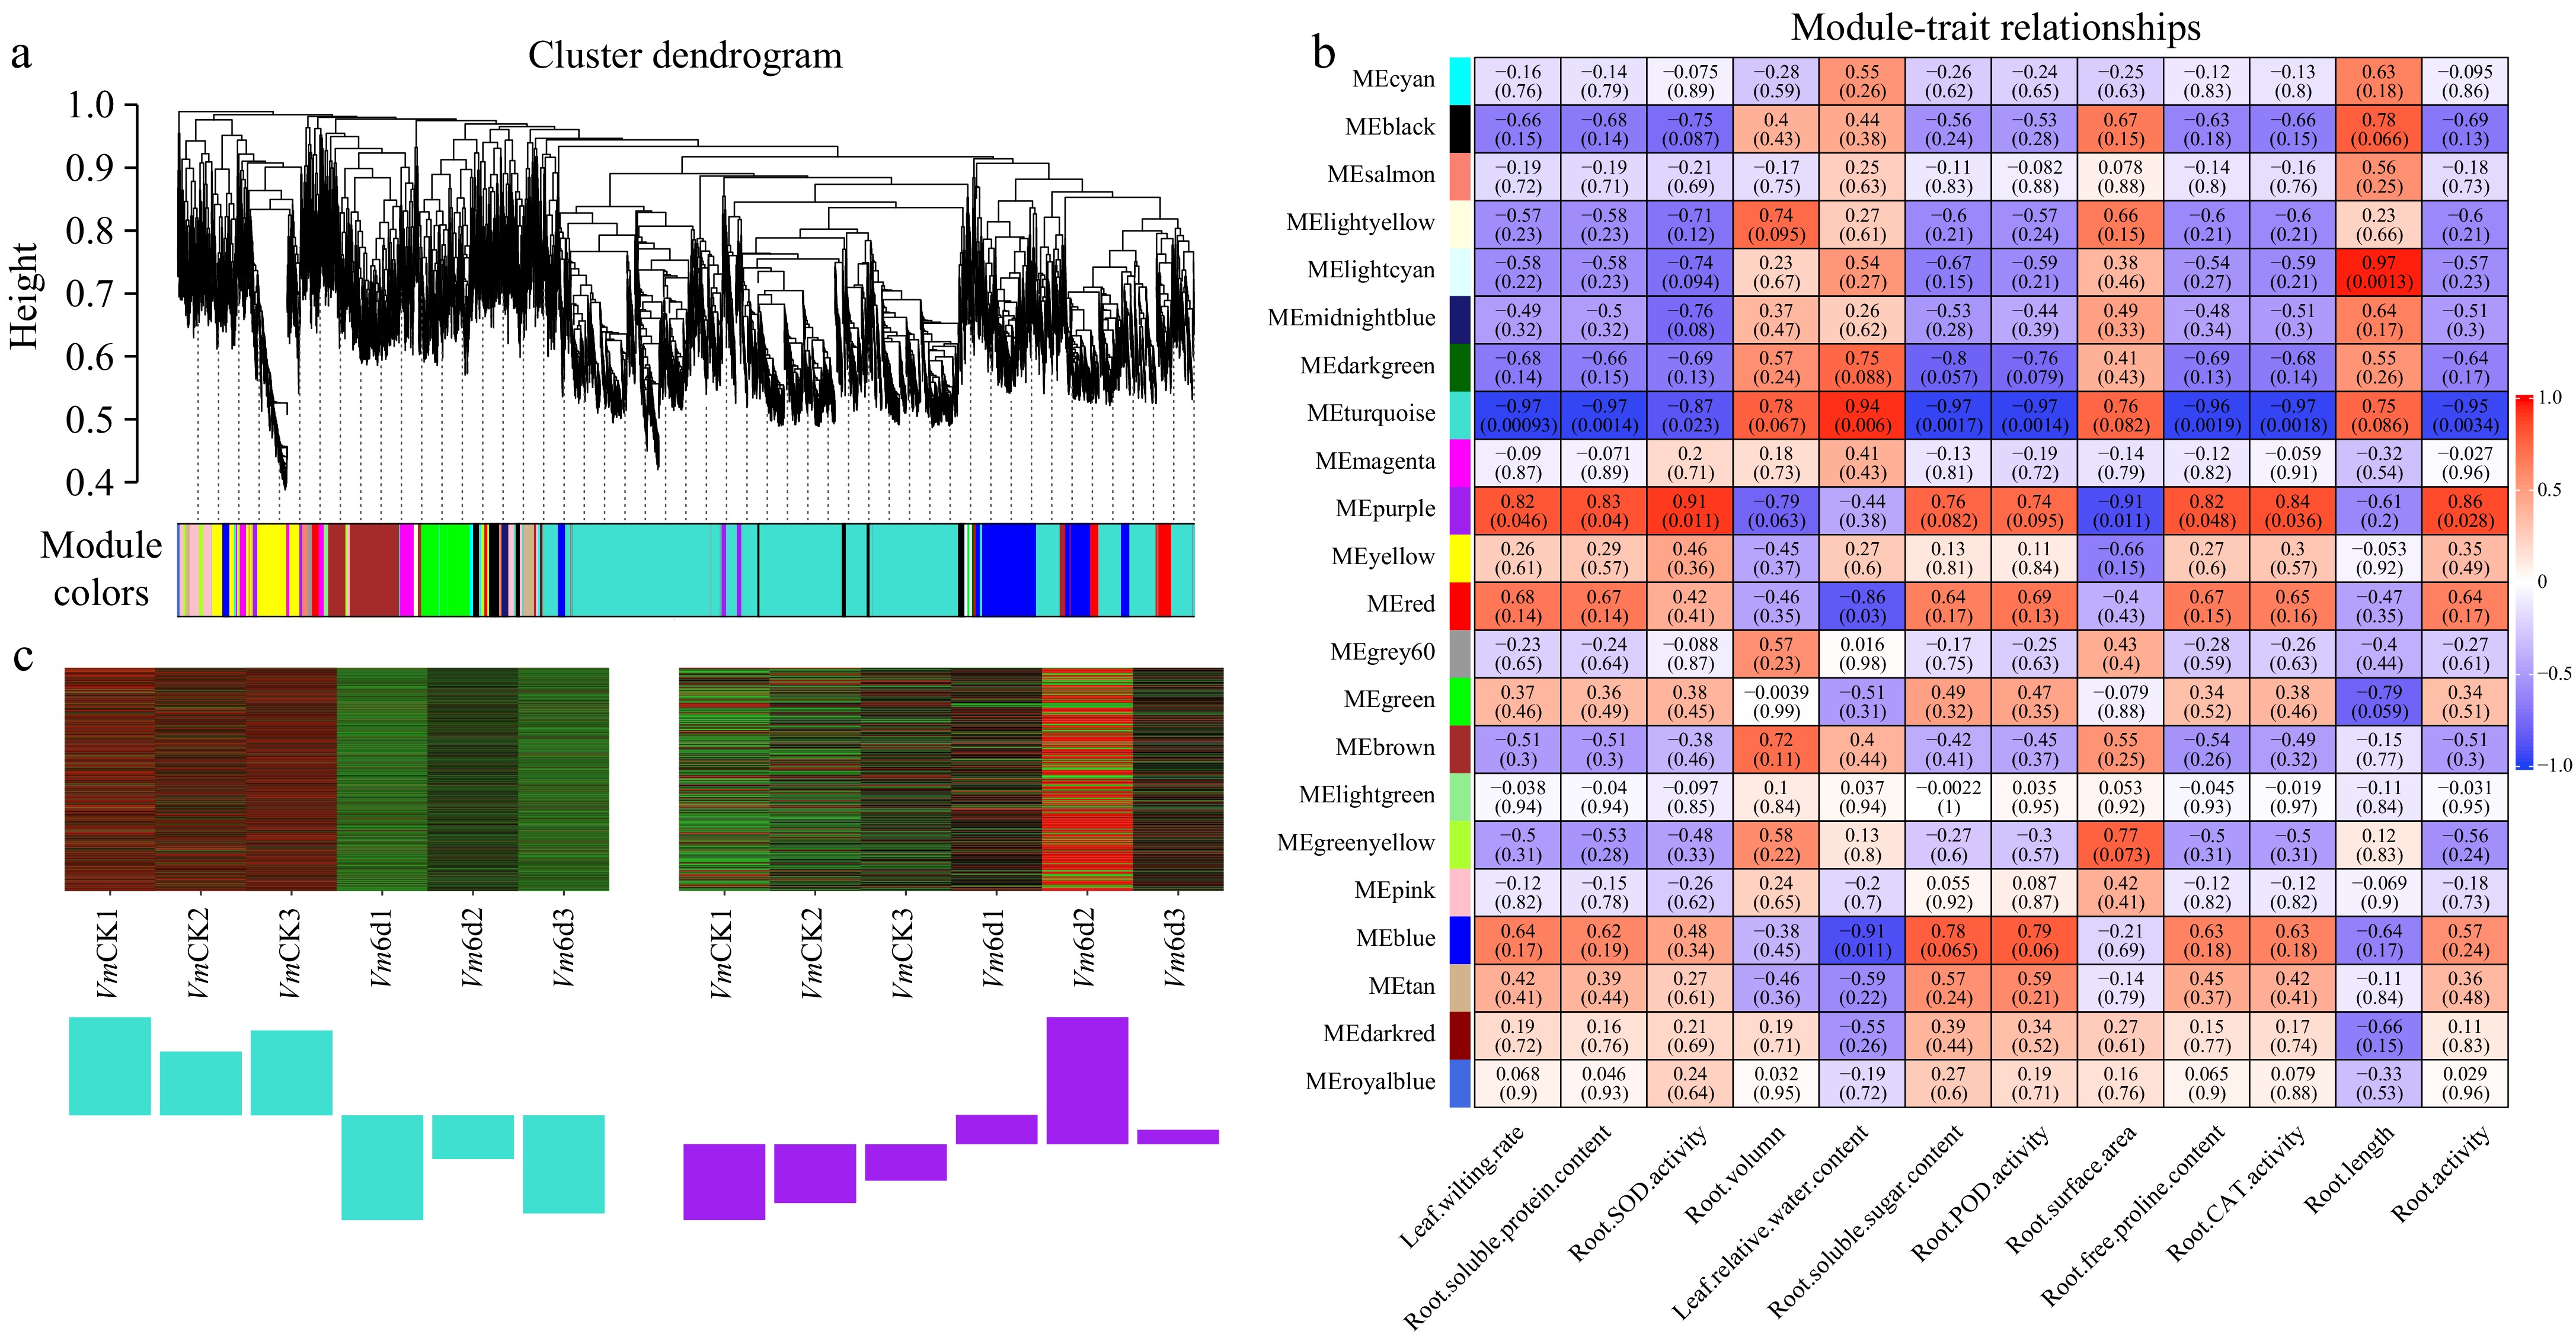
Figure 8.
WGCNA of genes in roots of Vm under 0 d and 6 d drought treatments. (a) Hierarchical cluster tree shows 22 co-expression modules labelled by different colors (except the gray module) based on the gene expression clustering results. Each short vertical line in the tree represents a gene. (b) The correlation analysis between 22 modules and 12 physiological traits. Each row corresponds to a module and each column corresponds to a physiological index. The number in each cell at the row-column intersection indicates the correlation coefficient. The colors varied from blue to red represent the scale of correlation coefficients, ranging from −1 (blue) to 1 (red). (c) Heatmaps indicate the expression patterns of eigengenes in the turquoise and purple modules. Bar graphs (below the heatmap) show the corresponding expression levels of the module eigengenes in different samples. The samples were VmCK1, VmCK2, VmCK3, Vm6d1, Vm6d2, and Vm6d3 with three biological replicates.
-
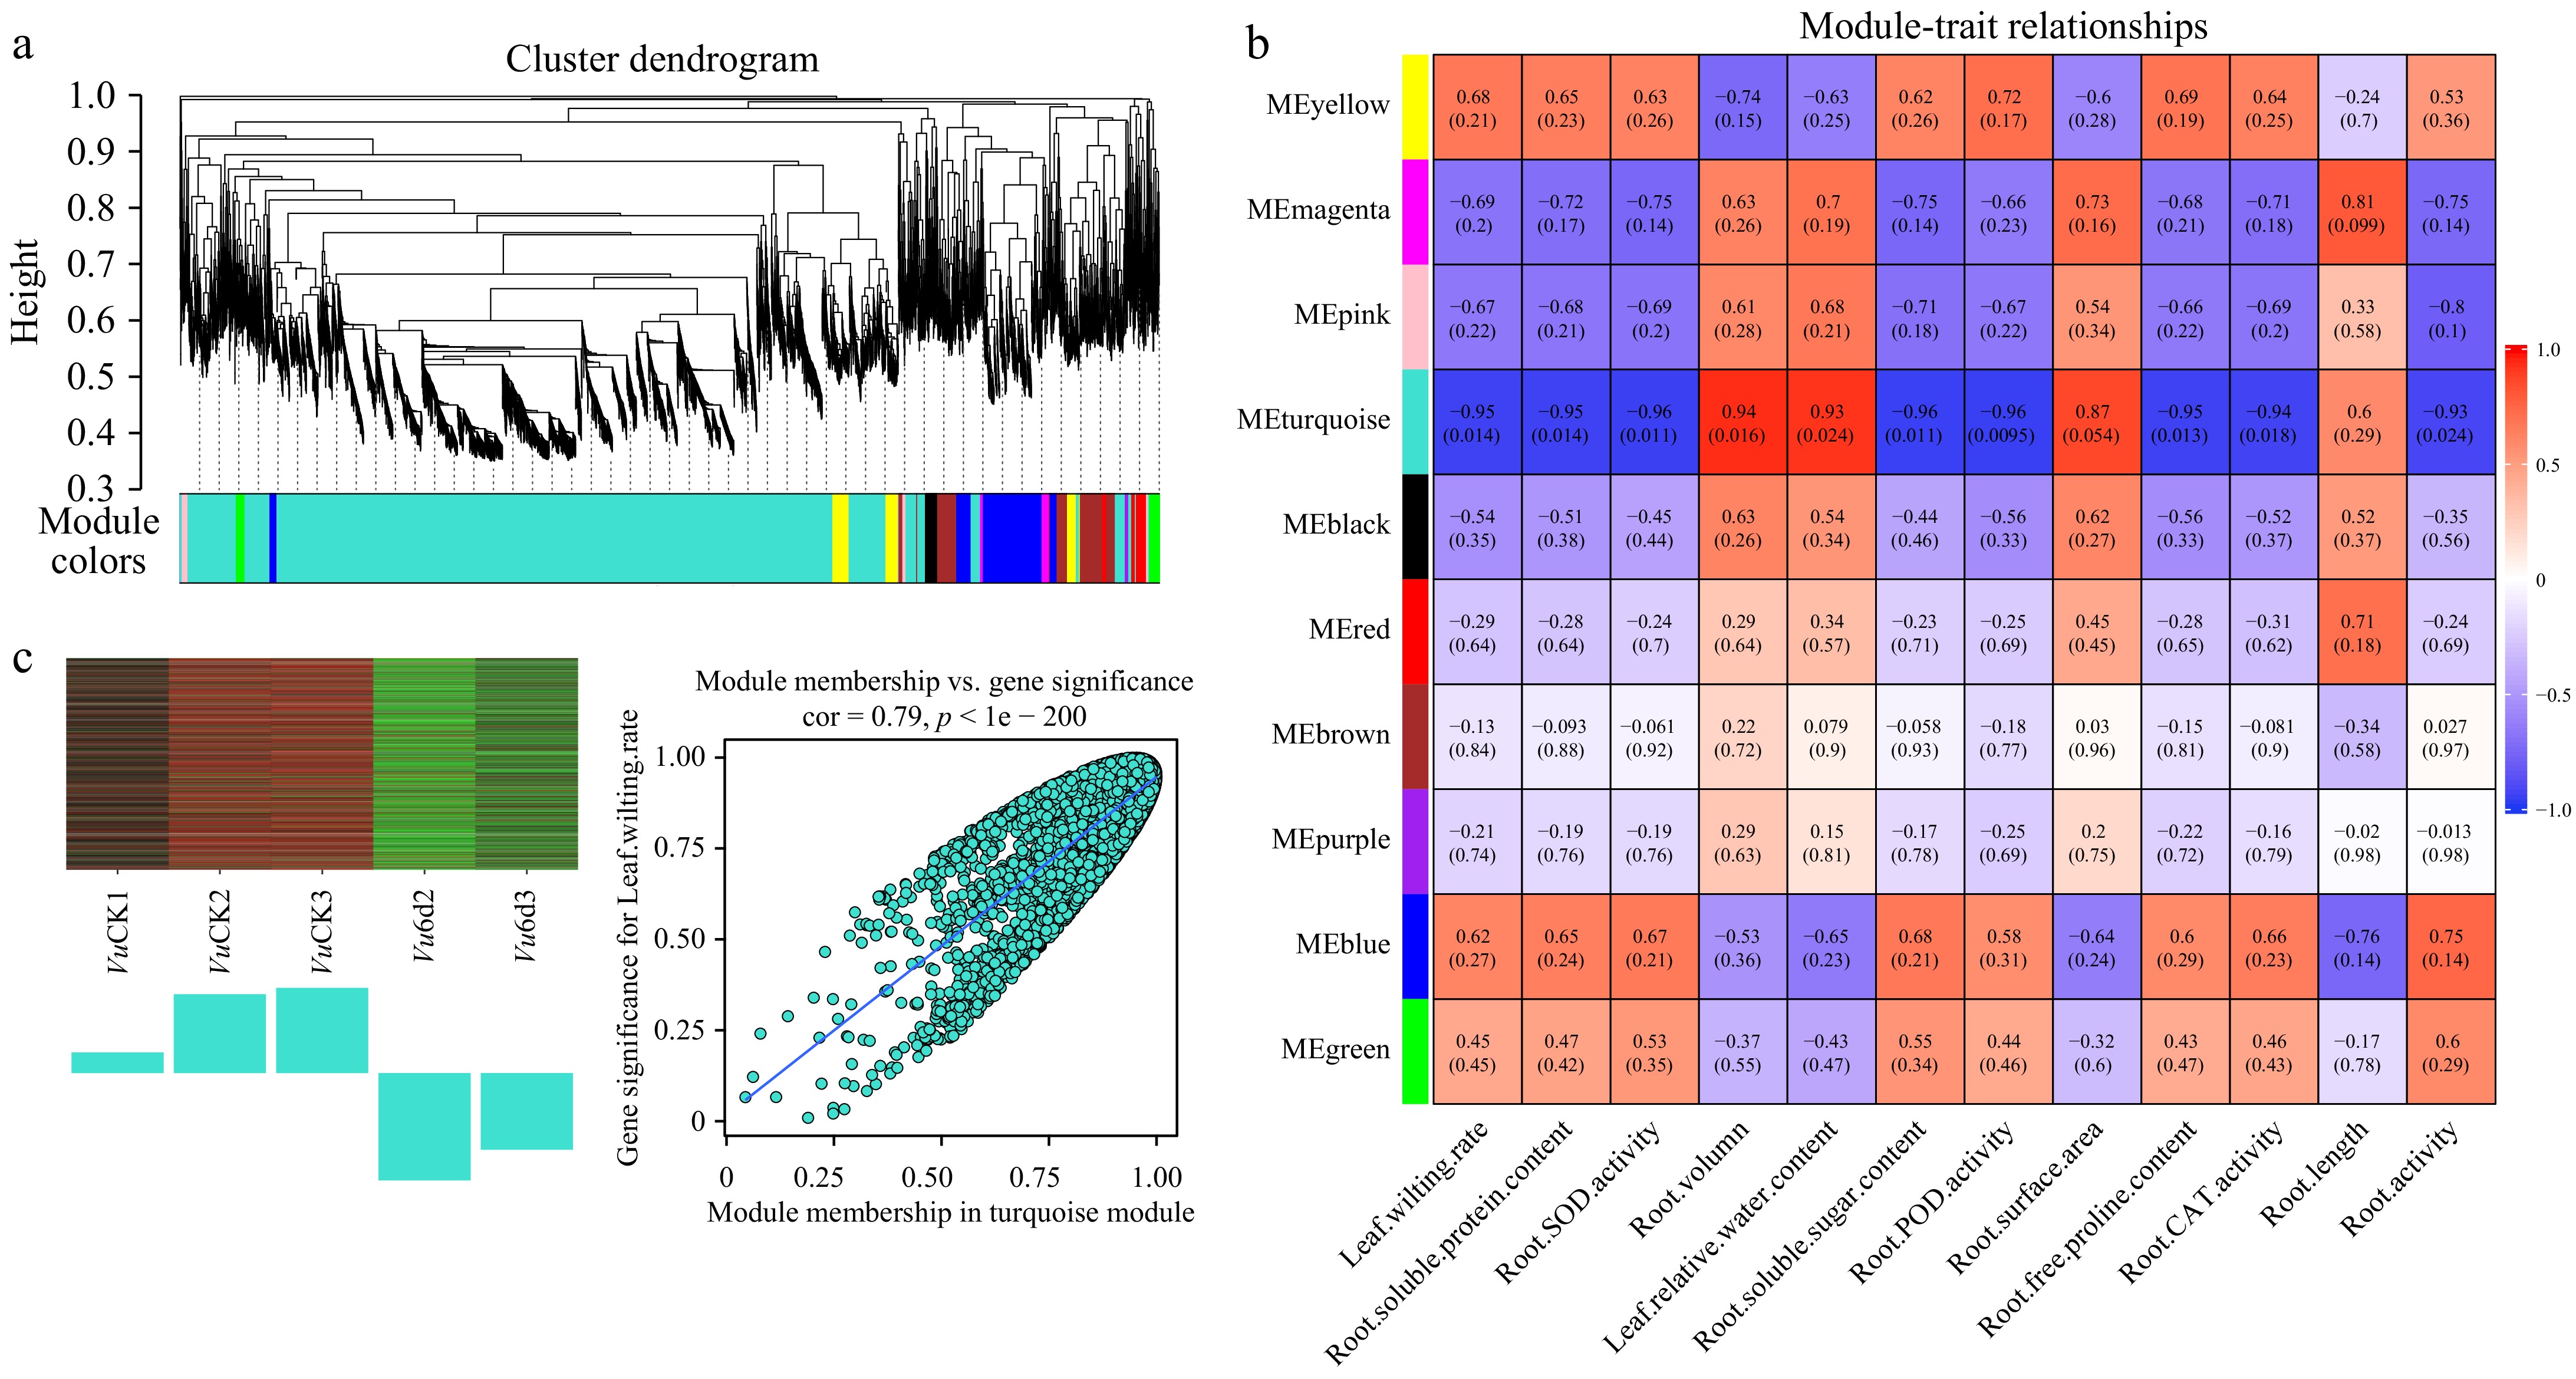
Figure 9.
WGCNA of genes in roots of Vu under 0 d and 6 d drought treatments. (a) Hierarchical cluster tree shows 10 co-expression modules labelled by different colors (except the gray module) based on the gene expression clustering results. Each short vertical line in the tree represents a gene. (b) The correlation analysis between 10 modules and 12 physiological traits. Each row corresponds to a module and each column corresponds to a physiological index. The number in each cell at the row-column intersection indicates the correlation coefficient. The colors varied from blue to red represent the scale of correlation coefficients, ranging from −1 (blue) to 1 (red). (c) Heatmaps indicate the expression patterns of eigengenes in the turquoise and purple modules. Bar graphs (below the heatmap) show the corresponding expression levels of the module eigengenes in different samples. The samples were VuCK1, VuCK2, VuCK3, Vu6d2, Vu6d3, with three and two biological replicates, respectively.
Figures
(9)
Tables
(0)