-
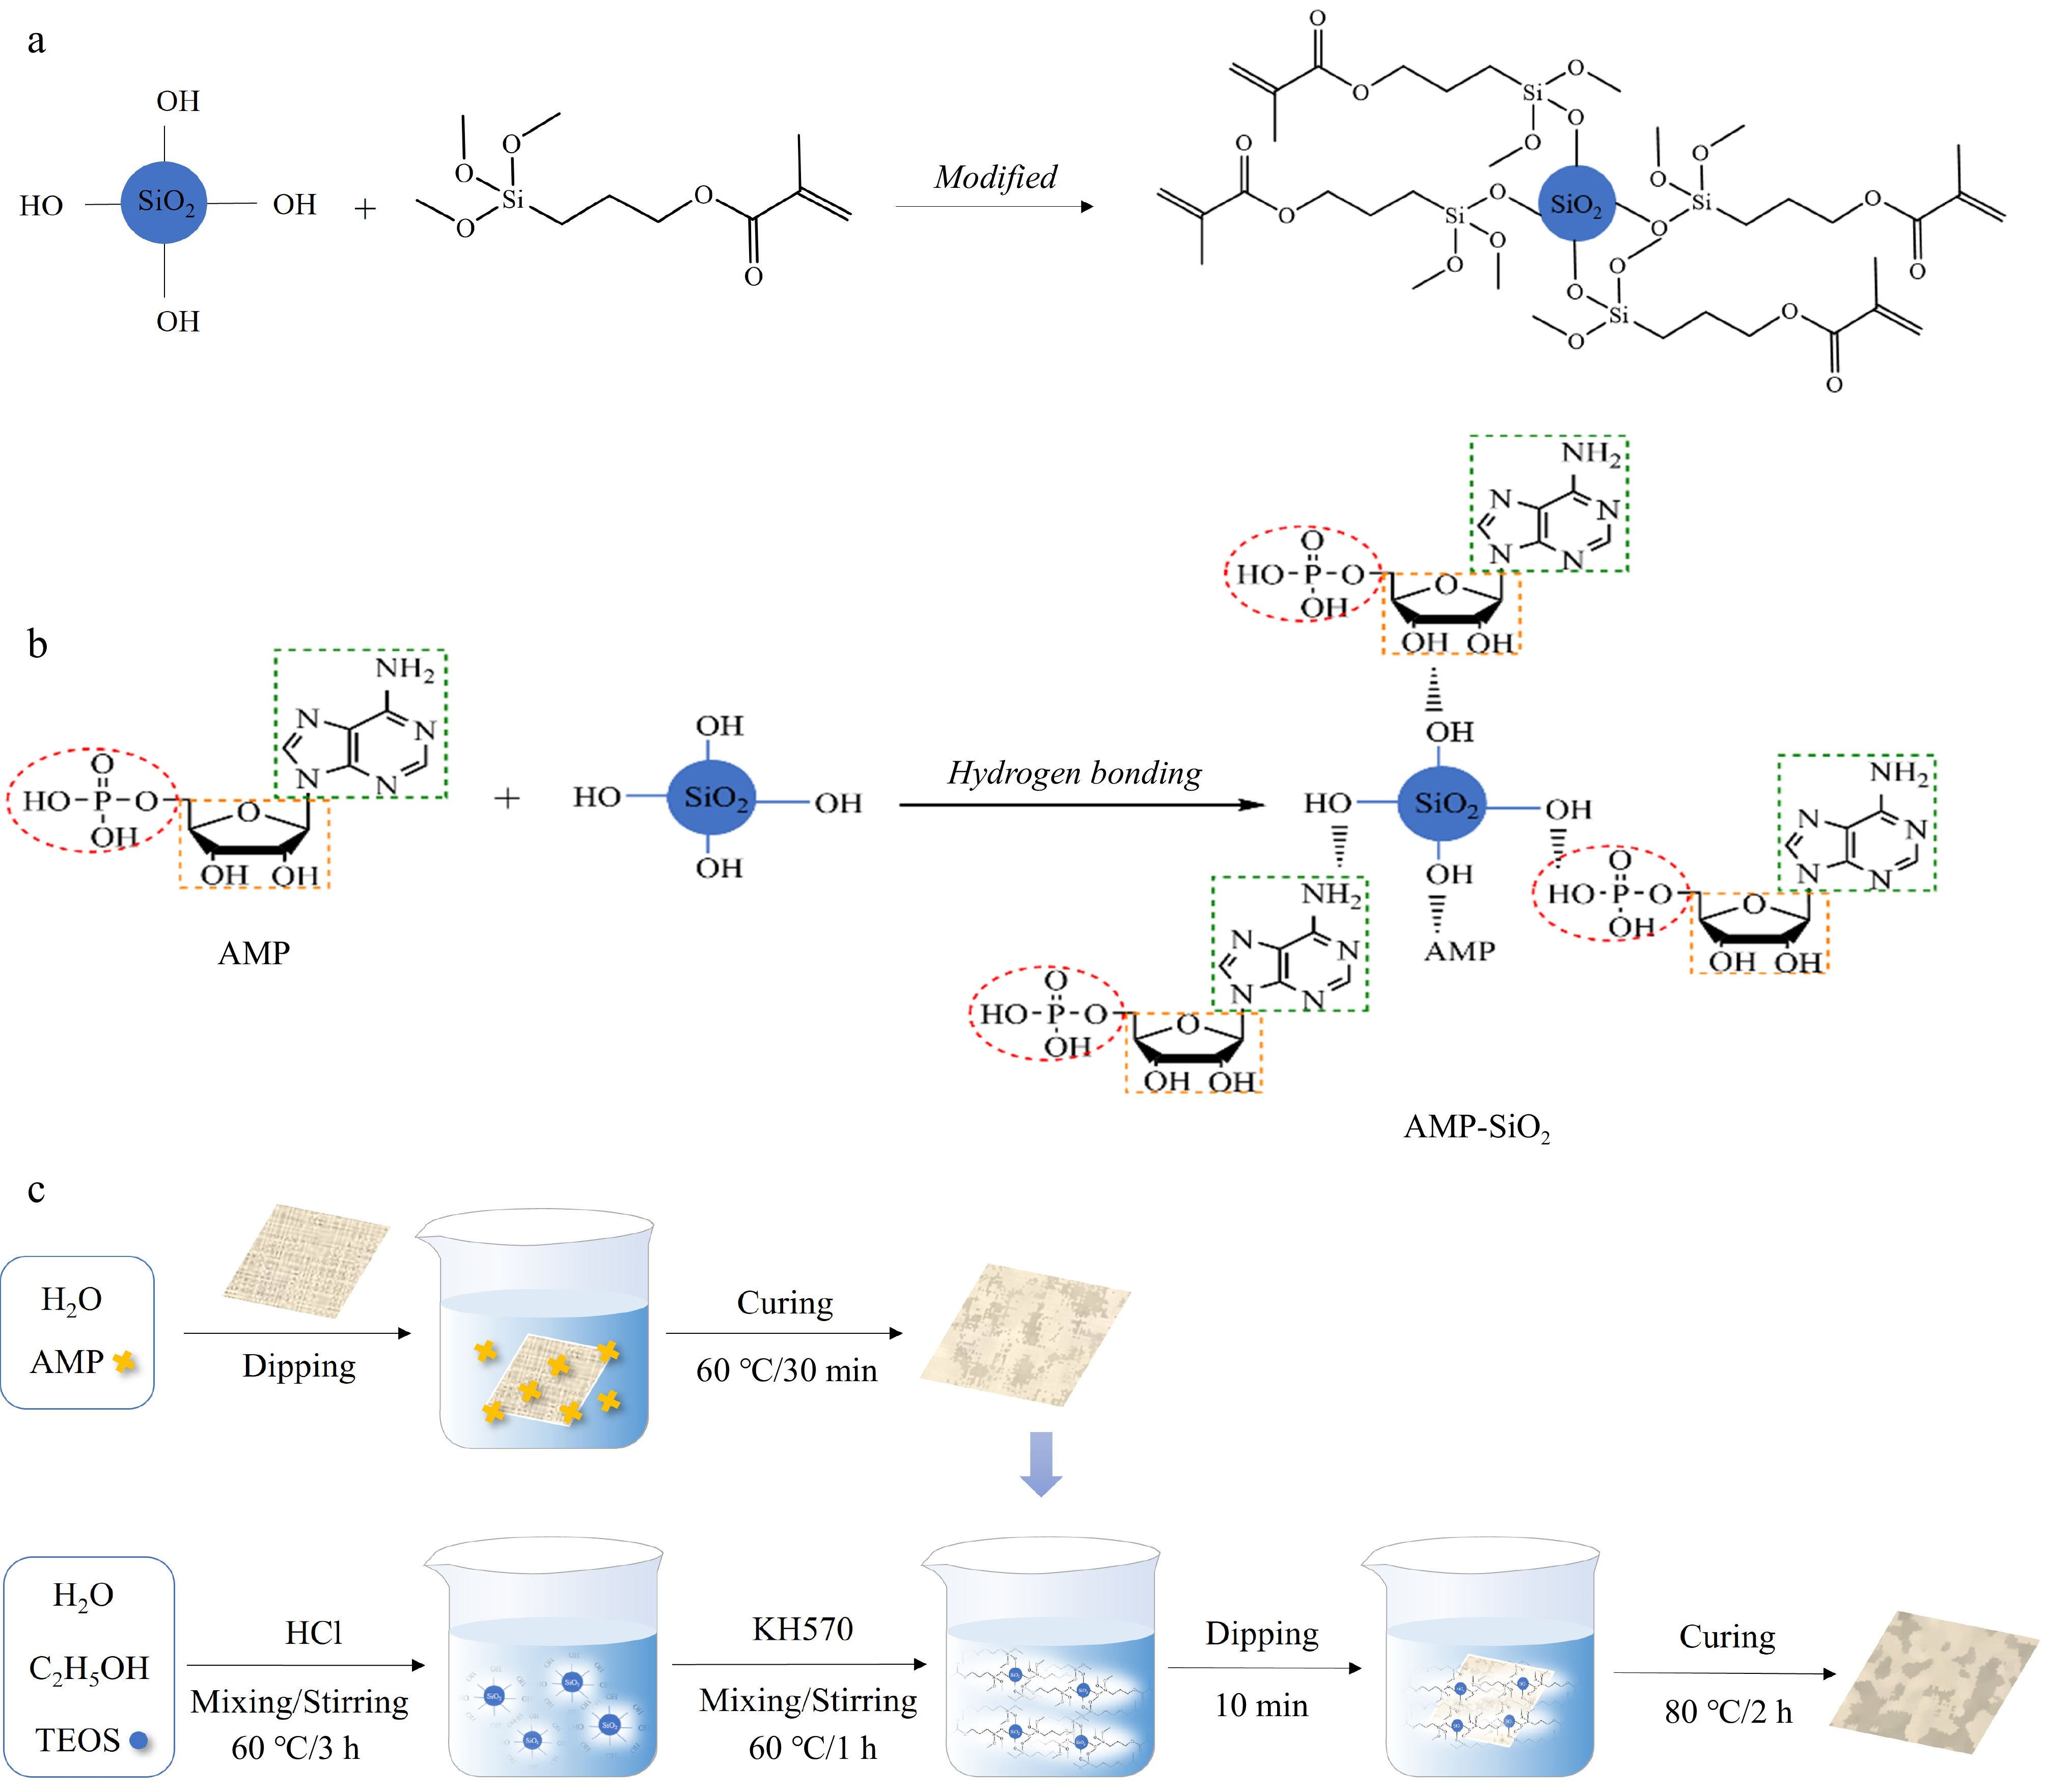
Figure 1.
(a) Path diagram of SiO2-KH570, (b) synthetic route of an AMP-SiO2 sol, (c) preparation process of AMP-SiO2-KH570@COT.
-
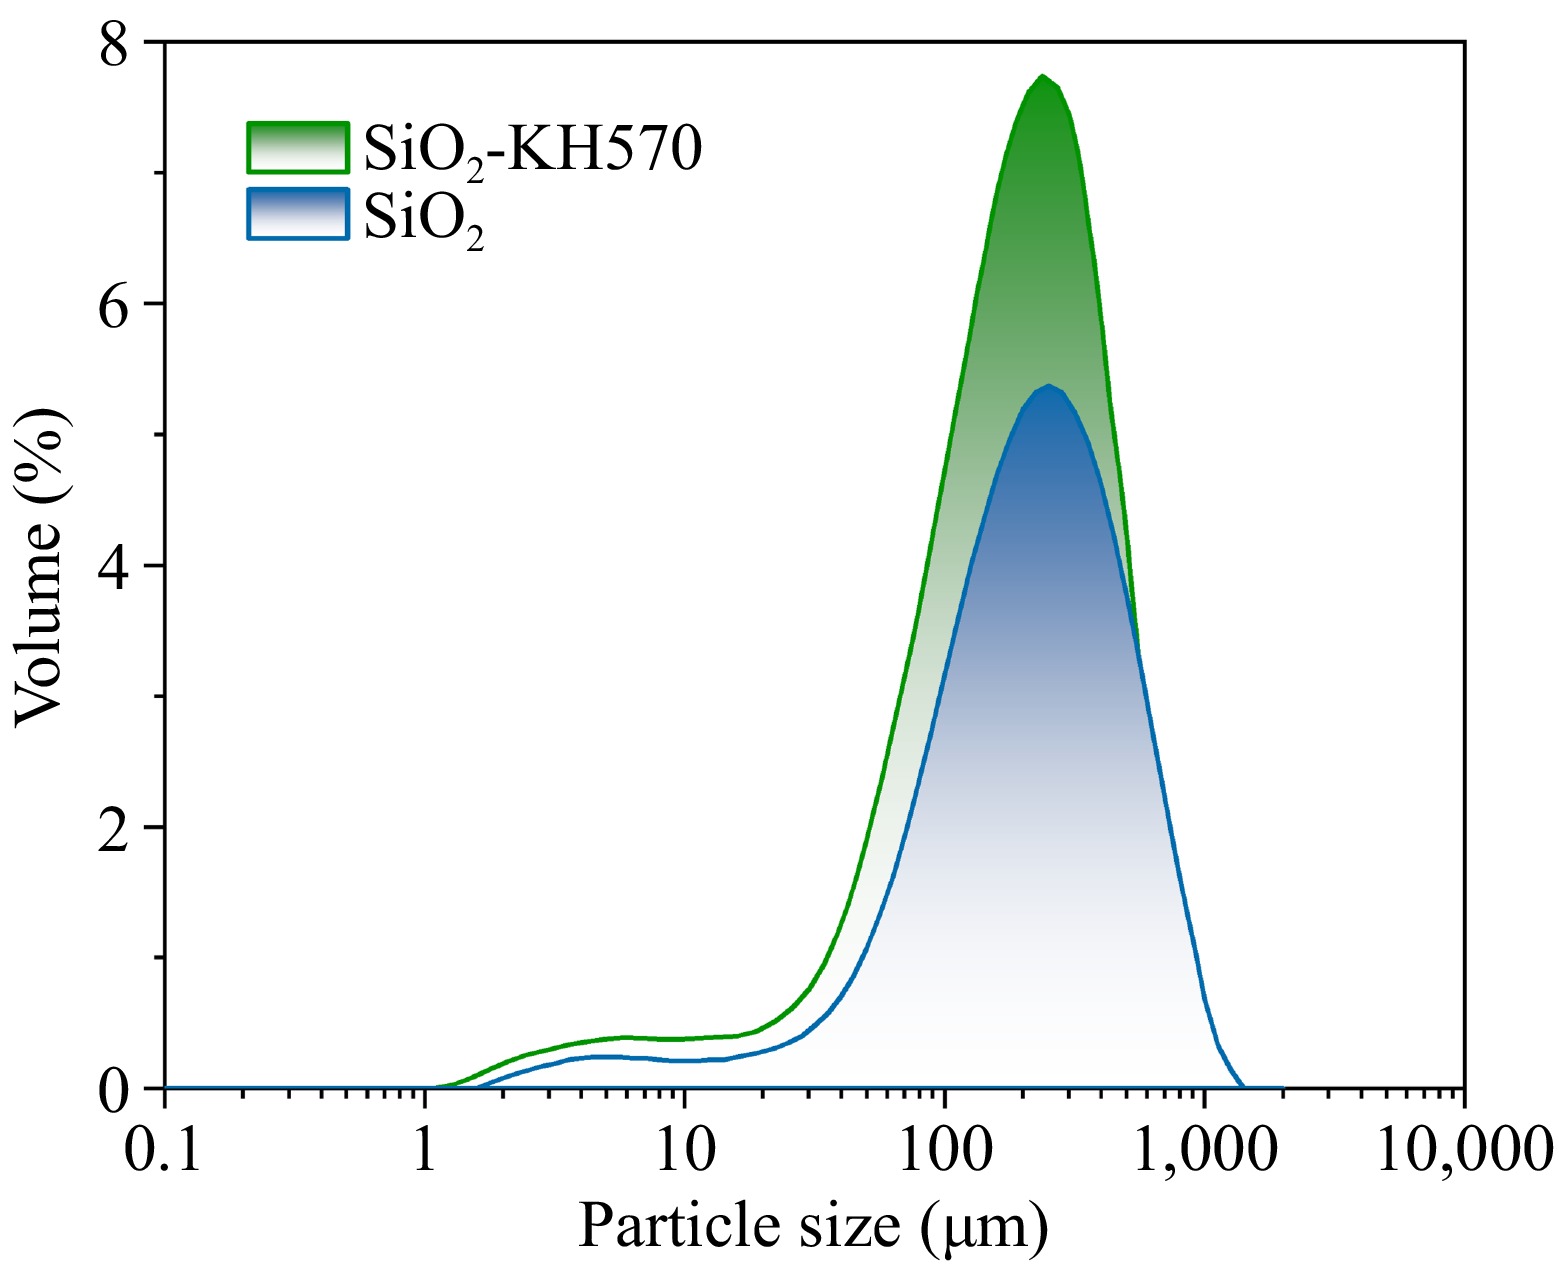
Figure 2.
Particle size distribution of SiO2 sol and SiO2-KH570 sol.
-
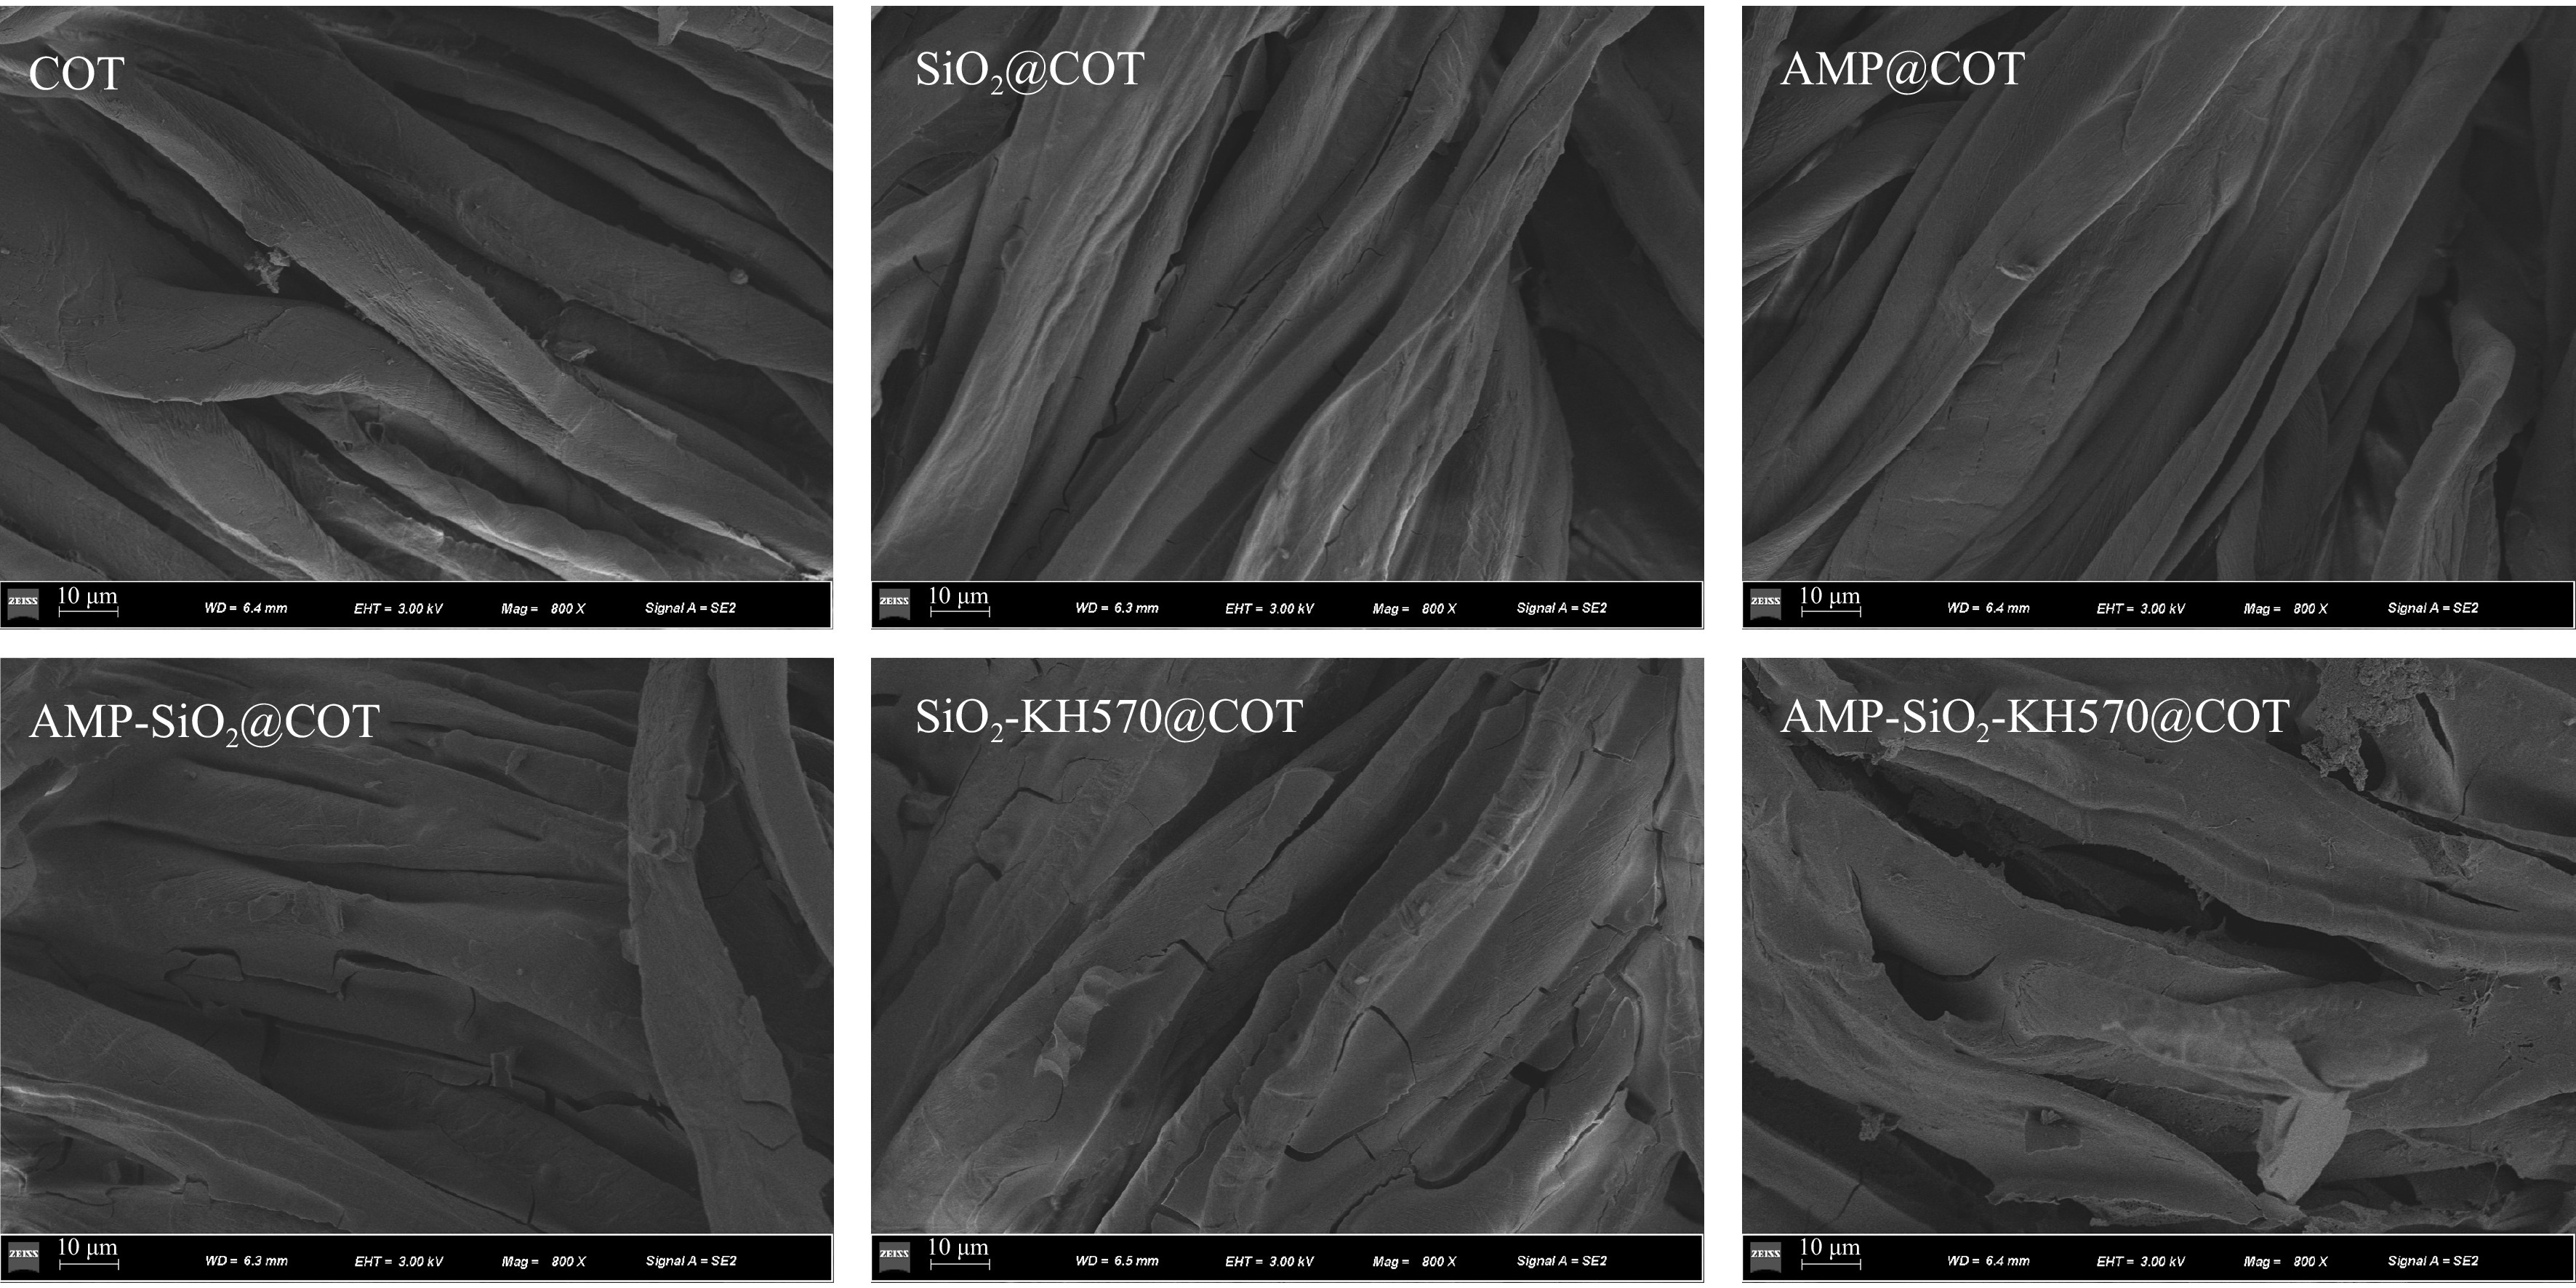
Figure 3.
SEM images of raw and treated cotton fabrics.
-
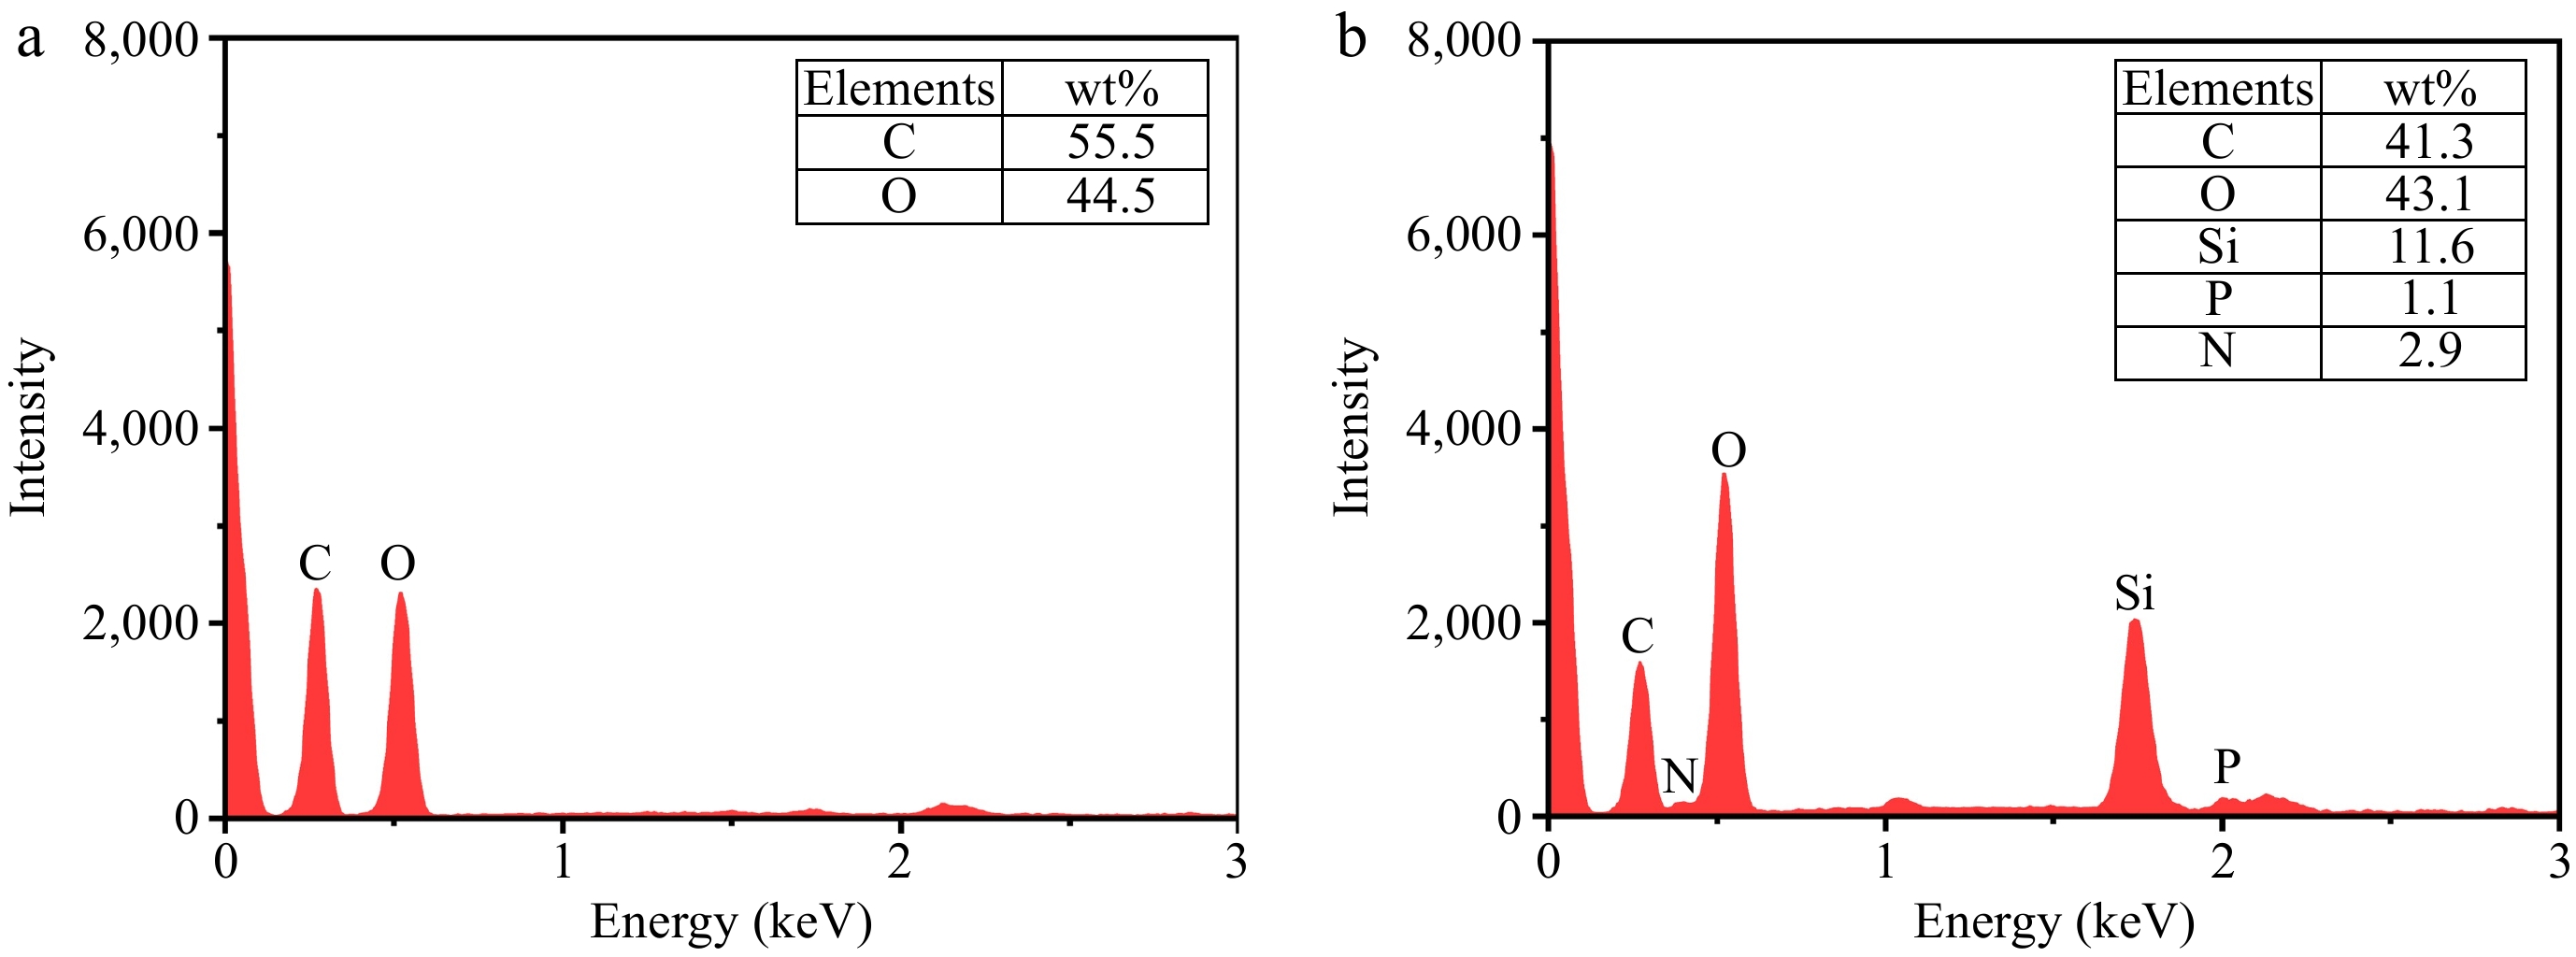
Figure 4.
(a) EDX spectra of COT, and (b) AMP-SiO2-KH570@COT.
-
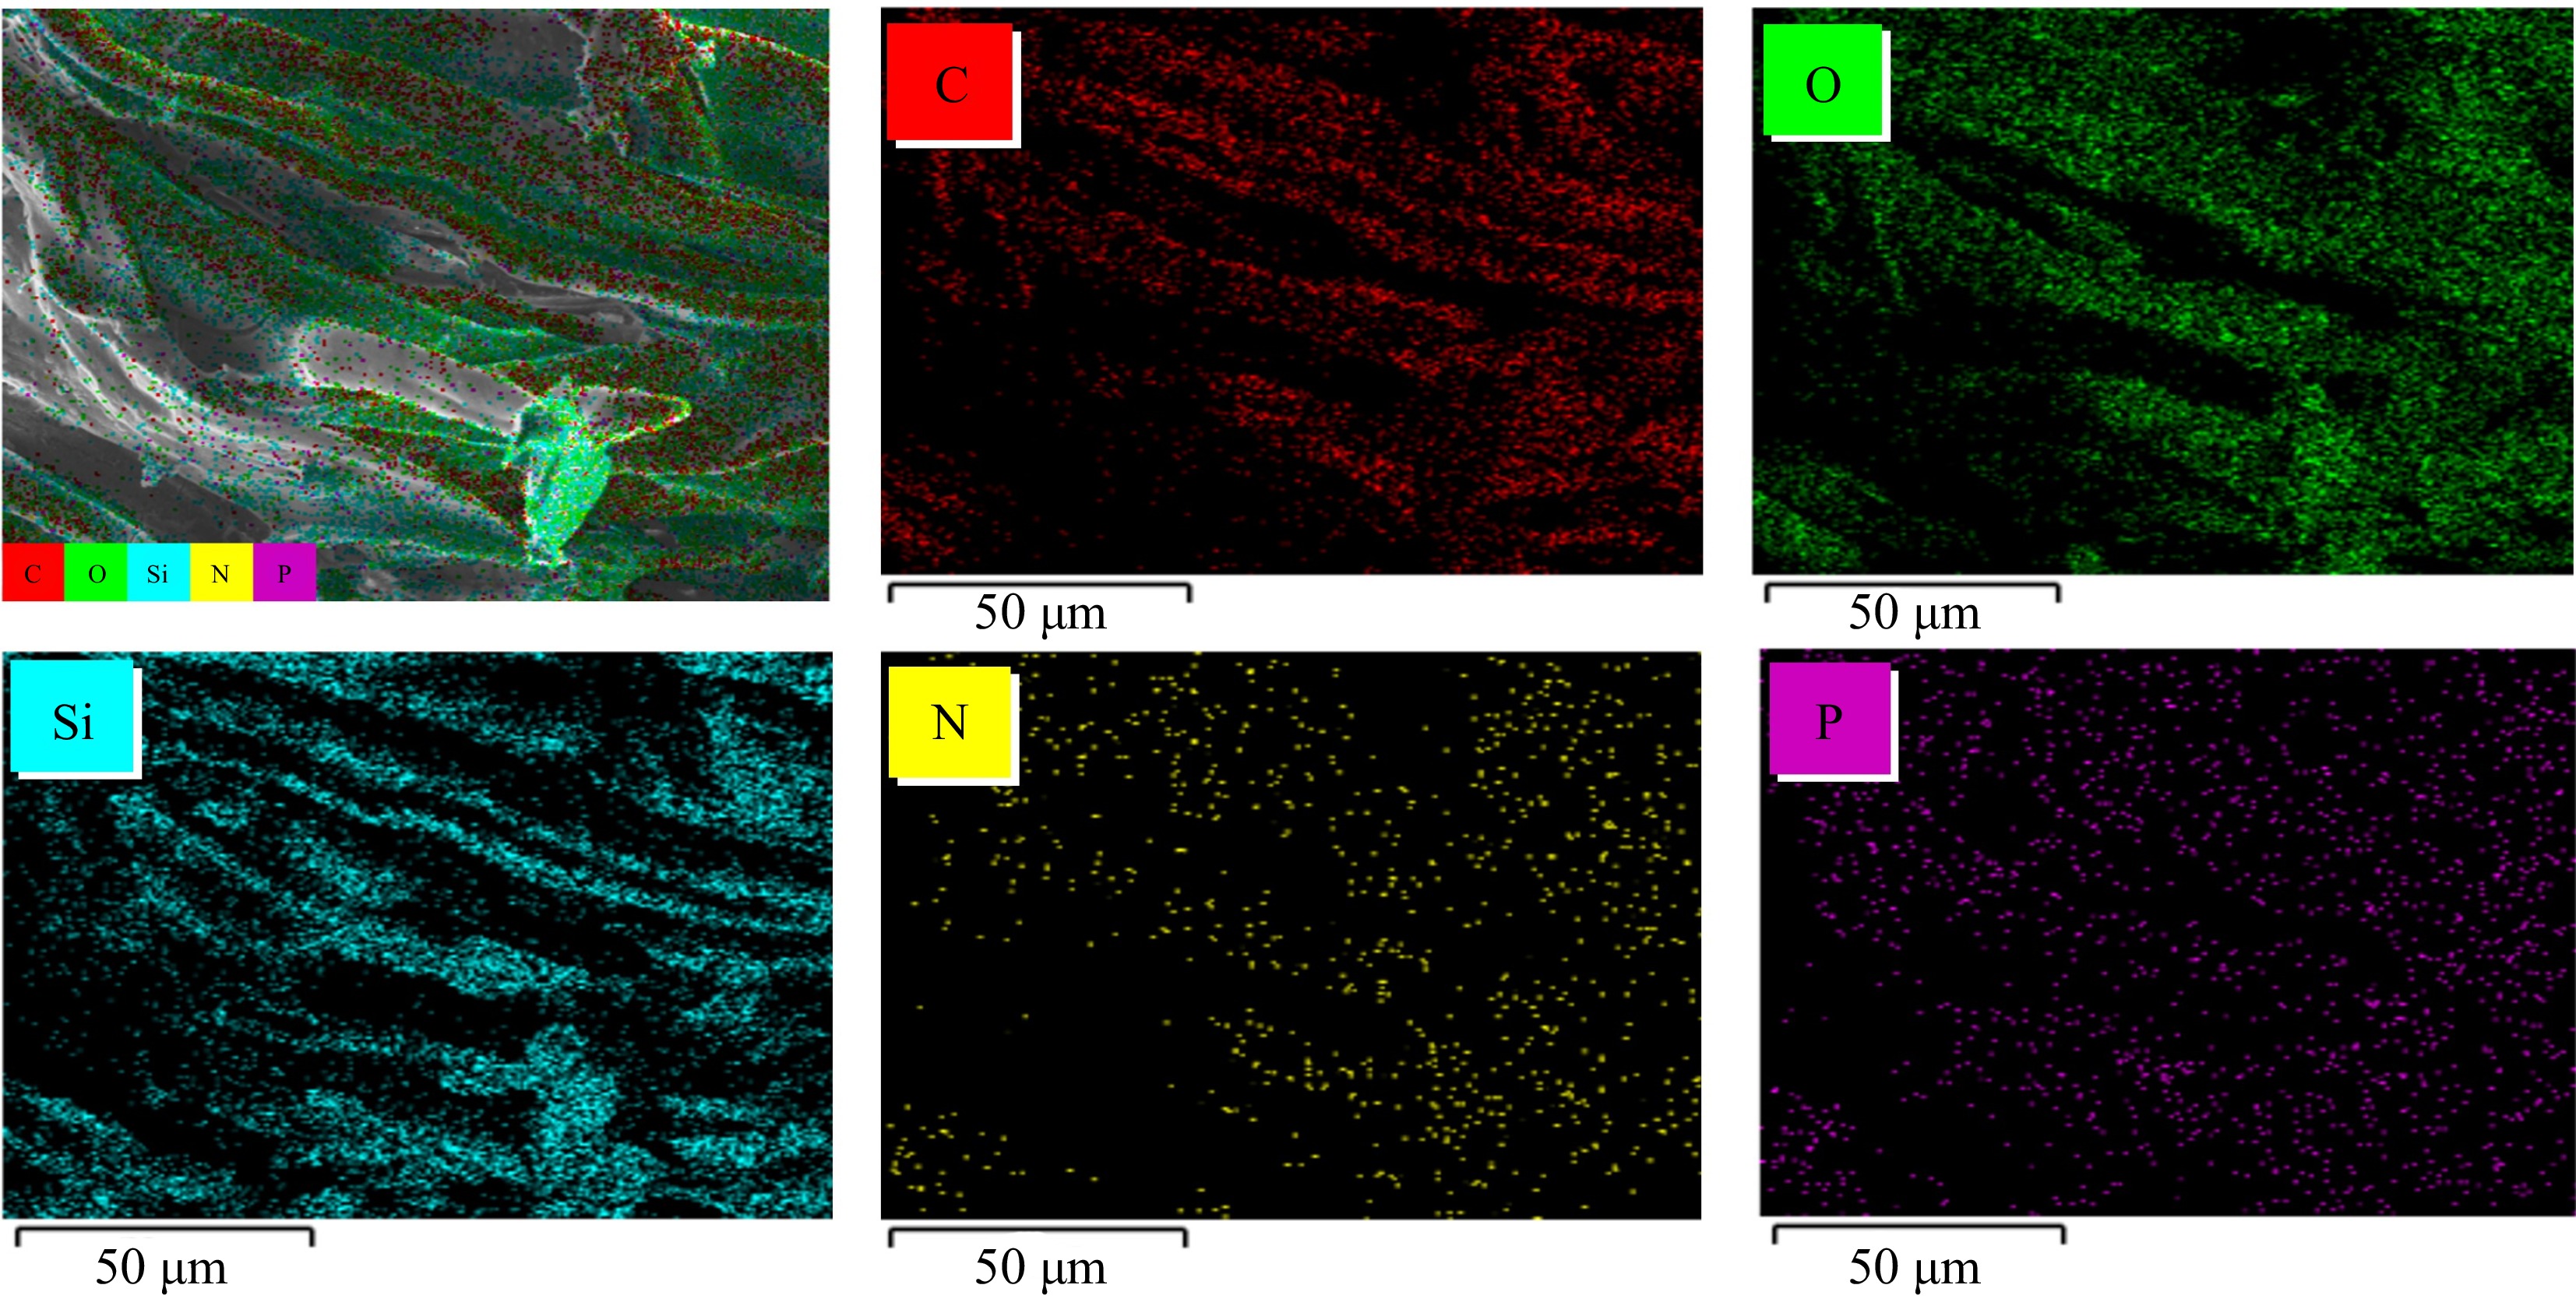
Figure 5.
Elements distribution images of AMP-SiO2-KH570@COT (depicting the mapping of carbon (C), oxygen (O), silicon (Si), nitrogen (N), and phosphorus (P) elements).
-
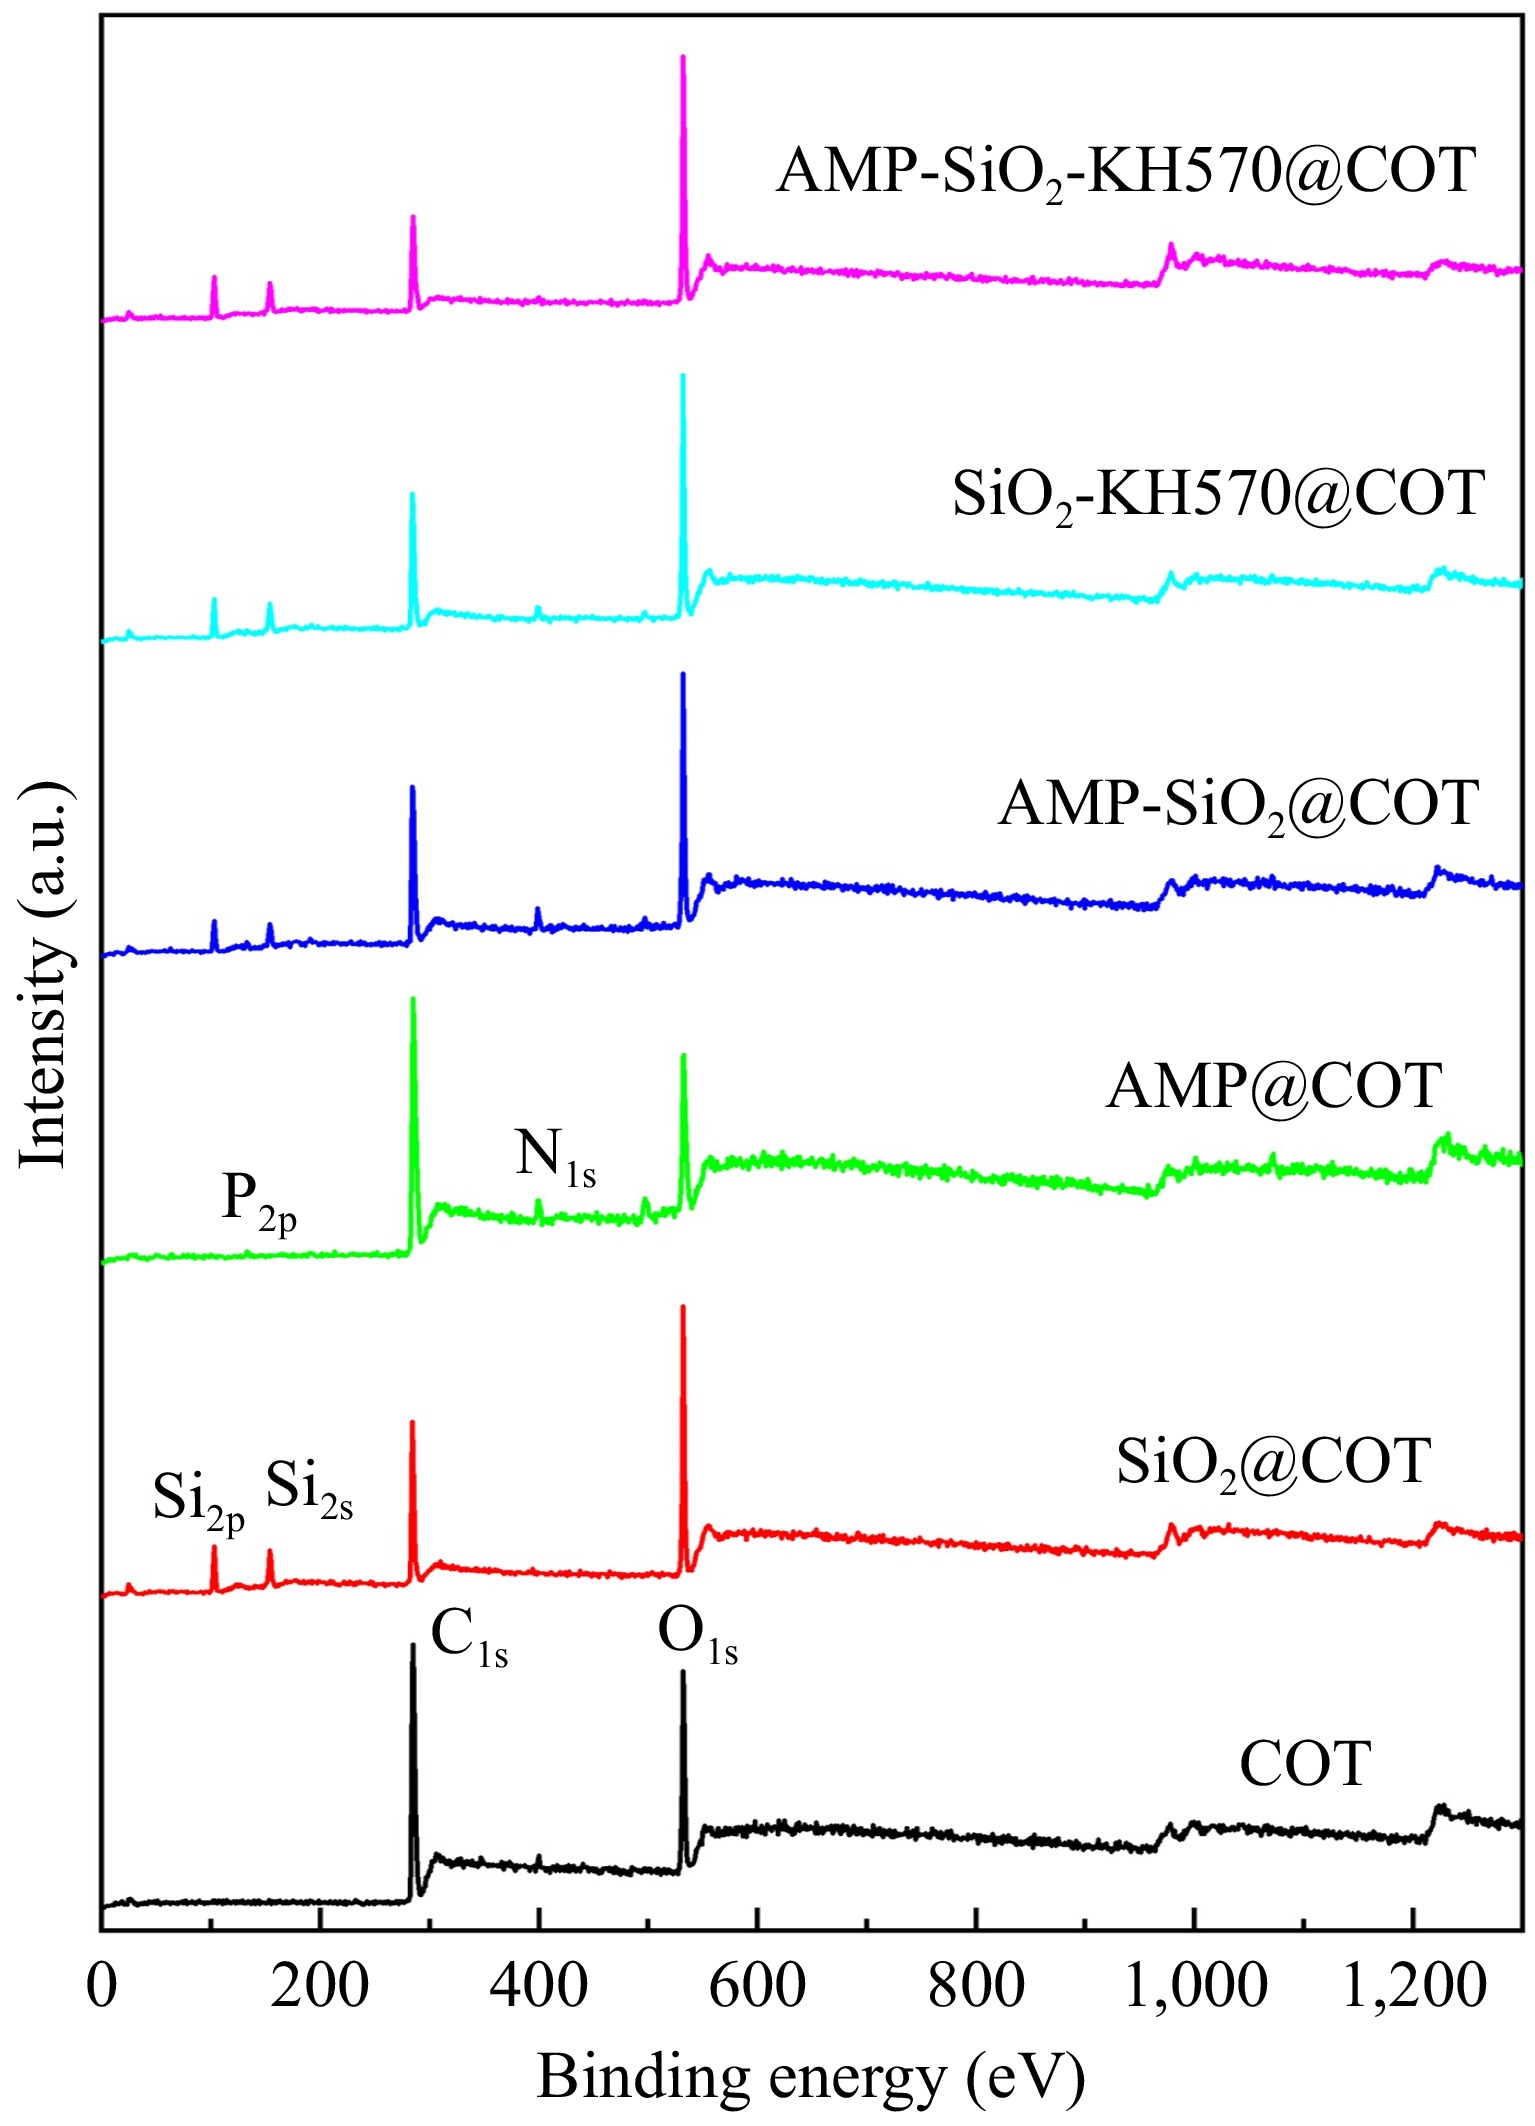
Figure 6.
XPS spectra of raw and treated cotton fabrics.
-
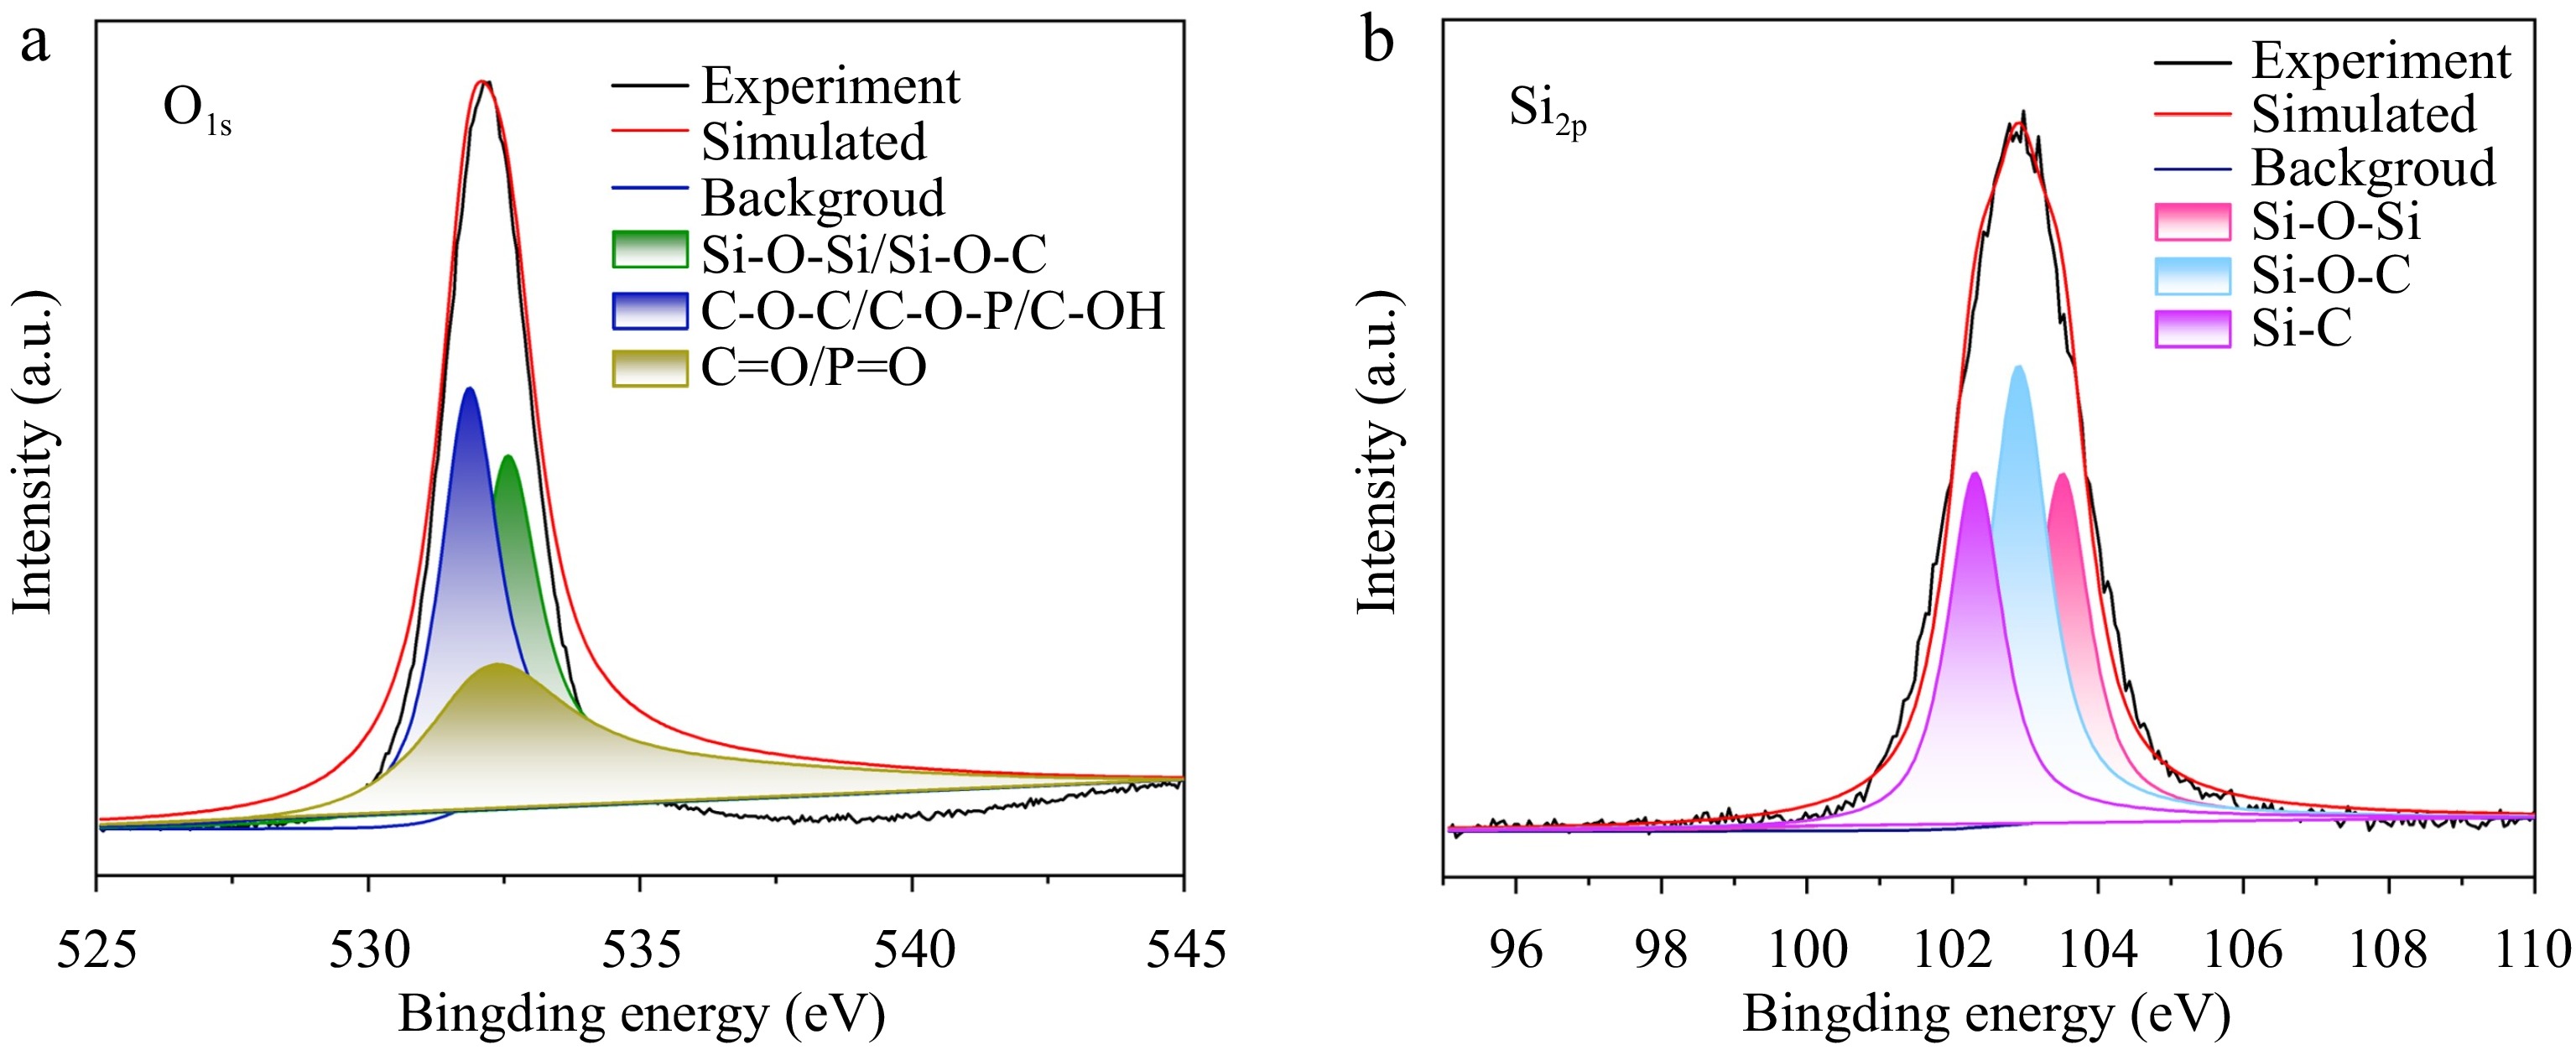
Figure 7.
High resolution XPS spectra for (a) O1s, and (b) Si2p of AMP-SiO2-KH570@COT.
-
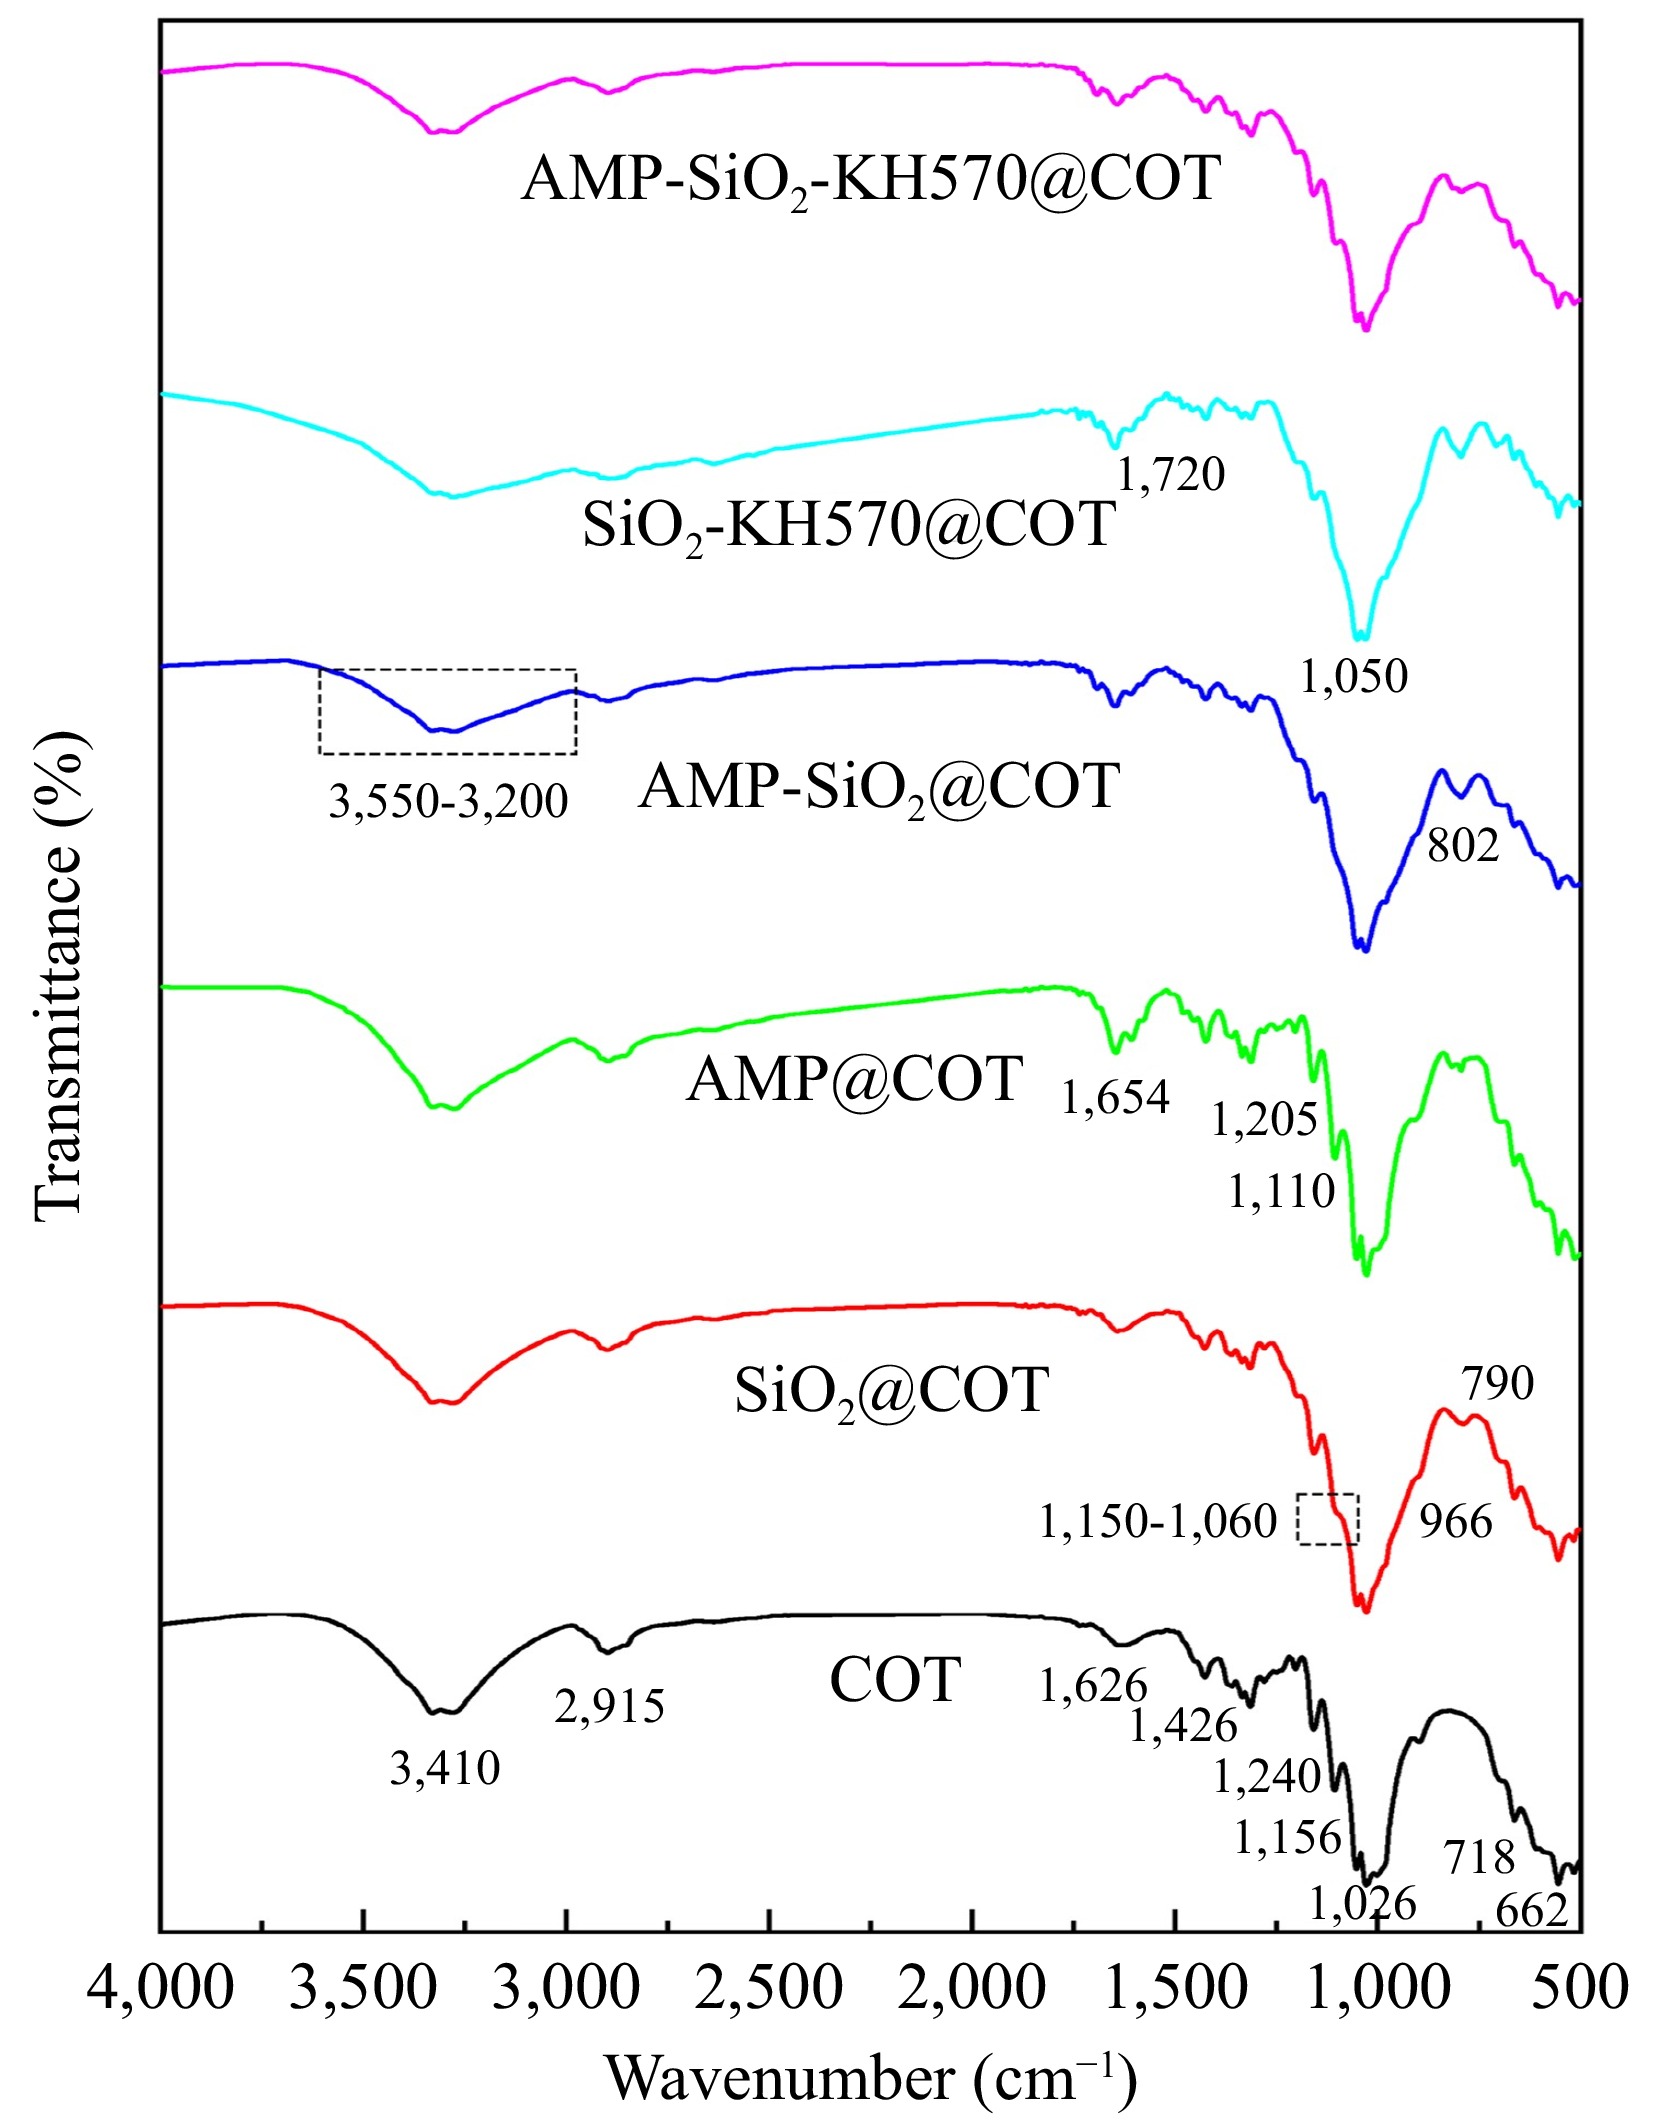
Figure 8.
FTIR spectra of raw and treated cotton fabrics.
-
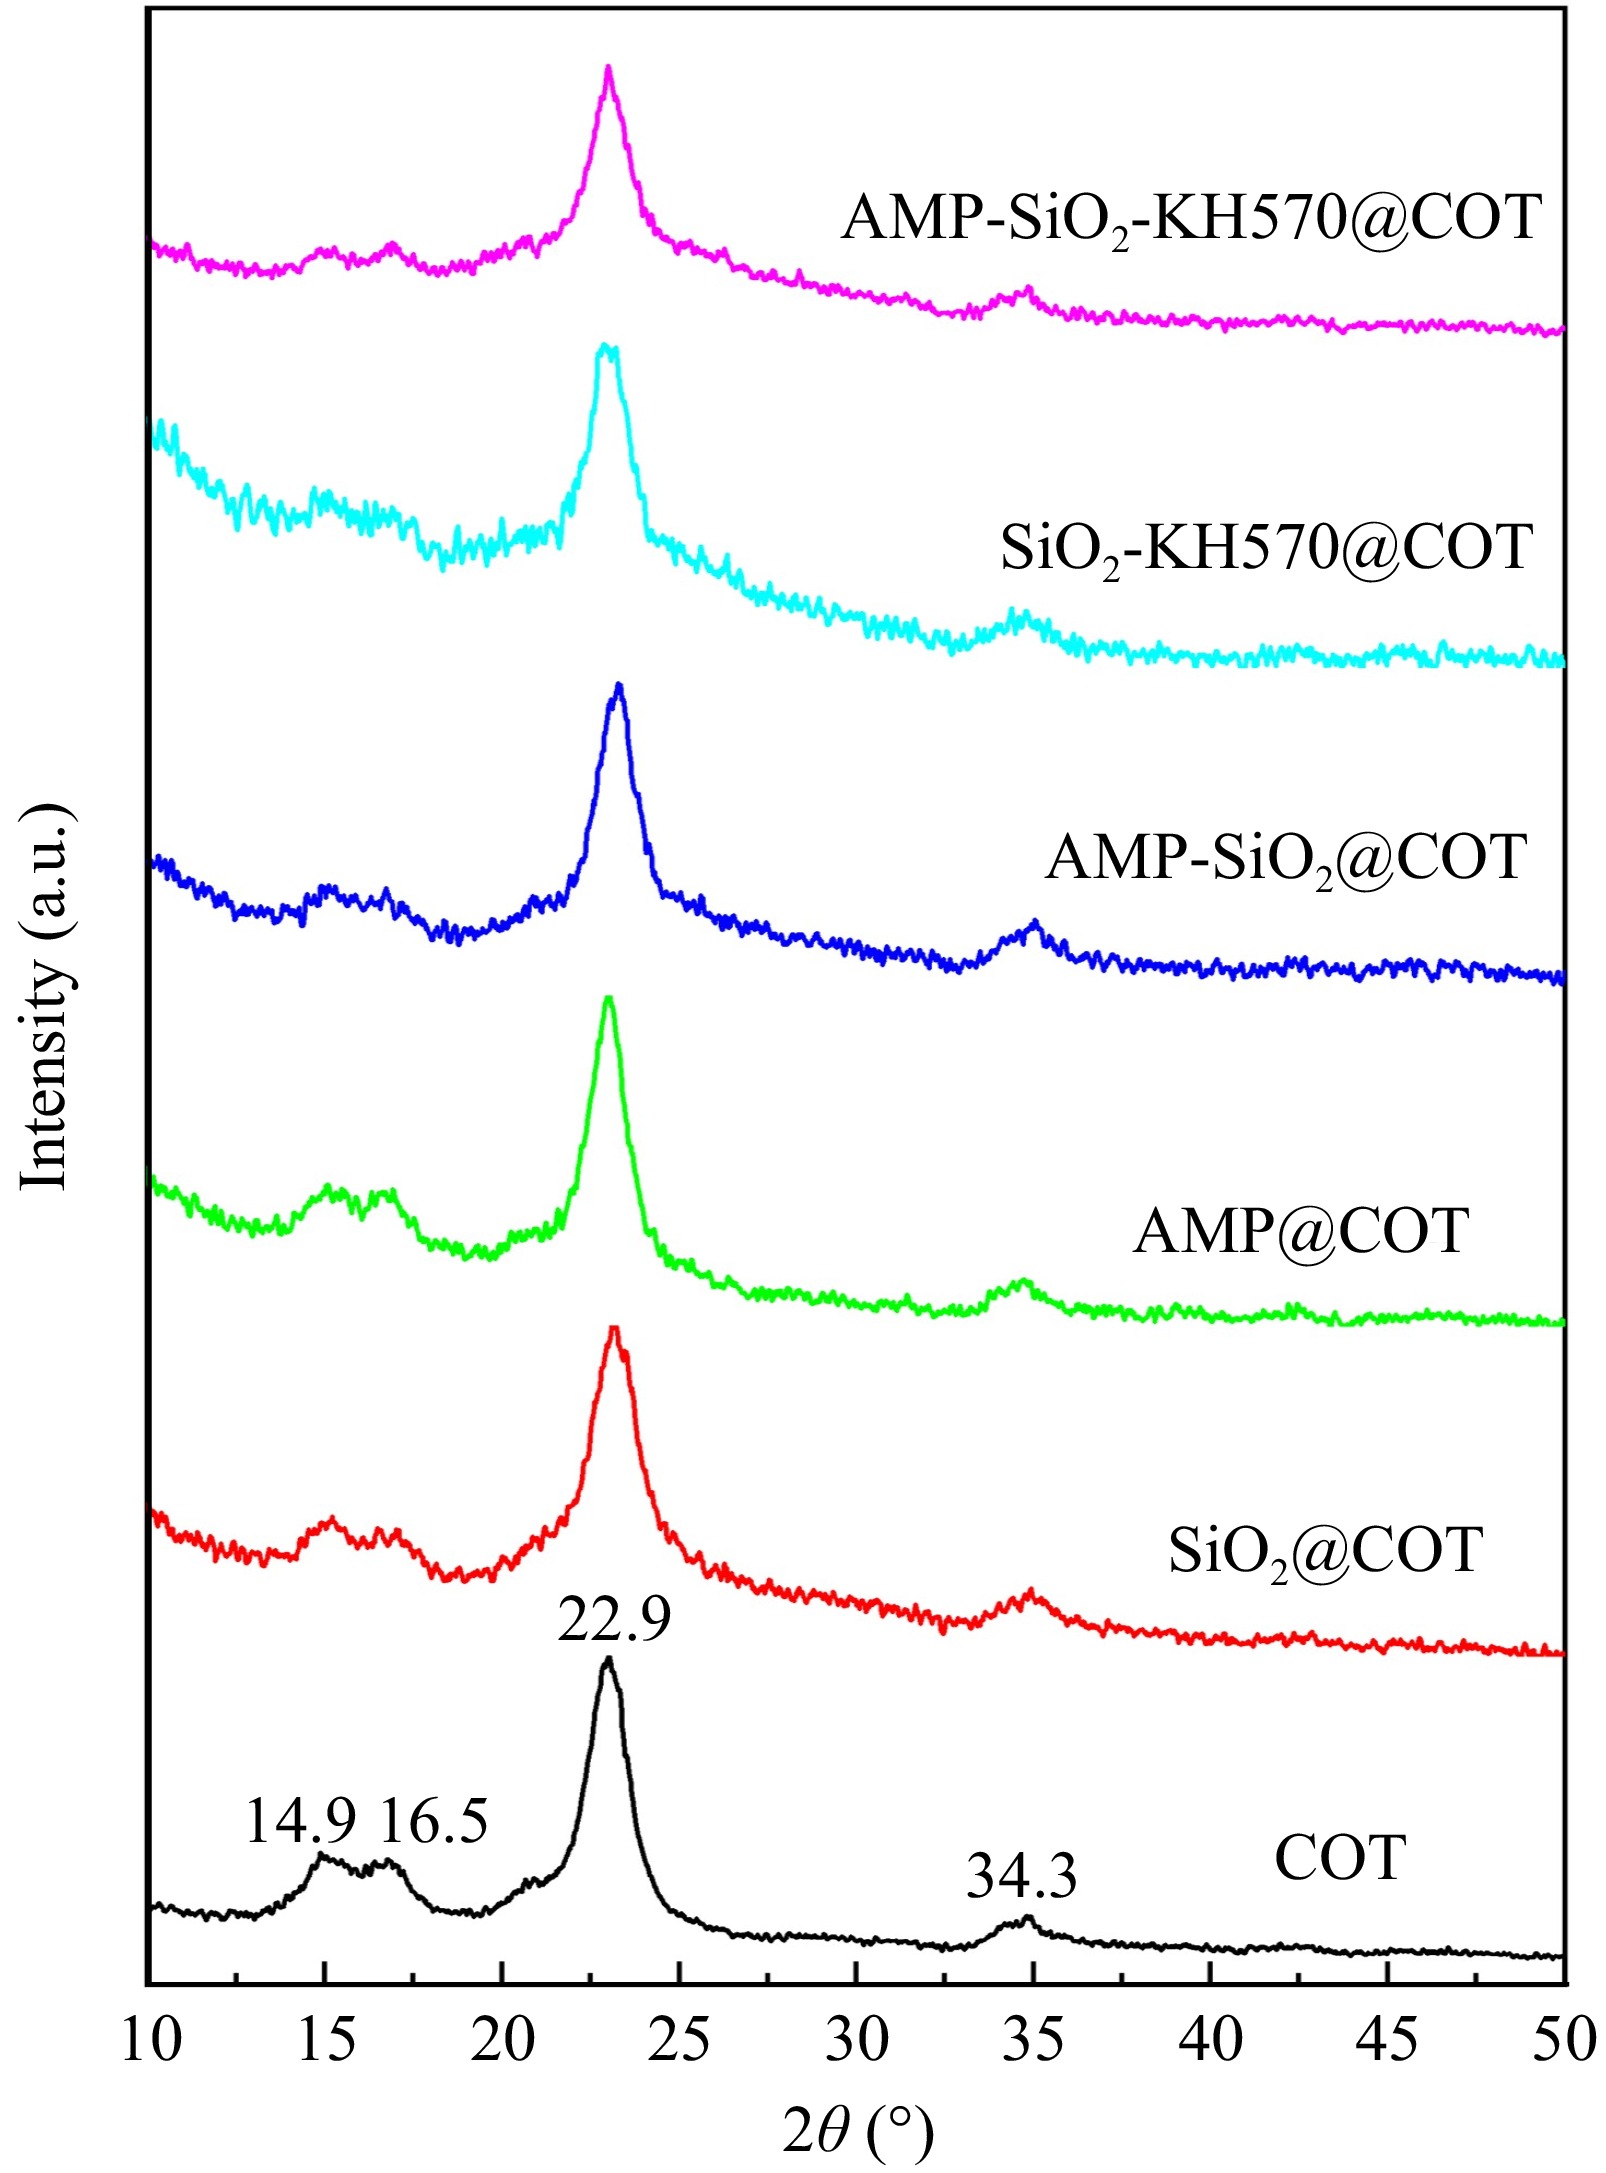
Figure 9.
XRD patterns of raw and treated cotton fabrics.
-
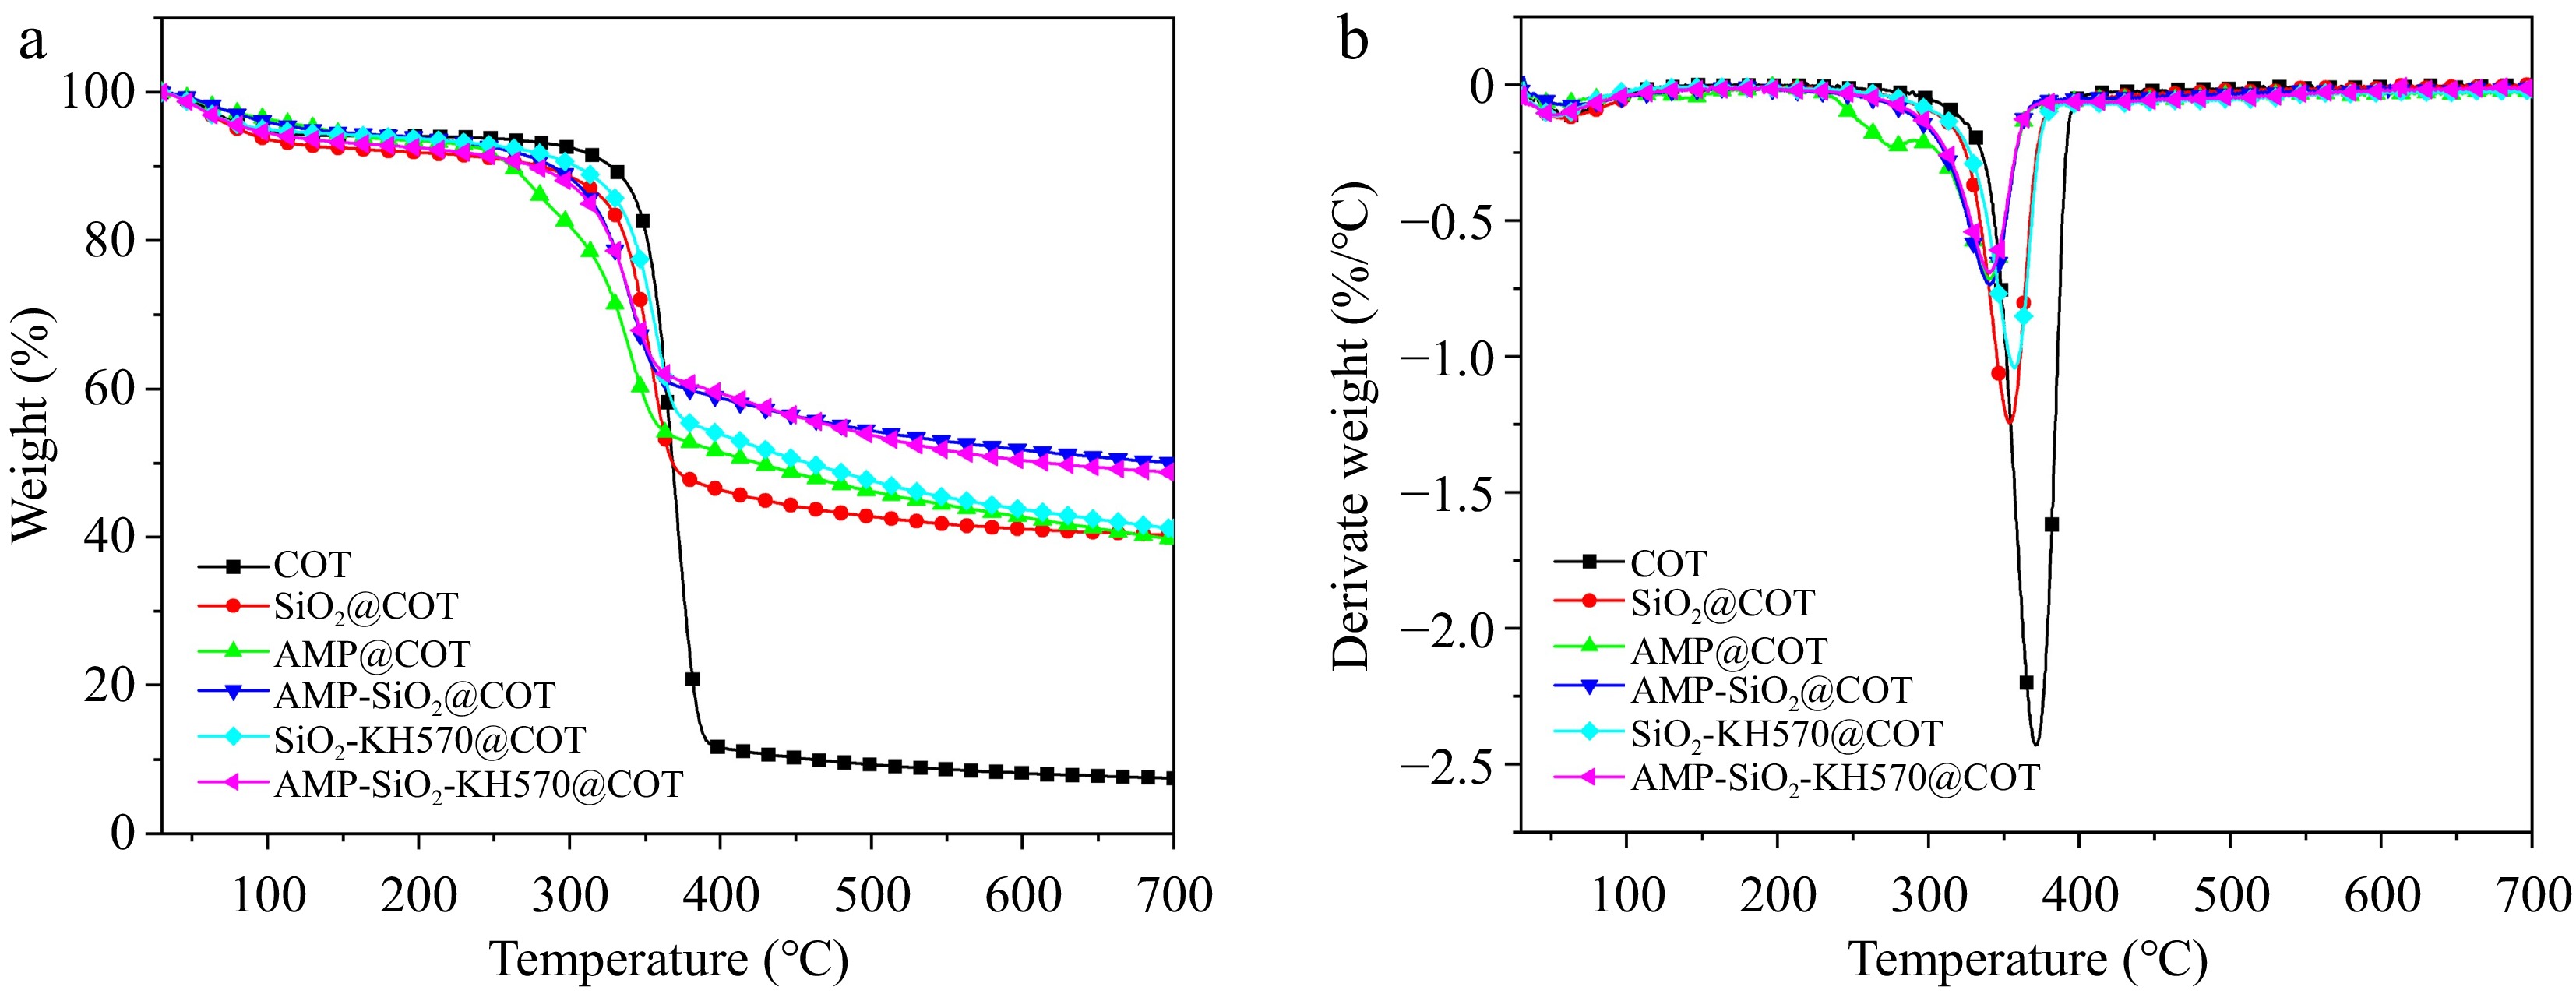
Figure 10.
(a) TG, and (b) DTG curves of raw and treated cotton fabrics (10 K/min, N2).
-
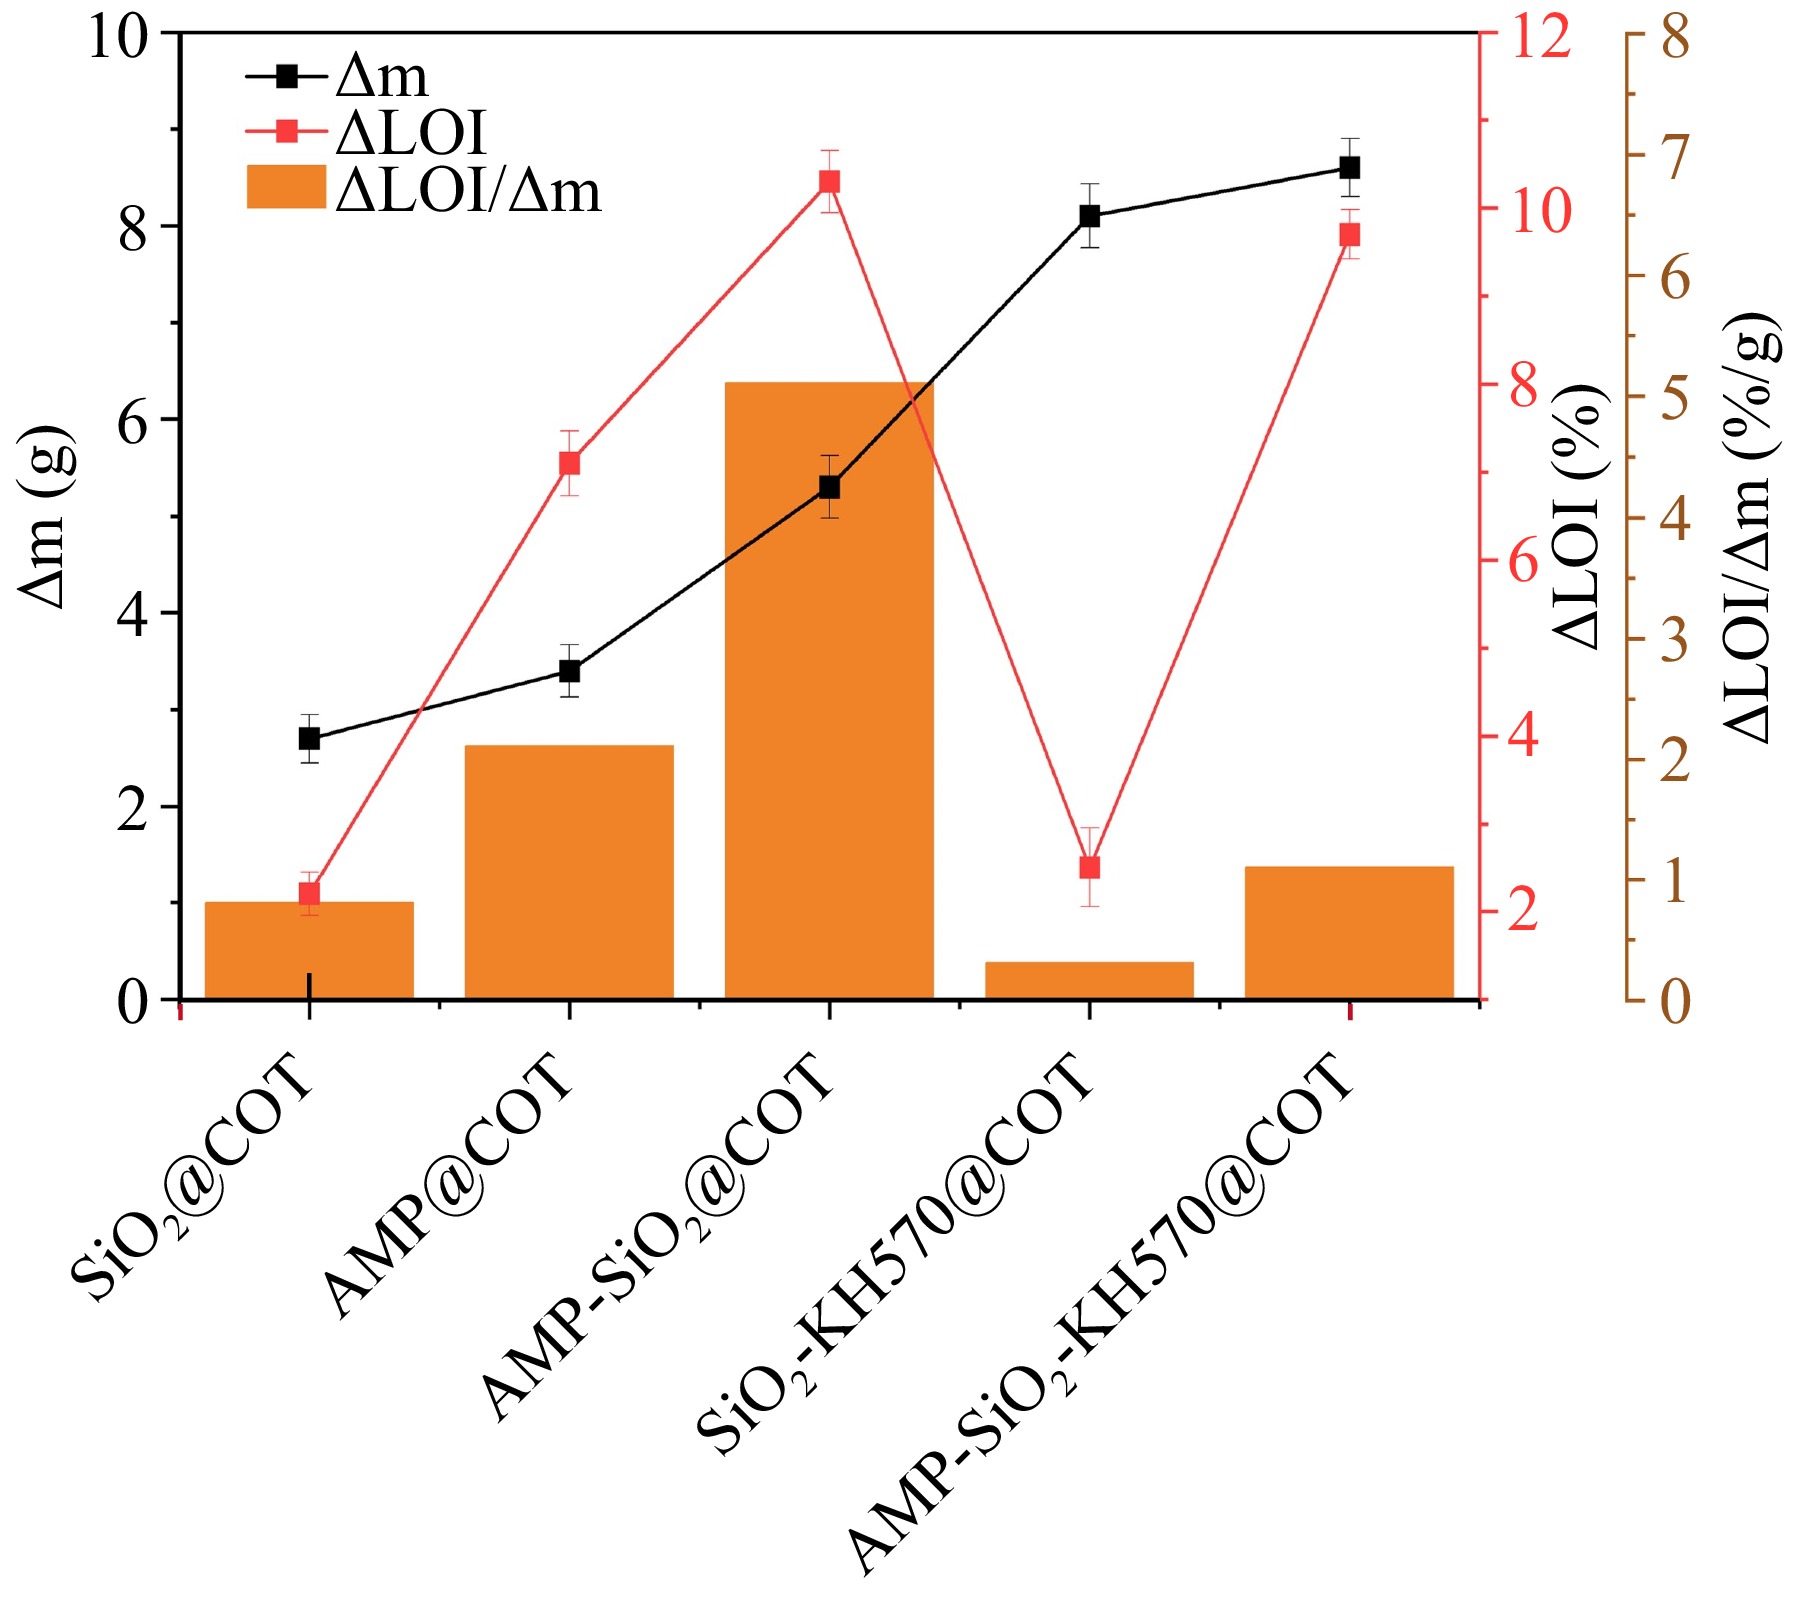
Figure 11.
Δm, ΔLOI, and the ratio ΔLOI/Δm of raw and treated cotton fabrics.
-
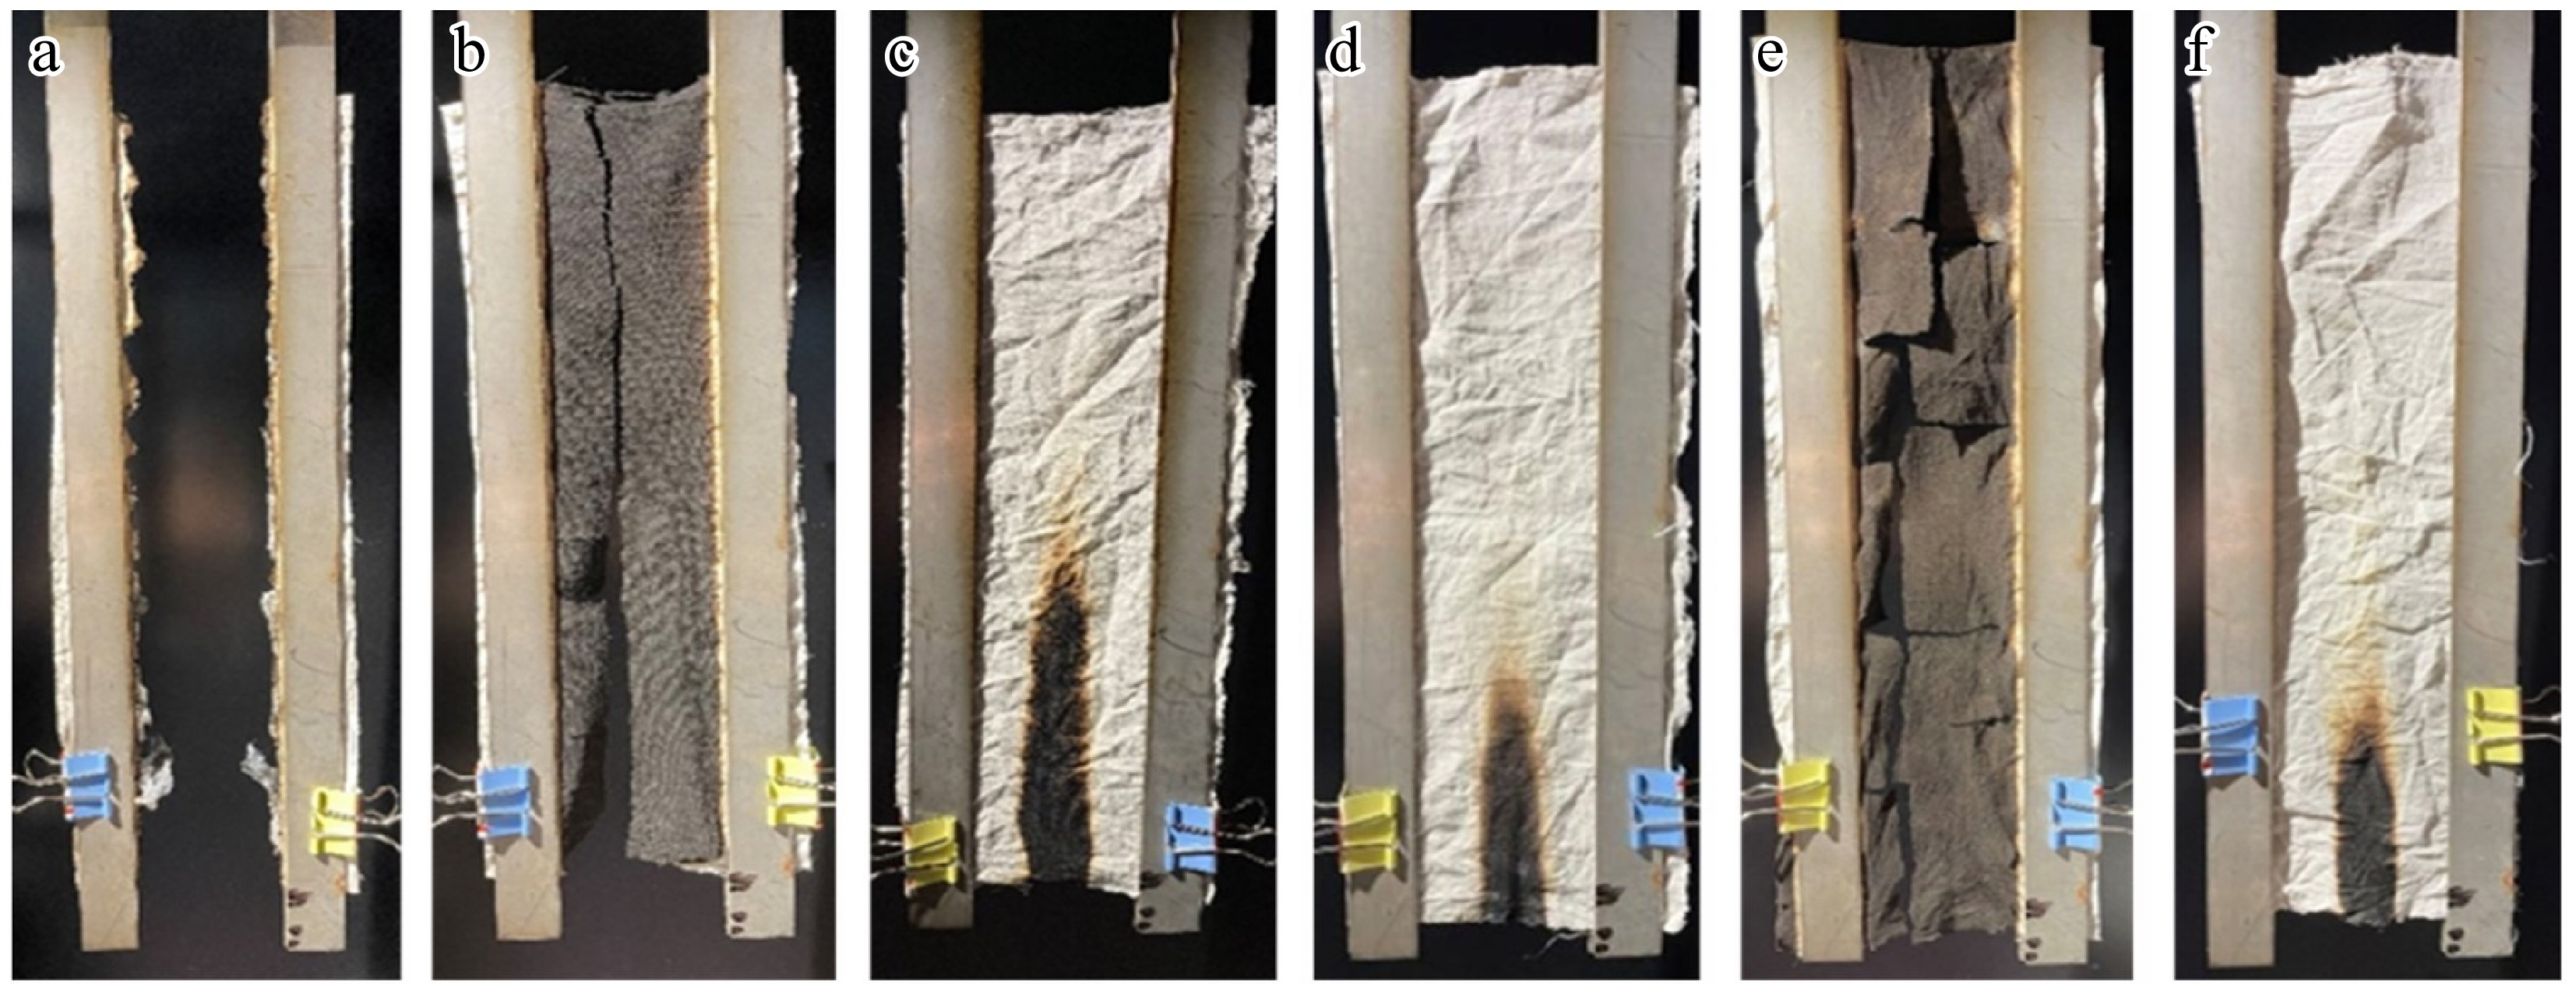
Figure 12.
VFT results of (a) COT, (b) SiO2@COT, (c) AMP@COT, (d) AMP-SiO2@COT, (e) SiO2-KH570@COT, (f) AMP-SiO2-KH570@COT.
-
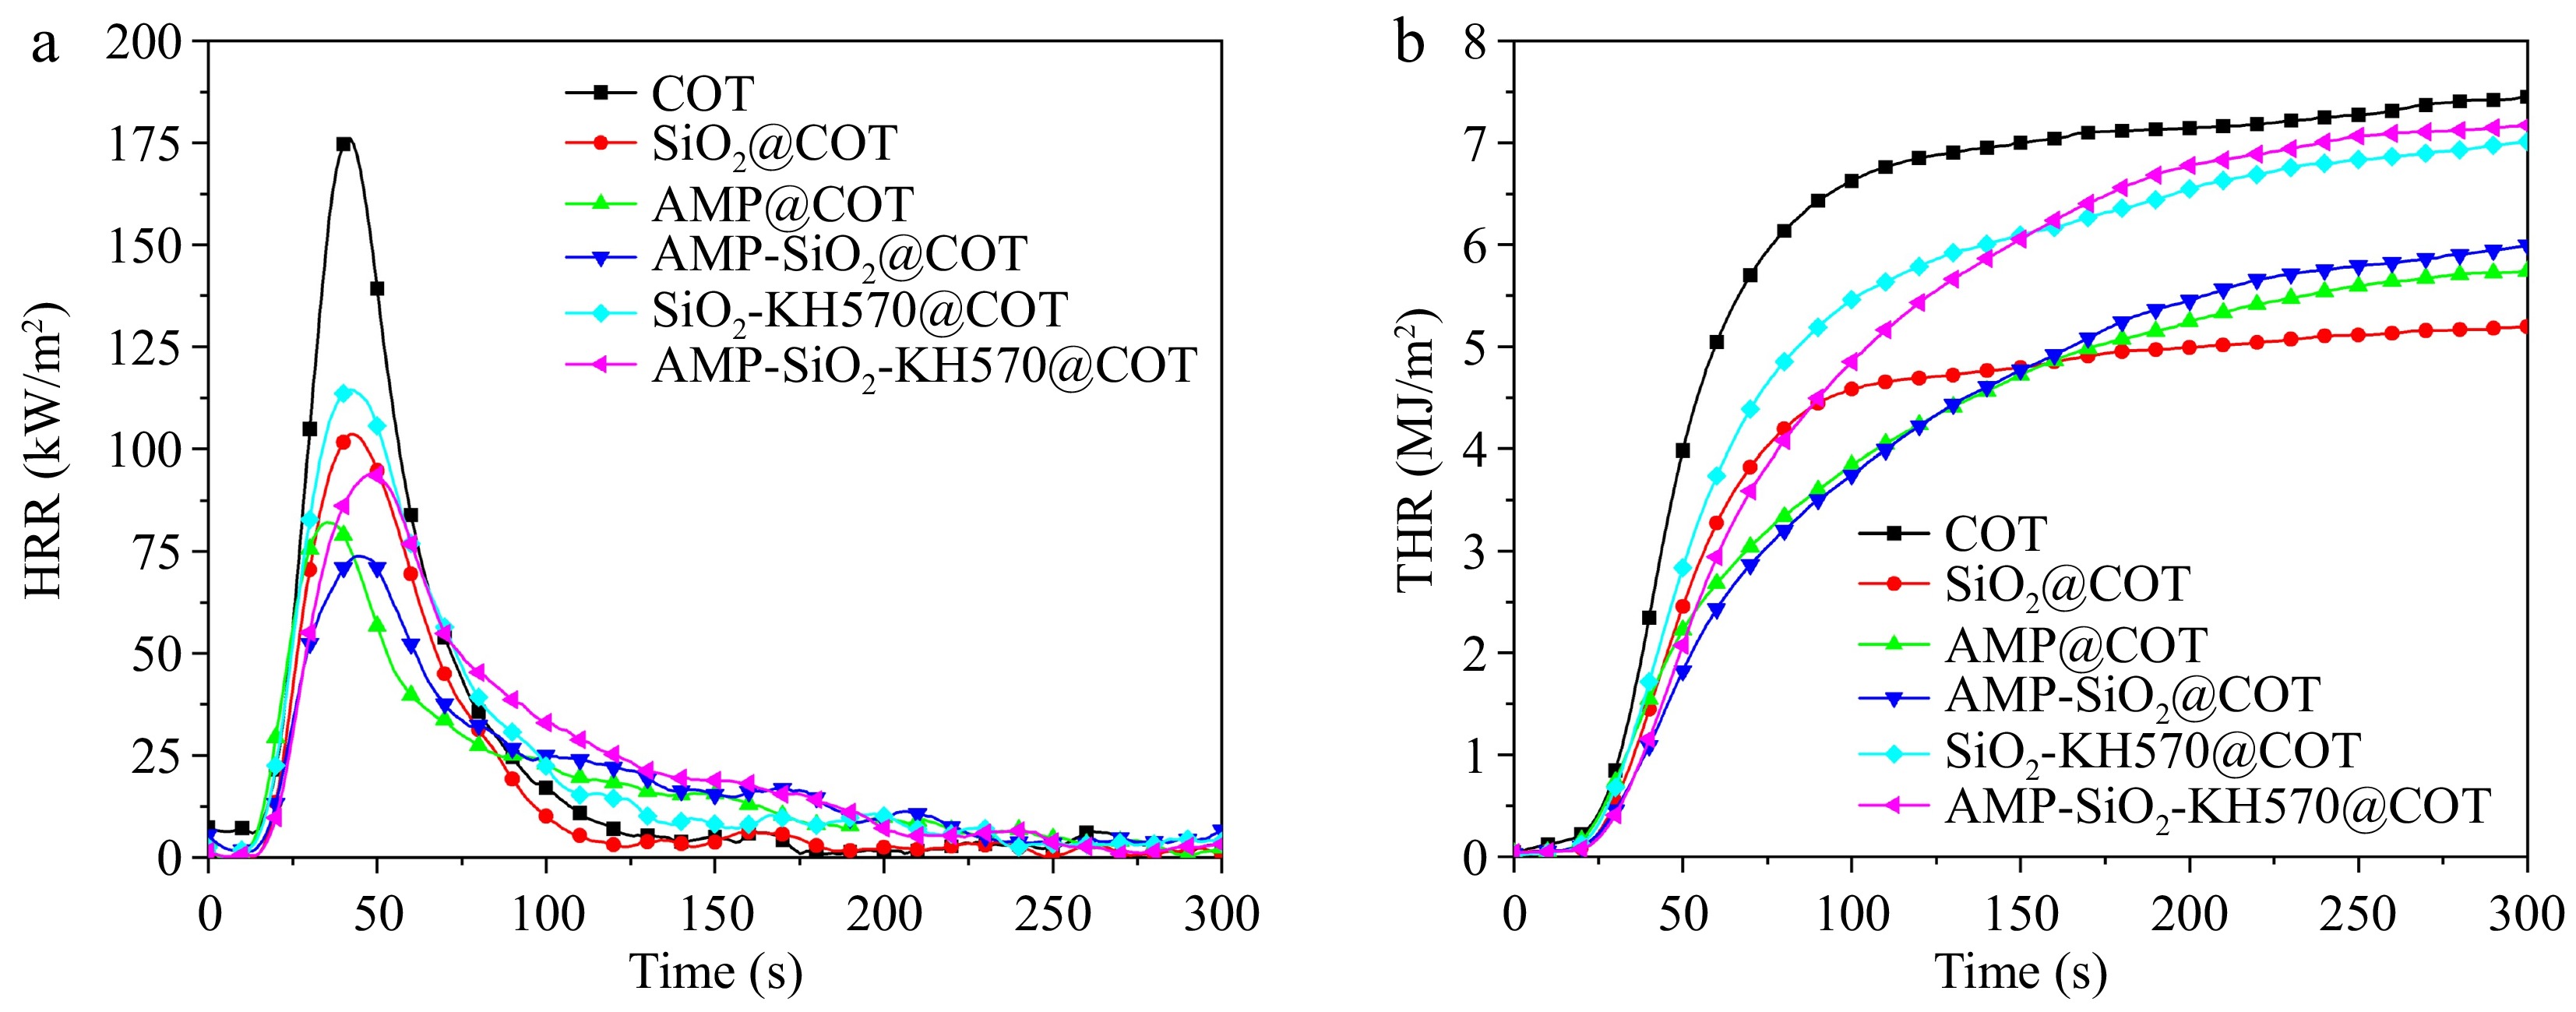
Figure 13.
Relationship between (a) HRR, (b) THR, and time for raw and treated cotton fabrics.
-
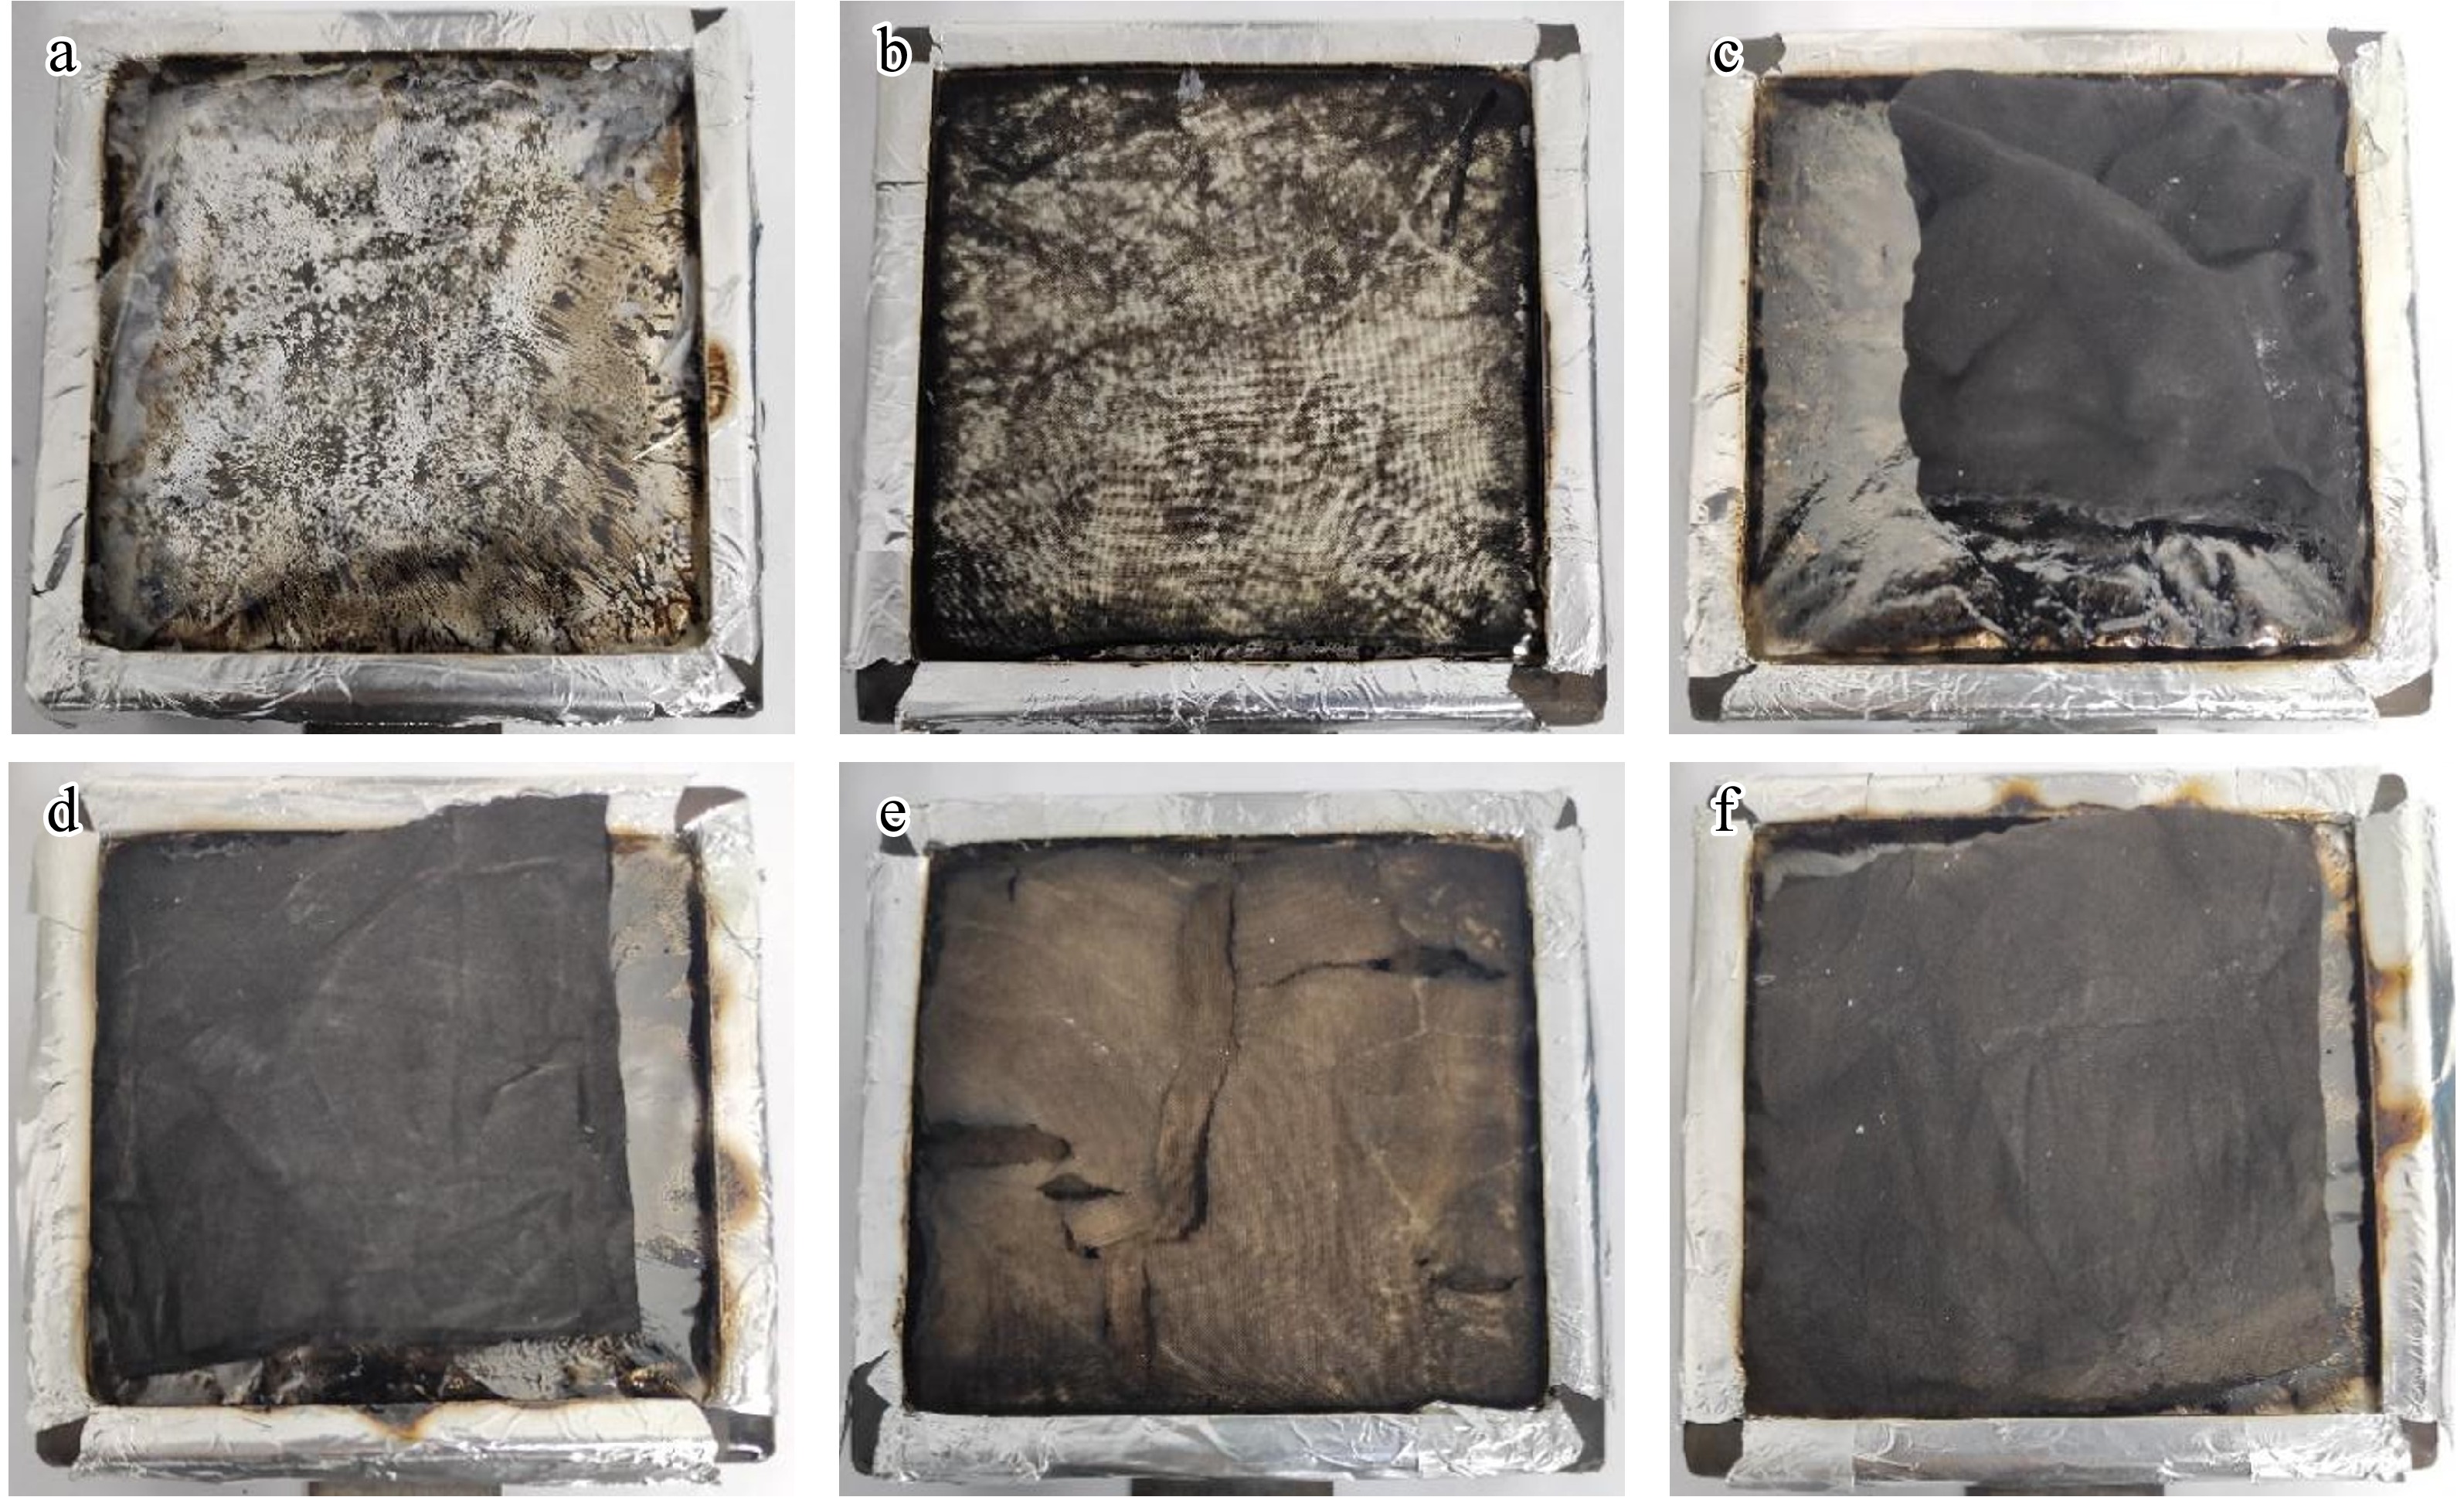
Figure 14.
CCT photos of raw and treated cotton fabrics. (a) COT, (b) SiO2@COT, (c) AMP@COT, (d) AMP-SiO2@COT, (e) SiO2-KH570@COT, (f) AMP-SiO2-KH570@COT.
-
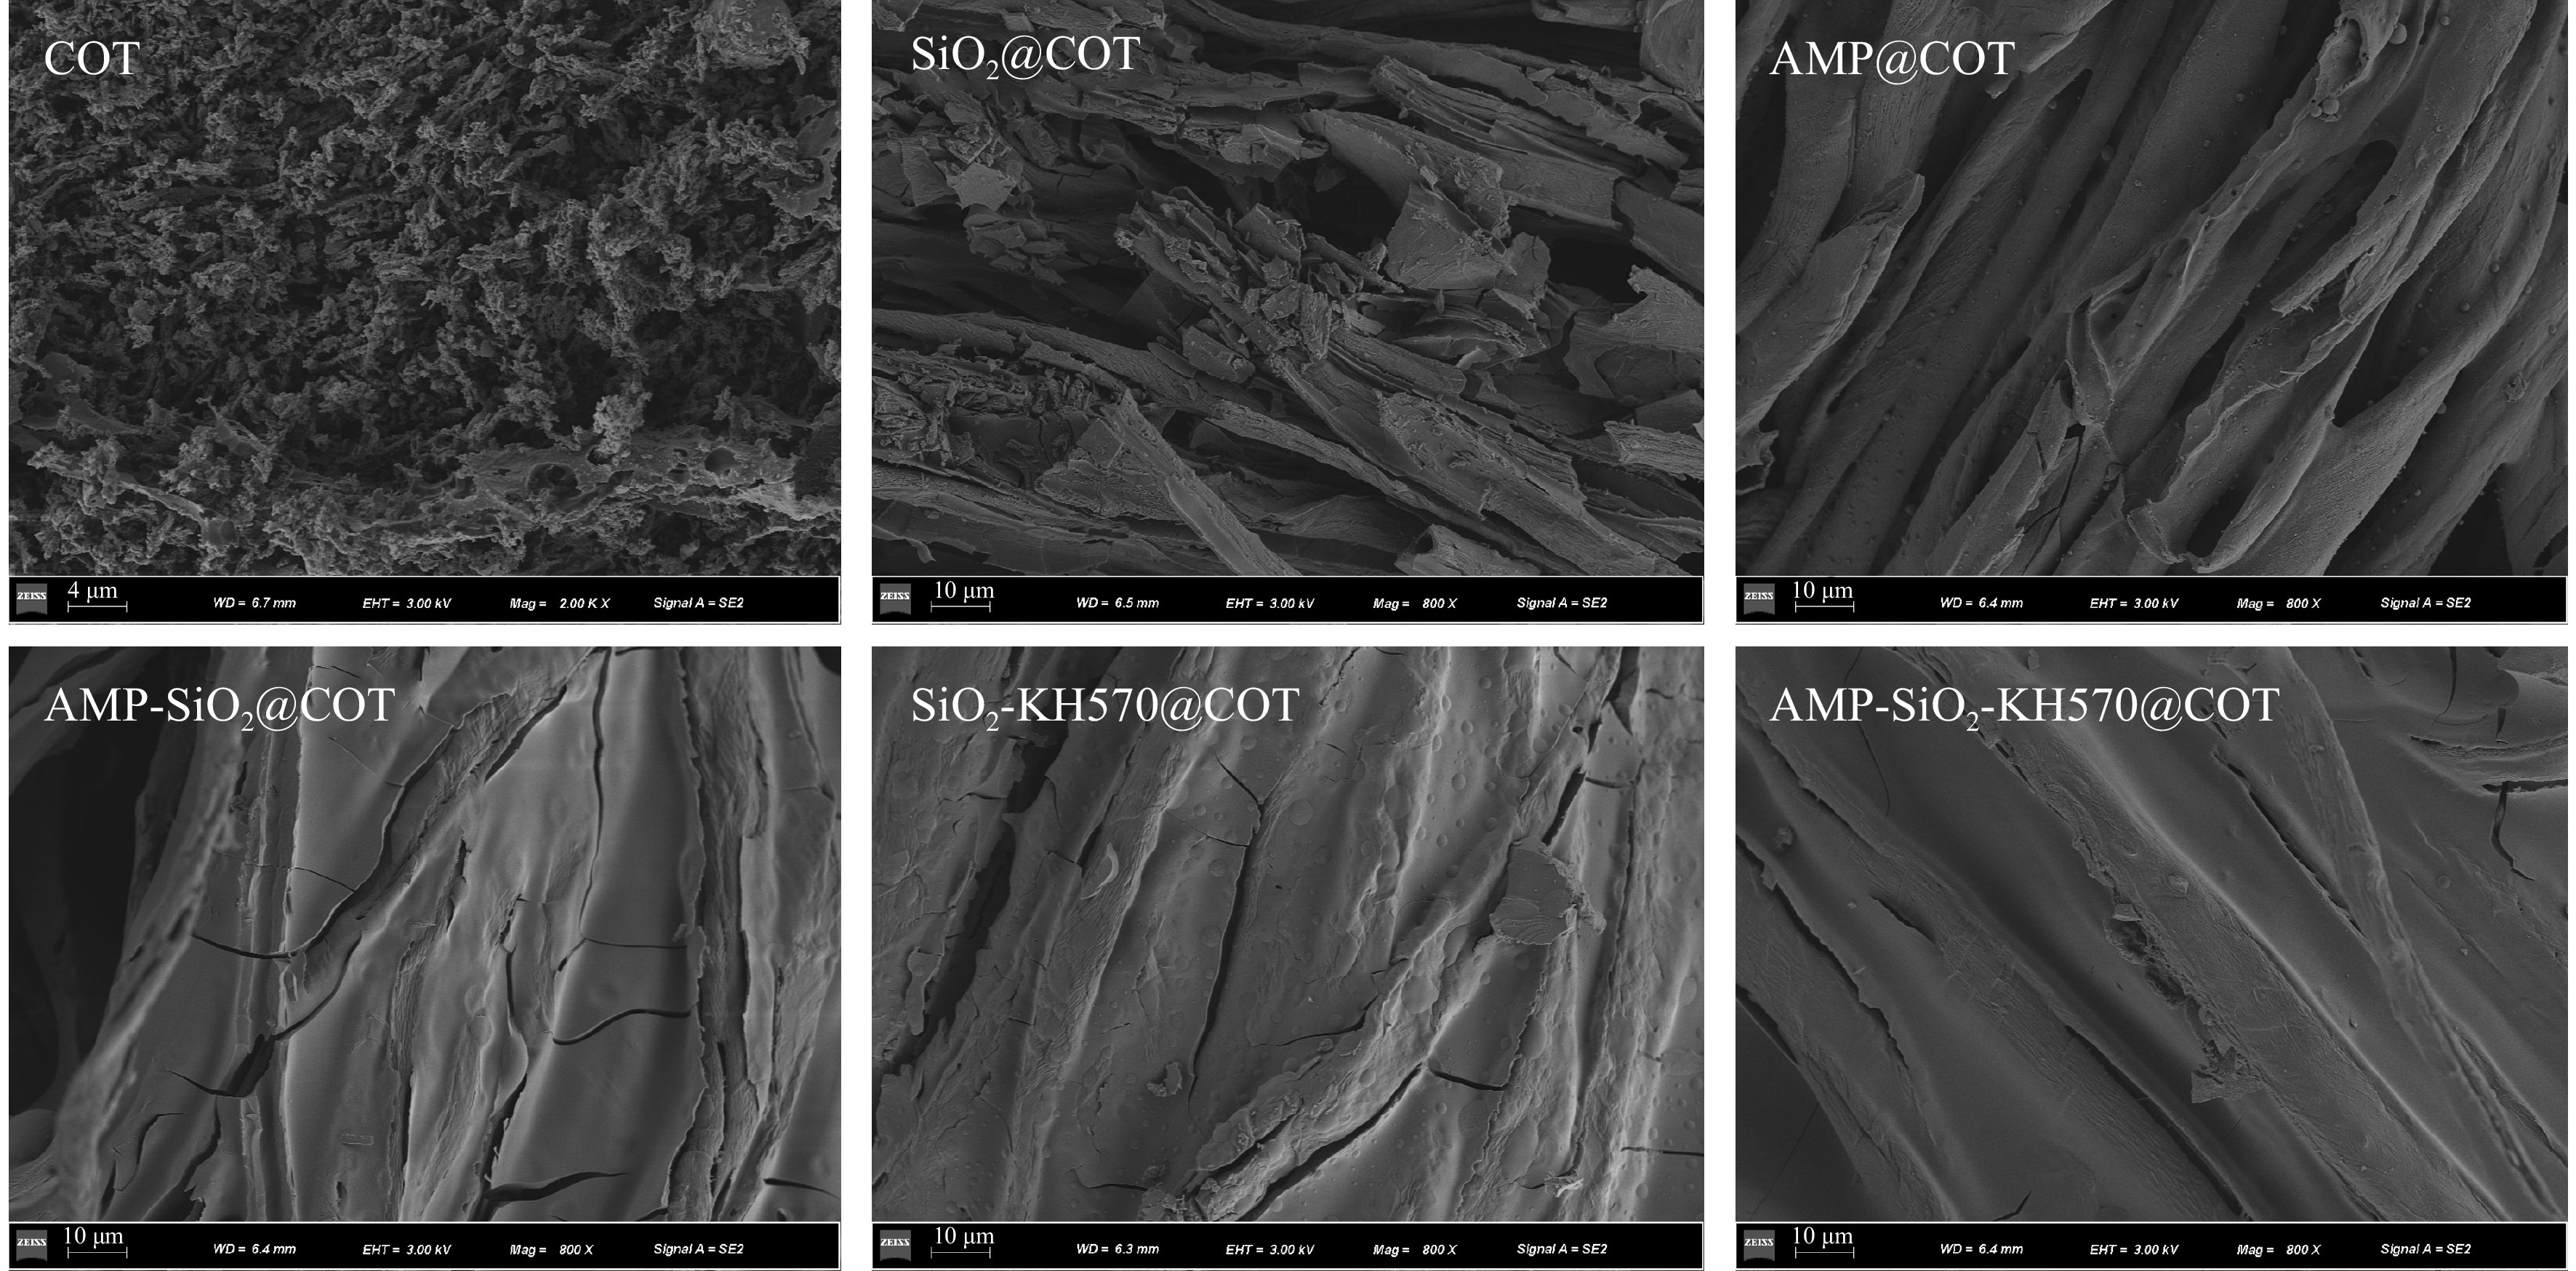
Figure 15.
SEM images of char residues after VFT.
-
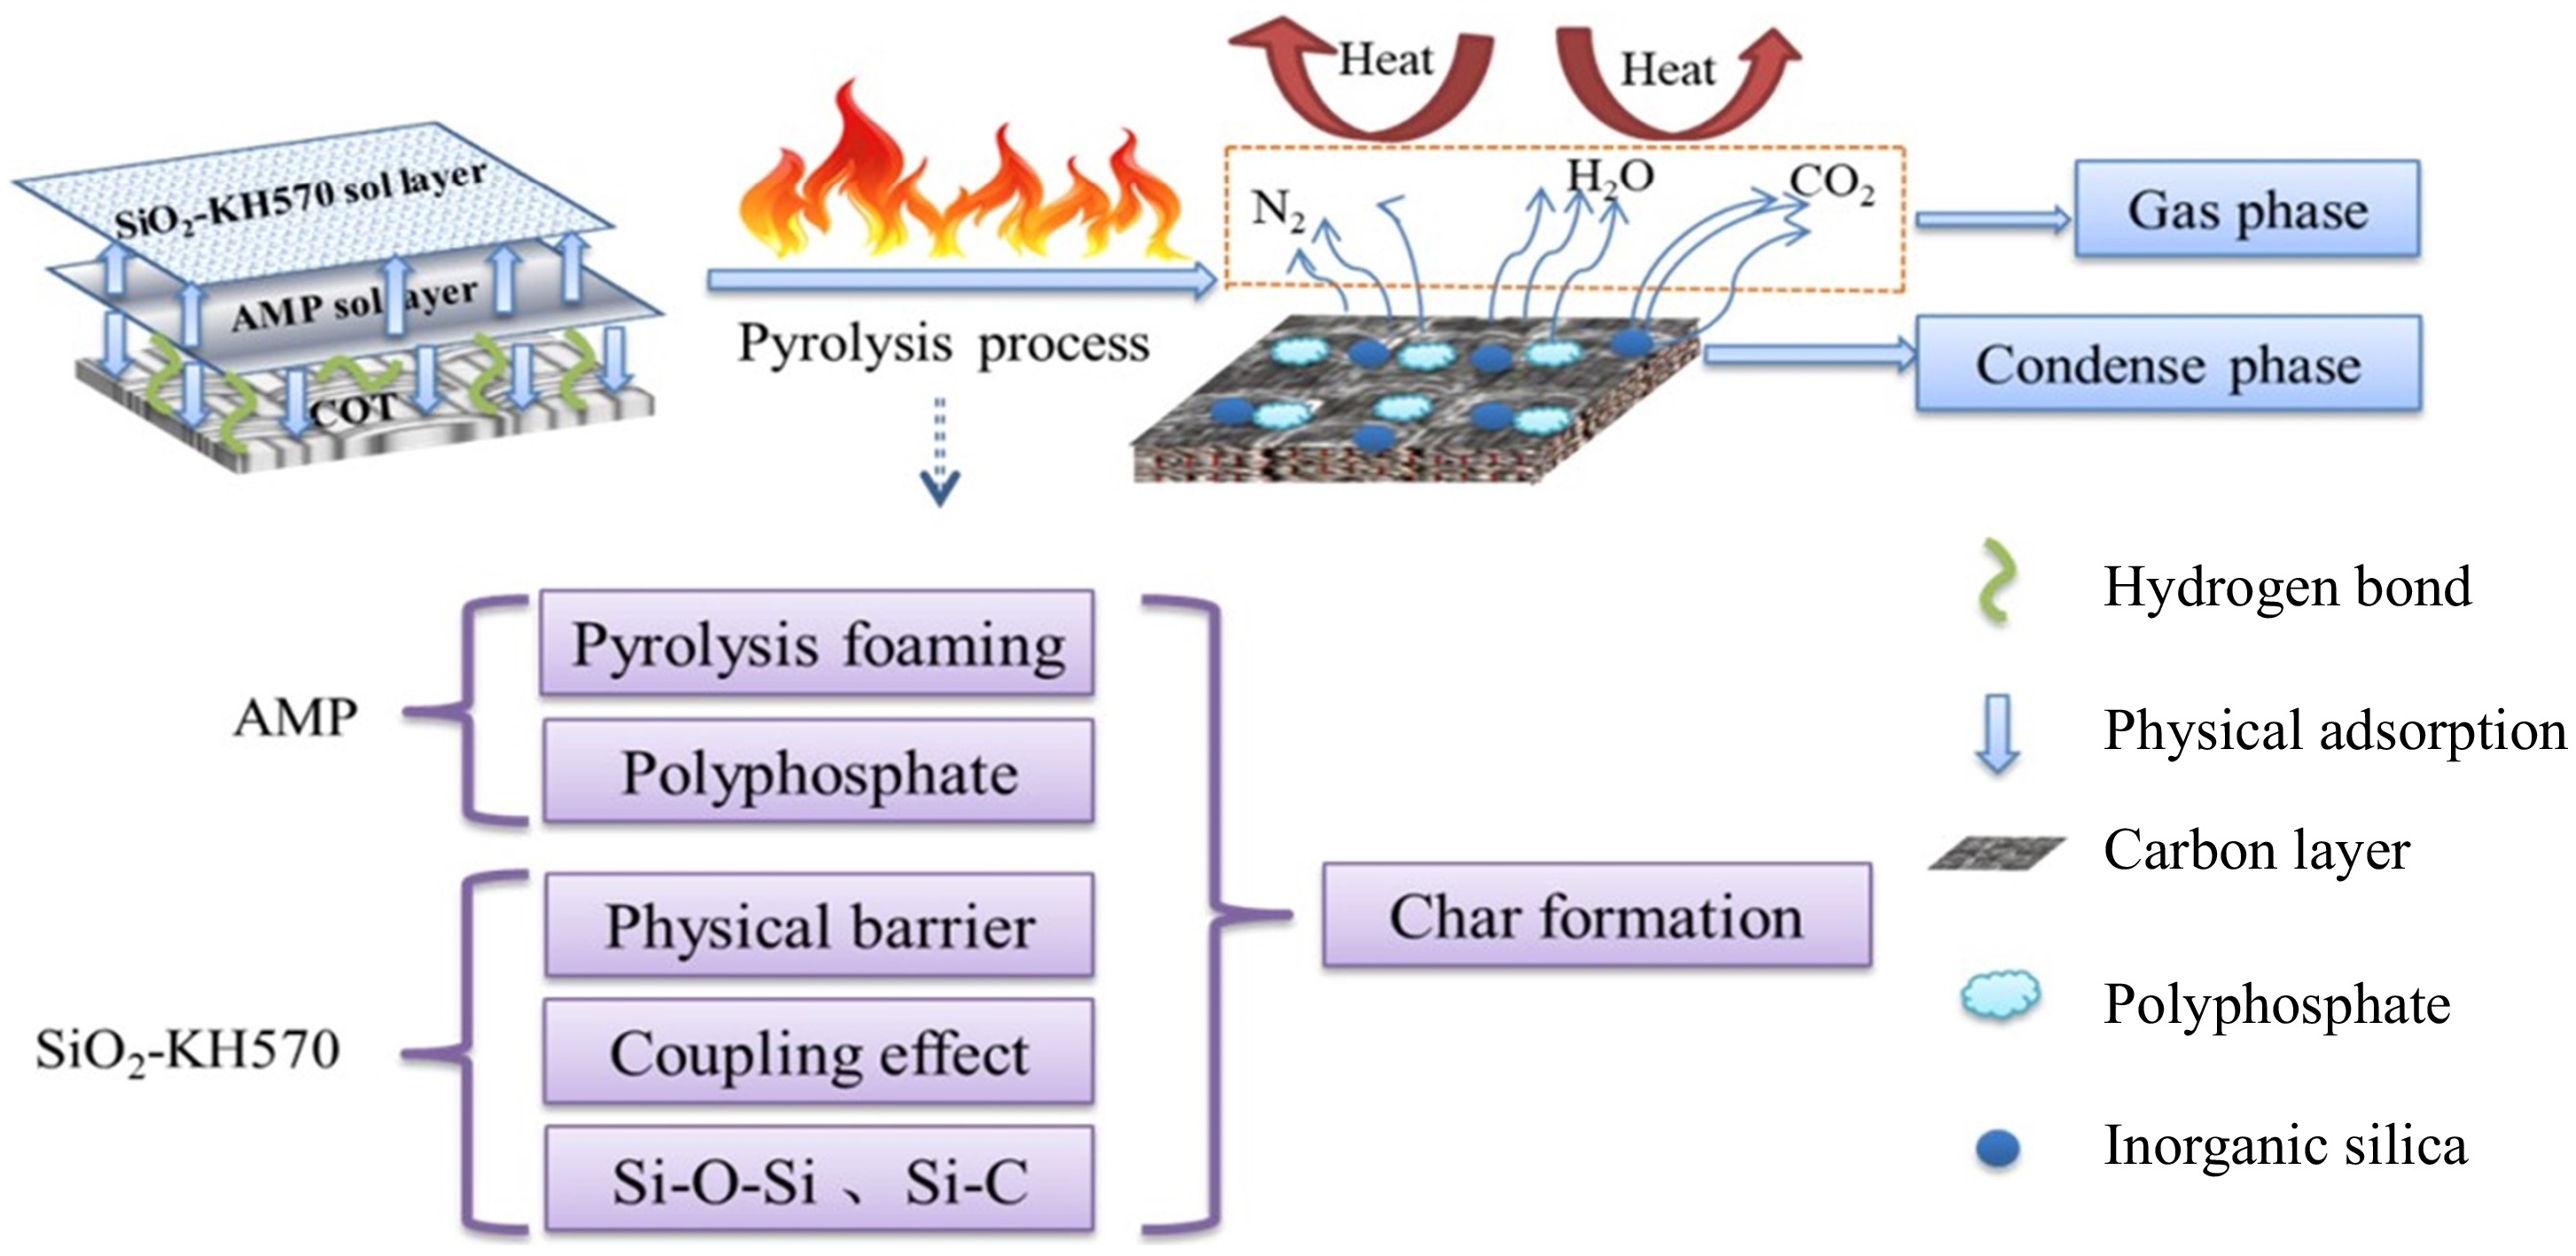
Figure 16.
The flame retardancy mechanism of AMP-SiO2-KH570@COT.
-
Substance TEOS KH570 AMP Structure 


Table 1.
The molecular structures: TEOS, KH570, and AMP.
-
Sample WGR
(%)T10%
(°C)Tmax
(°C)Rmax
(%/°C)Char residue rate (%) COT − 327.5 371.2 2.4 7.5 SiO2@COT 28.3 284.3 353.3 1.3 40.3 AMP@COT 35.0 262.1 339.6 0.7 39.7 AMP-SiO2@COT 54.4 288.2 340.7 0.7 49.8 SiO2−KH570@COT 83.8 304.7 357.2 1.0 41.1 AMP-SiO2−KH570@COT 89.5 277.2 340.6 0.6 49.1 Table 2.
Main pyrolysis data of raw and treated cotton fabrics.
-
Sample LOI (%) ΔLOI (%) Δm (g) ΔLOI/Δm (%/g) Flammability level T1 (s) T2 (s) CL (cm) COT 18.0 − − − Inflammable 7.5 15.0 30.0 SiO2@COT 20.2 2.2 2.7 0.8 Inflammable 23.0 0.7 30.0 AMP@COT 25.1 7.1 3.4 2.1 Combustible 3.8 0 14.6 AMP-SiO2@COT 28.3 10.3 5.3 5.1 Non-flammable 3.0 0 8.9 SiO2−KH570@COT 20.5 2.5 8.1 0.3 Inflammable 14.7 1.2 30.0 AMP-SiO2−KH570@COT 27.7 9.7 8.6 1.1 Non-flammable 2.2 0 8.2 Table 3.
LOI and VFT data of raw and treated cotton fabrics.
-
Sample TTI
(s)PHRR
(kW/m2)TPHRR
(s)THR
(MJ/m2)FGR
(kW/(m2s)COT 7.0 183.1 36.0 7.5 5.1 SiO2@COT 8.0 104.2 36.0 5.2 2.9 AMP@COT 6.0 83.6 30.0 5.7 2.8 AMP-SiO2@COT 8.0 75.2 37.0 6.0 2.0 SiO2-KH570@COT 7.0 115.4 36.0 7.0 3.2 AMP-SiO2-KH570@COT 8.0 94.3 43.0 7.2 2.2 Table 4.
CCT data of raw and treated cotton fabrics.
Figures
(16)
Tables
(4)