-
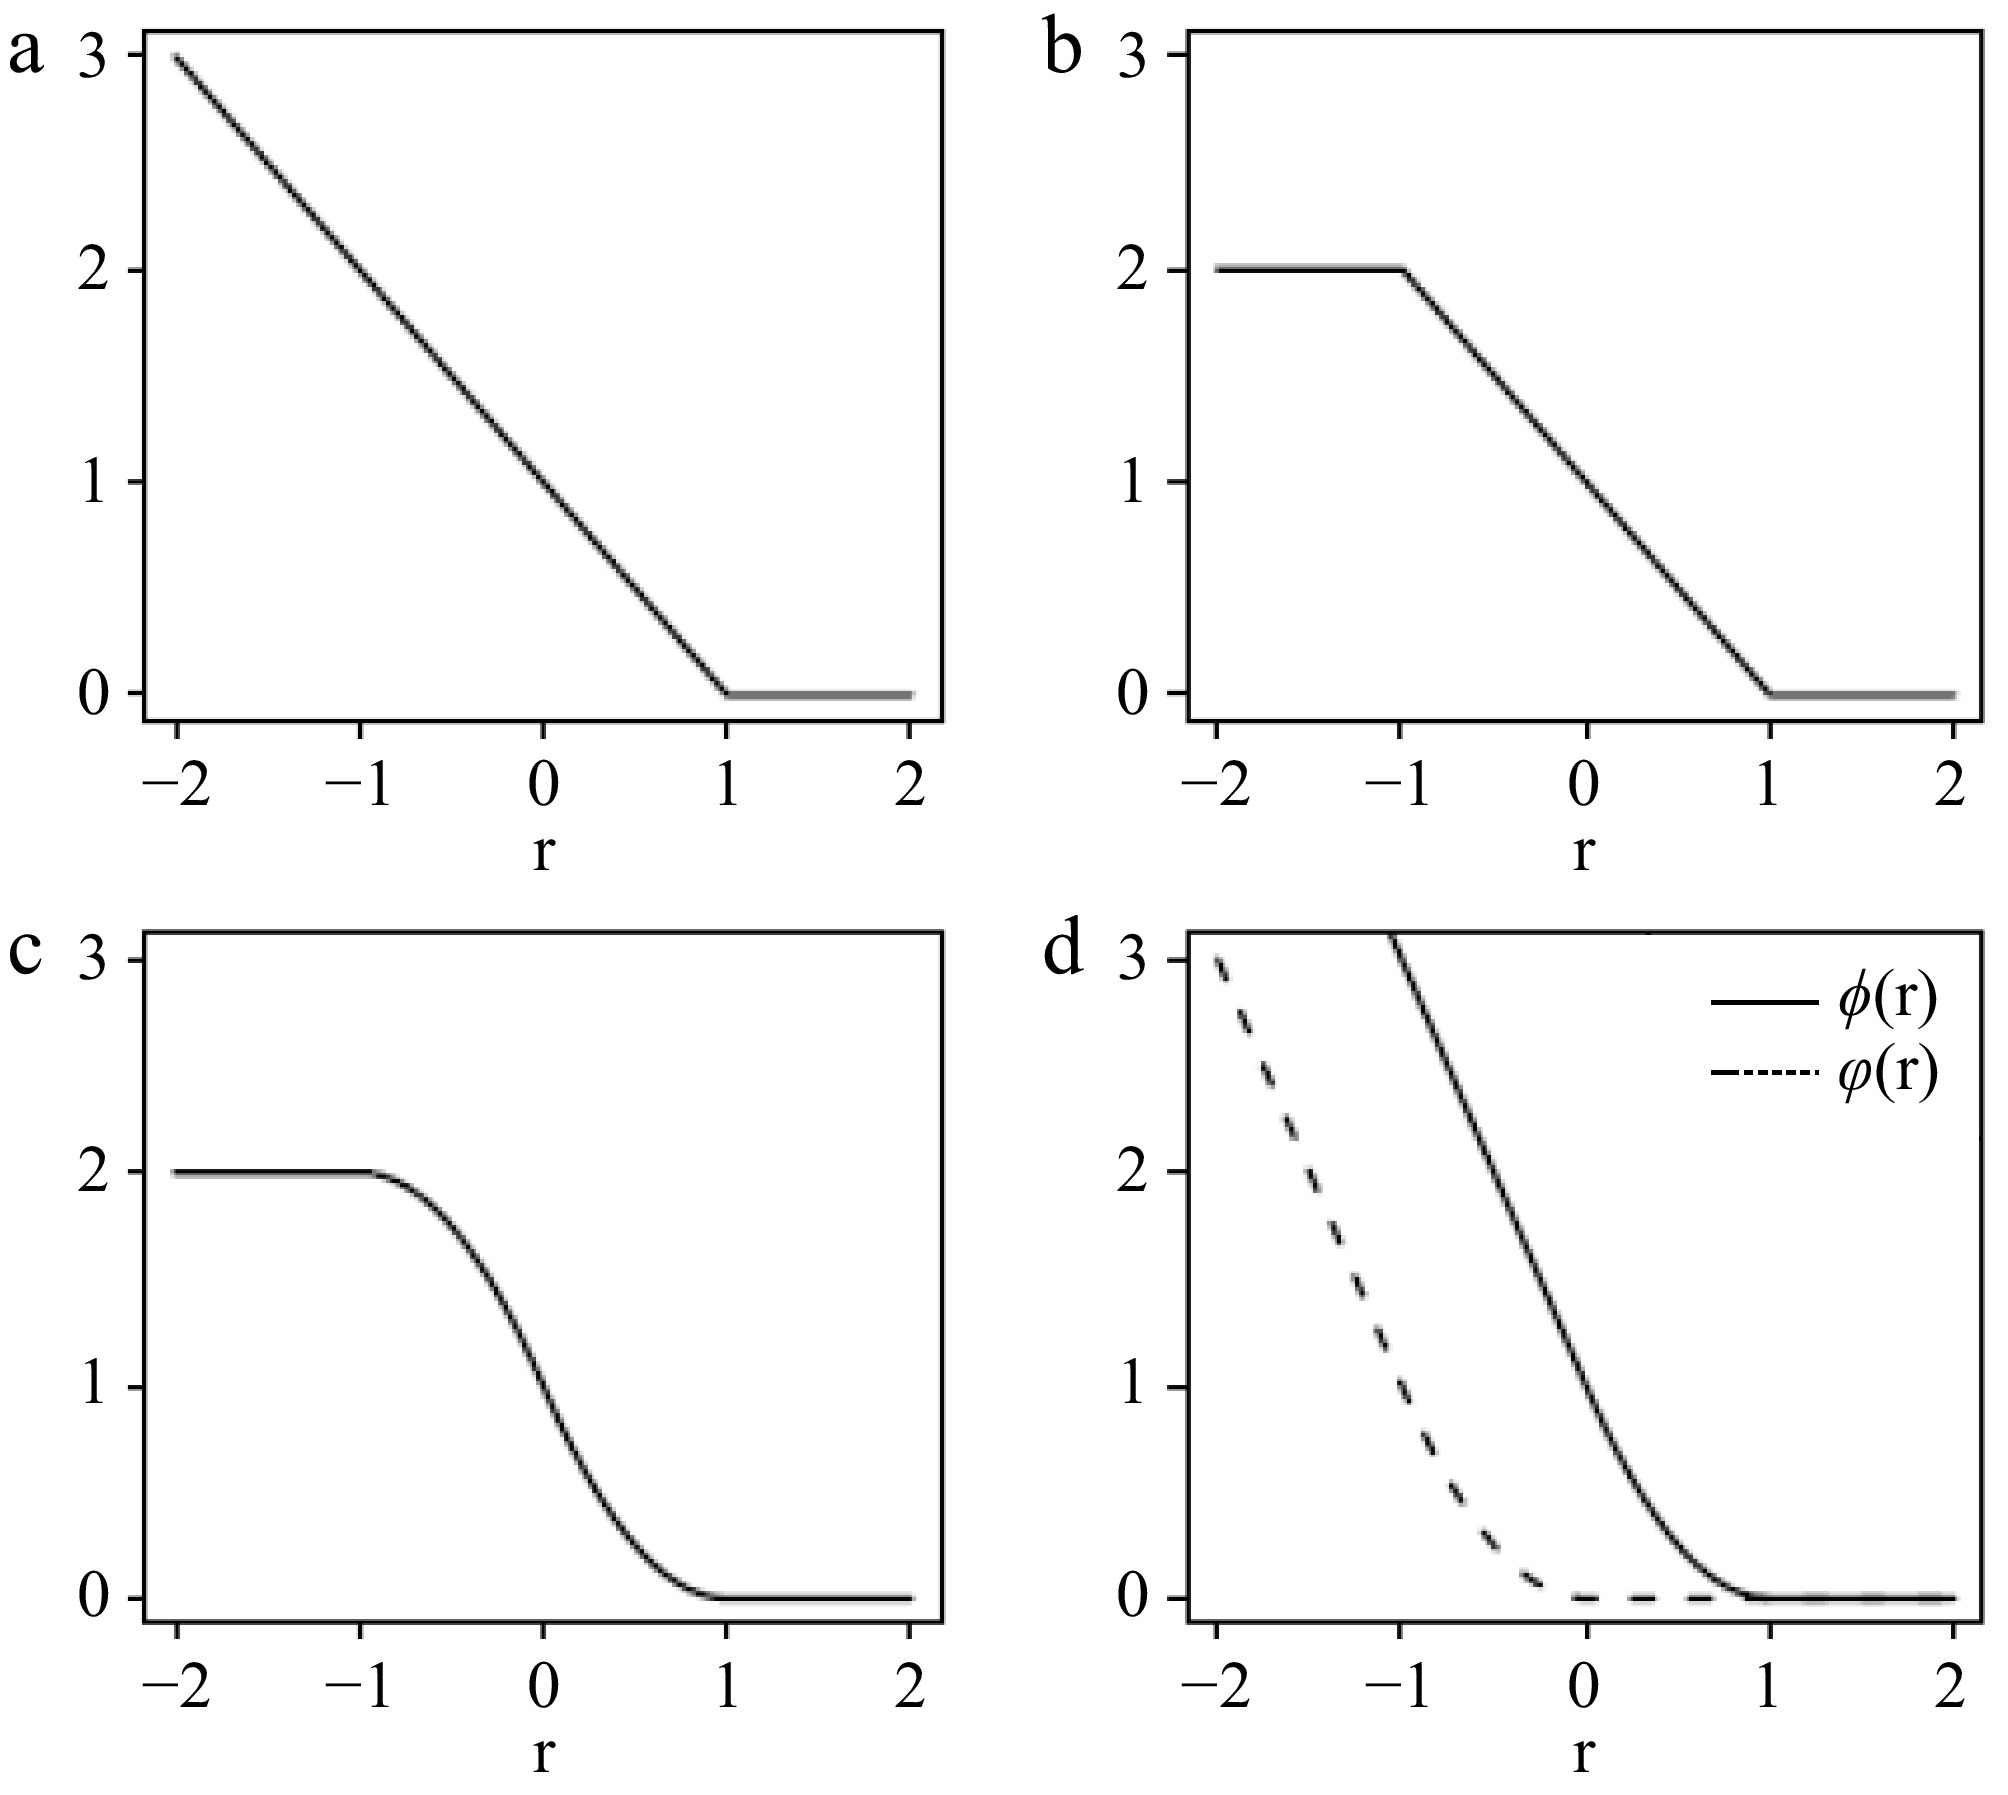
Figure 1.
(a) Hinge loss, (b) ramp loss, and (c) smoothed ramp loss functions. (d) Shows the difference of convex decomposition of the smoothed ramp loss, T(r) = ϕ(r) −
$\varphi $ -
Initialize $ {\Theta }^{\left(0\right)} $ repeat $ {\Theta }^{\left(t+1\right)}=argmi{n}_{\Theta }{Q}_{vex}\left(\Theta \right)+\left\langle{{Q}_{cav}^{\text{'}}\left({\Theta }^{\left(t\right)}\right),\Theta }\right\rangle $ until convergence of $ {\Theta }^{\left(t\right)} $ Table 1.
The d.c. algorithm for minimizing Q(Θ) = Qvex(Θ) + Qcav(Θ).
-
Set $ \in $ Initialize (β,β0). Initialize $ {\mathbf{\kappa }}_{i}^{\left(0\right)} $ repeat $\qquad $ $(\hat{\mathbf{\beta }},{\hat{\beta }}_{0}) $ $\qquad $ $ {r}_{i}={y}_{i}\left({\mathbf{x}}_{i}^{T}\hat{\mathbf{\beta }}+{\hat{\beta }}_{0}\right) $ $\qquad $ $ {\mathbf{\kappa }}_{i}^{\left(t+1\right)} $ until $ {\|{\mathbf{\kappa }}^{\left(t+1\right)}-{\mathbf{\kappa }}^{\left(t\right)}\|}_{\infty } < \in $ Table 2.
The d.c. algorithm for SRD.
-
SVM HHSVM SRD perc = 0% Scenario I 0.230(0.014) 0.084(0.015) 0.083(0.015) Scenario II 0.171(0.013) 0.146(0.010) 0.144(0.009) perc = 10% Scenario I 0.285(0.021) 0.131(0.032) 0.112(0.023) Scenario II 0.204(0.025) 0.154(0.014) 0.149(0.012) perc = 20% Scenario I 0.340(0.025) 0.216(0.056) 0.172(0.040) Scenario II 0.253(0.039) 0.174(0.033) 0.153(0.015) The number of training samples is 100, the number of total covariates is 500, and the number of relevant covariates is 10. The reported results are the average test errors over 1,000 repetitions on a test set of 10,000 samples, with the values in parentheses indicating the corresponding standard deviations. In scenario I, the covariates are independent, while in scenario II, the relevant covariates are highly correlated. perc: describes the percent of training samples randomly selected to have their class labels flipped. Specifically, perc = 0% indicates no perturbation in the training data, perc = 10% corresponds to a 10% perturbation, and perc = 20% corresponds to a 20% perturbation. Table 1.
Mean (std) of prediction errors evaluated on independent test data for two simulation scenarios.
-
HHSVM SRD qsignal qnoise qsignal qnoise perc = 0% Scenario I 9.8(0.6) 28.0(38.0) 9.7(0.6) 17.5(30.9) Scenario II 6.0(3.4) 50.8(93.7) 6.5(3.4) 53.7(94.6) perc = 10% Scenario I 8.8(1.3) 22.0(29.1) 9.2(1.0) 17.0(21.0) Scenario II 6.9(3.1) 41.9(86.6) 7.5(2.9) 45.5(82.9) perc = 20% Scenario I 7.0(2.0) 36.9(56.3) 7.7(1.8) 28.5(36.7) Scenario II 6.3(3.2) 41.2(83.1) 7.5(3.0) 31.4(71.3) The setups are the same as those described in Table 1. qsignal is the number of selected relevant covariates, and qnoise is the number of selected noise covariates. The results are averages over 1000 repetitions, and the numbers in parentheses are the standard deviations. Table 2.
Comparison of variable selection.
-
Optimal rule 'One-standard error' rule Test error No. of genes Test error No. of genes SVM 12.3%(1.7%) 1,224 HHSVM 13.6%(2.1%) 86.2(100.1) 13.7%(2.0%) 60.5(78.5) SRD 11.9%(1.9%) 219.0(136.4) 12.3%(2.2%) 140.4(100.8) Test errors are averages of 100 cross validation repetitions. The numbers of genes are averages of selected genes in 1,000 classification models. The numbers in parentheses are the corresponding standard deviations. Table 3.
Results on the colon cancer dataset.
-
Accession Gene name Freq. R87126 Myosin, heavy chain 9, non-muscle (MYH9) 990 M76378 Cysteine and glycine-rich protein 1 (CSRP1) 989 J02854 Myosin, light chain 9, regulatory (MYL9) 988 M63391 Desmin (DES) 983 X12671 Heterogeneous nuclear ribonucleoprotein A1 (hnRNP A1) 983 Z50753 Guanylate cyclase activator 2B (GUCA2B) 981 R36977 General transcription factor IIIA 973 T47377 S100P Protein 972 J03040 Secreted protein, acidic, cysteine-rich (SPARC) 970 X14958 High mobility group AT-hook 1 (HMGA1) 967 T51571 P24480 Calgizzarin 967 H43887 Complement factor D precursor 966 L07648 MAX interactor 1, dimerization protein (MXI1) 957 M22382 Heat shock 60kDa protein 1 (HSPD1) 955 H64489 Tetraspanin 1 (TSPAN1) 945 H20709 Myosin, light chain 6, alkali (MYL6) 942 H40095 Macrophage migration inhibitory factor 935 R84411 Small nuclear ribonucleoprotein associated proteins B 929 T51023 Heat shock protein 90kDa alpha (cytosolic) 922 T71025 Metallothionein 1G (MT1G) 916 Table 4.
The 20 most frequently selected genes by SRD with the 'one-standard error' rule from the colon cancer dataset.
Figures
(1)
Tables
(6)