-
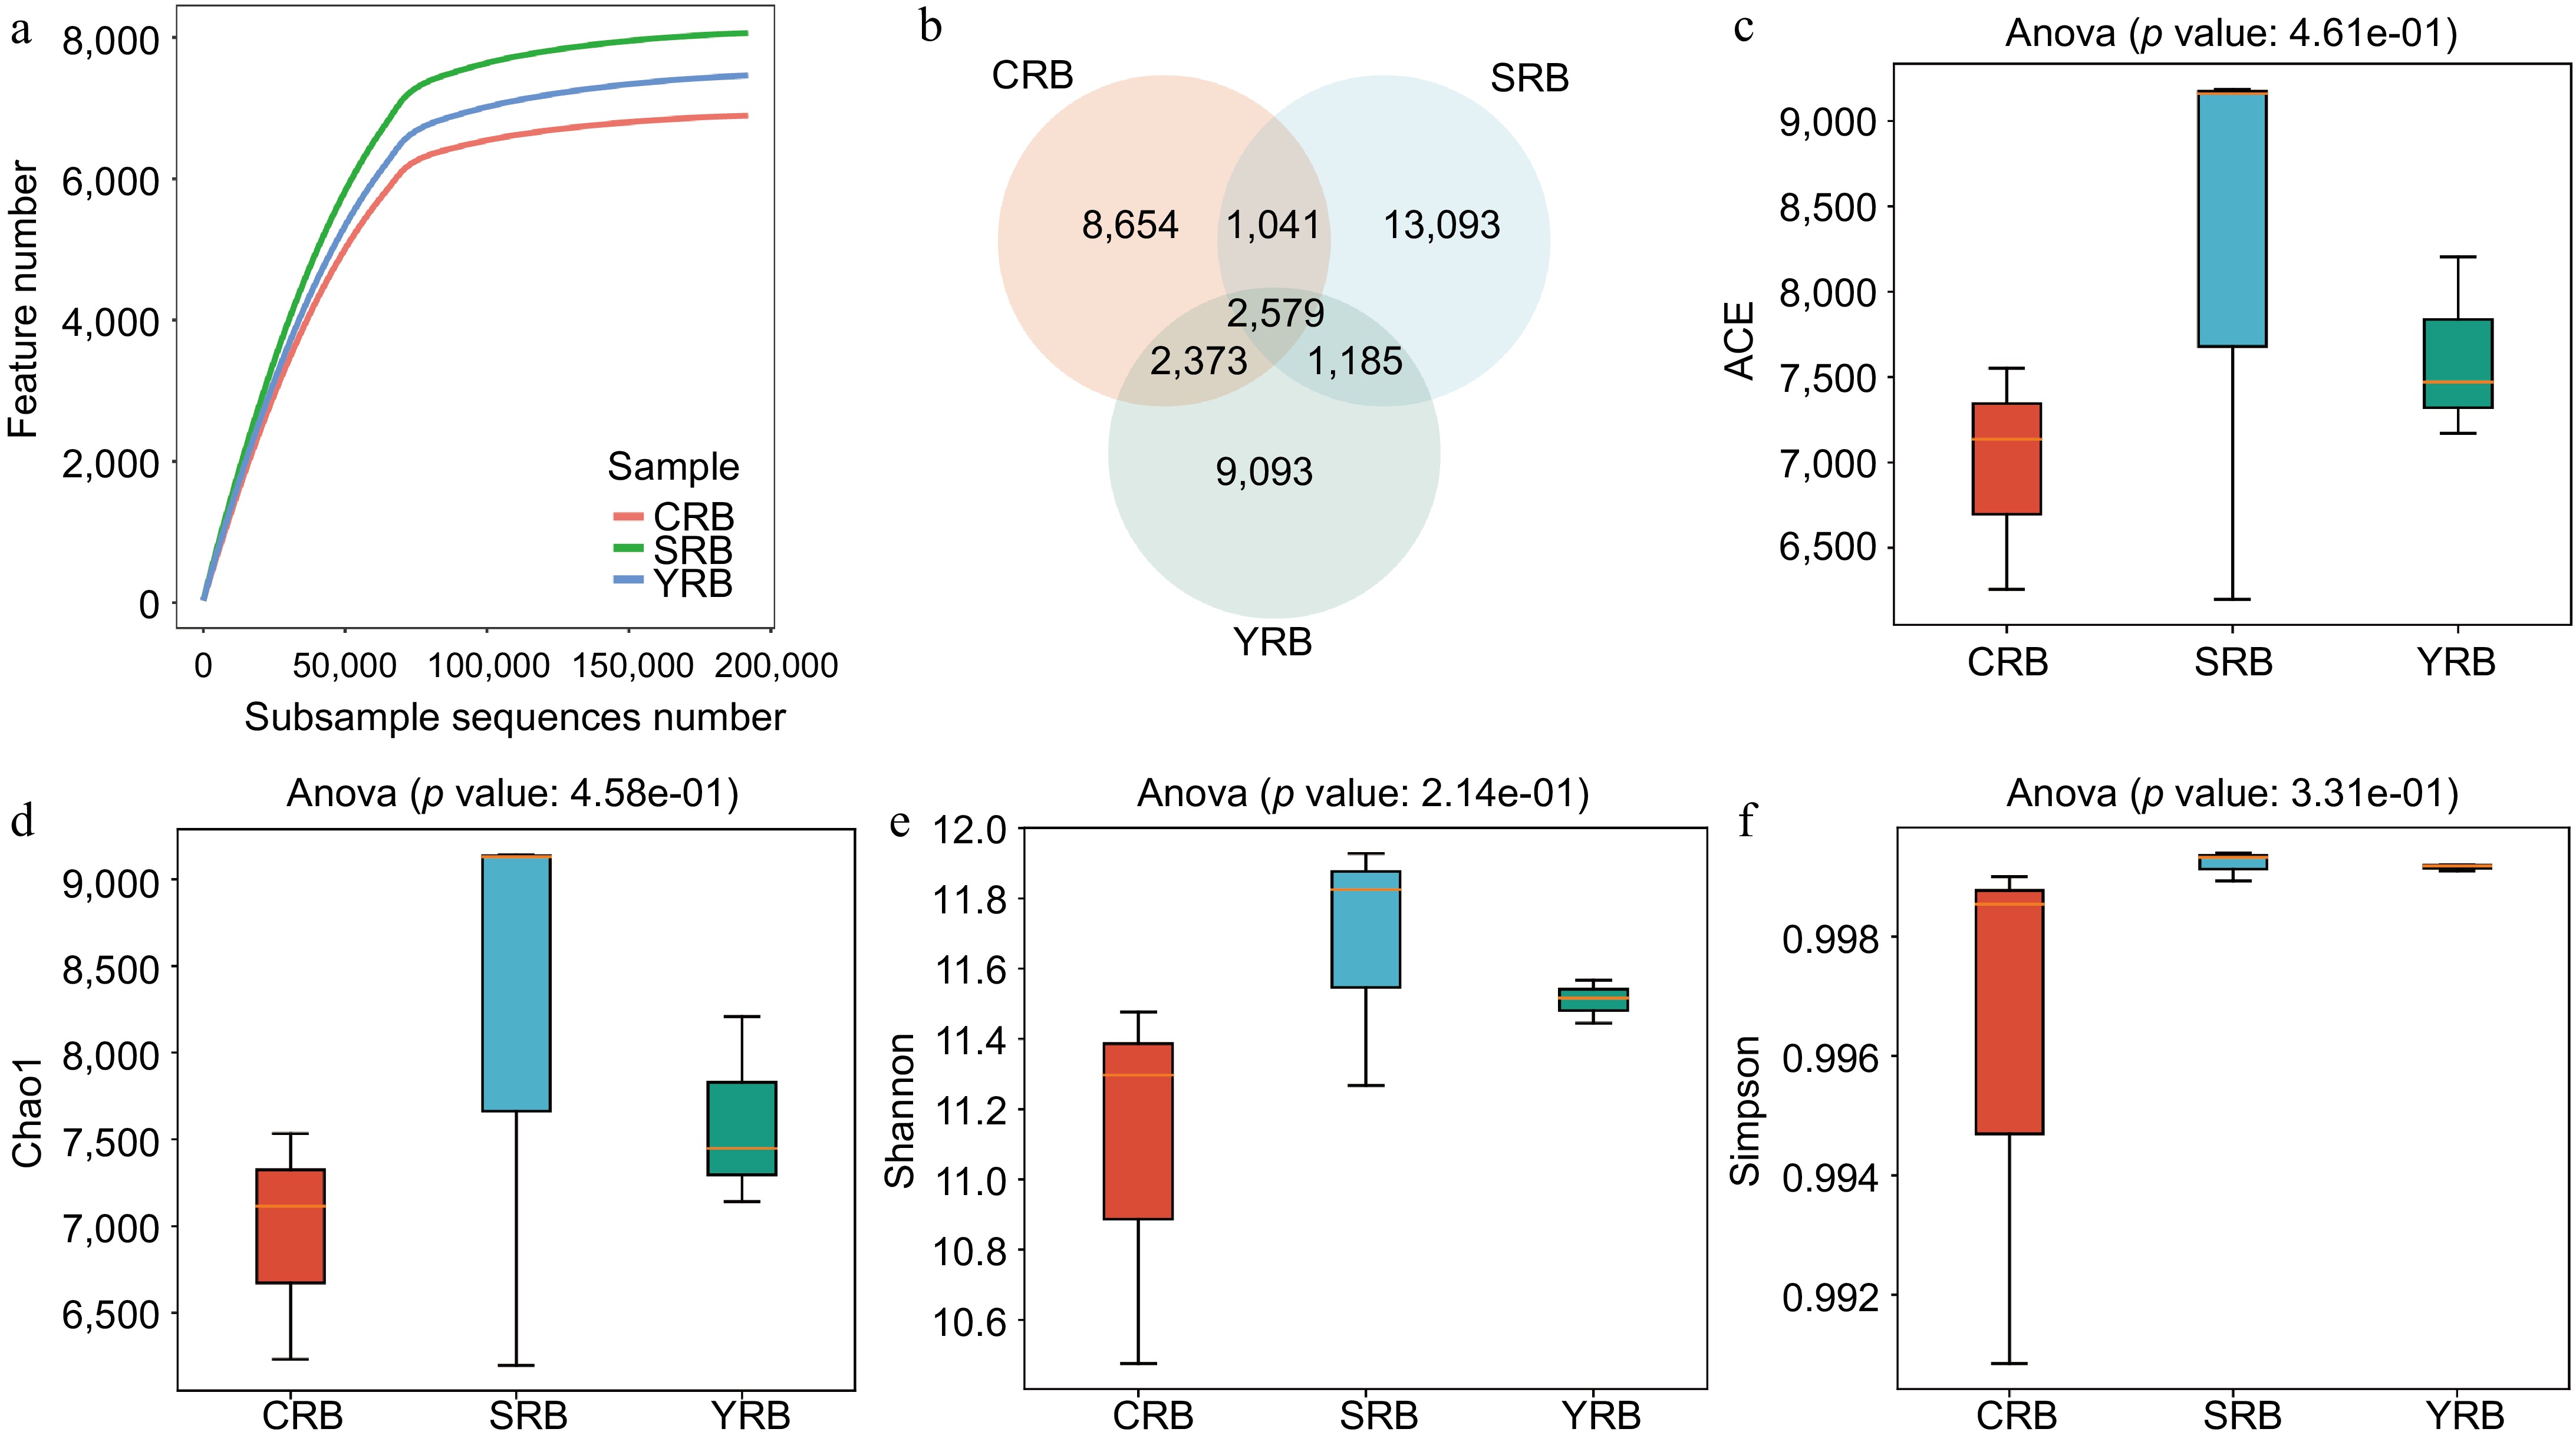
Figure 1.
The diversity and richness of rhizosphere bacterial communities of A. cochinchinensis rhizosphere samples collected from various areas. (a) Rarefaction curve reveals the sequencing depth in each sample, the horizontal coordinate reflects the number of sequences randomly selected, and the vertical coordinate reflects the number of features obtained based on the number of sequences. Each curve represents a sample/group and is marked with a different color. (b) Venn diagram illustrates the numbers of ASVs in the CRB, SRB, and YRB groups. (c) ACE indices in the CRB, SRB, and YRB groups based on QIIME2 software, the horizontal coordinate reflects the group name, and the vertical coordinate reflects the ACE index value. (d) Chao1 indices in the CRB, SRB, and YRB groups based on QIIME2 software, the horizontal coordinate reflects the group name, and the vertical coordinate reflects the Chao1 index value.(e) Shannon indices in the CRB, SRB, and YRB groups based on QIIME2 software, the horizontal coordinate reflects the group name, and the vertical coordinate reflects the Shannon index value. (f) Simpson indices in the CRB, SRB, and YRB groups based on QIIME2 software, the horizontal coordinate reflects the group name, and the vertical coordinate reflects the Simpson index value.
-
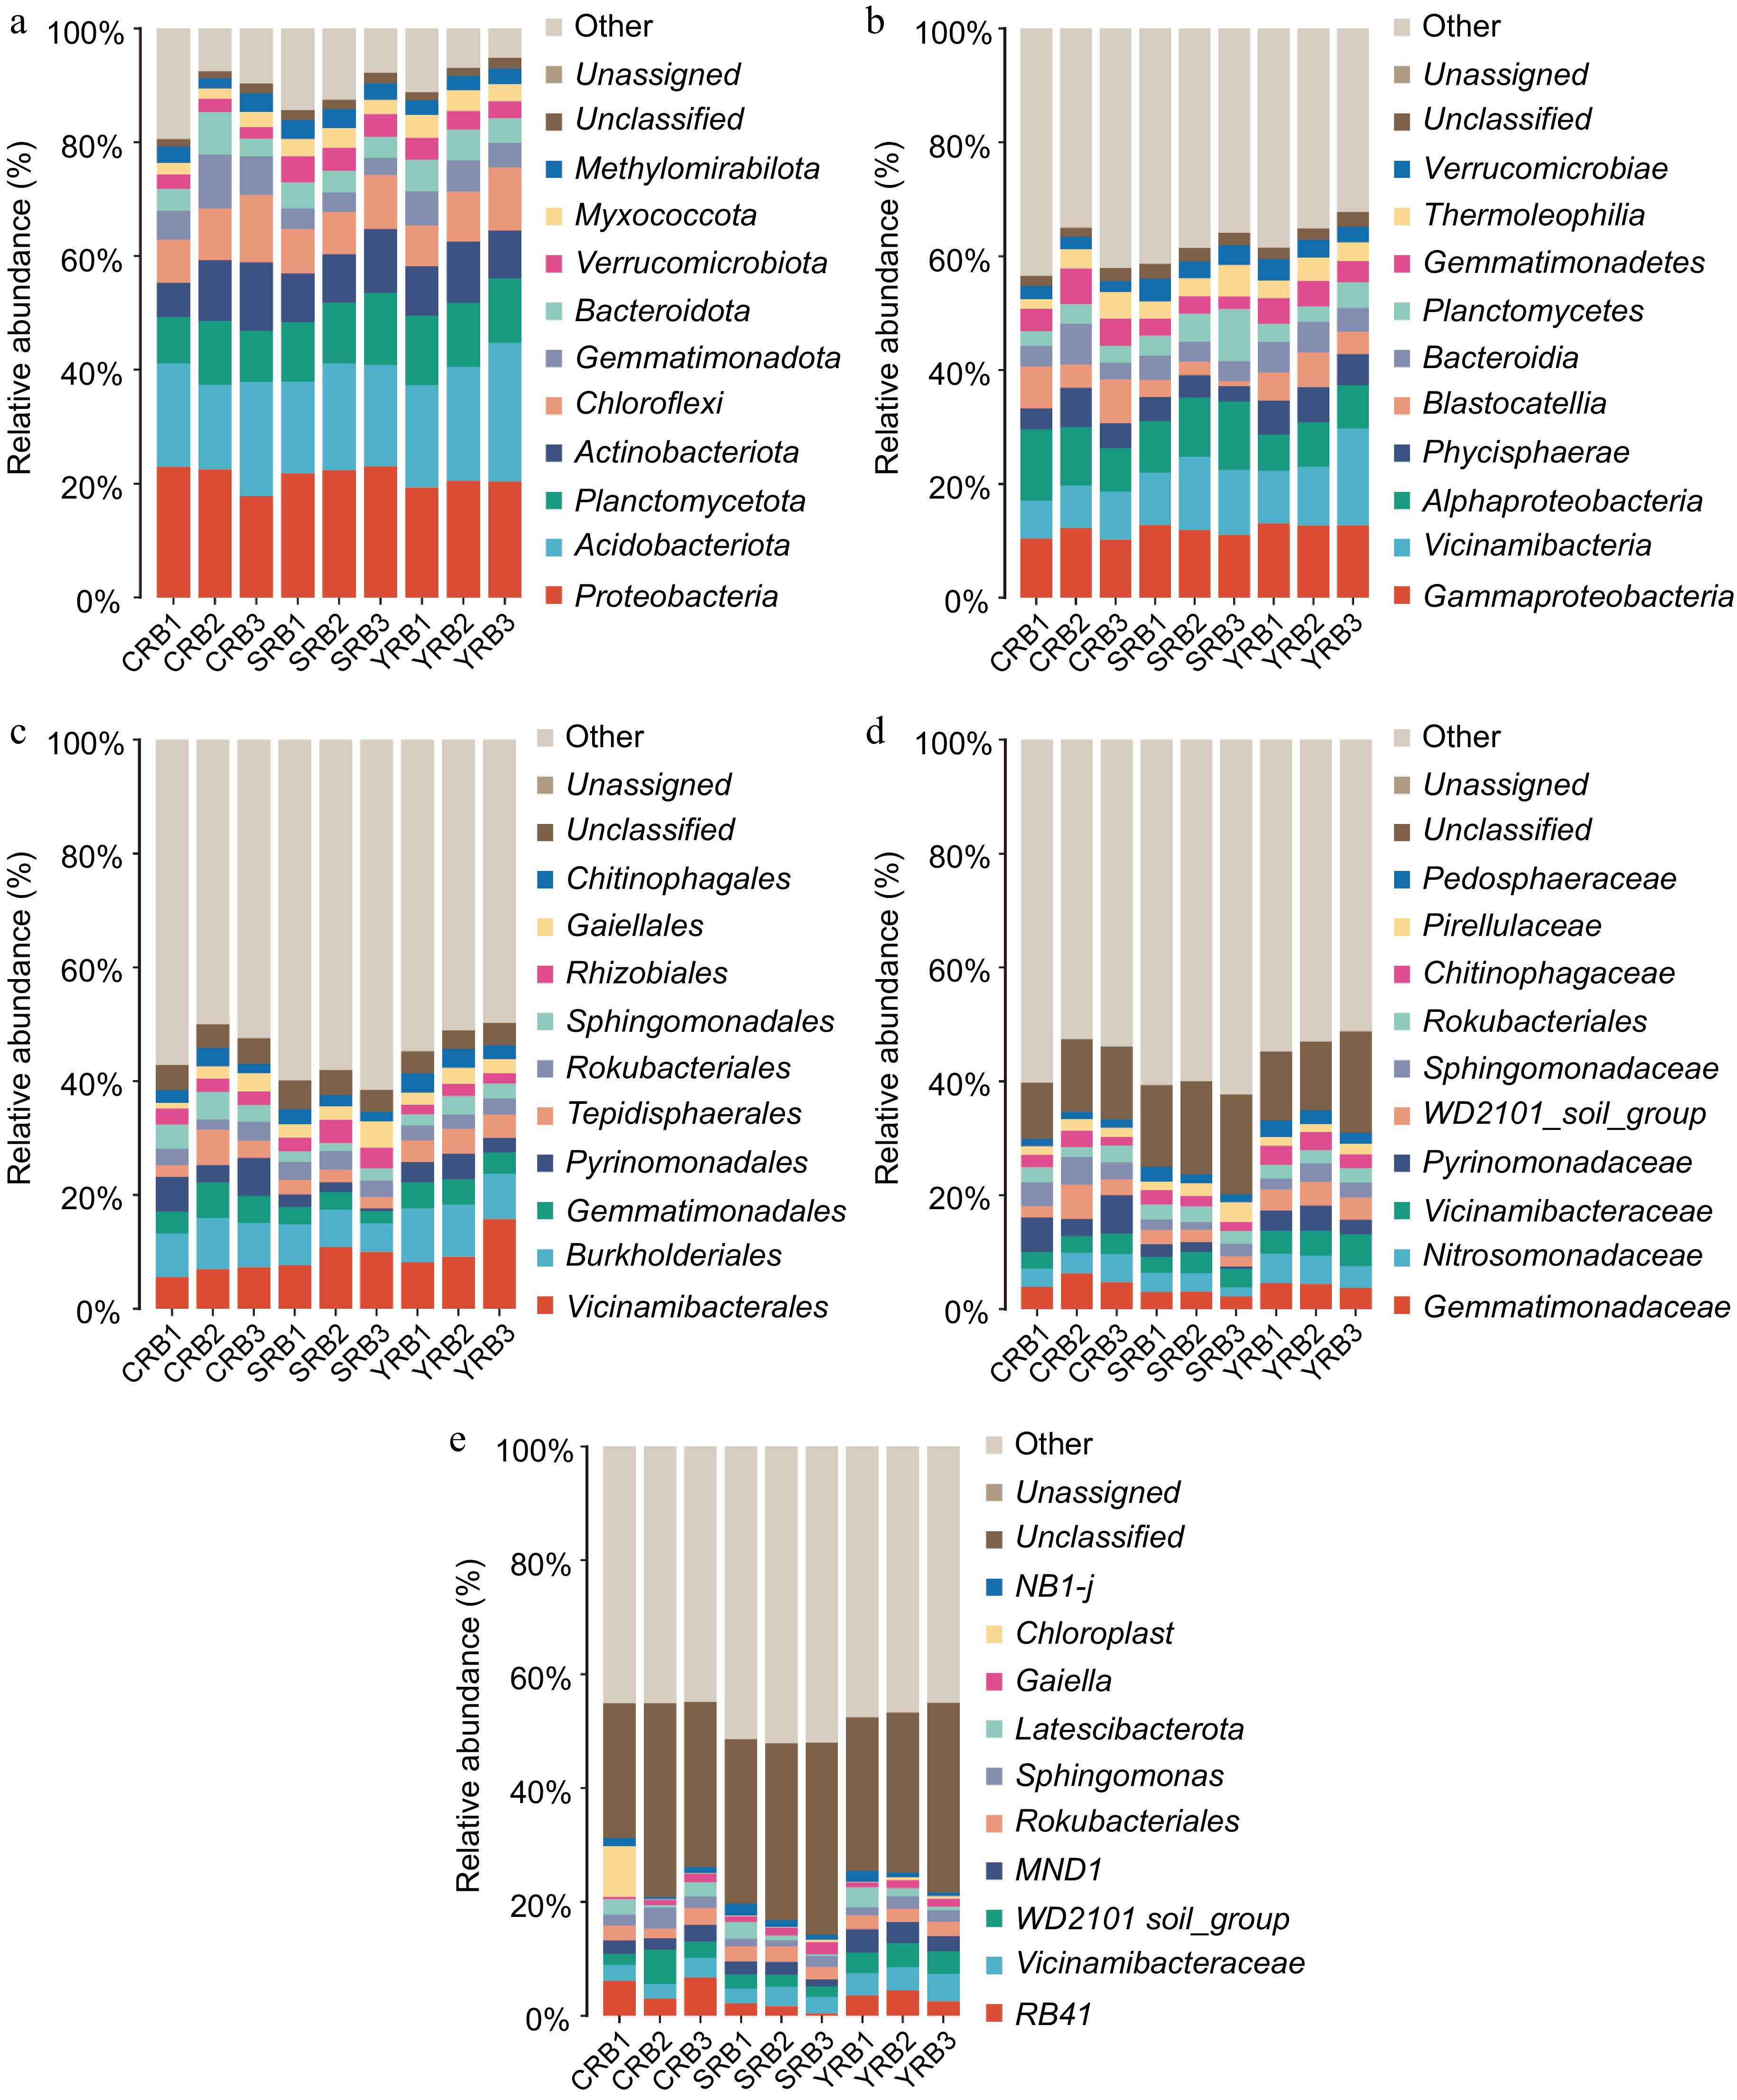
Figure 2.
Bacterial community composition in the A. cochinchinensis rhizosphere samples collected from various areas. (a) The relative abundances of the ten top dominant taxa at the phylum level. (b) The relative abundances of the ten top dominant taxa at the class level. (c) The relative abundances of the ten top dominant taxa at the order level. (d) The relative abundances of the ten top dominant taxa at the family level. (e) The relative abundances of the ten top dominant taxa at the genus level.
-
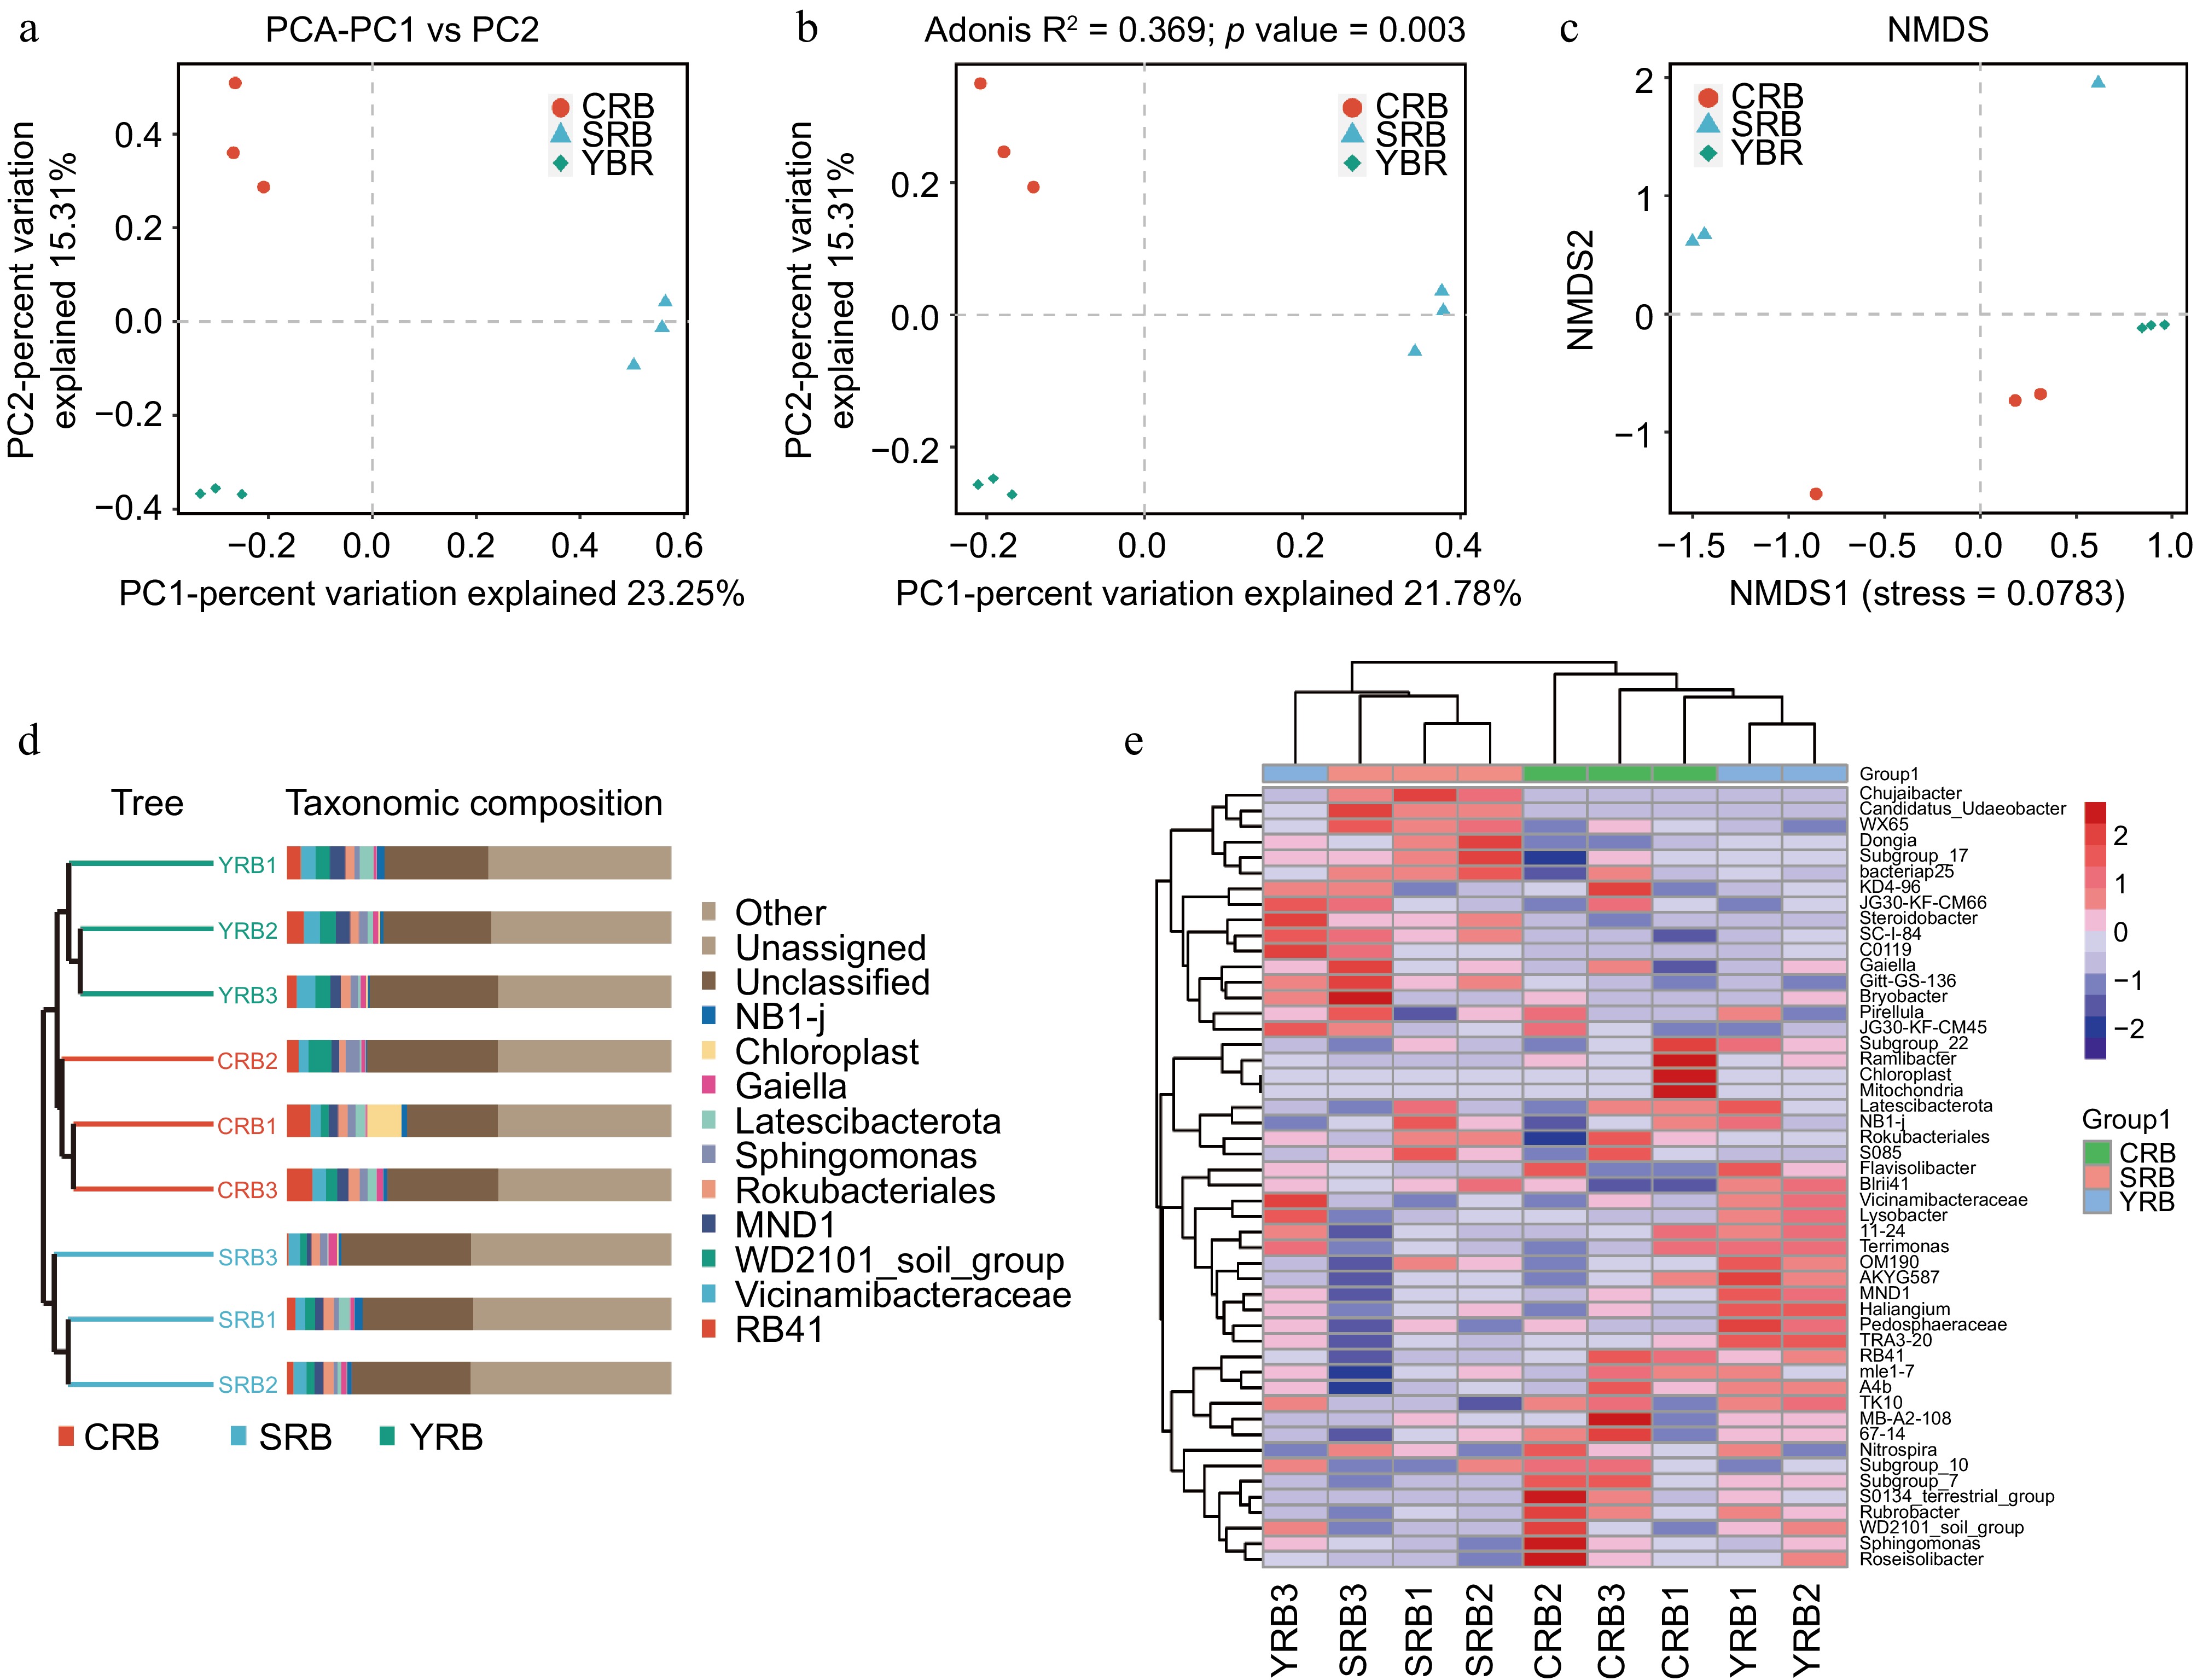
Figure 3.
Beta diversity of bacterial community in the A. cochinchinensis rhizosphere samples collected from various areas. (a) Principal component analysis of gut bacterial community among different groups. (b) Principal co-ordinates analysis of soil bacterial community among different groups. (c) Non-metric multi-dimensional scaling analysis of soil bacterial community among different groups. (d) Unweighted pair-group method with arithmetic mean combined with species abundance histograms analysis among different groups based on the binary Jaccard distances. (e) Heatmap clustering at the genus level and the top 50 species among different groups.
-
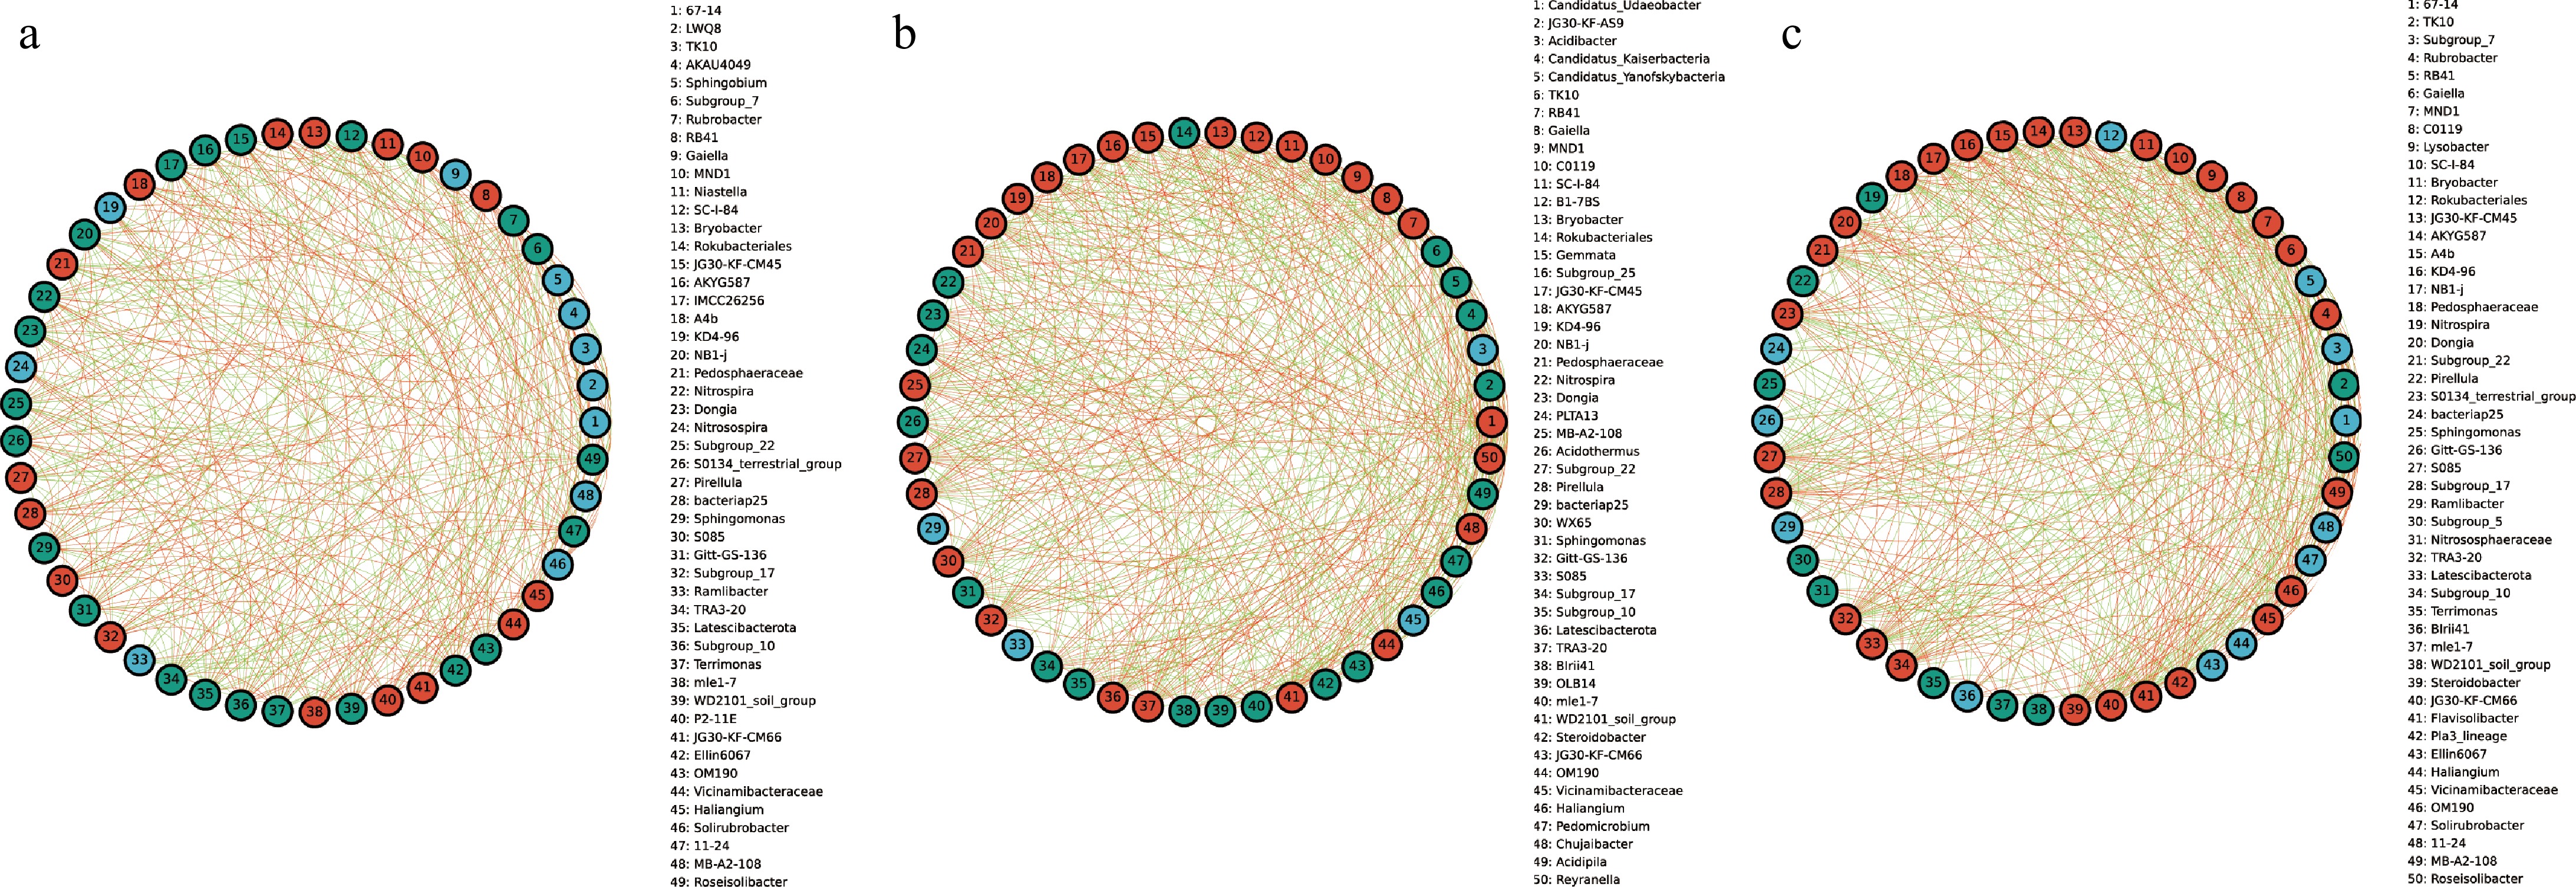
Figure 4.
The species correlation network of bacterial communities of A. cochinchinensis rhizosphere samples collected from various areas. Spearman rank correlation analyses were performed on the top 50 species in the (a) CRB, (b) SRB, and (c) YRB in terms of genus-level abundance, and correlation networks were constructed by filtering data with correlations greater than 0.6 or less than -0.6 and p-values of less than 0.05. The green lines represent negative correlations, and red lines represent positive correlations. The bolder lines represent the closer correlations between two genera.
-
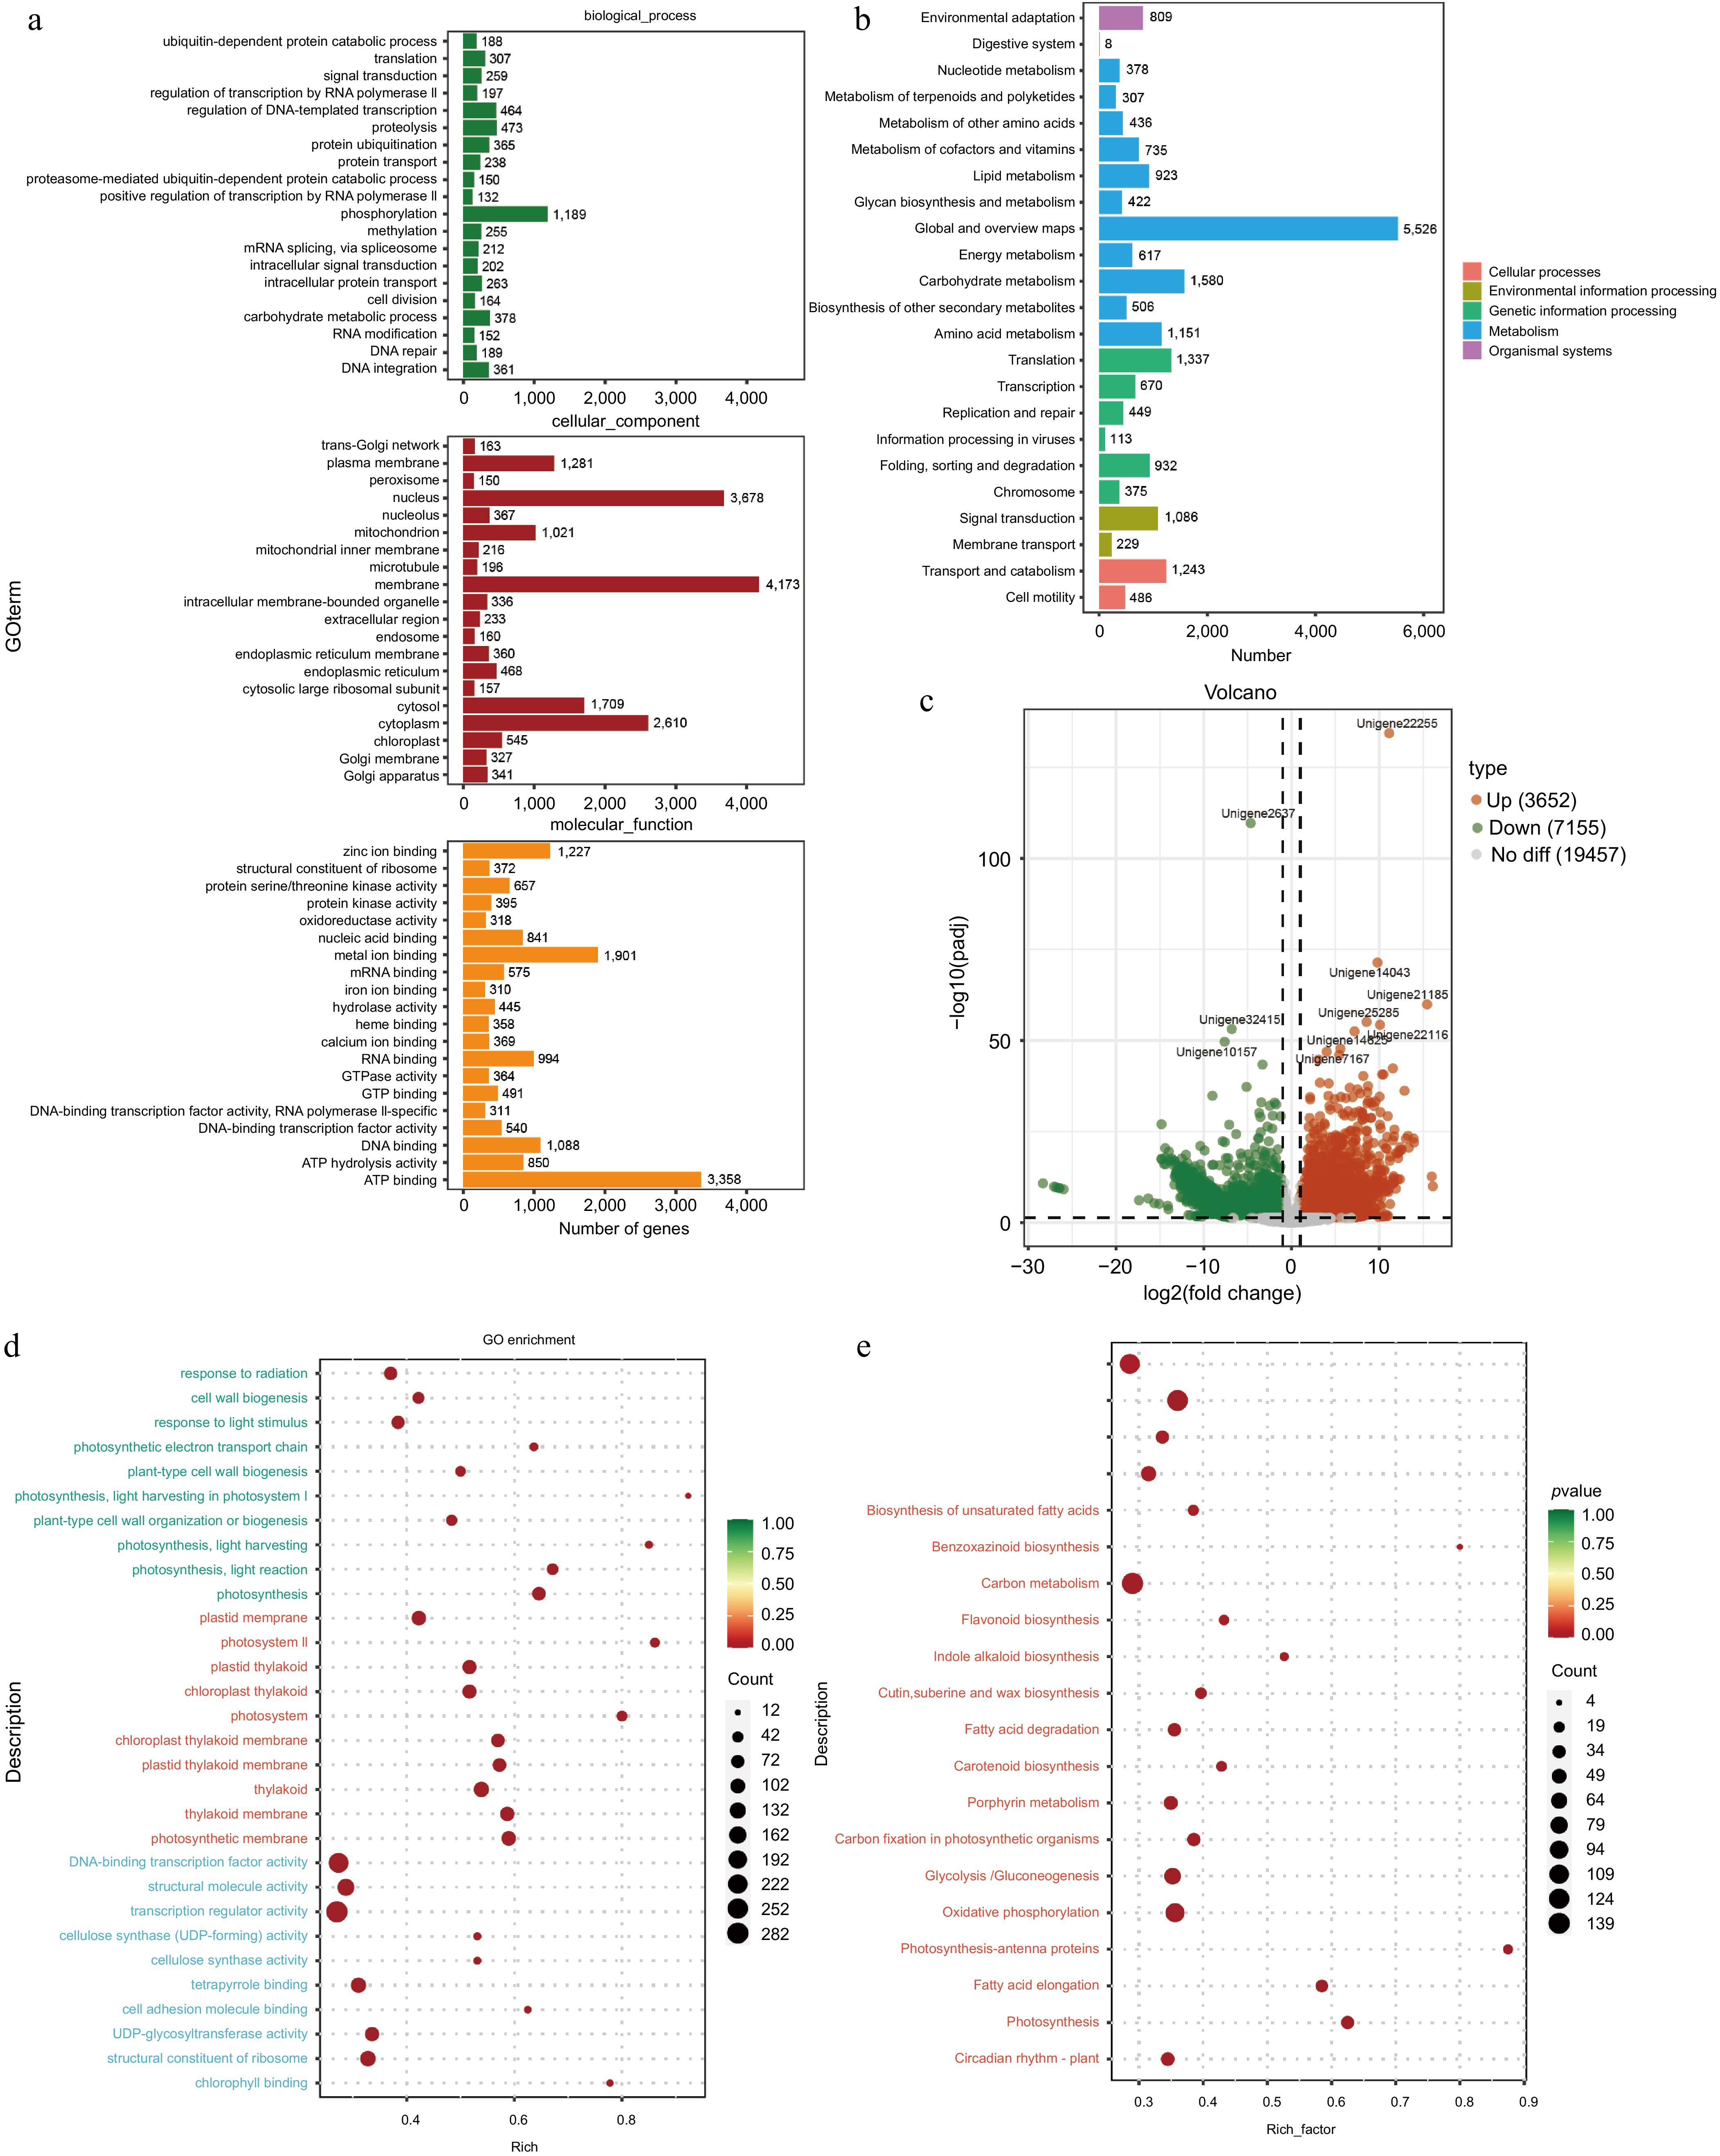
Figure 5.
Functional prediction of different tissues of A. cochinchinensis. (a) Function prediction of different tissues of A. cochinchinensis based on the Gene Ontology database. (b) Function prediction of different tissues of A. cochinchinensis based on the Kyoto Encyclopedia of Genes and Genomes database. (c) Comparing the differential expression of roots and stems unigene. (d) Gene function prediction of differentially expressed unigenes based on the Gene Ontology database. (e) Gene function prediction of differentially expressed unigenes based on the Kyoto Encyclopedia of Genes and Genomes database.
-
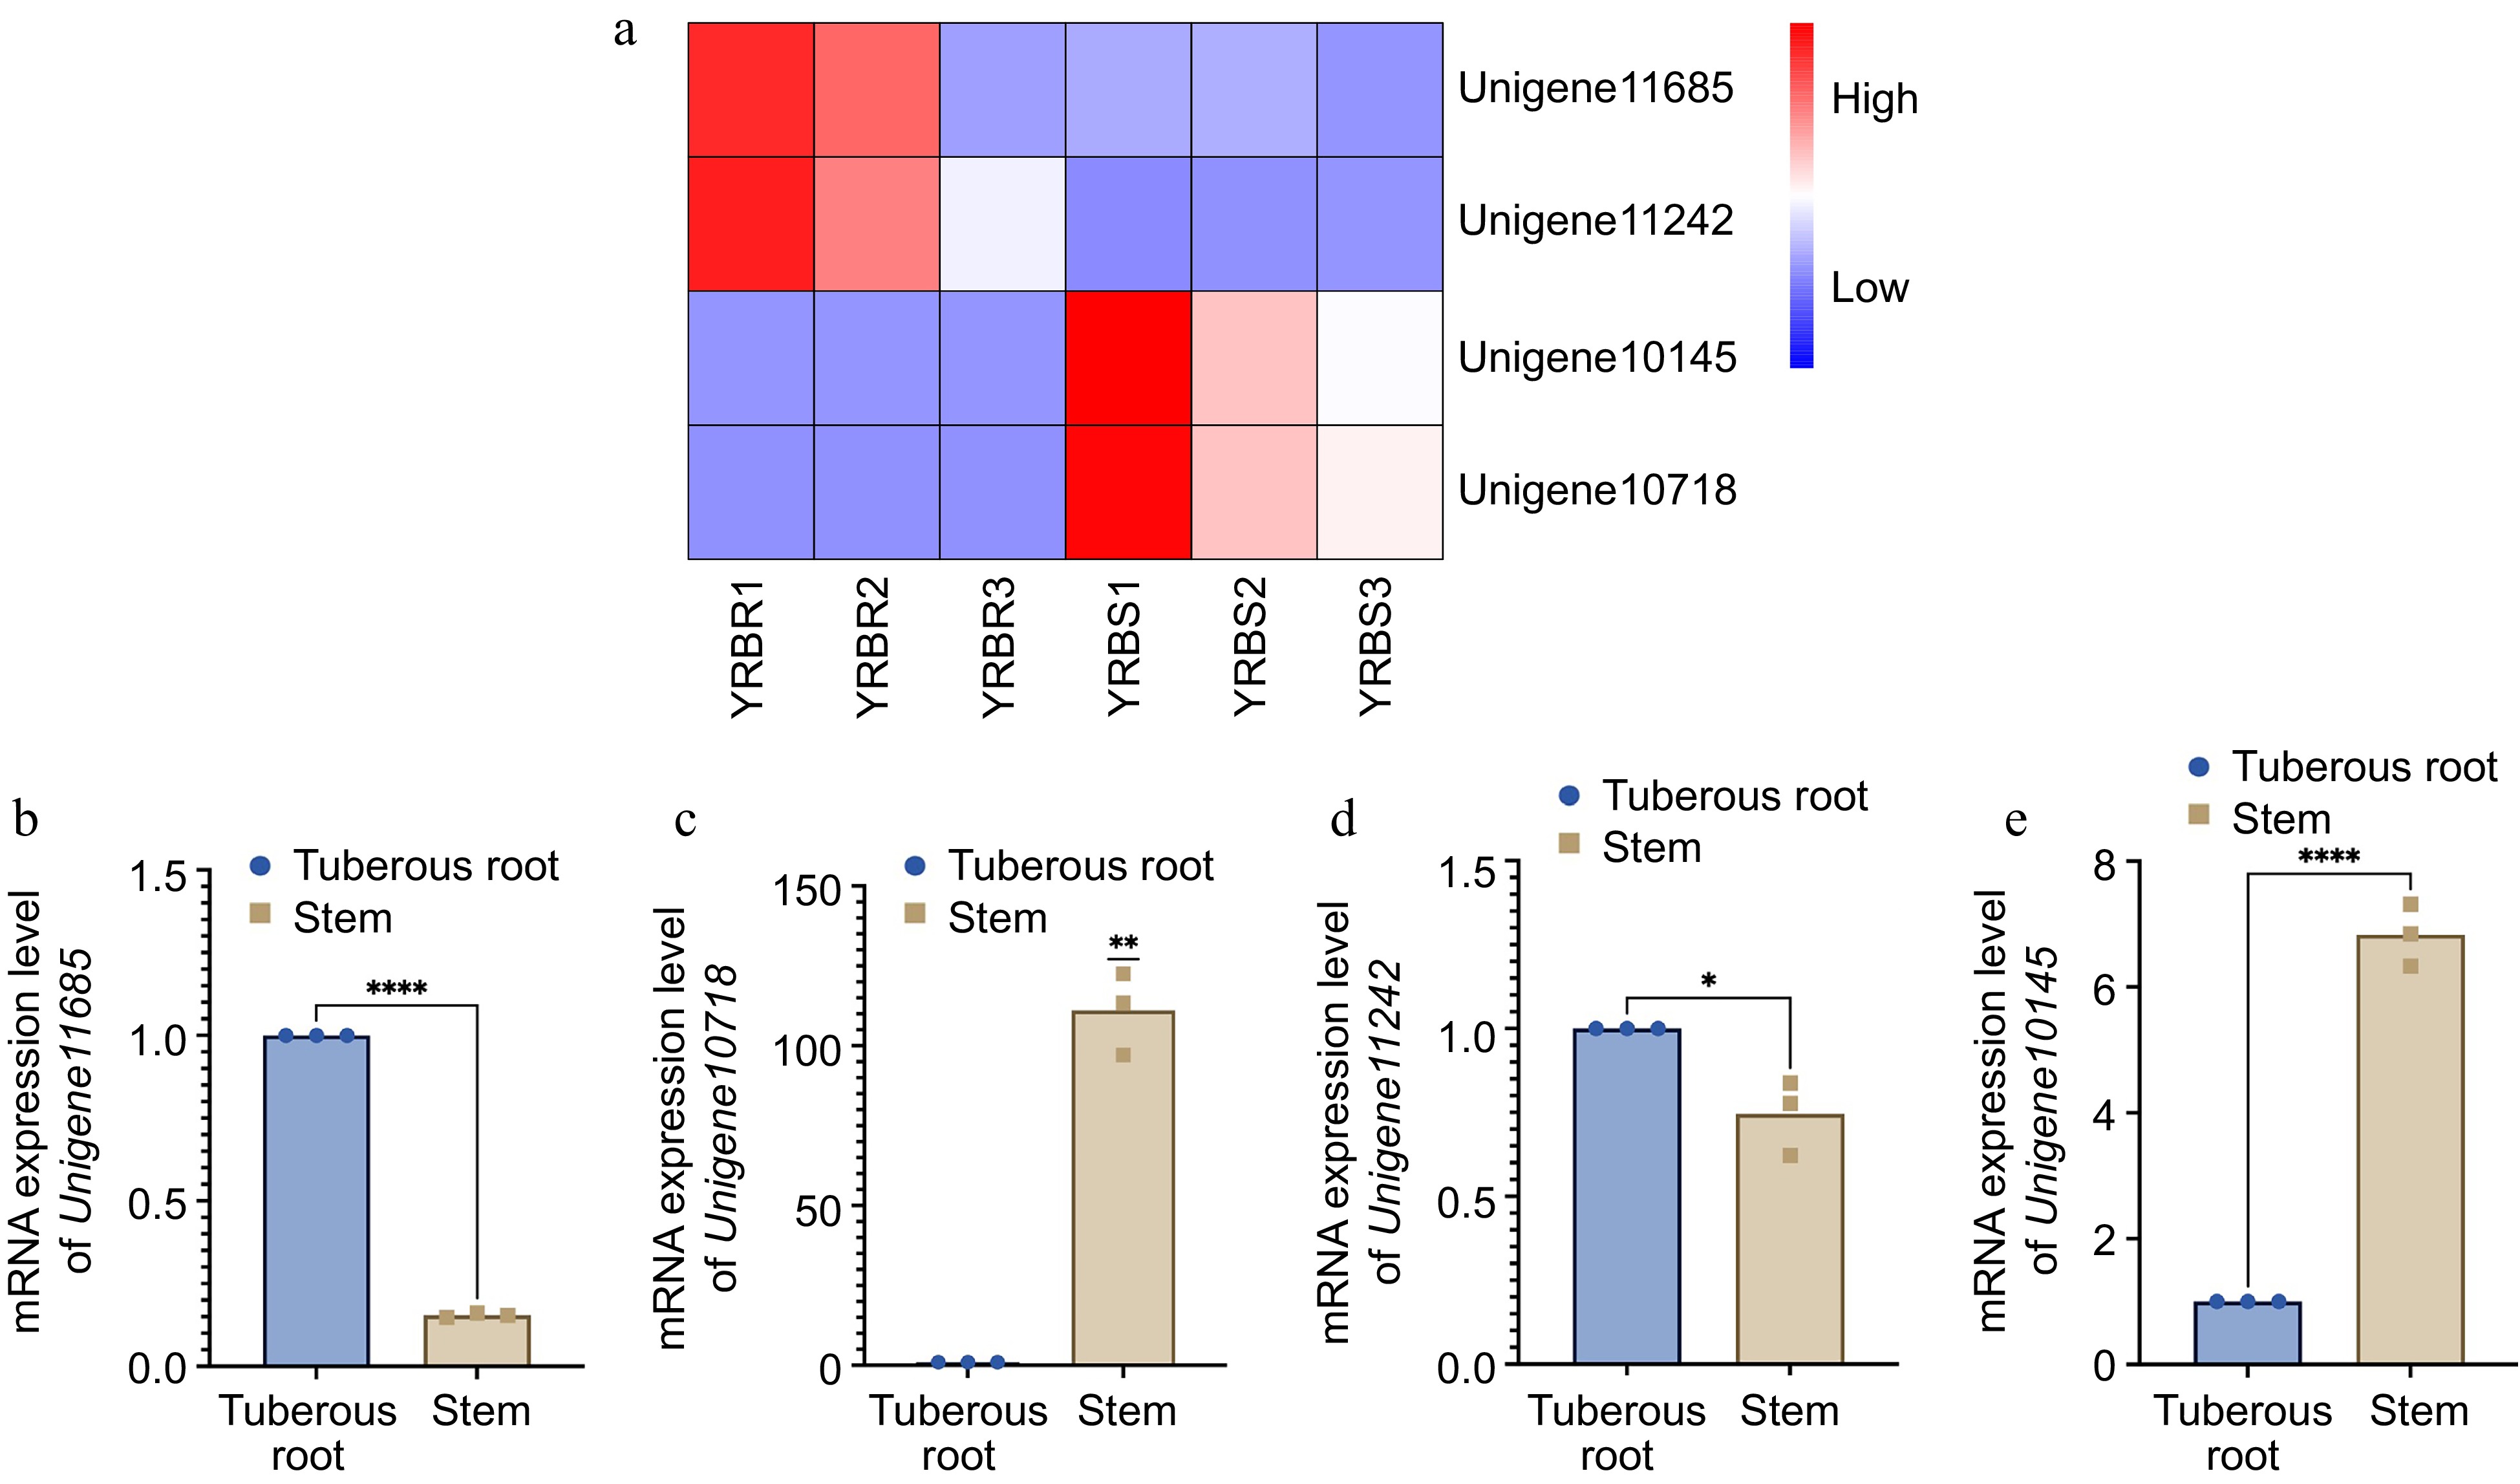
Figure 6.
mRNA expression level of four differentially expressed genes in different tissues of A. cochinchinensis. (a) Comparison of expression level of Unigene11685, Unigene10718, Unigene11242, and Unigene10145 in tuberous root and stem samples of A. cochinchinensis based on heatmap. (b) mRNA expression level of Unigene11685 normalized with EF1α in the tuberous root and stem samples of A. cochinchinensis. (c) mRNA expression level of Unigene10718 normalized with EF1α in the tuberous root and stem samples of A. cochinchinensis. (d) mRNA expression level of Unigene11242 normalized with EF1α in the tuberous root and stem samples of A. cochinchinensis. (e) mRNA expression level of Unigene10145 normalized with EF1α in the tuberous root and stem samples of A. cochinchinensis. * p < 0.05, ** p < 0.01, **** p < 0.0001.
-
Sample number Group Sampling date Sampling area SAMN number YRBR1 YRBR 2024/4/24 China: Neiiang: Yangjia Town 29.525142N 105.163067E SAMN43440143 YRBR2 YRBR 2024/4/24 China: Neiiang: Yangjia Town 29.525142N 105.163067E SAMN43440144 YRBR3 YRBR 2024/4/24 China: Neiiang: Yangjia Town 29.525142N 105.163067E SAMN43440145 YRBS1 YRBS 2024/4/24 China: Neiiang: Yangjia Town 29.525142N 105.163067E SAMN43440146 YRBS2 YRBS 2024/4/24 China: Neiiang: Yangjia Town 29.525142N 105.163067E SAMN43440147 YRBS3 YRBS 2024/4/24 China: Neiiang: Yangjia Town29.525142N 105.163067E SAMN43440148 CRB1 CRB 2024/4/24 China: Neiiang: Shuangcai Town 29.749611N 105.109195E SAMN43415523 CRB2 CRB 2024/4/24 China: Neiiang: Shuangcai Town 29.749611N 105.109195E SAMN43415524 CRB3 CRB 2024/4/24 China: Neiiang: Shuangcai Town 29.749611N 105.109195E SAMN43415525 YRB1 YRB 2024/4/24 China: Nelliang: Yangjia Town 29.766105N 105.353238E SAMN43415526 YRB2 YRB 2024/4/24 China: Nelliang: Yangjia Town 29.766105N 105.353238E SAMN43415527 YRB3 YRB 2024/4/24 China: Nelliang: Yangjia Town 29.766105N 105.353238E SAMN43415528 SRB1 SRB 2024/4/24 China: Neiiang: Guobei Town 29.525142N 105.163067E SAMN43415529 SRB2 SRB 2024/4/24 China: Neiiang: Guobei Town 29.525142N 105.163067E SAMN43415530 SRB3 SRB 2024/4/24 China: Neiiang: Guobei Town 29.525142N 105.163067E SAMN43415531 Table 1.
Information for the A. cochinchinensis cultivation soil samples and different tissues used in this study.
-
Primers DNA sequence (5' to 3') U10703-F ACCTACCGCCATCACCTCAAC U10703-R CCCGAACCAAATCCCTGAAATACC U11242-F CTTGATATAGACGATCCTGACACTTGG U11242-R TGGGAAGCGATTATTGAAACCTCTG U11685-F ATGGCGGTCTCGGTCATACTAC U11685-R GGCATTGGATTTGGATTTGGATCTG U10145-F GCCAAGTGAGTTGCCAGGTTC U10145-R GTTTATGTATCAGGTCGTCTTGCTTTG U10718 -F GGTAACTTGGCACTTAAAGCGATATAG U10718 -R TACCTTCTCGTGTACCATTAACAACTC EF1α-F CTGGCCAGGGTGGTTCATGAT EF1α-R TAAGTCTGTTGAGATGCACC Table 2.
Designed primer information in this study.
Figures
(6)
Tables
(2)