-
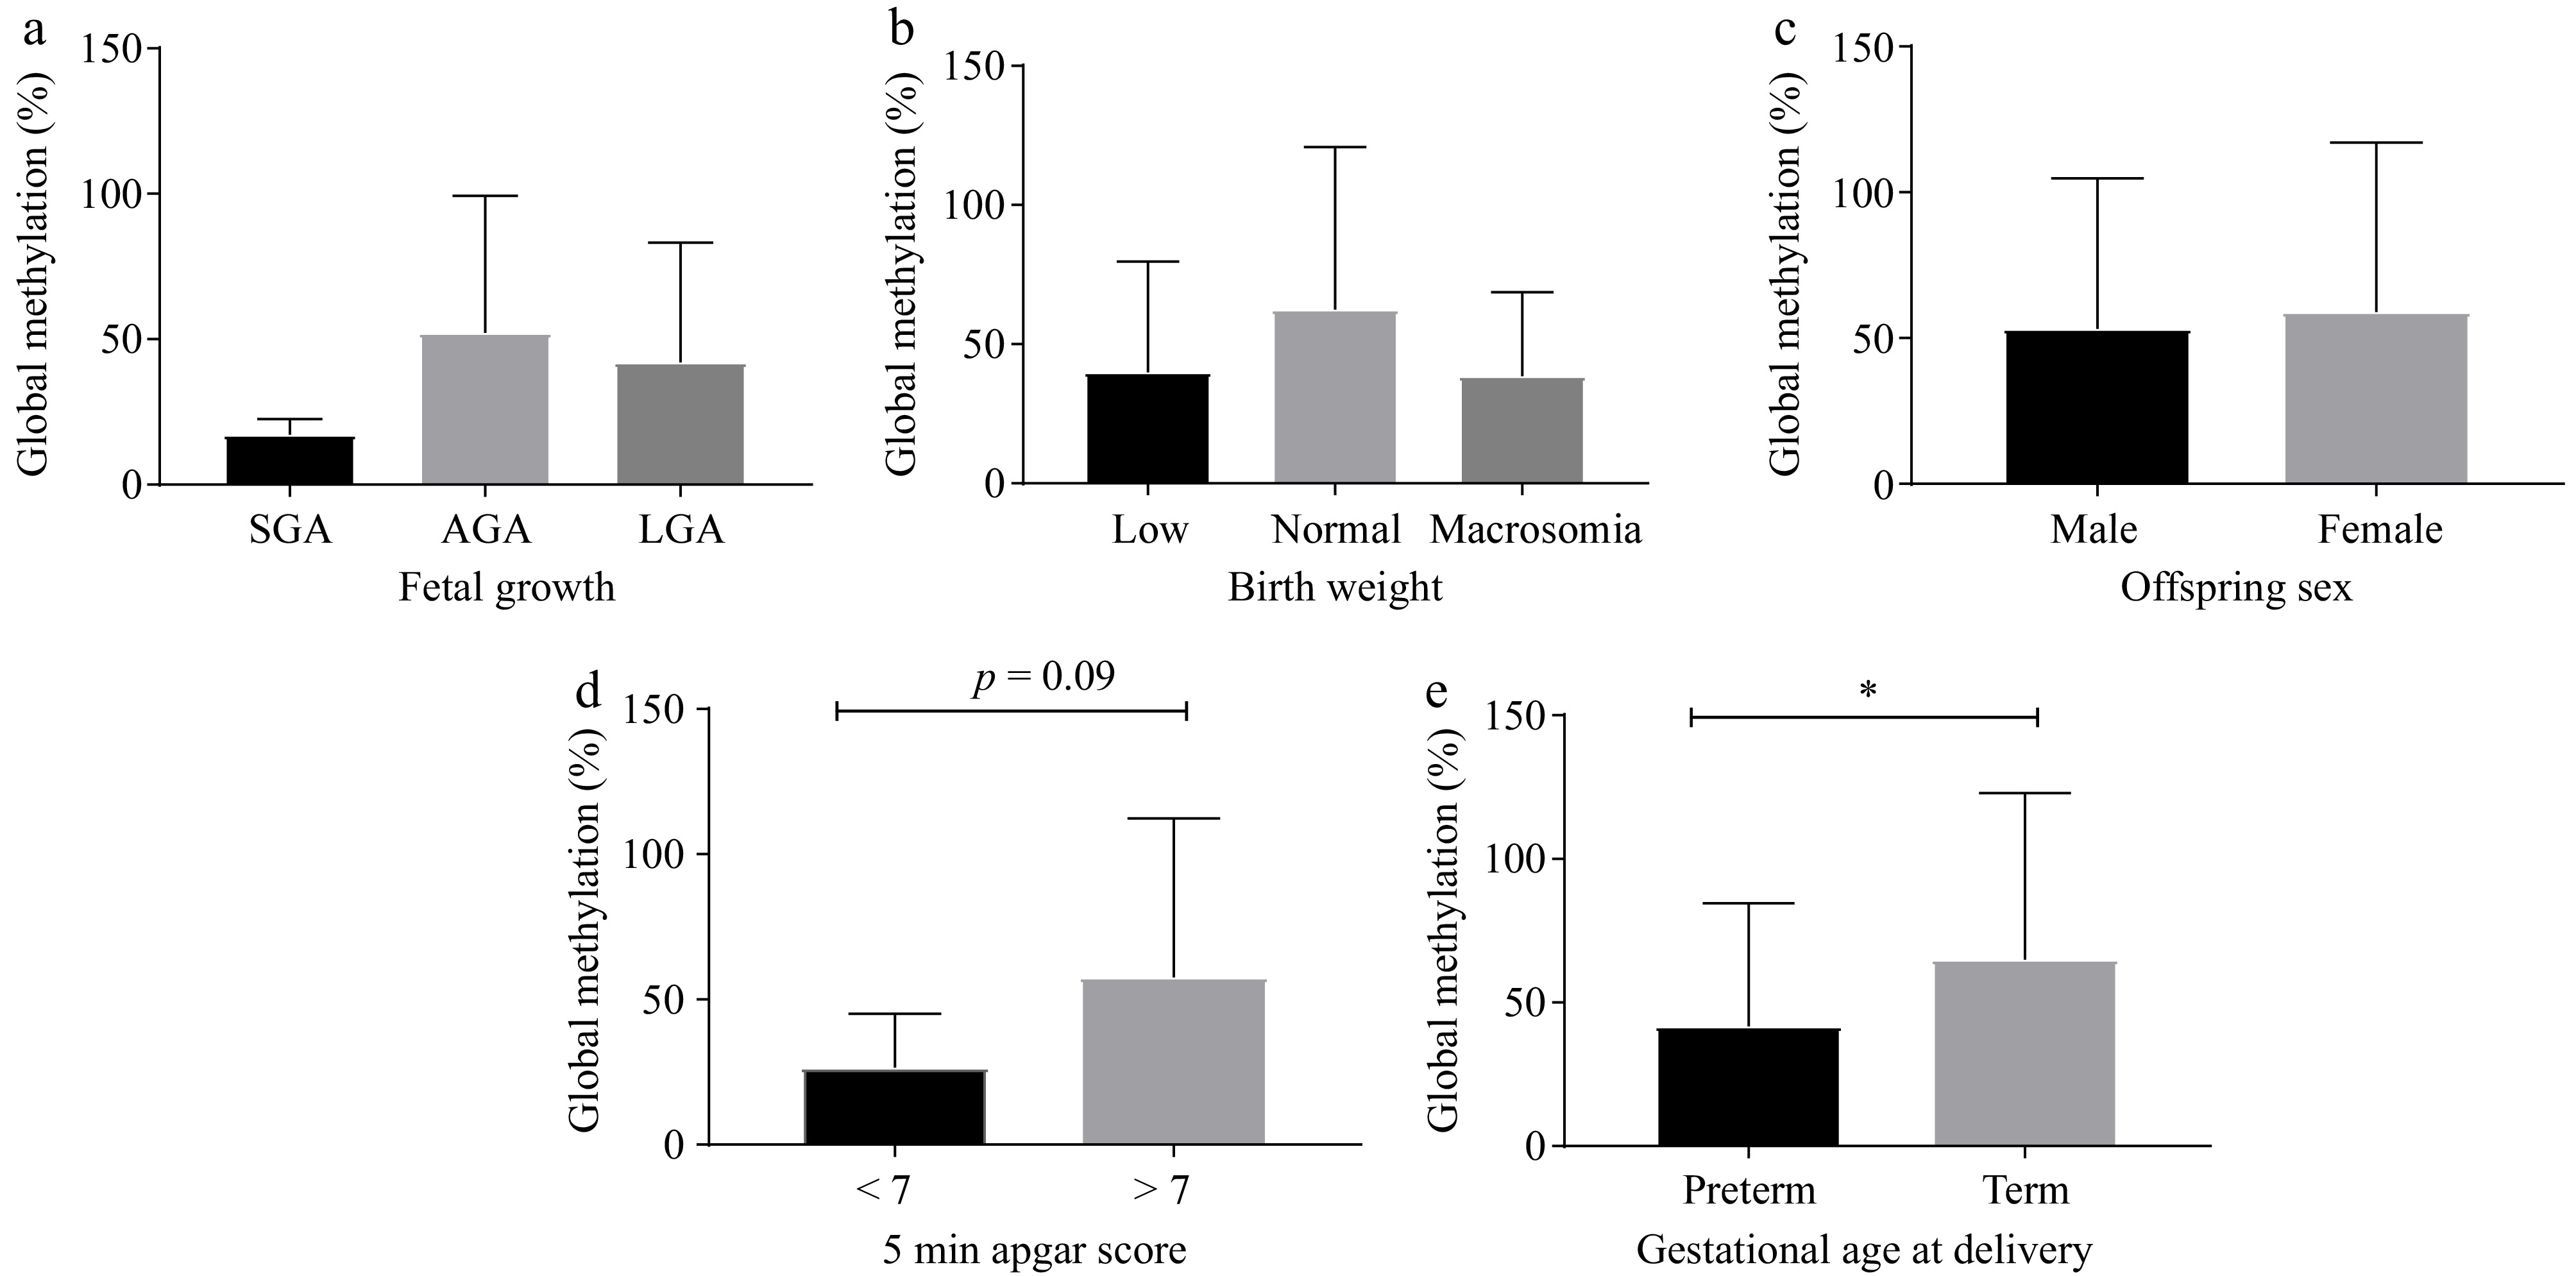
Figure 1.
Global DNA methylation is associated with birth outcomes. The percentage of global DNA methylation was compared with (a) fetal growth in utero, (b) birth weight, (c) offspring sex, (d) 5 min Apgar score, and (e) GA at delivery (n = 106−166). * p < 0.05. Abbreviations: GA, gestational age; SGA, small for gestational age; AGA, average for gestational age; LGA, large for gestational age; preterm birth: < 37 weeks gestation; term, full term: ≥ 37 weeks gestation.
-
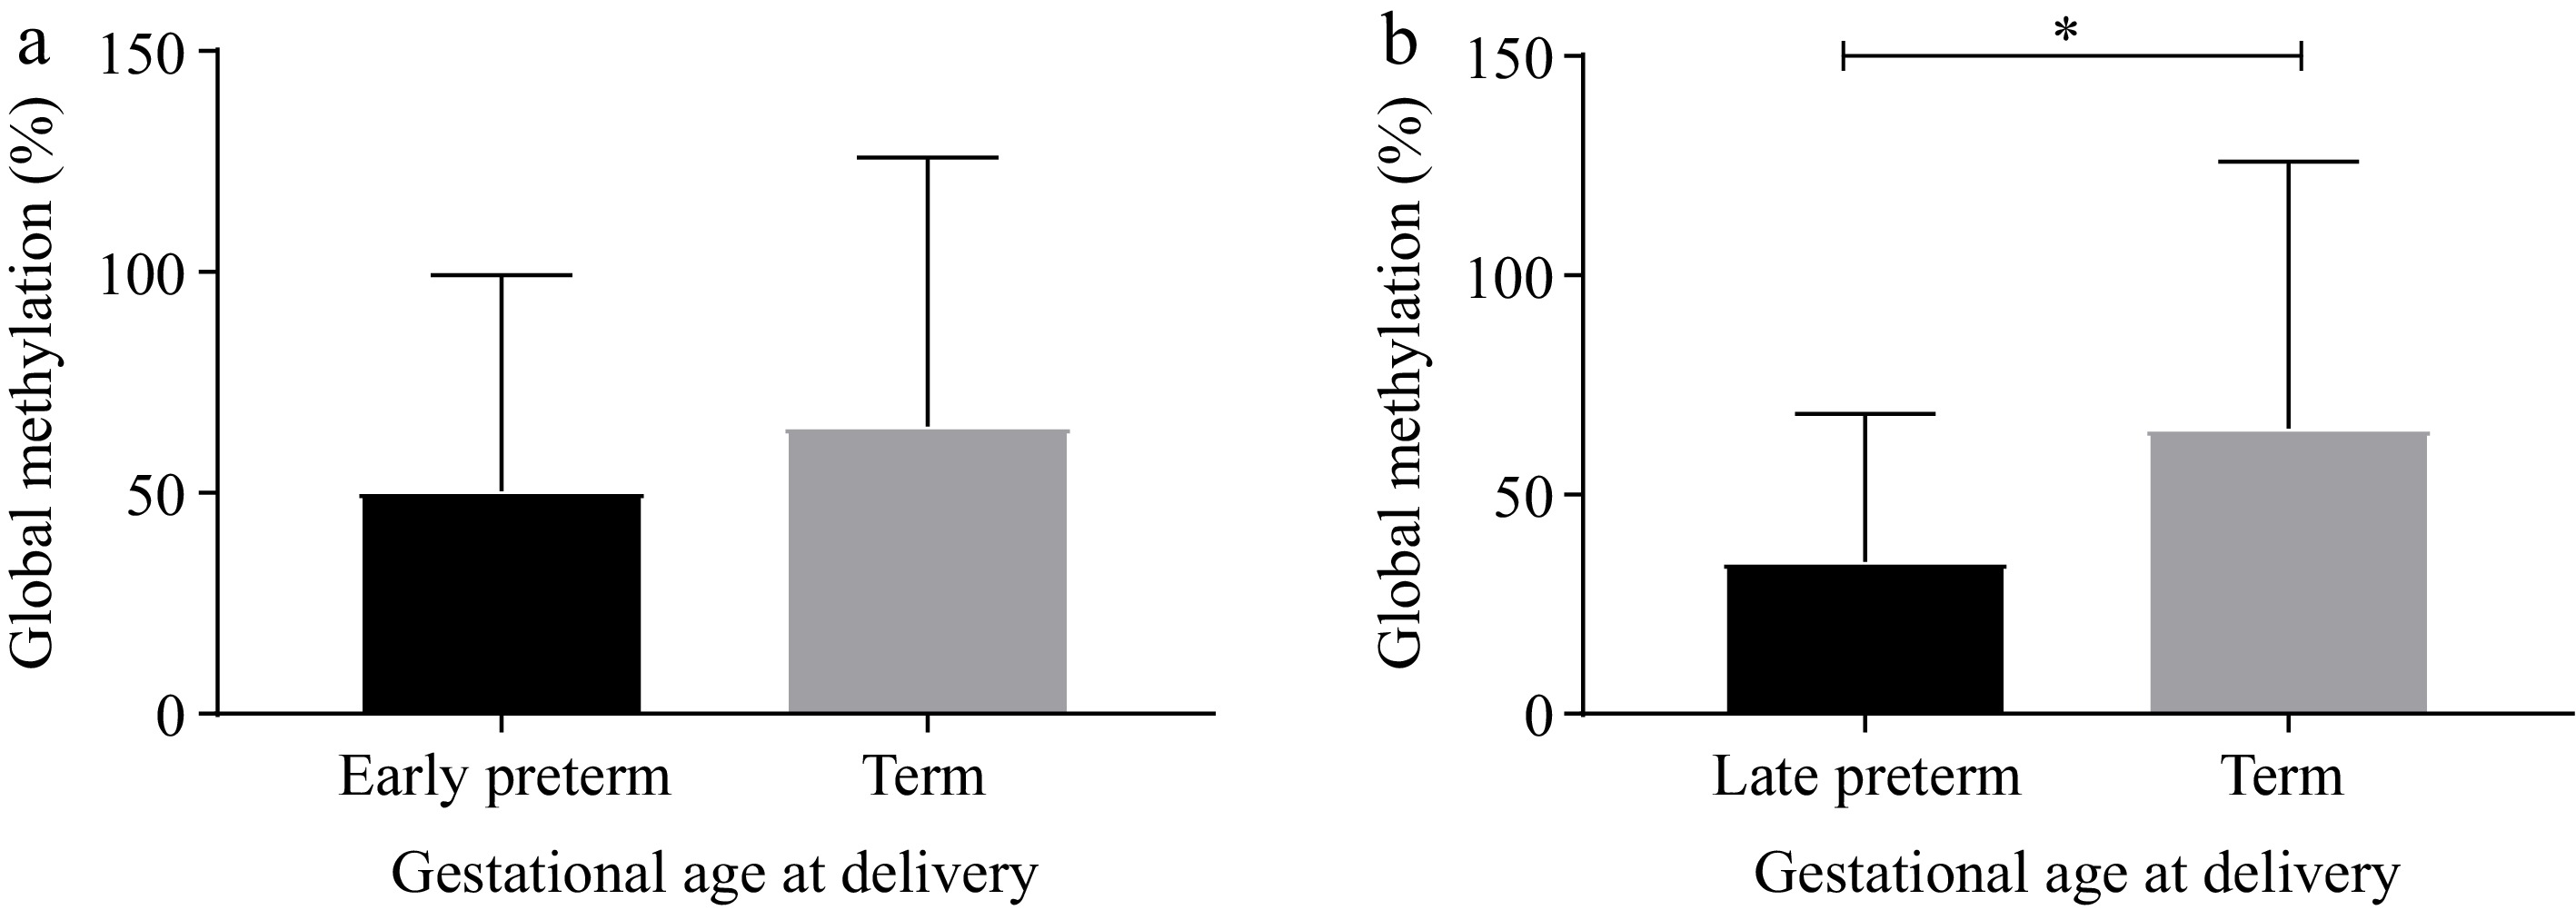
Figure 2.
Global DNA methylation stratified by early and late preterm birth. The percentage of global DNA methylation between (a) early preterm (20−33 weeks gestation) vs term births (37–40 weeks gestation), and (b) late preterm birth (34−36 weeks gestation) vs term births (37–40 weeks gestation). * p < 0.05.
-
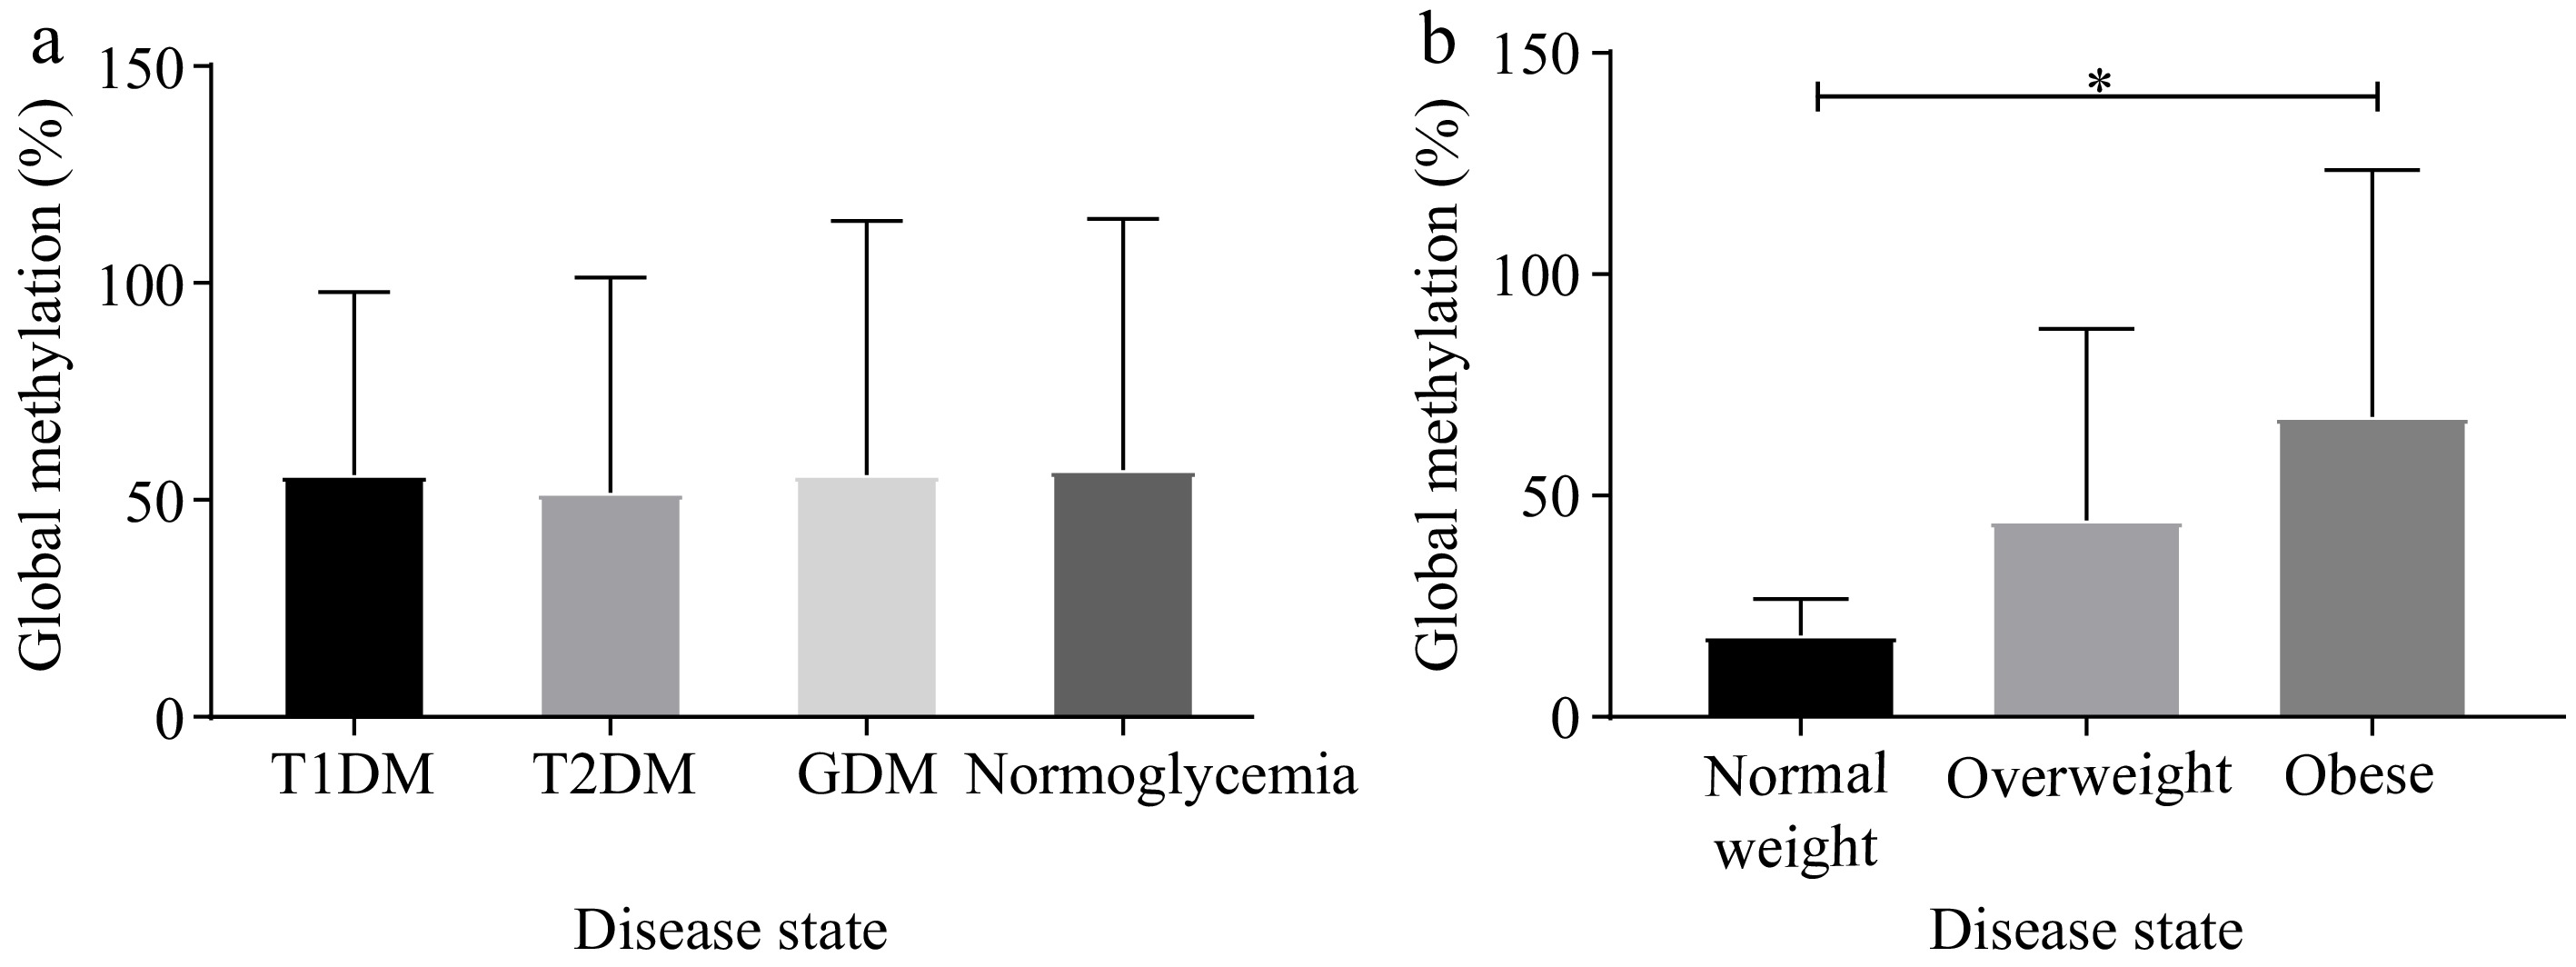
Figure 3.
Global DNA methylation differed according to obesity status not diabetes type. The percentage of global DNA methylation stratified according to diabetes or BMI categories. (a) Pregnant women with T1DM (n = 16), T2DM (n = 67), GDM (n = 39), and normoglycemia (n = 55), and (b) pregnant women with normal weight (n = 10), overweight (n = 33), and obesity (n = 85). *p < 0.05. T1DM: Type 1 diabetes, T2DM: Type 2 diabetes, GDM: gestational diabetes mellitus, BMI: body mass index.
-
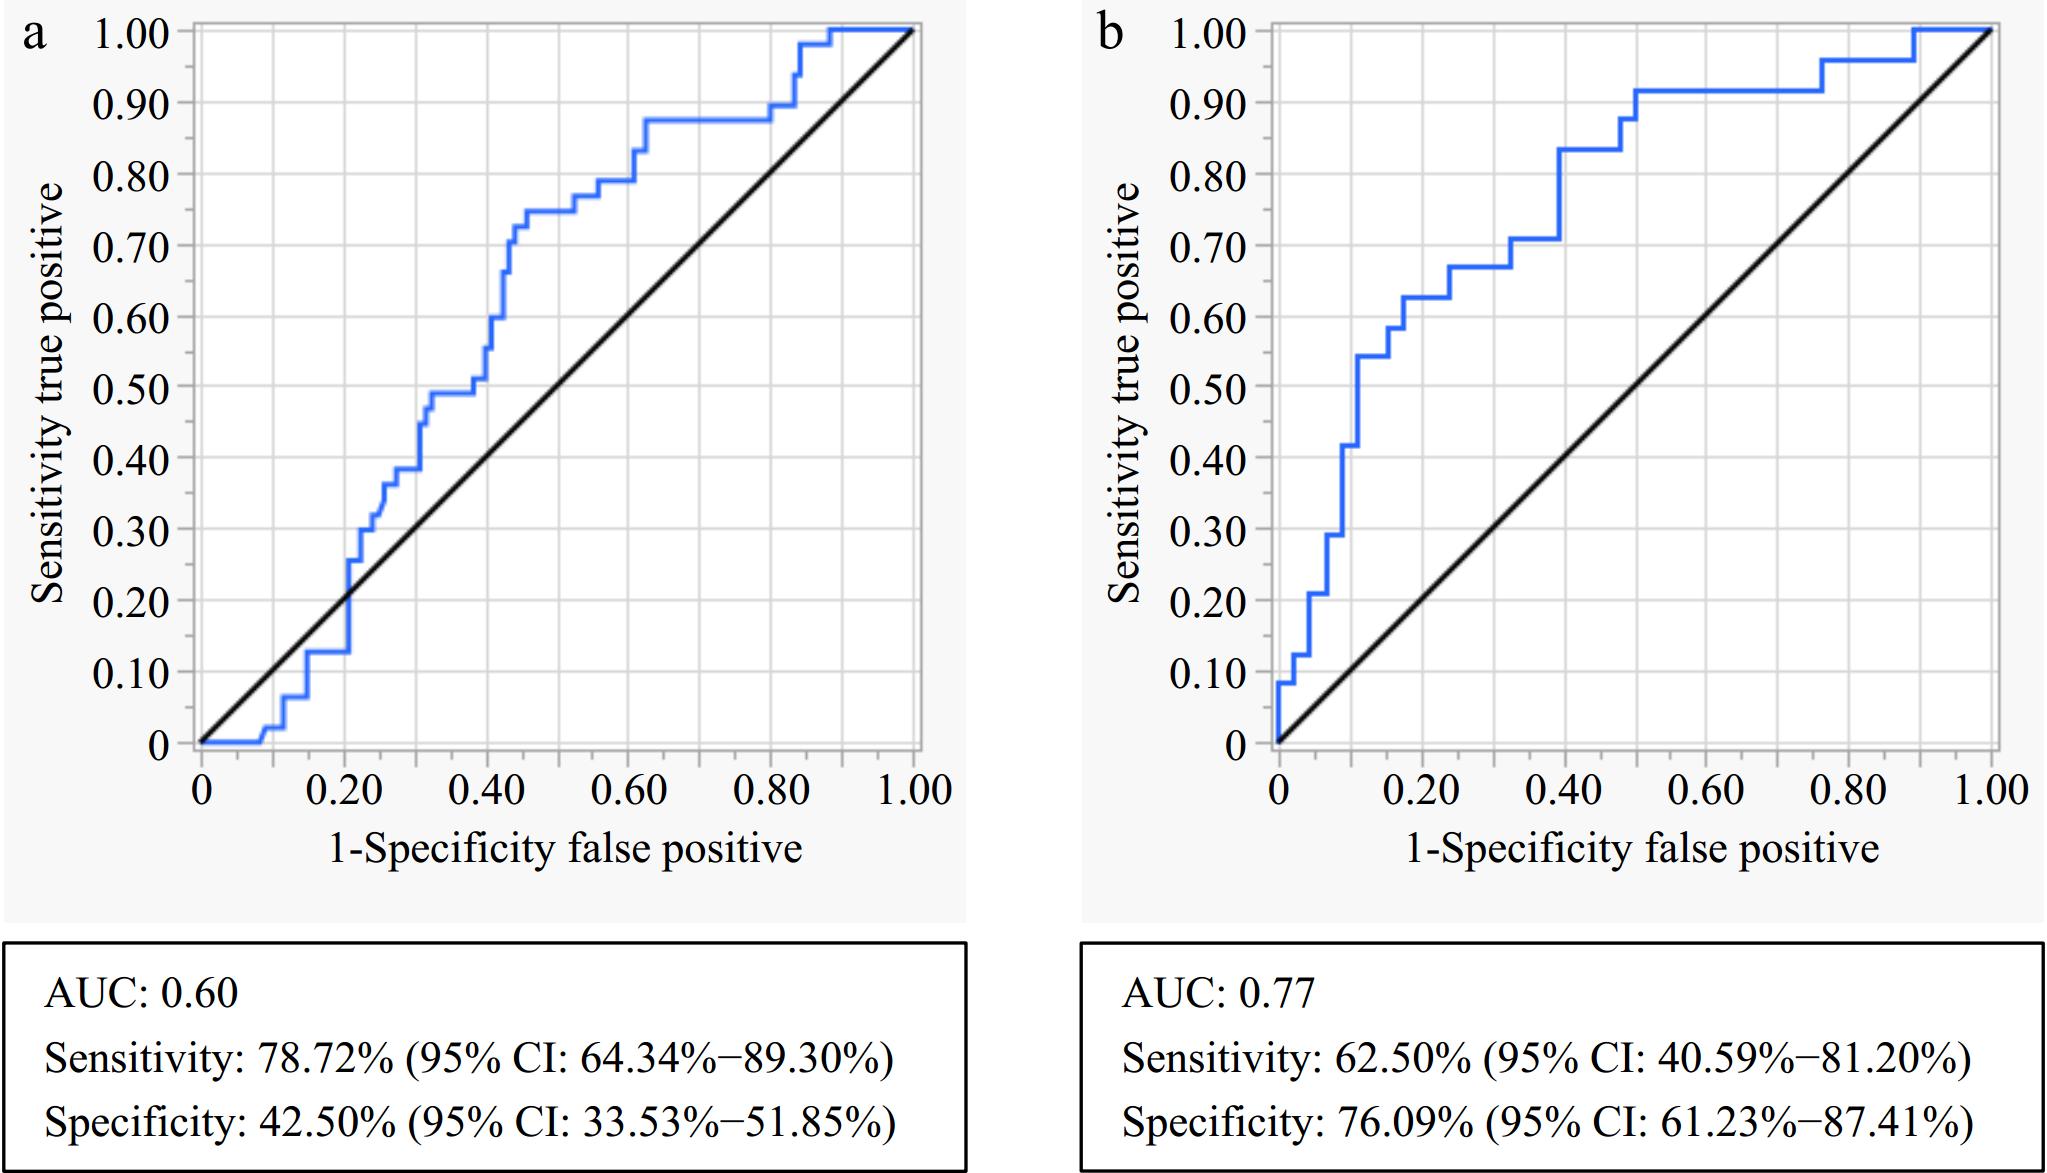
Figure 4.
ROC curve analysis for discriminating between preterm and term birth in all participants. (a) Global DNA methylation only, and (b) combined model of global methylation, HbA1c, and total adiponectin. ROC, Receiver operating characteristic; AUC, Area under the curve; HbA1c, glycated haemoglobin.
-
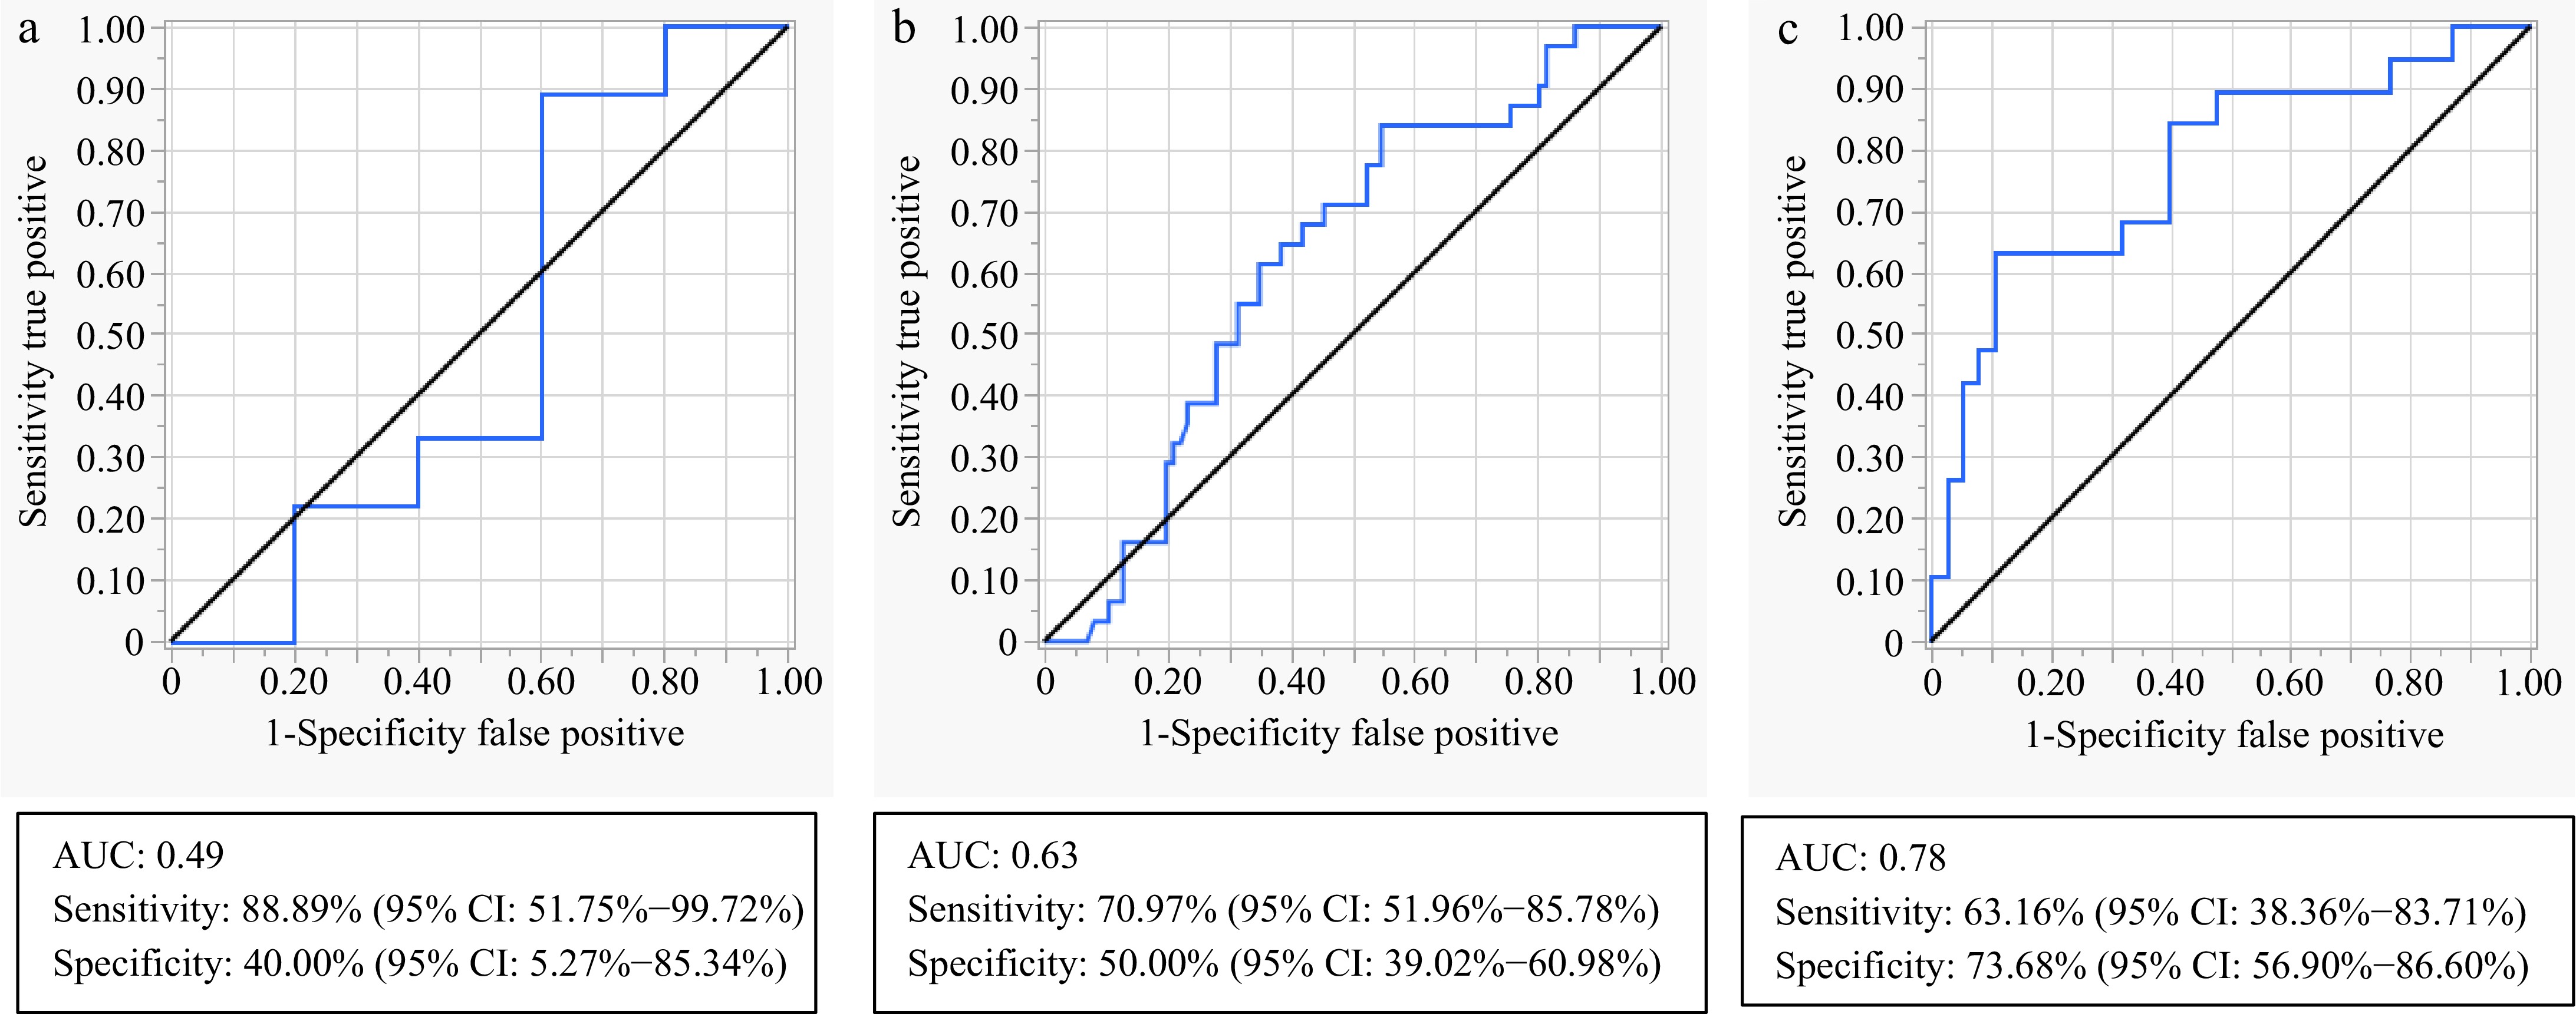
Figure 5.
ROC curve analysis for discriminating between preterm and term birth when stratifying according to BMI categories. (a) Global DNA methylation in normal weight women, (b) global DNA methylation in overweight and obese women, and (c) a combined model of global methylation, HbA1c, and total adiponectin in overweight and obese women. ROC, Receiver operating characteristic; AUC, Area under the curve; BMI, body mass index; HbA1c, glycated haemoglobin.
-
Variable Controls T1DM T2DM New T2DM GDM p-value N 69 26 53 24 58 Age (years) 31.0 (27.0−36.6)a,b 29.0 (27.0−32.0)c,d 36.0 (30.0−37.0)a,c 33.5 (30.0−36.0) 35.5 (32.0−38.0)b,d <0.001 BMI (kg/m2) 31.7 (27.6−39.4)a 28.3 (23.8−33.5)b 32.5 (28.8−37.9)c 30.3 (28.8−34.4)e 38.9 (32.8−43.7)a,b,c,e <0.001 Weight (kg) 82.2 (70.4−94.4)b 71.7 (60.4−84.9)e,d 84.8 (73.1−98.9)e,f 85.4 (75.0−93.4) 101.0 (85.0−112.7)b,d,f <0.001 GA at recruitment (weeks) 22 (20−25)e,a 16.5 (14−21)e,b,f 20 (16−22)d,h 25 (20−26.5)f,h 25 (24−26)a,b,d <0.001 HbA1c (%) 5.2 (5.0−5.4)b,d,c 9.3 (7.6−10.1)b,g,e 7.7 (6.5−9.3)d,i 6.9 (5.9−8.7)c,e,h 5.7 (5.4−6.1)g,i,h <0.001 0-h OGTT (mmol/L) 3.9 (3.7−4.3)b,d − − 7.5 (6.7−9.9)d,a 5.4 (5.1−6)b,a <0.001 1-h OGTT (mmol/L) 5.6 (4.4−6.8)b,d − − 12.8 (12.1−14.9)d,a 9.9 (8.2−11)b,a <0.001 2-h OGTT (mmol/L) 4.5 (5.1−6.5)b,d − − 12.6 (11.2−15.9)d,g 8.8 (6.7−9.5)b,g <0.001 History of hypertension in pregnancy (Yes) 4 (7.7)e,h 3 (5.77) 19 (36.5)e 8 (15.4) 18 (34.6)h 0.001 All data are expressed as the median (25th–75th percentiles). p-values were calculated using the Kruskal Wallis test and Dunn's multiple comparisons. Similar superscripts indicate statistical significance between groups: e,h p < 0.05, a,c,f p < 0.01, b,d,g,i p < 0.001. T1DM, type 1 diabetes mellitus; T2DM, type 2 diabetes mellitus; GDM, gestational diabetes mellitus; GA, gestational age; BMI, body mass index, HbA1c, glycated haemoglobin, OGTT, oral glucose tolerance test. Table 1.
Clinical characteristics of study participants.
-
Variable Controls T1DM T2DM New T2DM GDM p-value Insulin (μU/mL) 6.9 (1.4−29.1) 22.1 (5.8−37.9) 19.3 (3.4−40.4) 8.9 (3.5−25.0) 21.7 (4.8−54.6) 0.2161 C-peptide (ng/mL) 1.7 (0.8−3.1)a 0.5 (0−1.2)a,b,c 2.0 (1.0−2.6)b 1.8 (1.0−2.4) 2.2 (1.4−4.0)c <0.0001 Total Adiponectin (μg/mL) 7.6 (4.5−12.3)d 8.5 (4.2−16.1)e 4.8 (3.7−8.2) 3.9 (3.4−6.9) 4.2 (2.9−7.6)d,e 0.0016 HMW Adiponectin (μg/mL) 4773 (1962−7247) 10,210 (4,182−15,710)f 1,547 (1,154−2,276)f 2,259 (1,246−4,604) 2,292 (1,131−4,483) 0.0076 Triglycerides (mg/dL) 311.4 (232.8−426.4) 314.9 (279.5−539.0) 327.3 (233.0−698.5) 416.5 (284.9−554.9) 361.9 (311.9−492.7) 0.3861 All data are expressed as the median (25th–75th percentiles). p-values were calculated using the Kruskal Wallis test and Dunn's multiple comparisons. Similar superscripts indicate statistical significance between groups: d,e,f p < 0.05, a,b p < 0.01, e p < 0.001, c p < 0.0001. T1DM, type 1 diabetes mellitus; T2DM, type 2 diabetes mellitus; GDM, gestational diabetes mellitus; GA, gestational age; BMI, body mass index, HbA1c, glycated haemoglobin, OGTT, oral glucose tolerance test. Table 2.
Metabolic characteristics of study participants.
-
Variable Model β co-efficient 95% CI p-value Global
methylation (%)Unadjusted model 0.328 0.046−0.611 0.023 Adjusted model 1 0.350 0.033−0.667 0.031 Adjusted model 2 0.428 0.079−0.776 0.016 Univariable regression analysis: Unadjusted model assessing the association between global DNA methylation and preterm birth. Multivariable regression analysis: Adjusted model 1: BMI; Adjusted model 2: age, BMI and GA. β, beta; CI, Confidence interval; BMI, body mass index; GA, gestational age. Statistical significance is indicated by p < 0.05. Table 3.
Association between global DNA methylation and preterm birth.
Figures
(5)
Tables
(3)