-
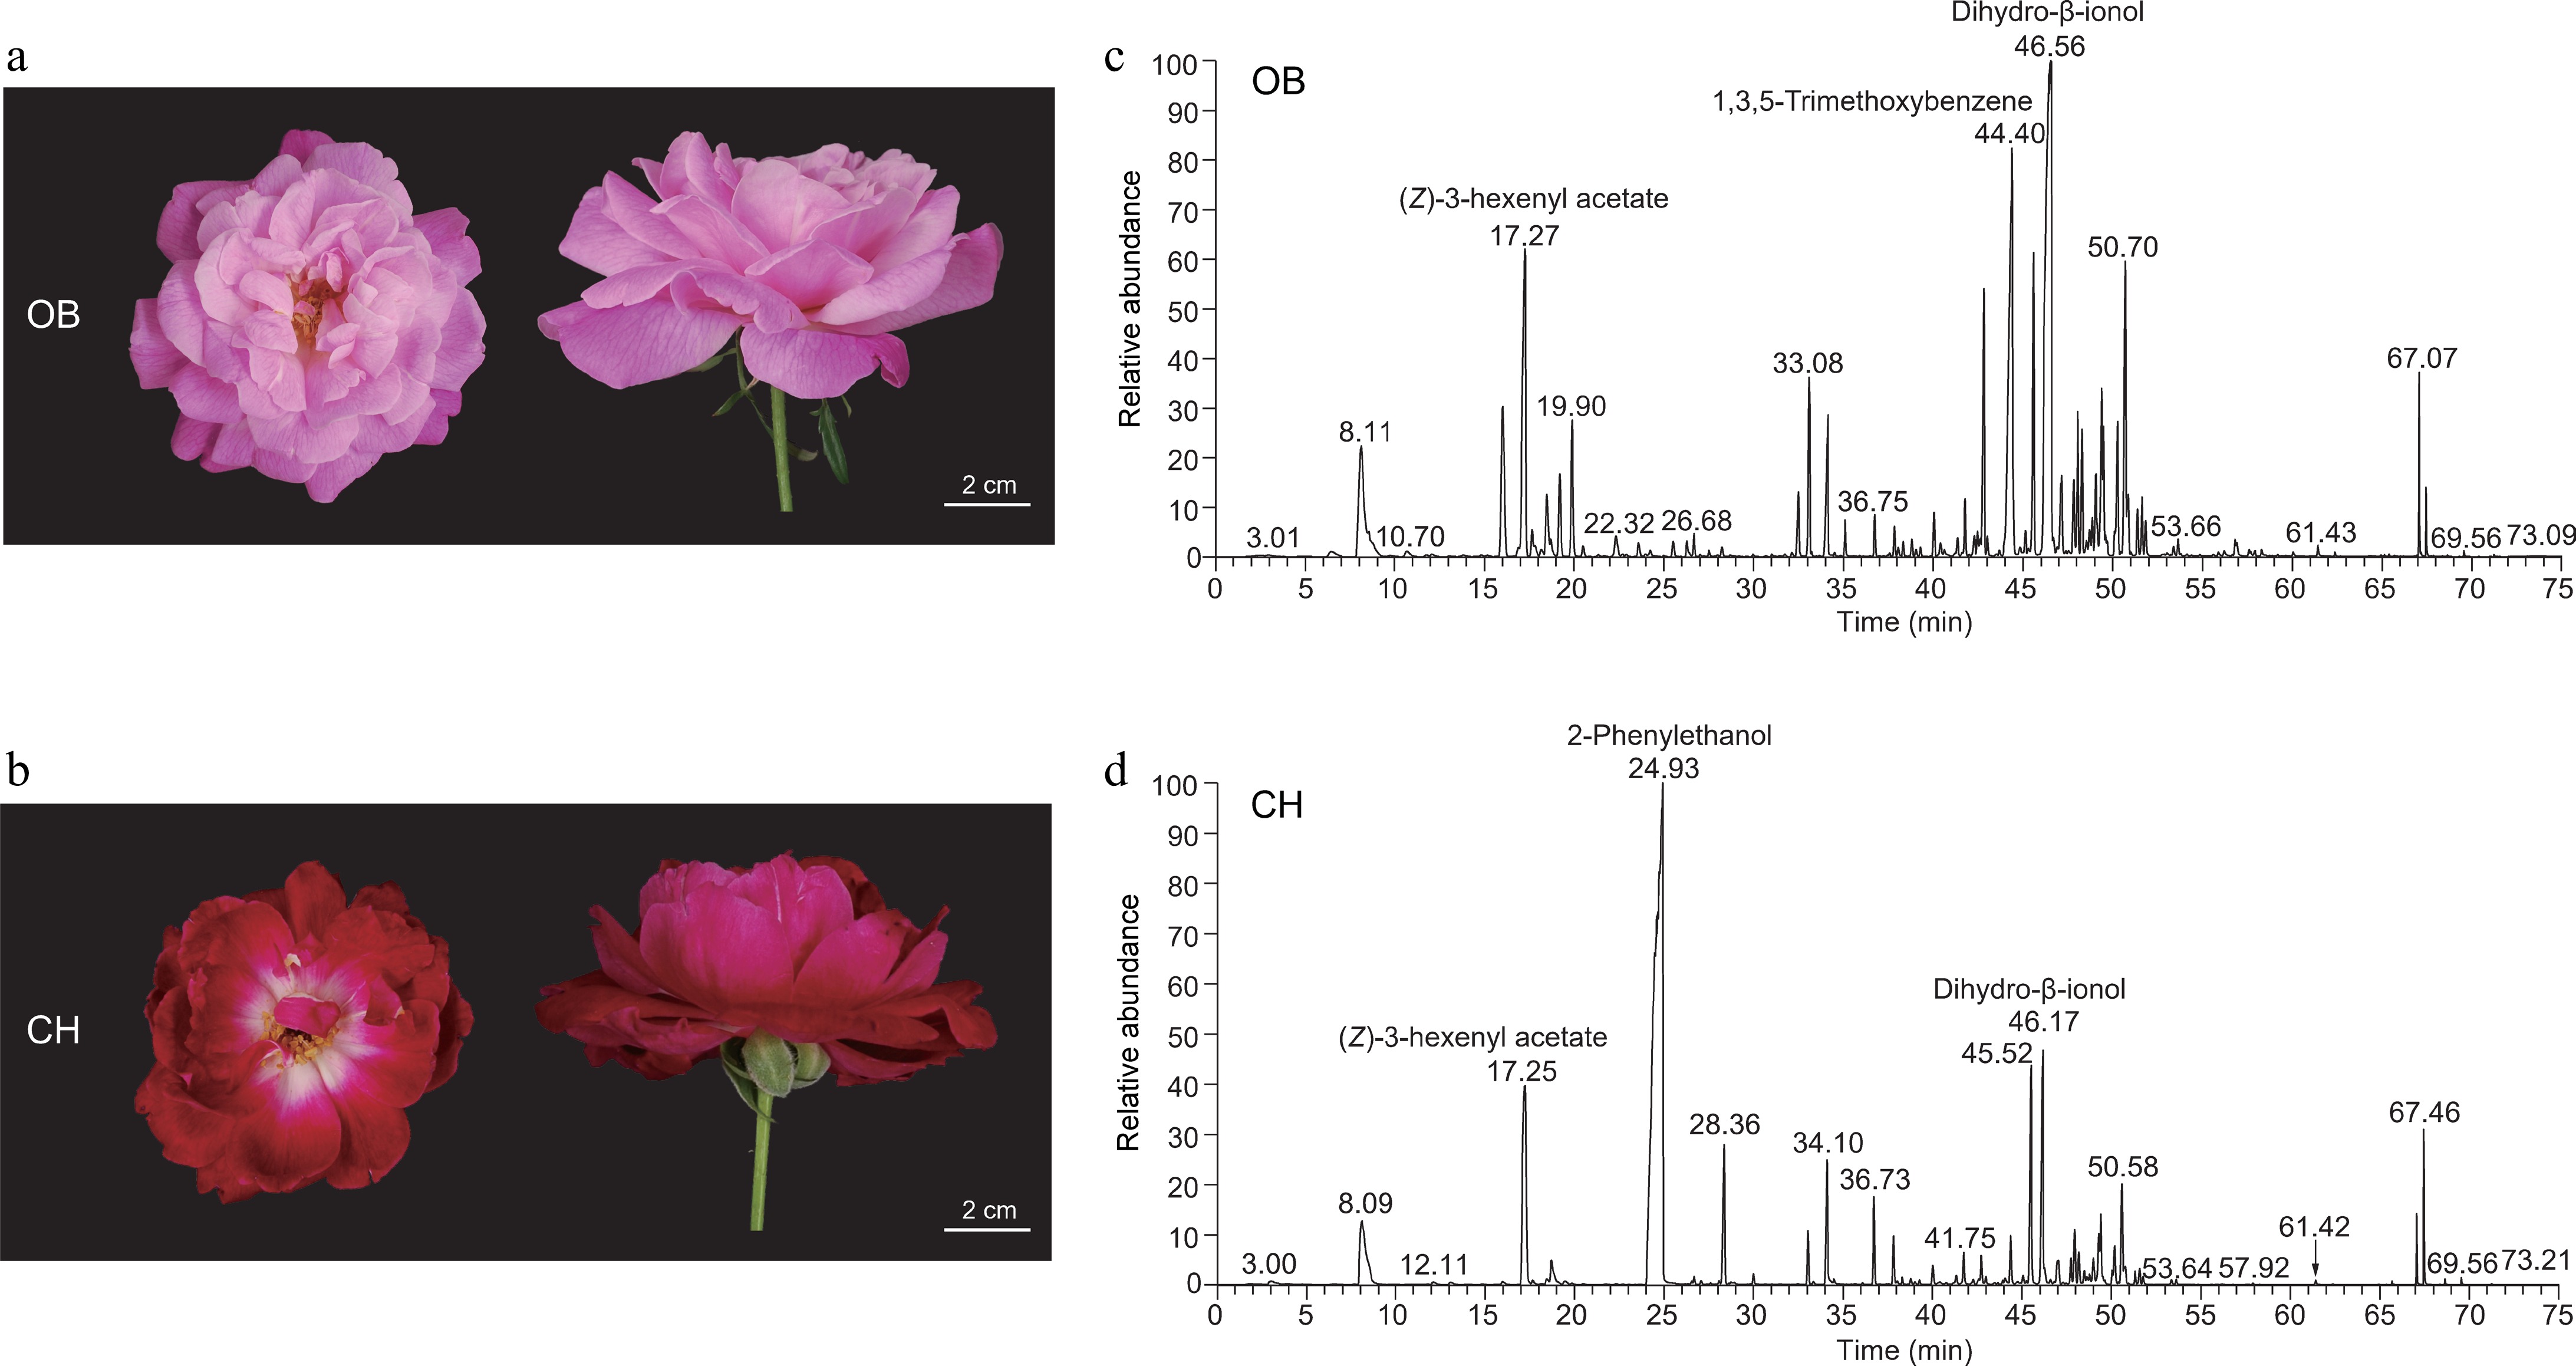
Figure 1.
Flower phenotypes and volatile compounds of 'OB' and 'CH'. (a), (b) Floral phenotypes of (a) 'OB', and (b) 'CH' at S3 (full opening stage). (c), (d) Chromatograms for the S3 petals of (c) 'OB', and (d) 'CH'. The three highest peaks were labeled with annotations in chromatograms of two cultivars.
-
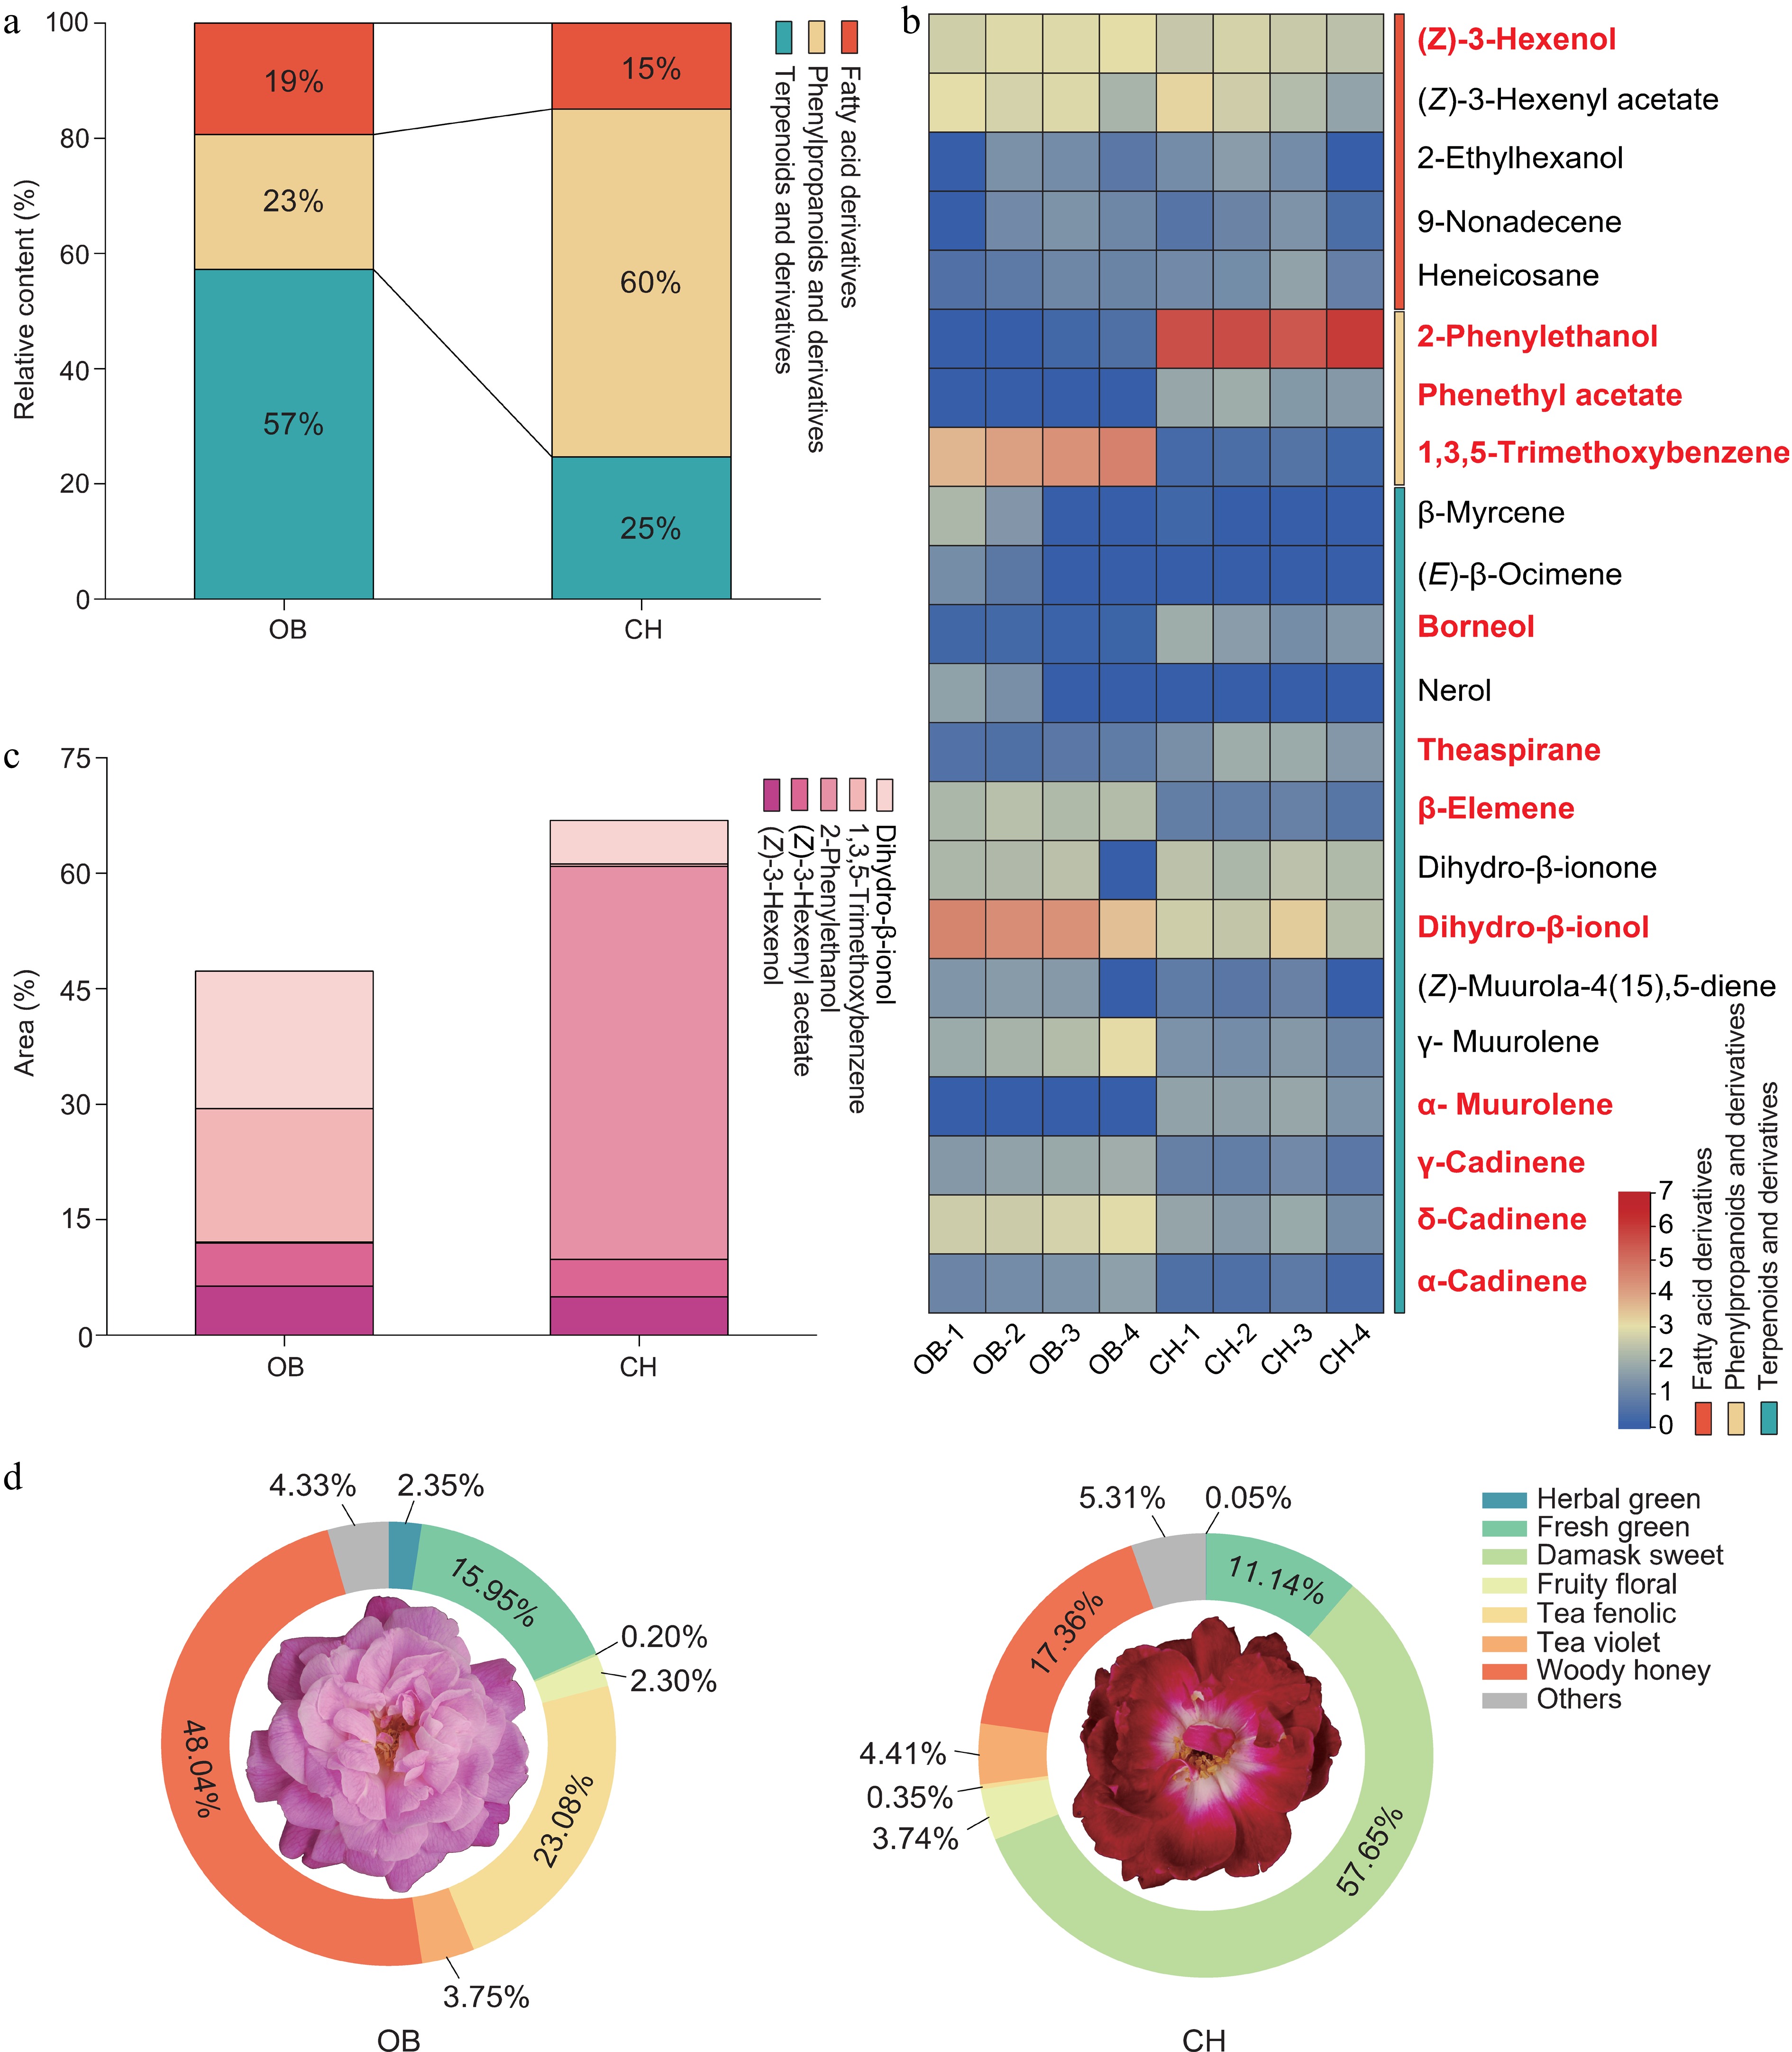
Figure 2.
The main VOCs of 'OB' and 'CH'. (a) Relative content of VOCs in different scent components of two cultivars. (b) Heatmap showed the relative content (log2-transformed peak area) of 22 major floral fragrance components. The text in bold and red indicates the significantly changed VOCs. (c) Area of the top five VOCs. (d) Classification of the aroma types of 'OB' and 'CH'.
-
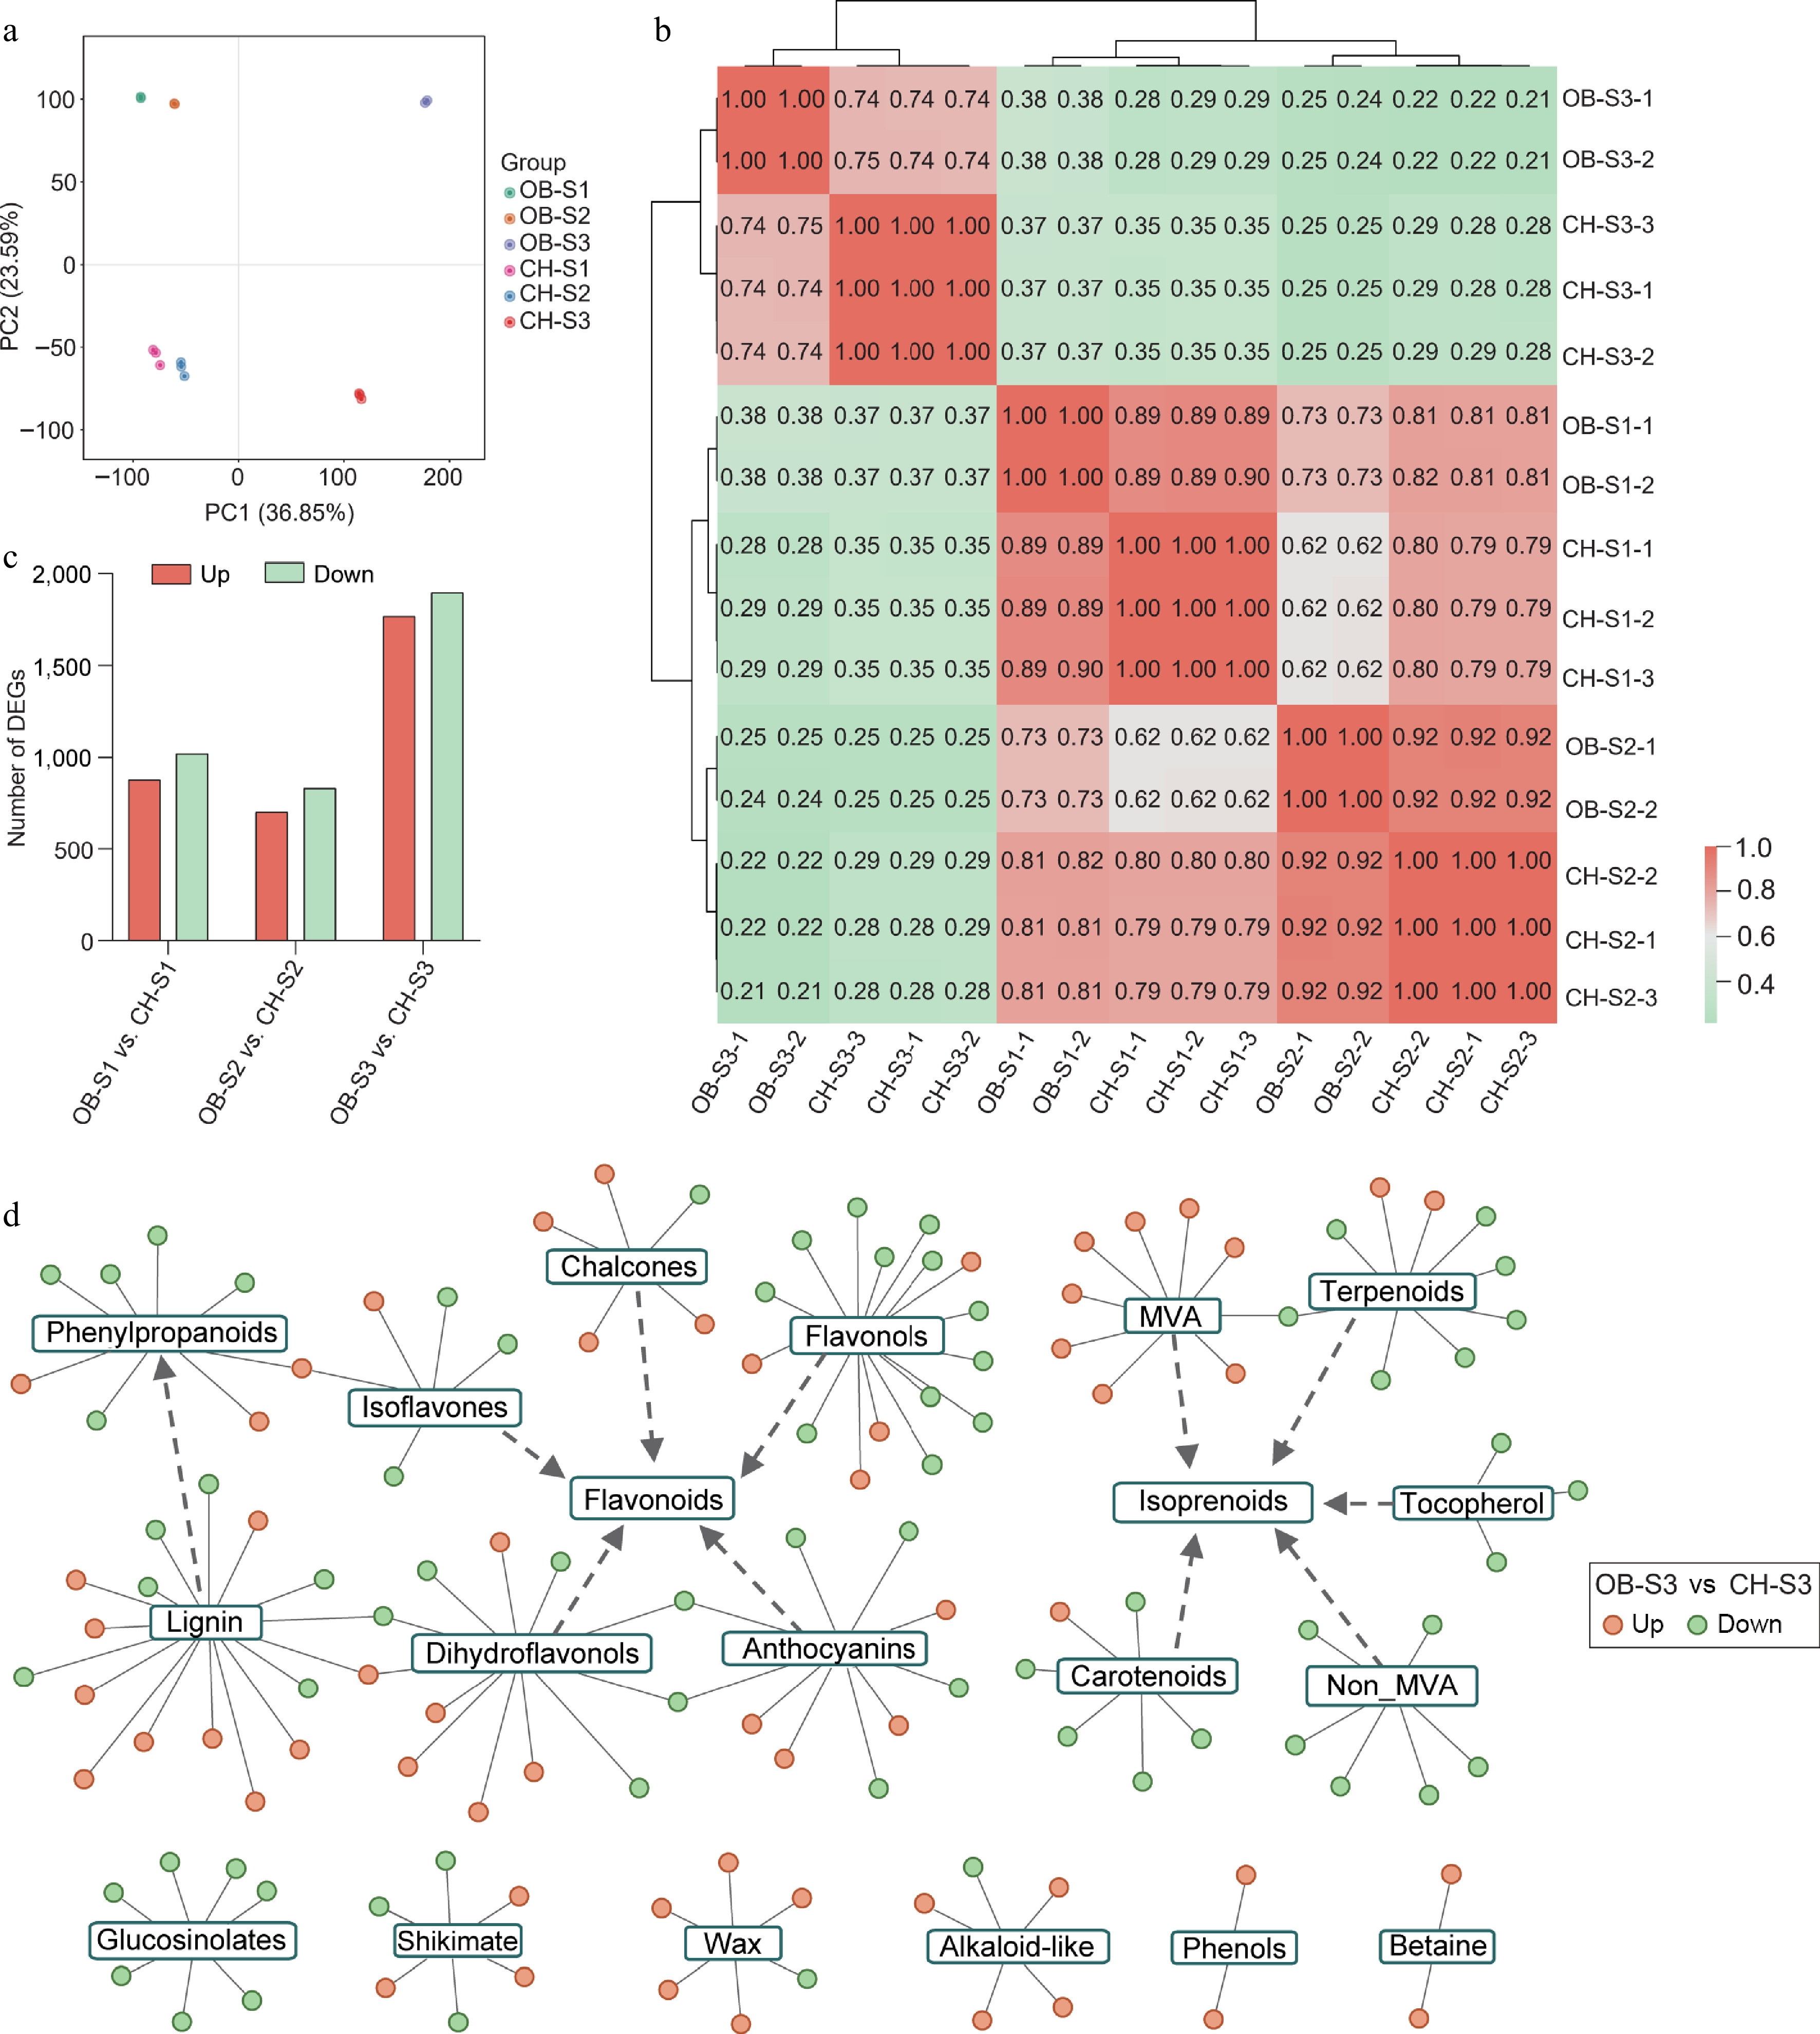
Figure 3.
Analysis of transcriptomes of 'OB' and 'CH' at S1−S3. (a) PCA showing the clustering of transcriptome of floral development stages (S1−S3) in R. chinensis petals. (b) Correlation analysis matrix among 'OB' and 'CH' at different development stages based on transcriptomes. (c) Statistics of DEGs in the comparisons of 'OB' and 'CH'. (d) Network of secondary metabolism of identified DEGs between two cultivars at the S3 stage. The orange and green cycles represent up- and down-regulated DEGs in 'OB' compared to 'CH'. The edges connect the DEGs with corresponding pathways.
-
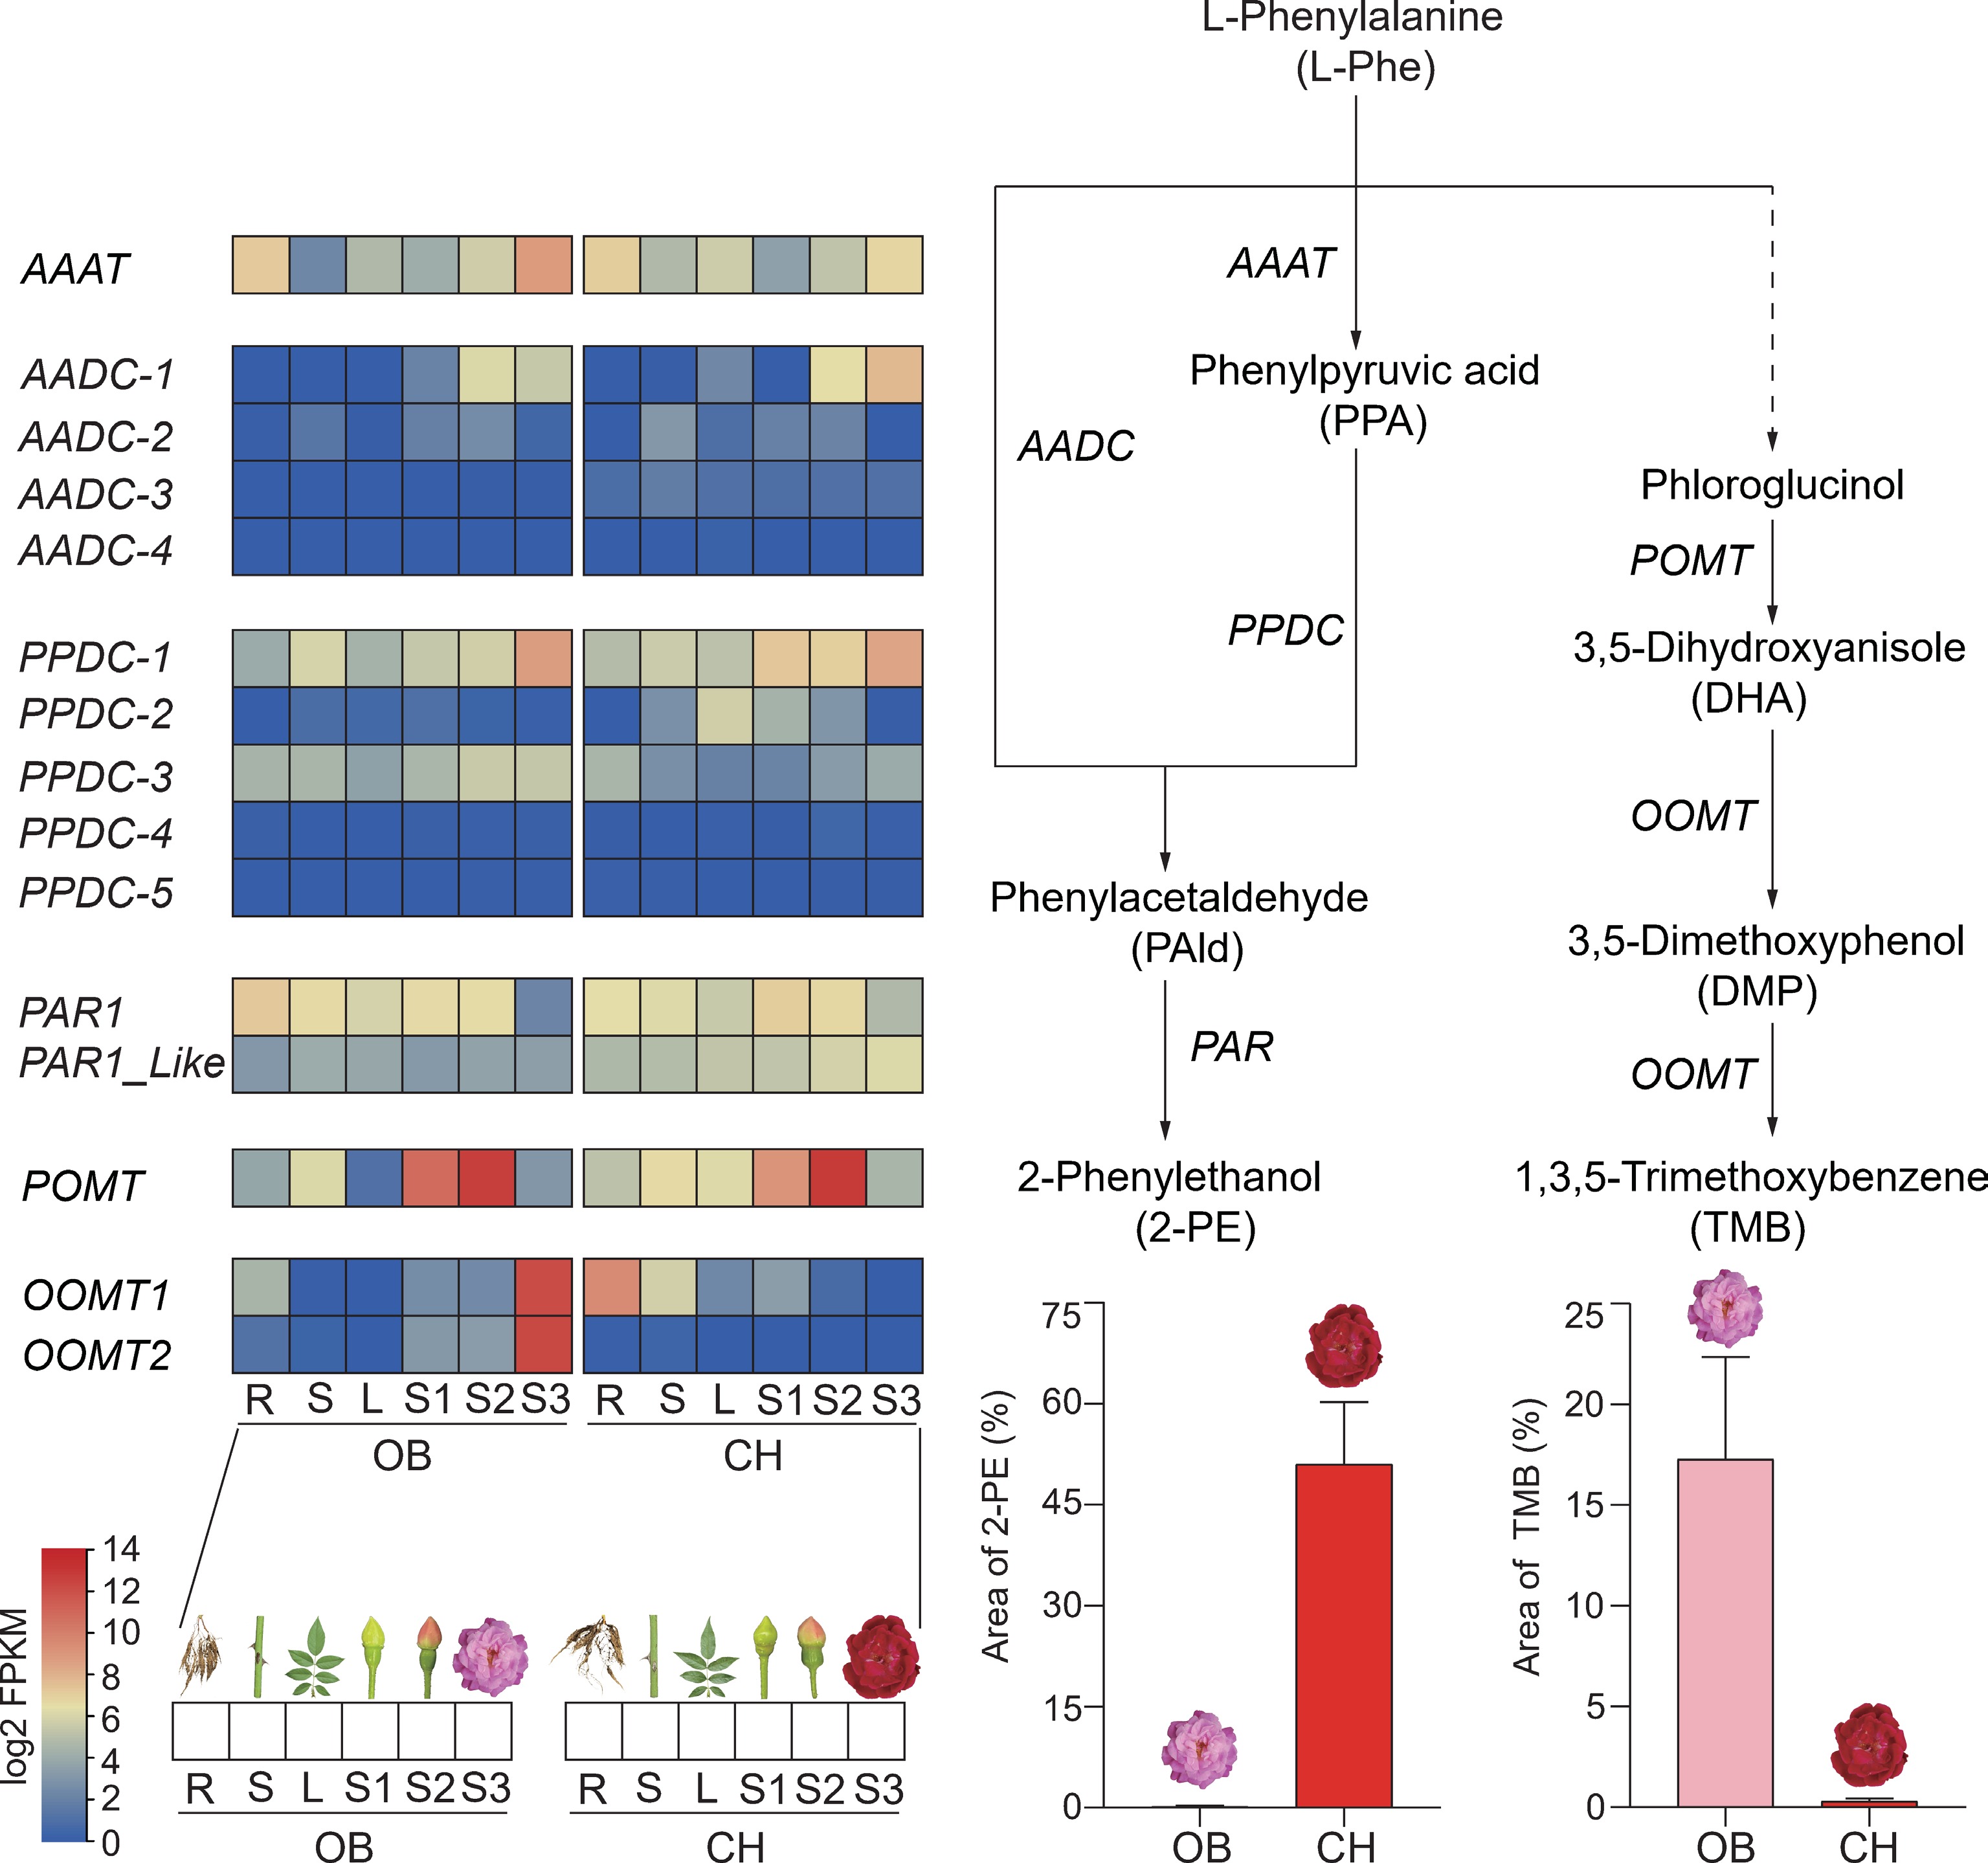
Figure 4.
Metabolomic and transcriptomic analysis of phenylpropanoid synthesis pathways in six tissues of 'OB' and 'CH'. POMT, phloroglucinol O-methyltransferase; OOMT, orcinol O-methyltransferase; AAAT, aromatic amino acid aminotransferase; AADC, aromatic amino acid decarboxylase; PPDC, phenylpyruvic acid decarboxylase; PAR, phenylacetaldehyde reductase; R, root; S, stem; L, leaf.
-
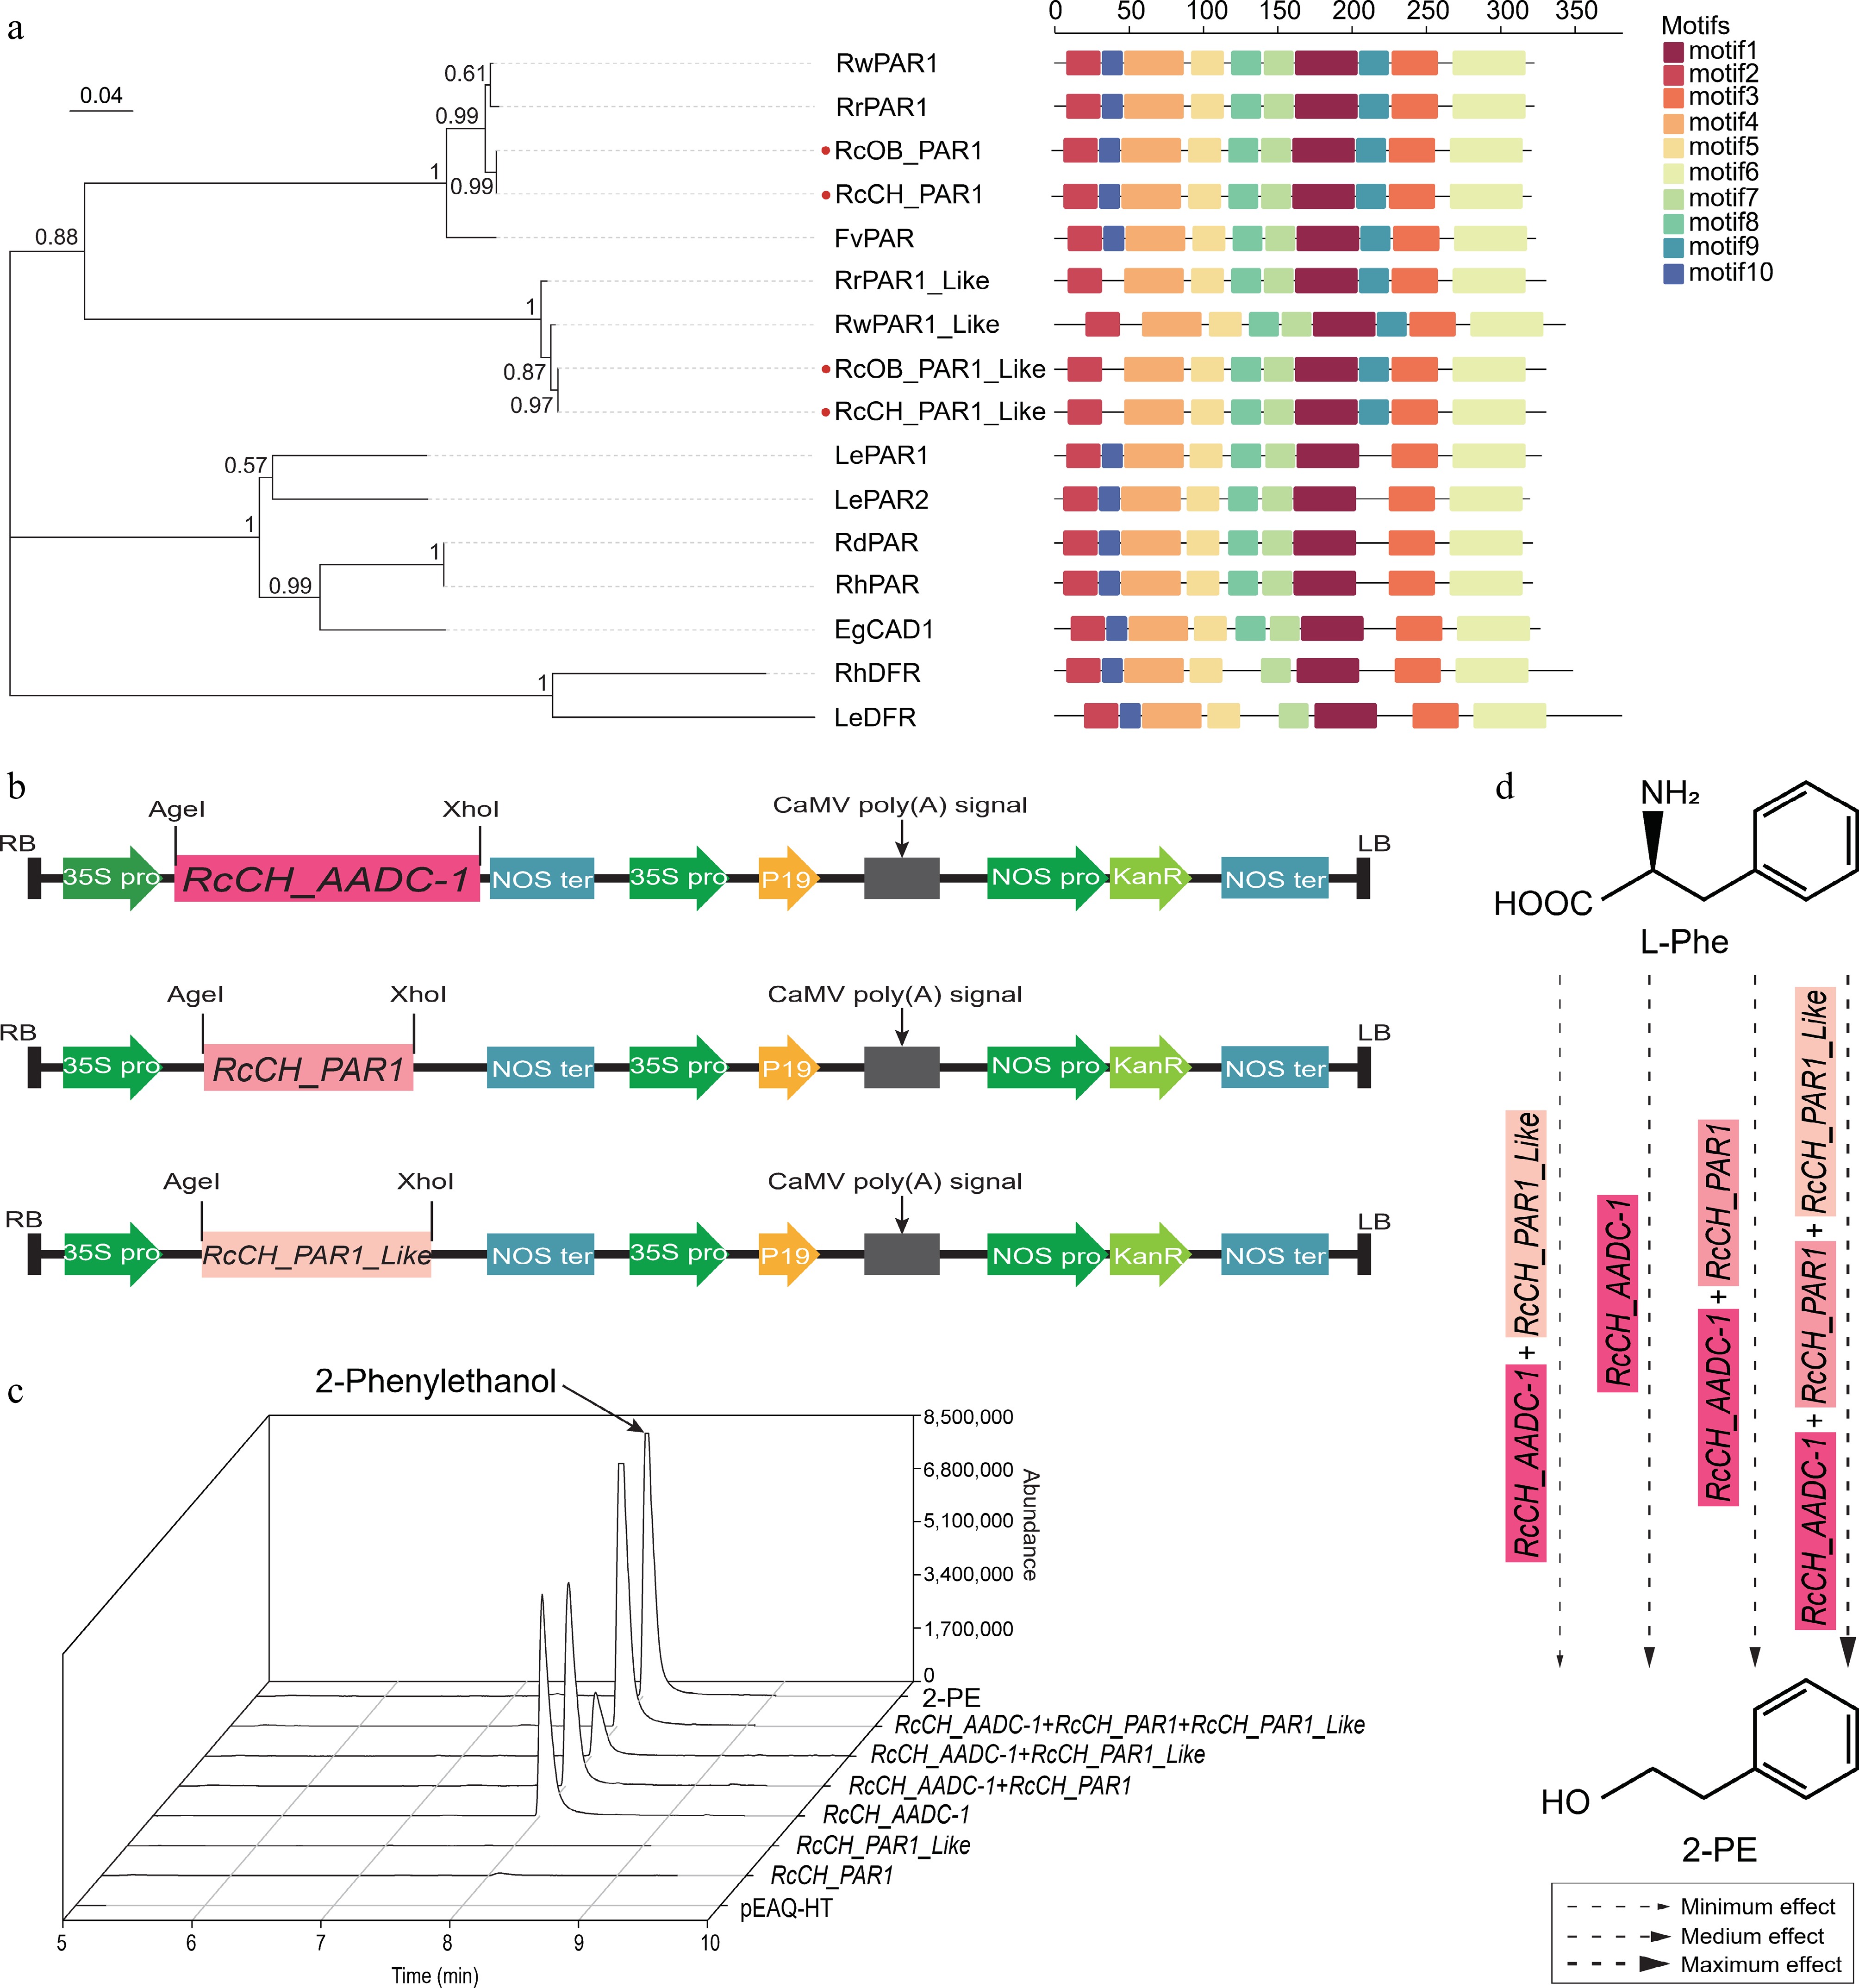
Figure 5.
The characterization of the RcCH_AADC-1 and RcCH_PARs genes. (a) Phylogenetic analysis of PARs from R. chinensis and other plants by MEGA. Protein IDs are shown in Supplementary Table S6. (b) Recombinant pEAQ-HT vectors with RcCH_AADC-1, RcCH_PAR1, and RcCH_PAR1_Like. (c) The relative contents of 2-PE in empty pEAQ-HT vector, RcCH_AADC-1, and RcCH_PARs transgenic lines. (d) The potential 2-PE synthesis pathway. Arrows of different sizes indicate the effect of RcCH_AADC-1 and RcCH_PARs on the formation of 2-PE. Thin, medium, and coarse arrows represent minimum, medium, and maximum effect.
Figures
(5)
Tables
(0)