-
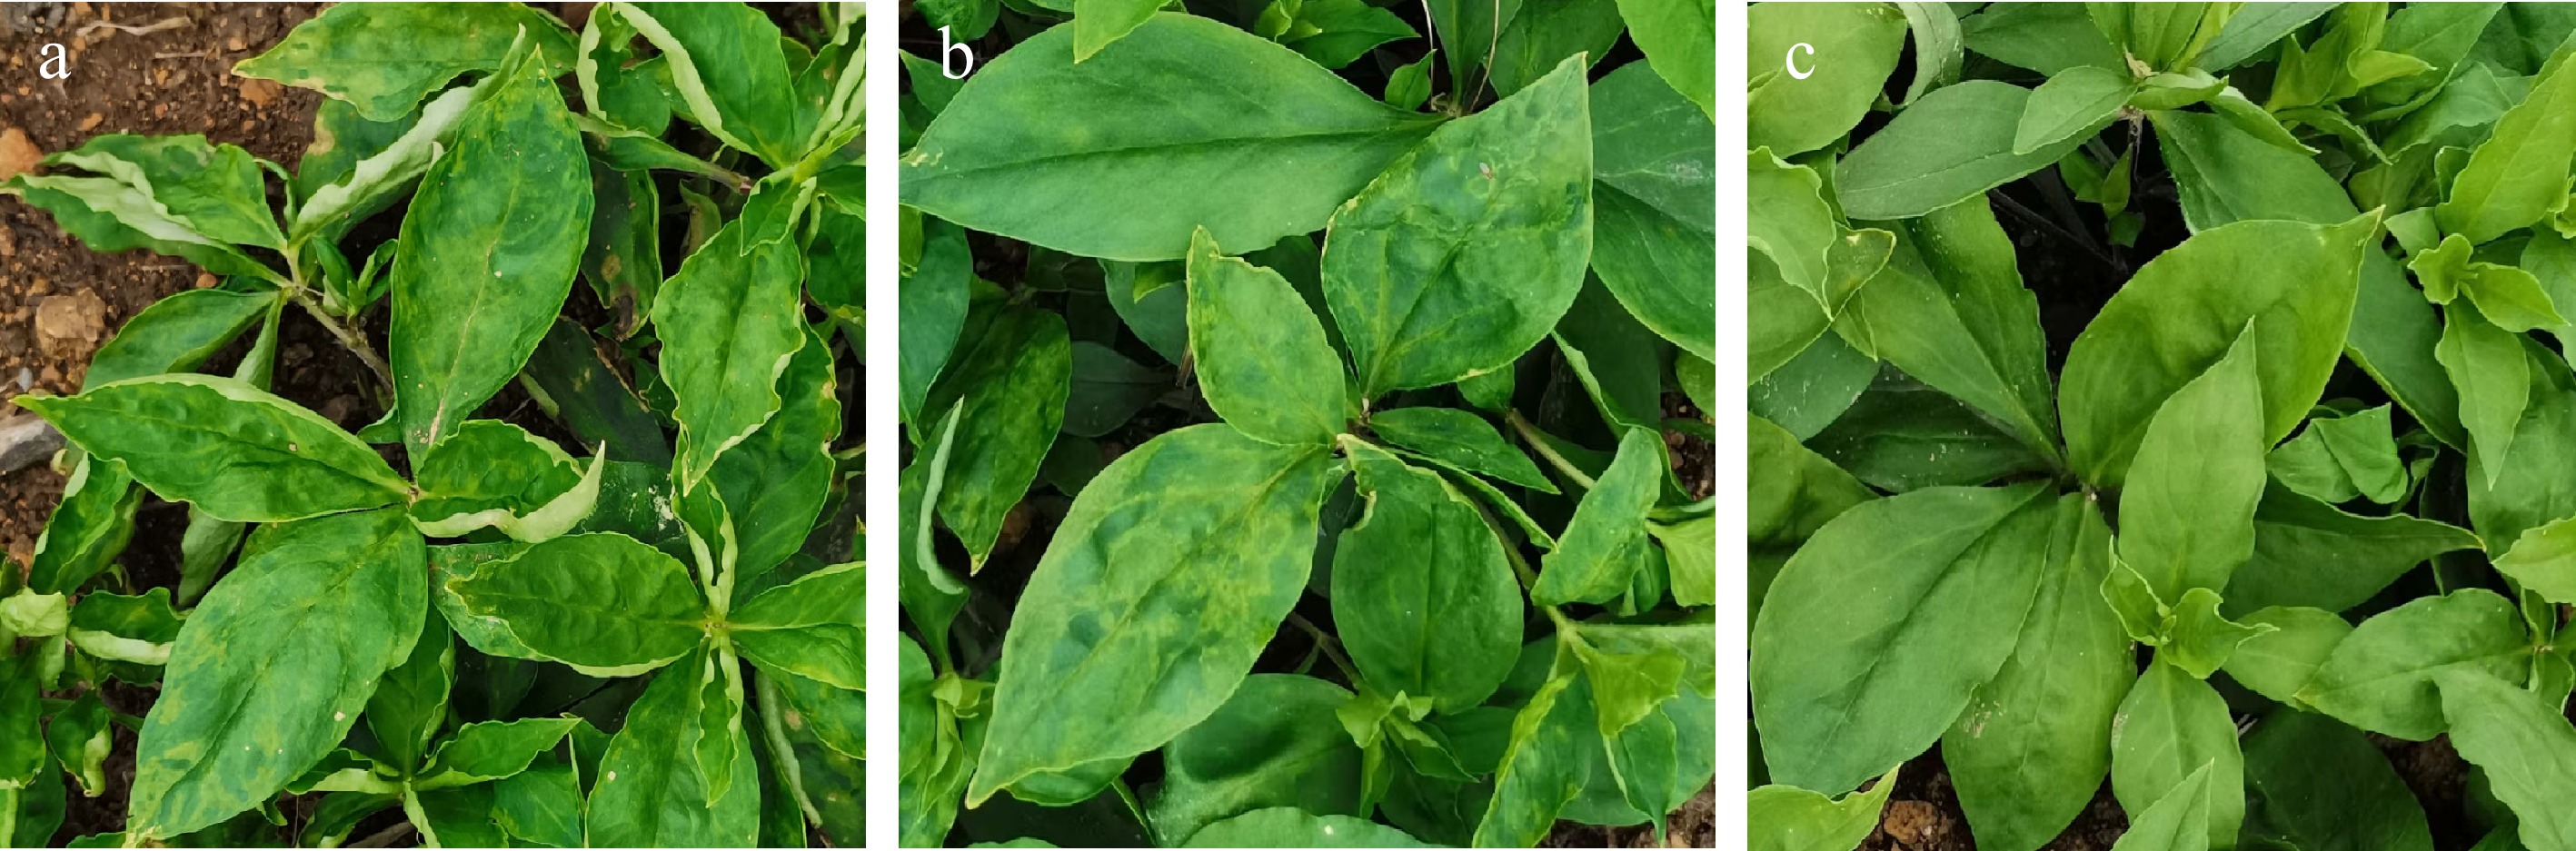
Figure 1.
Effects of different viral infections on morphological characteristics of Pseudostellaria heterophylla. (a) Plants infected with Turnip mosaic virus and Broad bean wilt virus 2 (VI2); (b) plants infected with Broad bean wilt virus 2 only (VI1); (c) plants without virus (VI0).
-
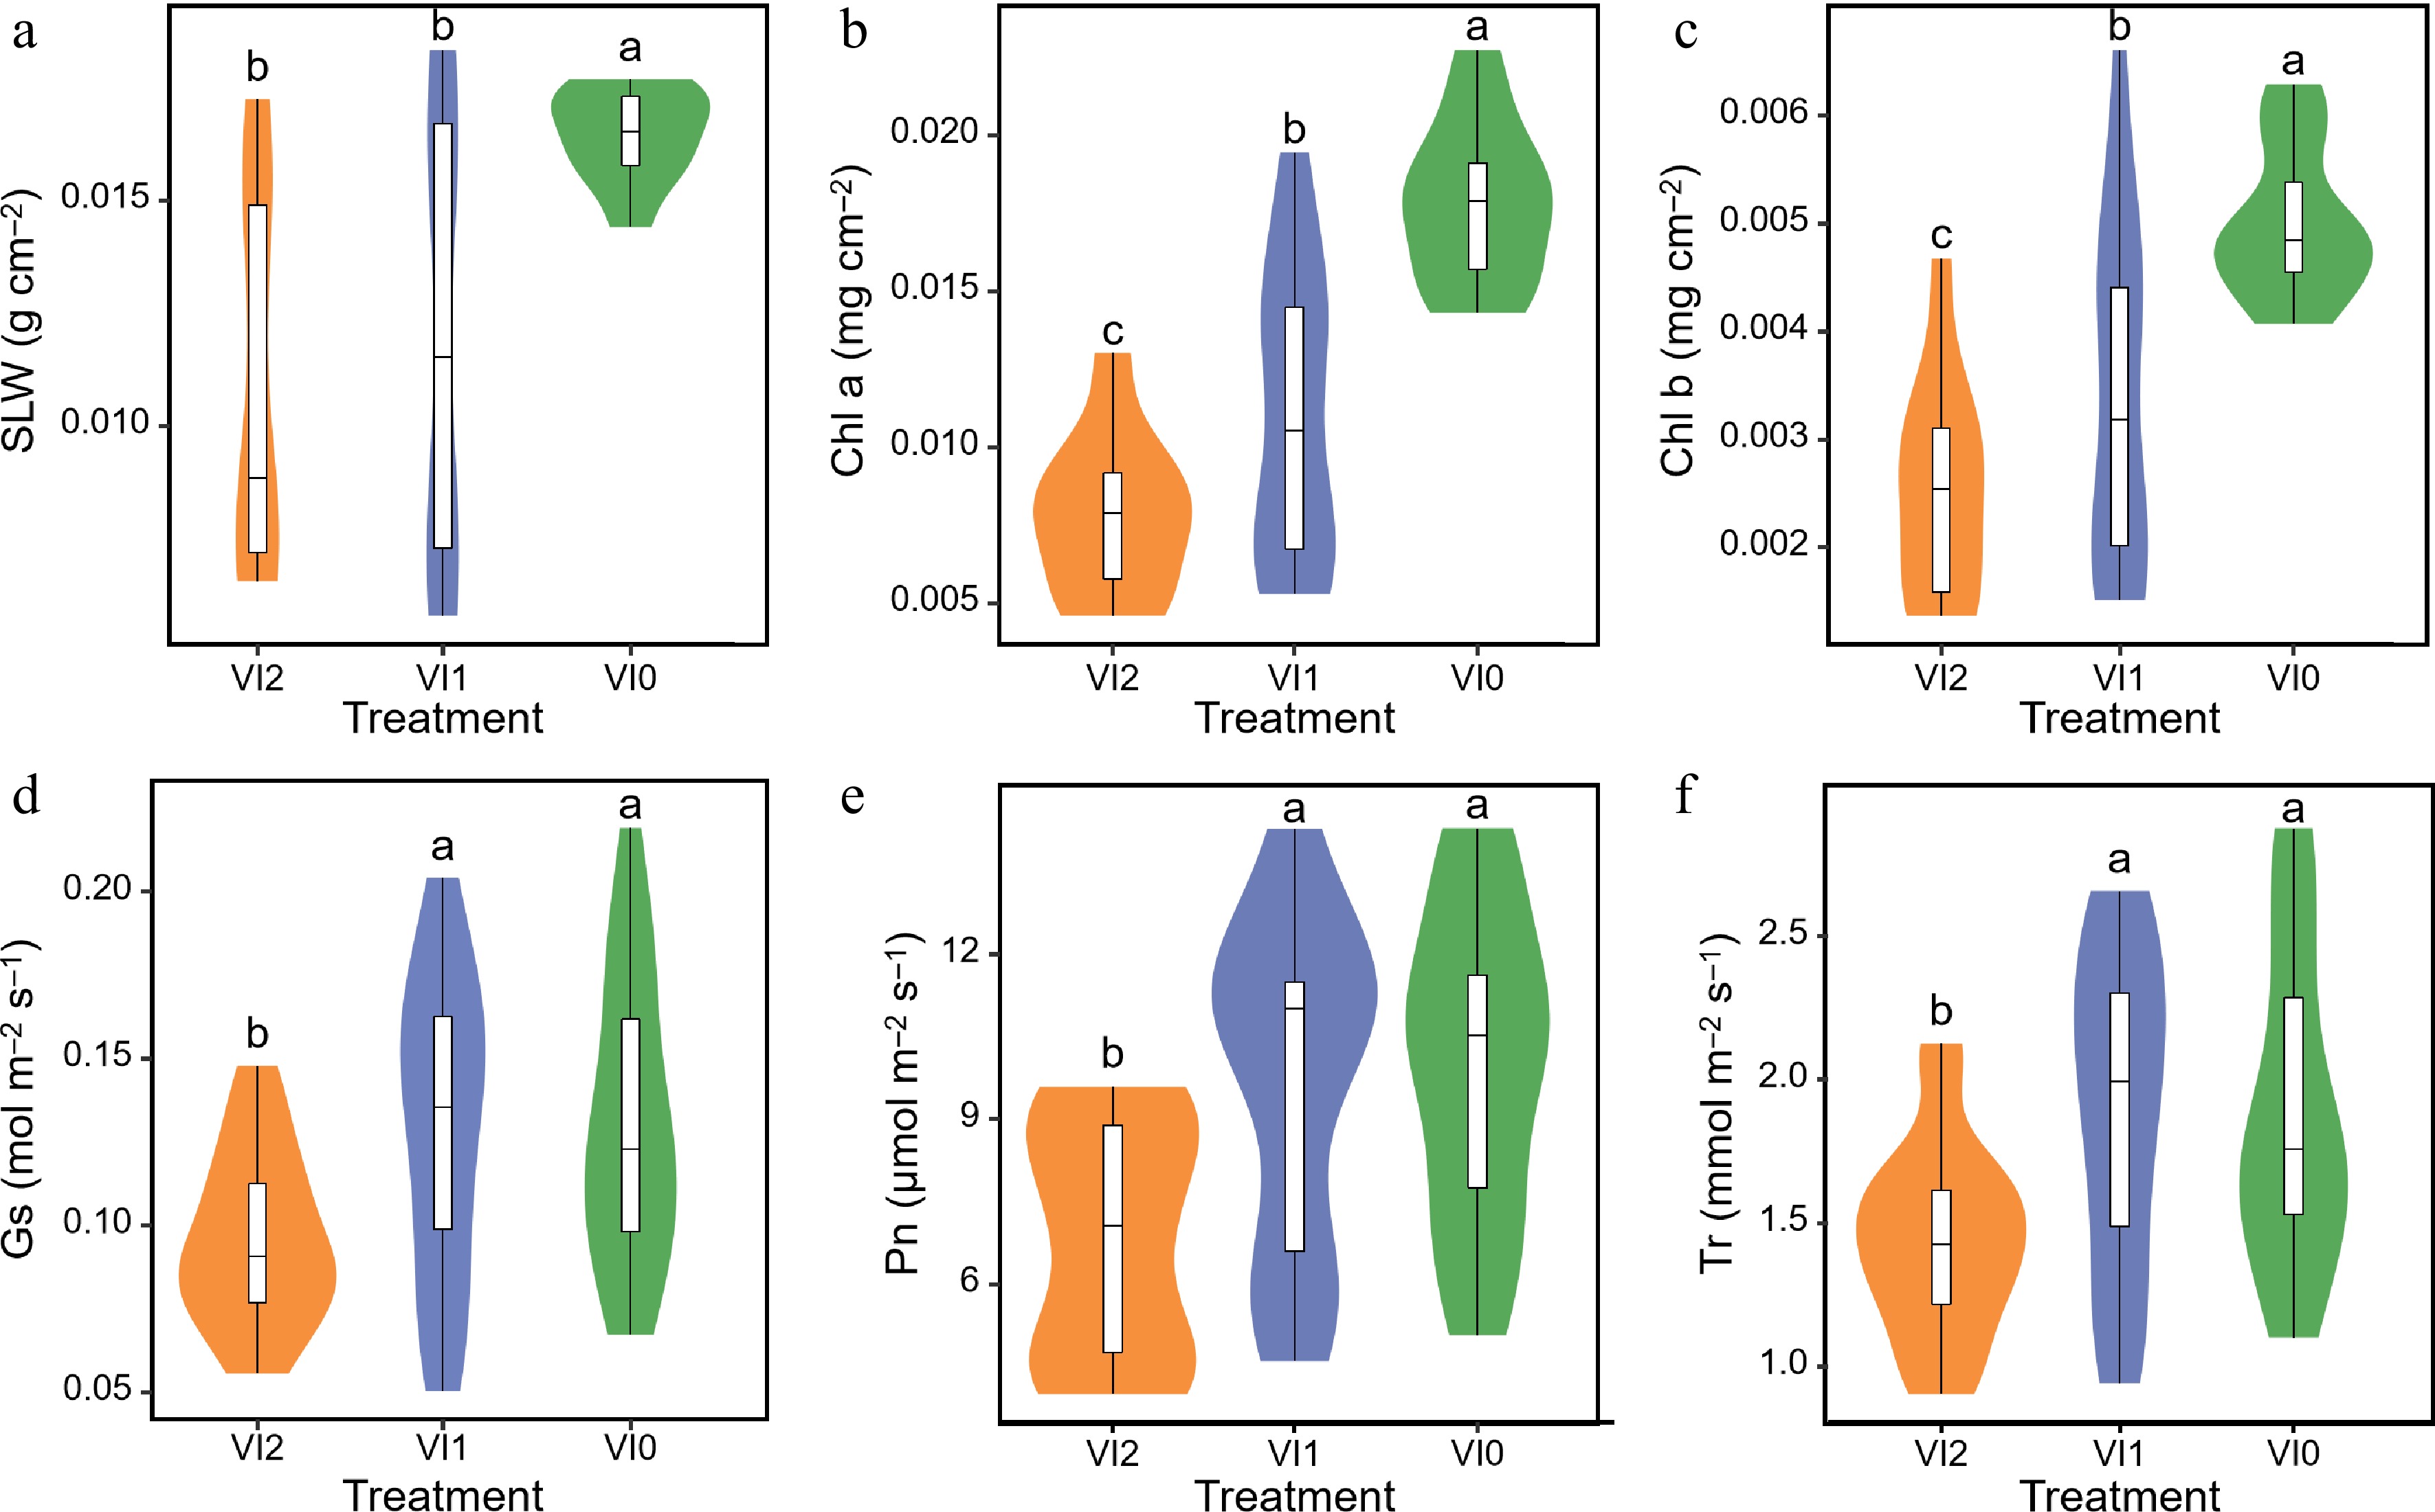
Figure 2.
Effects of different viral infections on (a) specific leaf weight, (b) chlorophyll a content, (c) chlorophyll b content, (d) stomatal conductance, (e) net photosynthesis rate, and (f) transpiration rate of Pseudostellaria heterophylla. Different lowercase letters indicate significant differences between the groups, with a P-value of less than 0.05. Abbreviations: VI0, plants without virus; VI1, plants infected with Broad bean wilt virus 2 only; VI2, plants infected with Turnip mosaic virus and Broad bean wilt virus 2; SLW, specific leaf weight; Chl a, chlorophyll a content; Chl b, chlorophyll b content; GS, stomatal conductance. Pn, net photosynthesis rate; Tr, transpiration rate. The sample size for each treatment is 6. Means and standard errors of all parameters for each treatment are displayed in Supplementary Table S2.
-
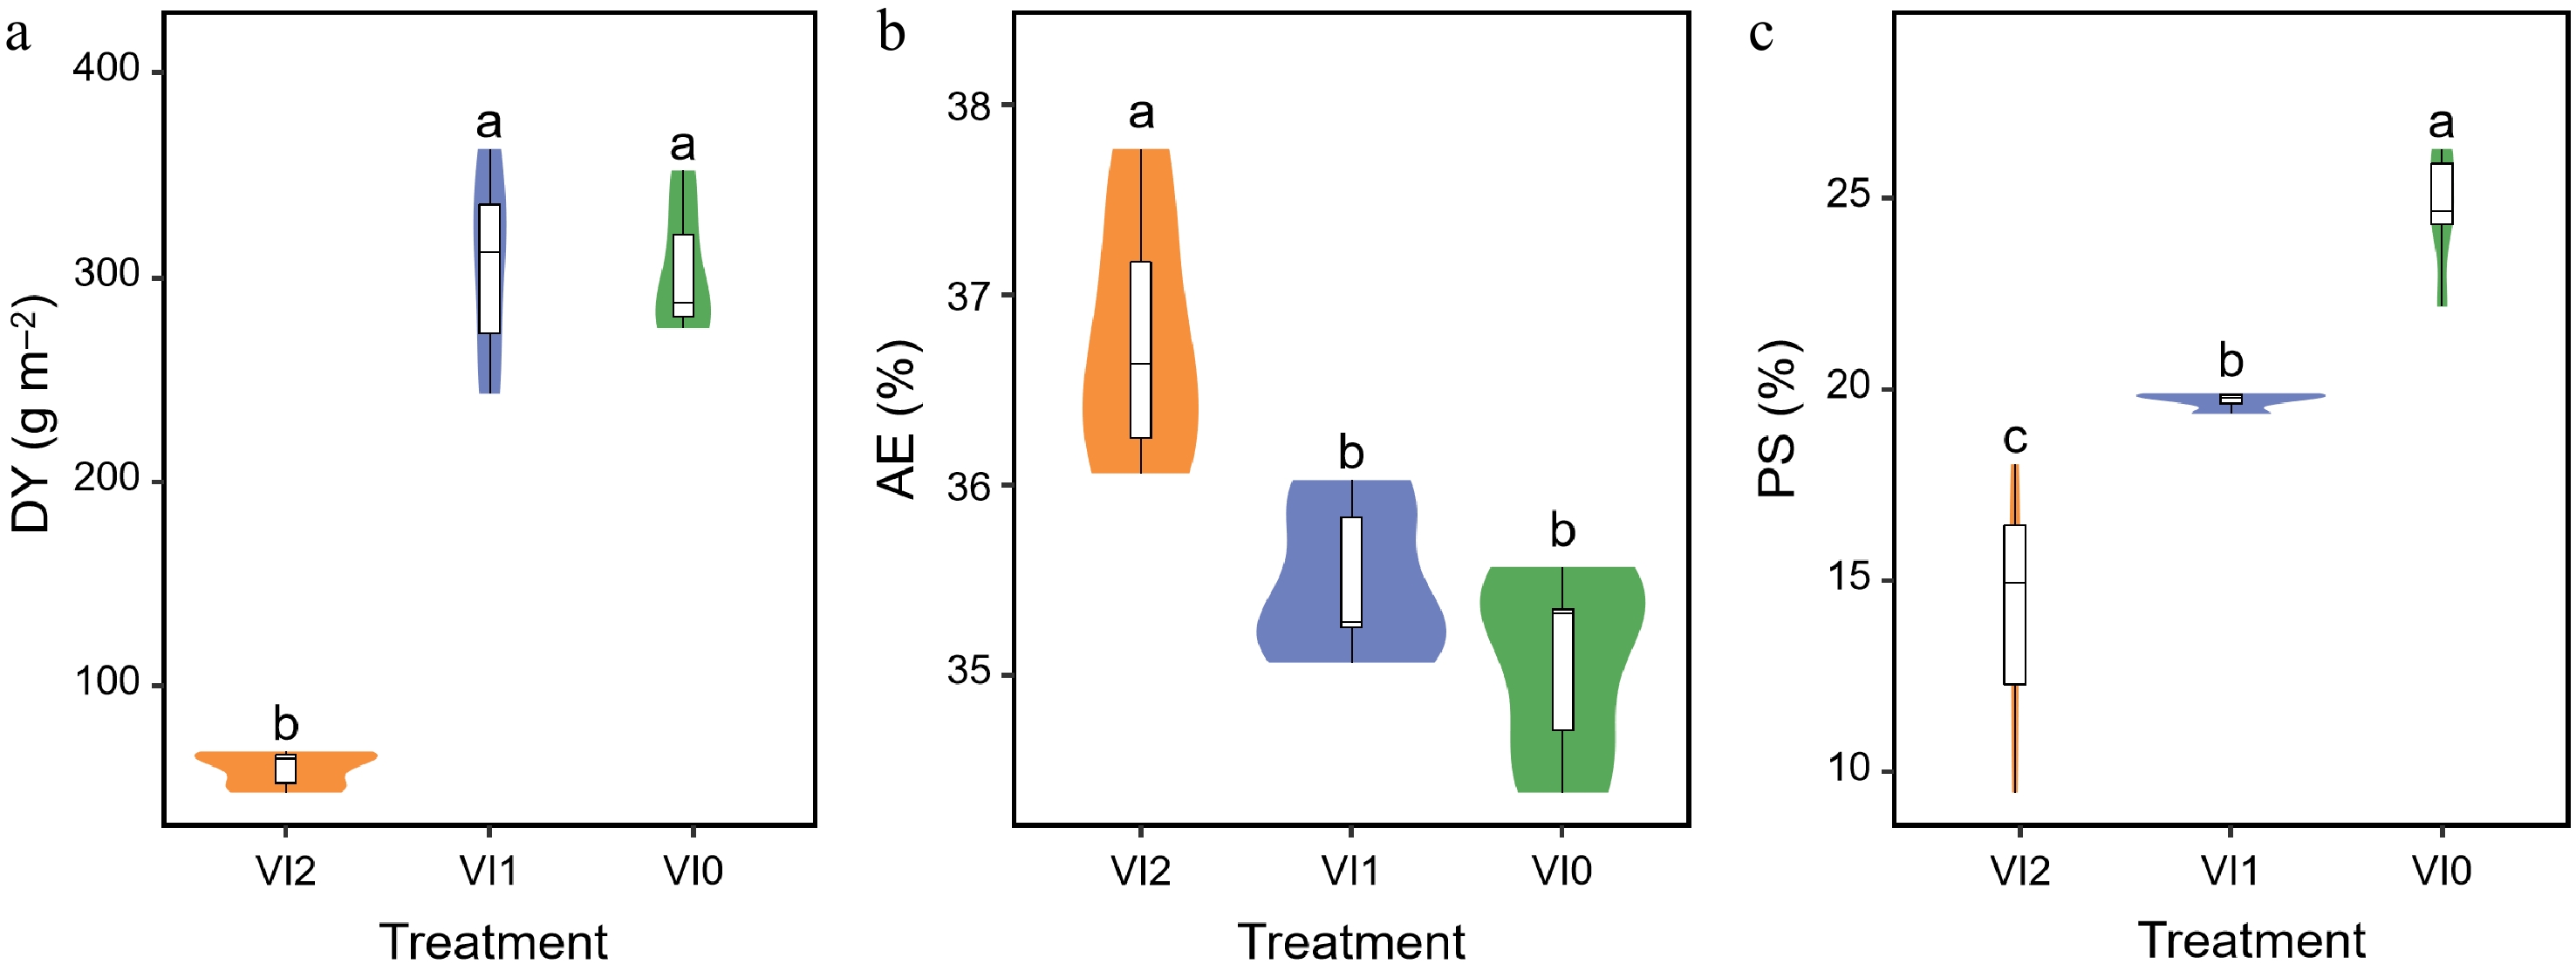
Figure 3.
Effects of different viral infections on (a) dried tuberous roots yield, (b) aqueous extract content of dried tuberous roots, and (c) polysaccharide content of dried tuberous roots of Pseudostellaria heterophylla. Different lower case letters indicate significant differences between the groups, with a P-value of less than 0.05. Abbreviations: VI0, plants without virus; VI1, plants infected with Broad bean wilt virus 2 only; VI2, plants infected with Turnip mosaic virus and Broad bean wilt virus 2; DY, dried tuberous root yield; AE, aqueous extract content of tuberous roots; PS, polysaccharide content of tuberous roots. The sample size for each treatment is 6. Means and standard errors of all indicators for each treatment are displayed in Supplementary Table S2.
-
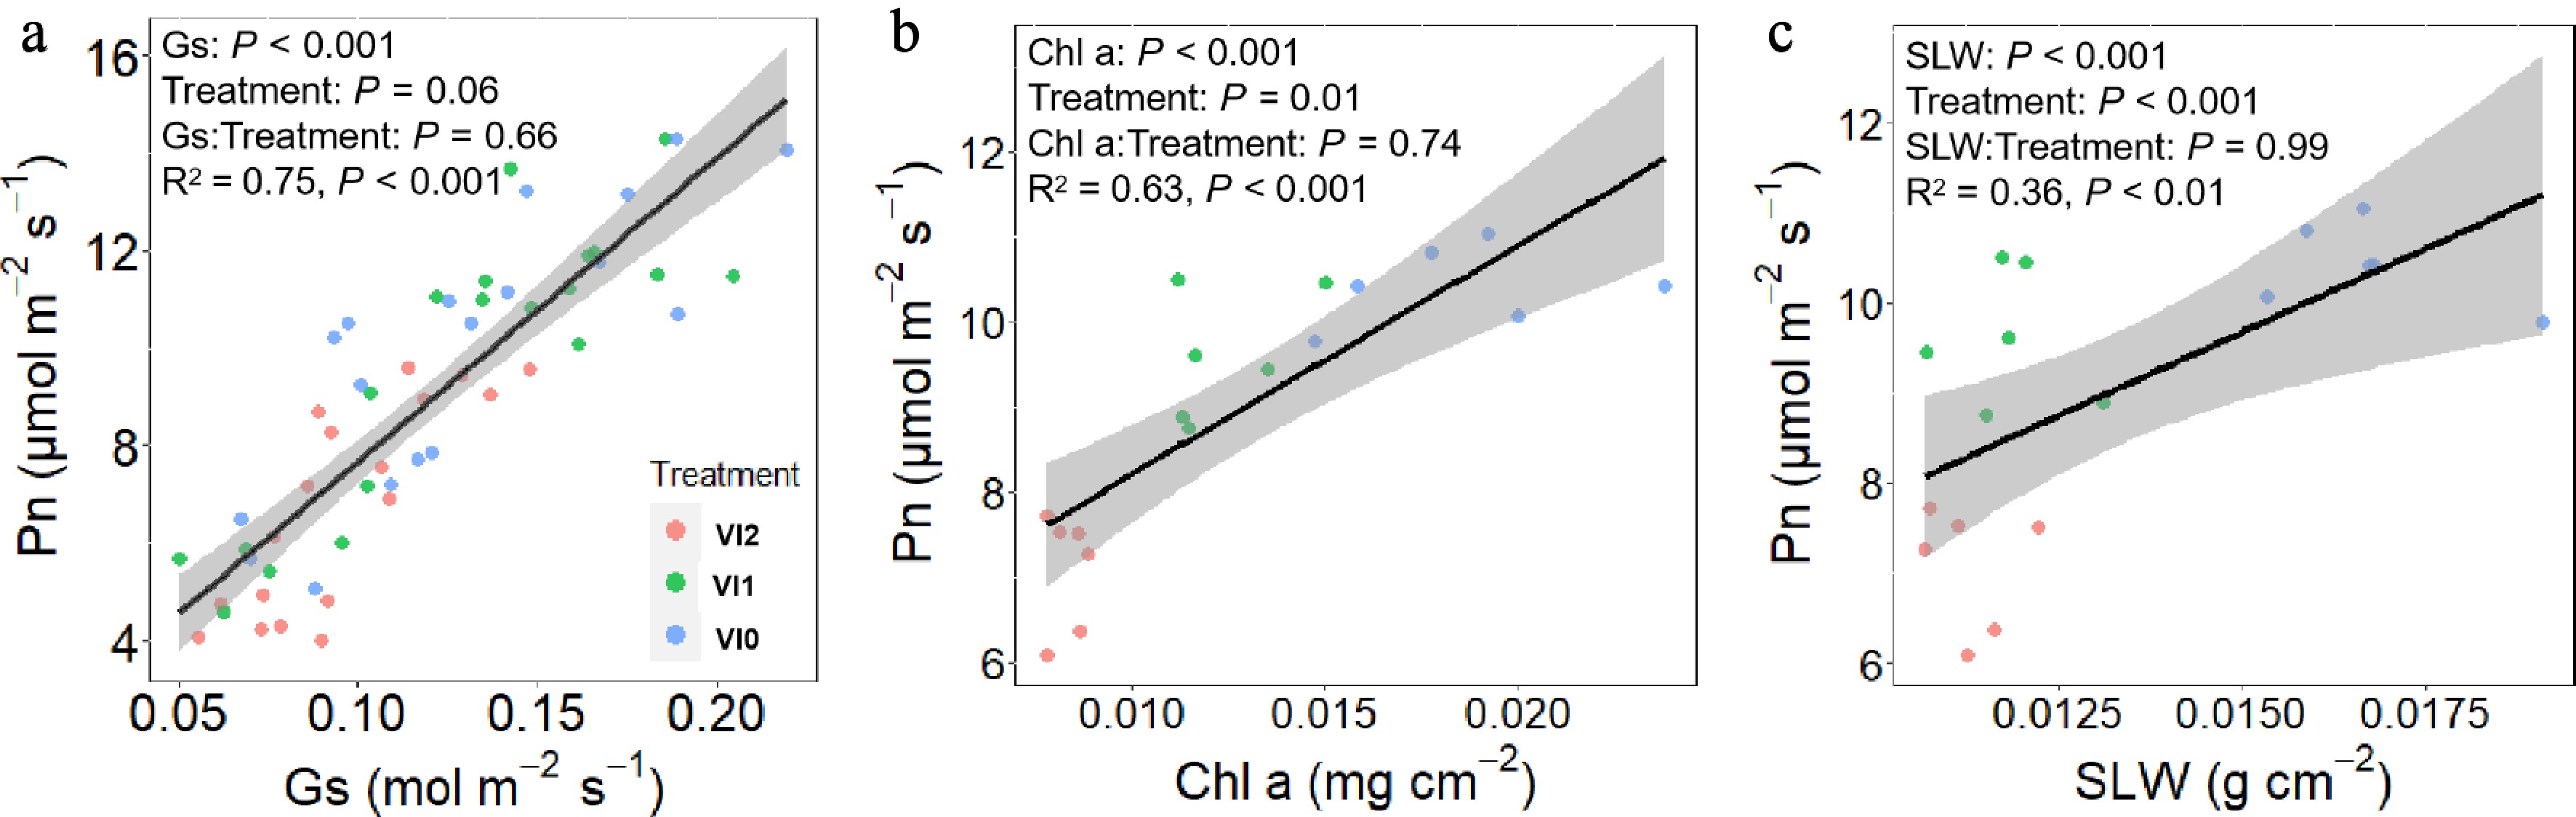
Figure 4.
Effects of (a) stomatal conductance, (b) chlorophyll a content, and (c) specific leaf weight on net photosynthesis rate in Pseudostellaria heterophylla. Abbreviations: VI2, plants infected with Turnip mosaic virus and Broad bean wilt virus 2; VI1, plants infected with Broad bean wilt virus 2 only; VI0, plants without virus; SLW, specific leaf weight; Chl a, chlorophyll a content; Gs, stomatal conductance; Pn, net photosynthesis rate.
-
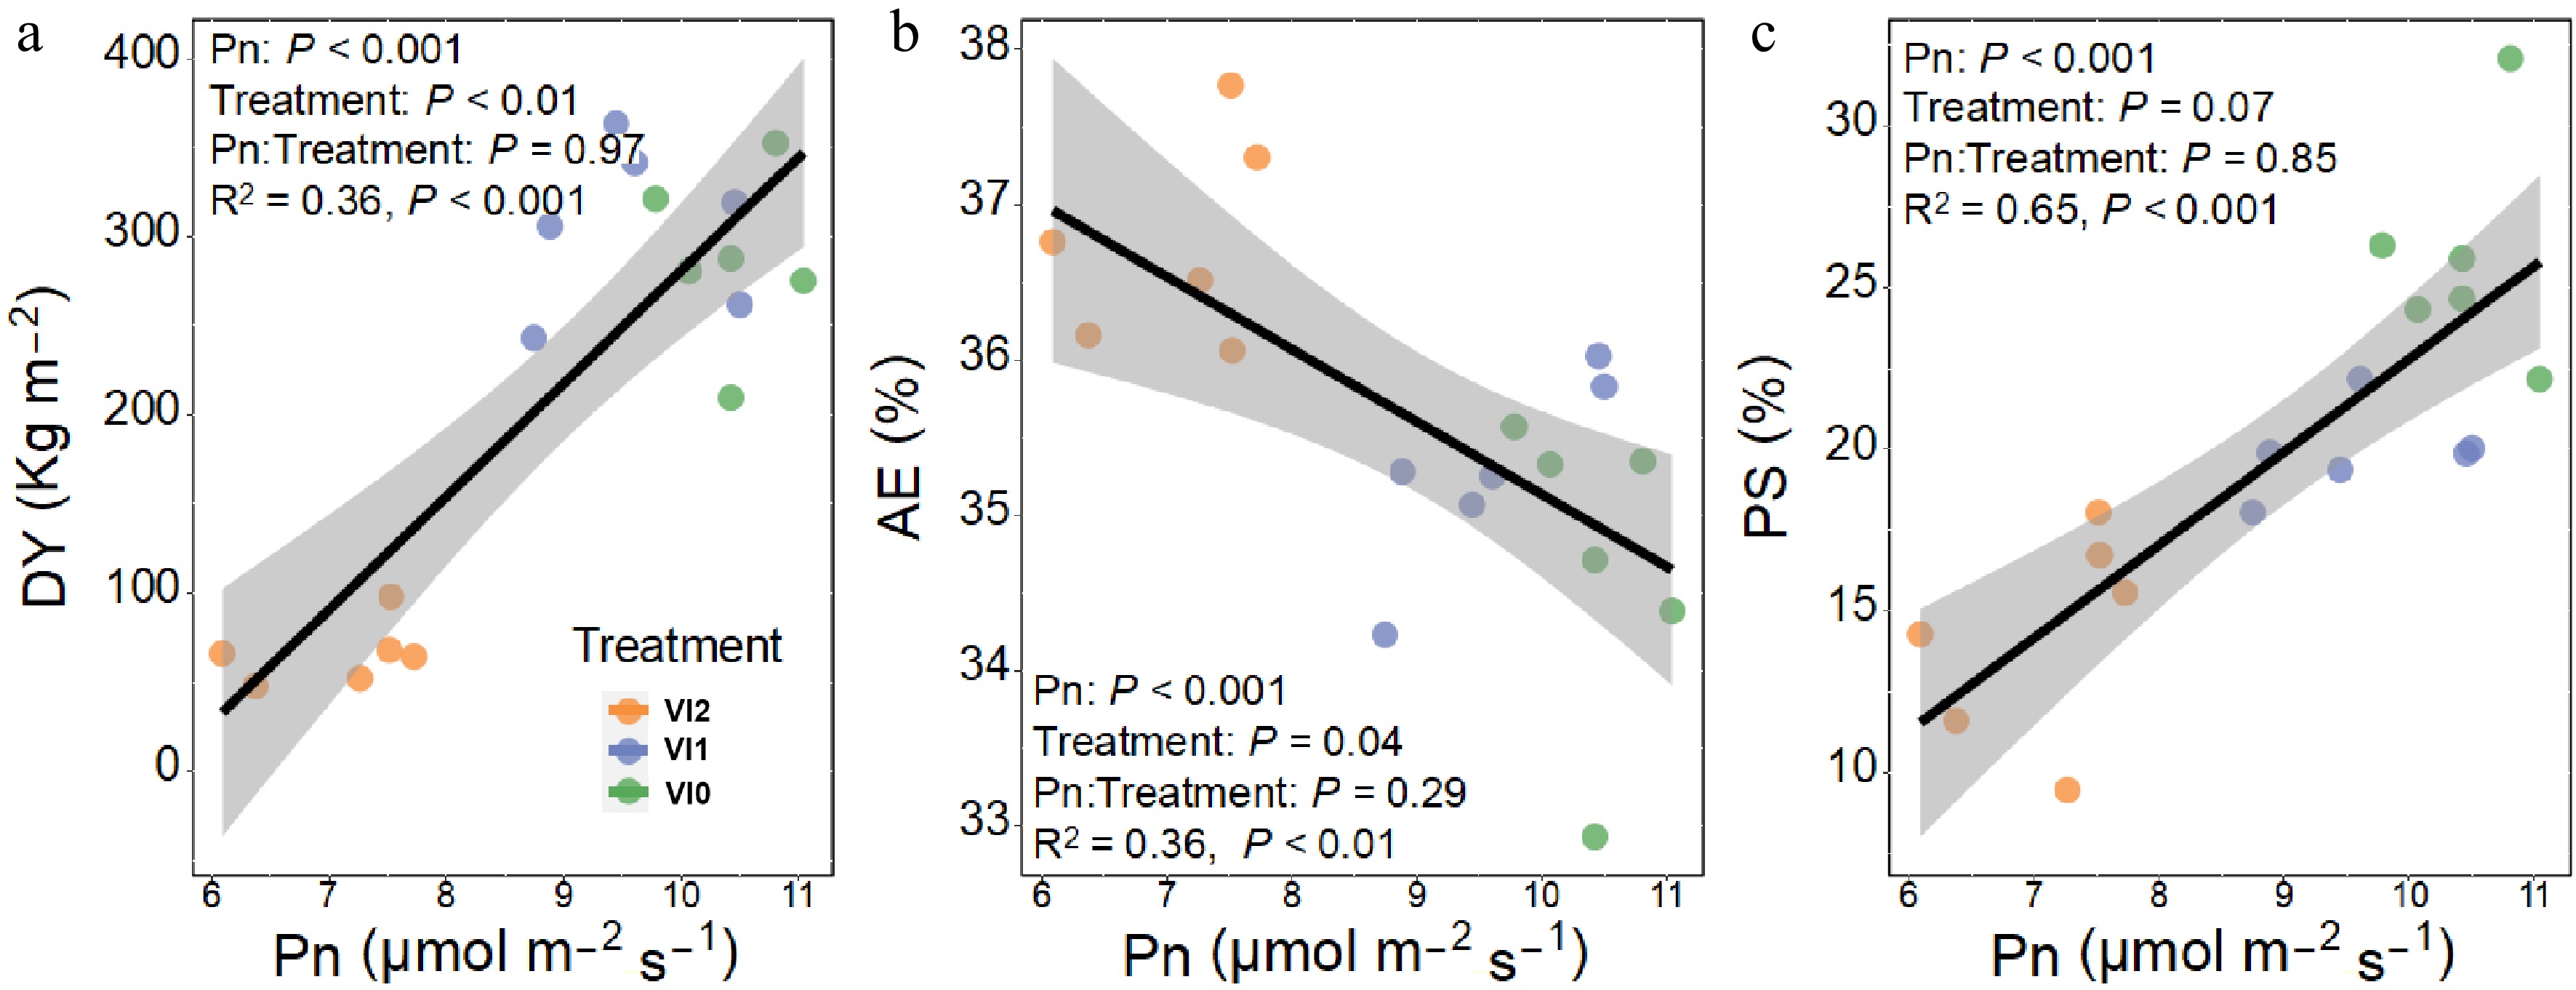
Figure 5.
Effects of net photosynthesis rate on (a) dried tuberous roots yield, (b) aqueous extract content of dried tuberous roots, and (c) polysaccharide content of dried tuberous roots in Pseudostellaria heterophylla. Abbreviations: VI2, plants infected with Turnip mosaic virus and Broad bean wilt virus 2; VI1, plants infected with Broad bean wilt virus 2 only; VI0, plants without virus; Pn, net photosynthesis rate; DY, dried tuberous roots yield; AE, aqueous extract content of tuberous roots; PS, polysaccharide content of tuberous roots.
-
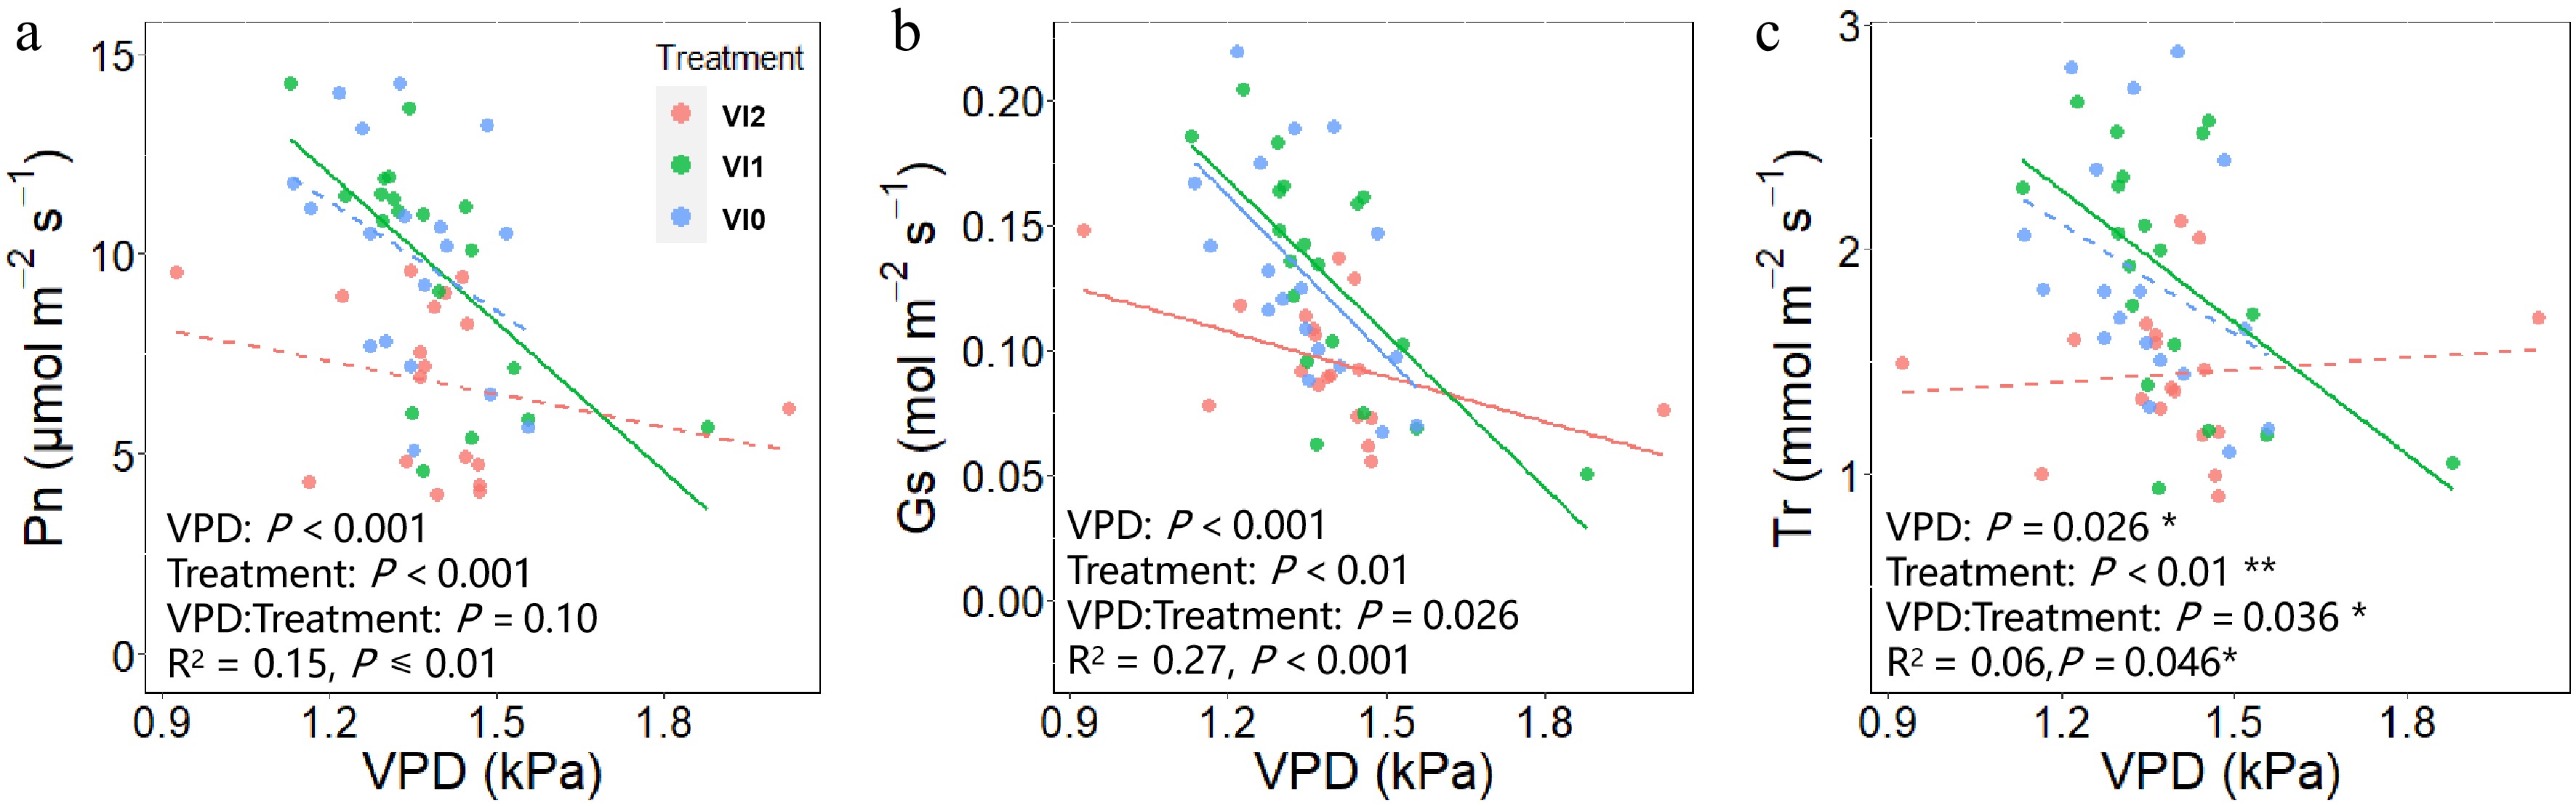
Figure 6.
Response of (a) net photosynthesis rate, (b) stomatal conductance, and (c) transpiration rate to VPDL under different viral infections. The solid trend line indicates that the slope F-test corresponds to a P-value less than 0.05 and the dashed lines indicates that the slope F-test corresponds to a P-value greater than 0.05. Abbreviations: VI2, plants infected with Turnip mosaic virus and Broad bean wilt virus 2; VI1, plants infected with Broad bean wilt virus 2 only; VI0, plants without virus; VPDL, leaf-air vapor pressure deficit; Pn, net photosynthesis rate; Gs, stomatal conductance; Tr, transpiration rate.
-
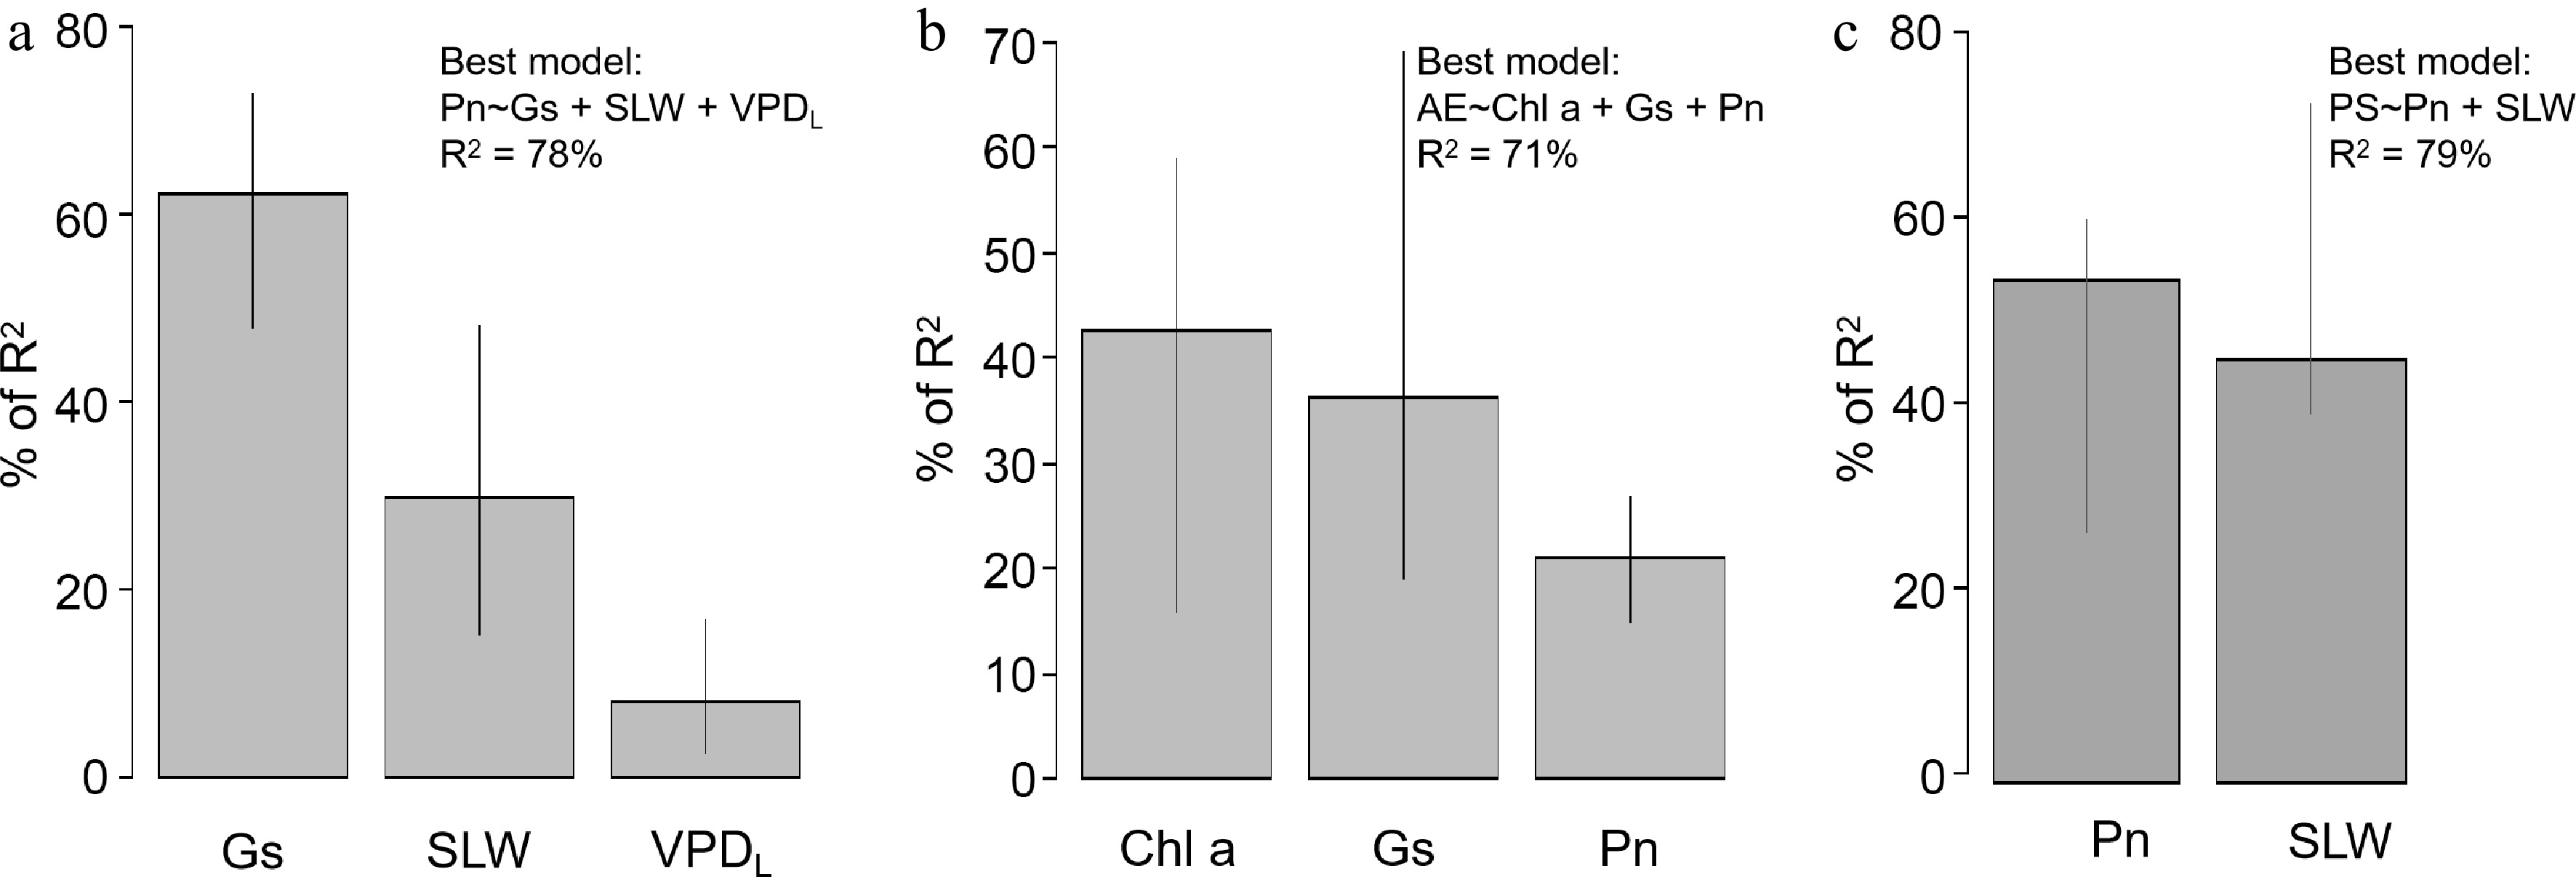
Figure 7.
Relative importance of explanatory variables in multiple linear regressions for (a) net photosynthesis rate, (b) aqueous extract content of dried tuberous roots, and (c) polysaccharide content of dried tuberous roots. Results of multiple linear regression are listed in Supplementary Table S3. Abbreviations: Gs, stomatal conductance; SLW, specific leaf weight; VPDL, leaf to air vapor pressure deficit; Chl a, chlorophyll a content; Pn, net photosynthesis rate.
Figures
(7)
Tables
(0)