-
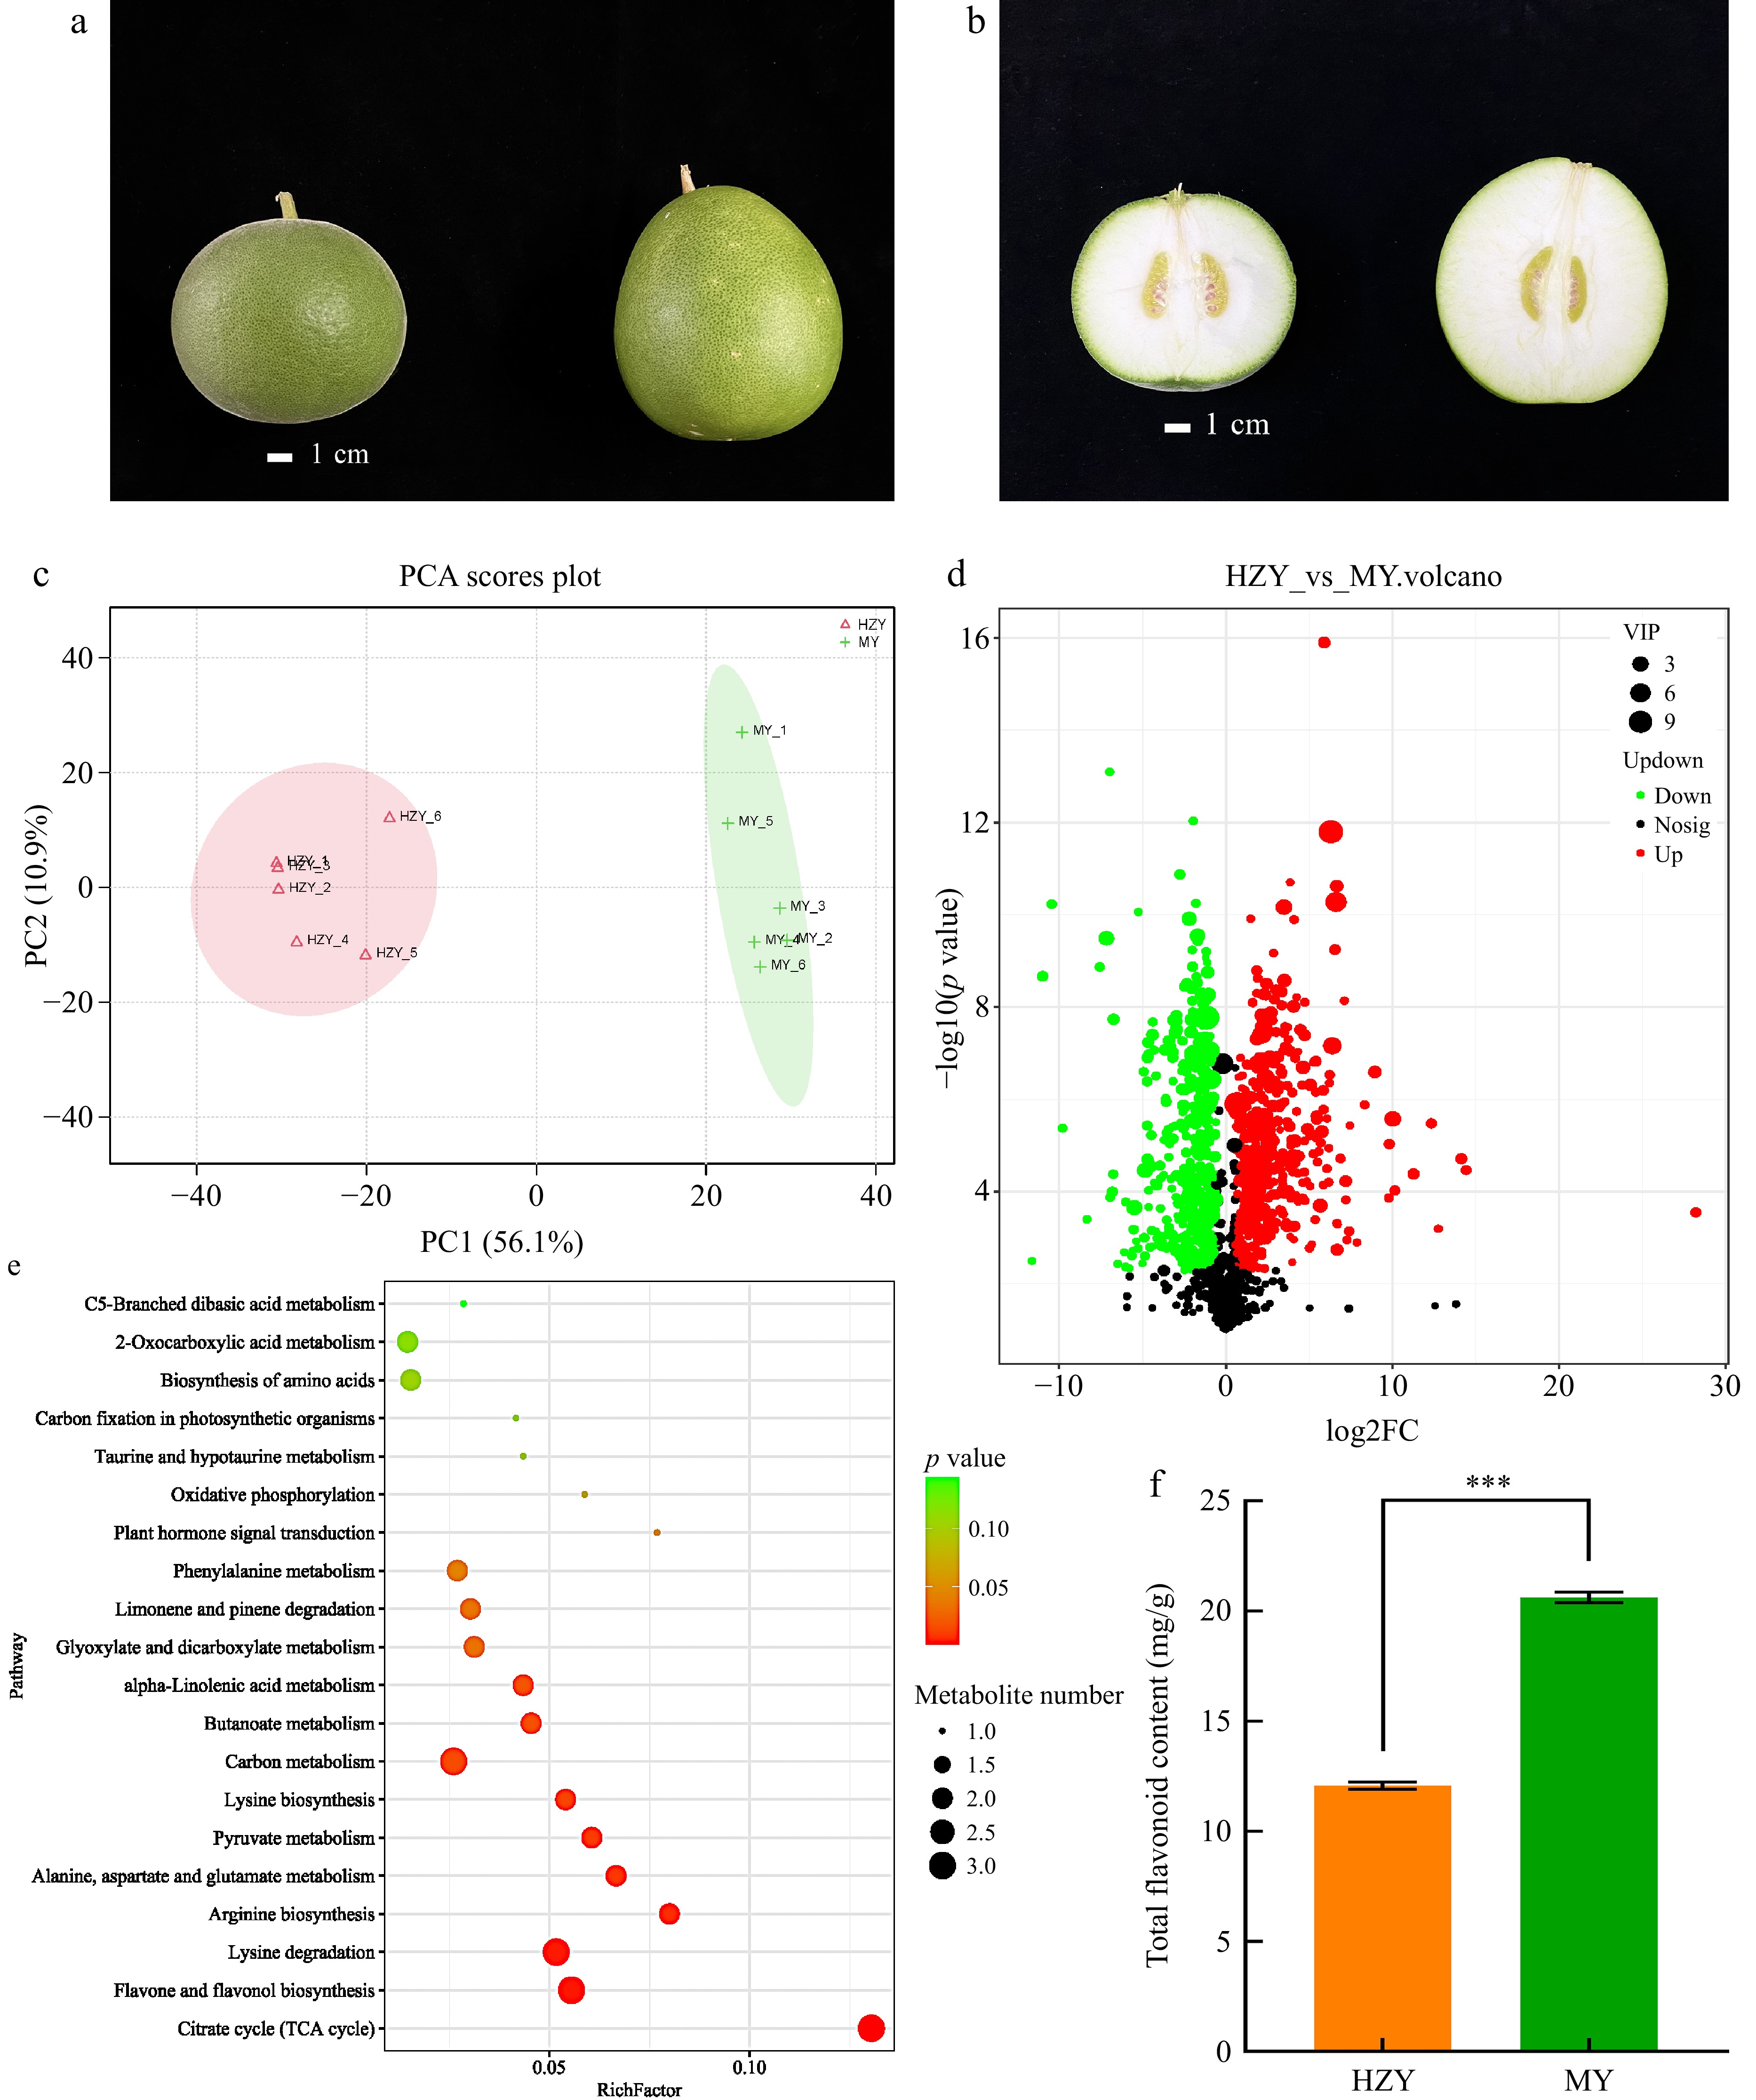
Figure 1.
Morphological and metabolomic results of Huazhou pomelo and Sanhong pomelo. (a) Morphological differences in whole fruit, with Huazhou pomelo on the left and Sanhong pomelo on the right. The Huazhou pomelo is round with a peel covered in fine white fuzz, whereas the Sanhong pomelo is oval-shaped with a relatively smooth surface. (b) Morphological differences in halved fruit, with Huazhou pomelo on the left and Sanhong pomelo on the right. The top of the Huazhou pomelo is round, blunt, and slightly concave, whereas the top of the Sanhong pomelo is flat. (c) Principal component score plot of metabolites, with HZY representing Huazhou pomelo and MY representing Sanhong pomelo (same for the following panels). (d) Volcano plot of differential metabolites, where each point represents a metabolite. Green, red, and black points represent downregulated, upregulated, and non-significant metabolites, respectively. (e) Bubble chart of KEGG pathway enrichment for differential metabolites. The x-axis indicates the enrichment factor, with larger values indicating a higher degree of gene enrichment. The size of the points corresponds to the number of metabolites, and the color reflects the p-value, with red indicating significant differences. (f) Total flavonoid content. p values are indicated as follows: *** for p < 0.001, ** for p < 0.01, and * for p < 0.05.
-
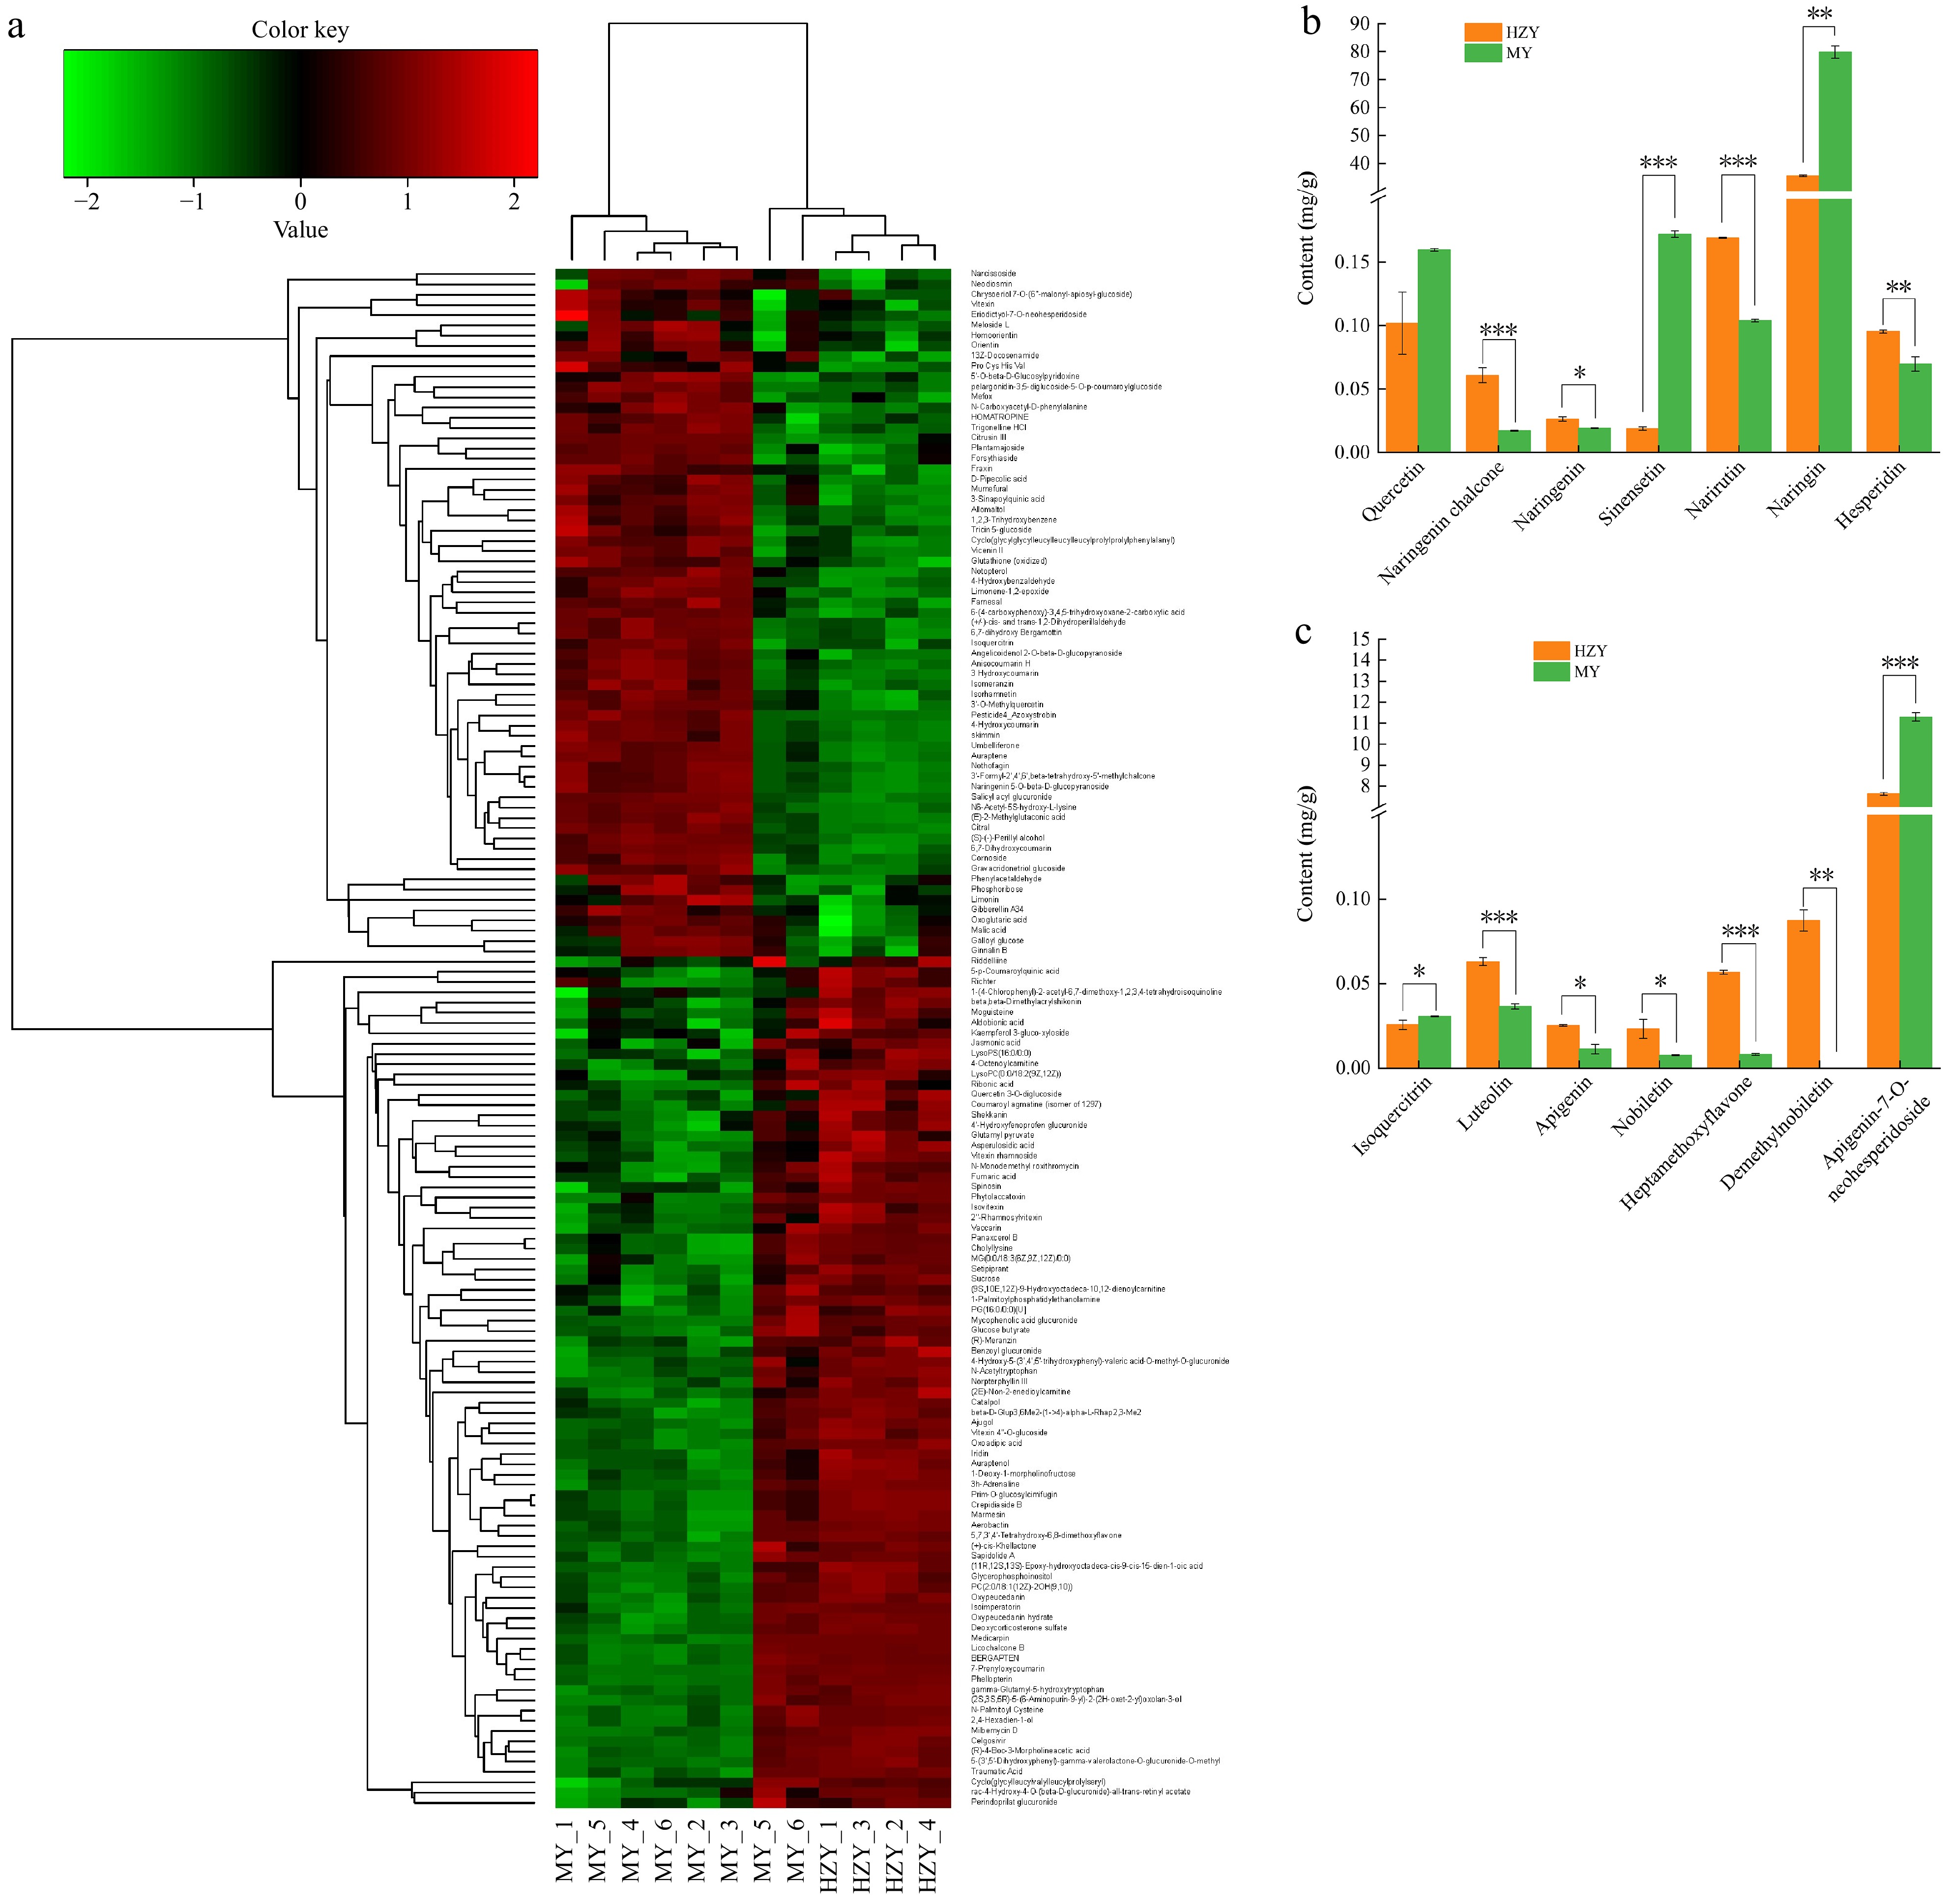
Figure 2.
Metabolomic clustering heatmap and flavonoid composition differences between Huazhou pomelo and Sanhong pomelo. (a) Hierarchical clustering heatmap of differential metabolites. The x-axis represents the samples, and the y-axis represents the differential metabolites. The color indicates the expression level, with green representing low expression and red representing high expression. (b) Content of seven flavonoid compounds at 283 nm. (c) Content of seven flavonoid compounds at 340 nm. p values are indicated as follows: *** for p < 0.001, ** for p < 0.01, and * for p < 0.05.
-
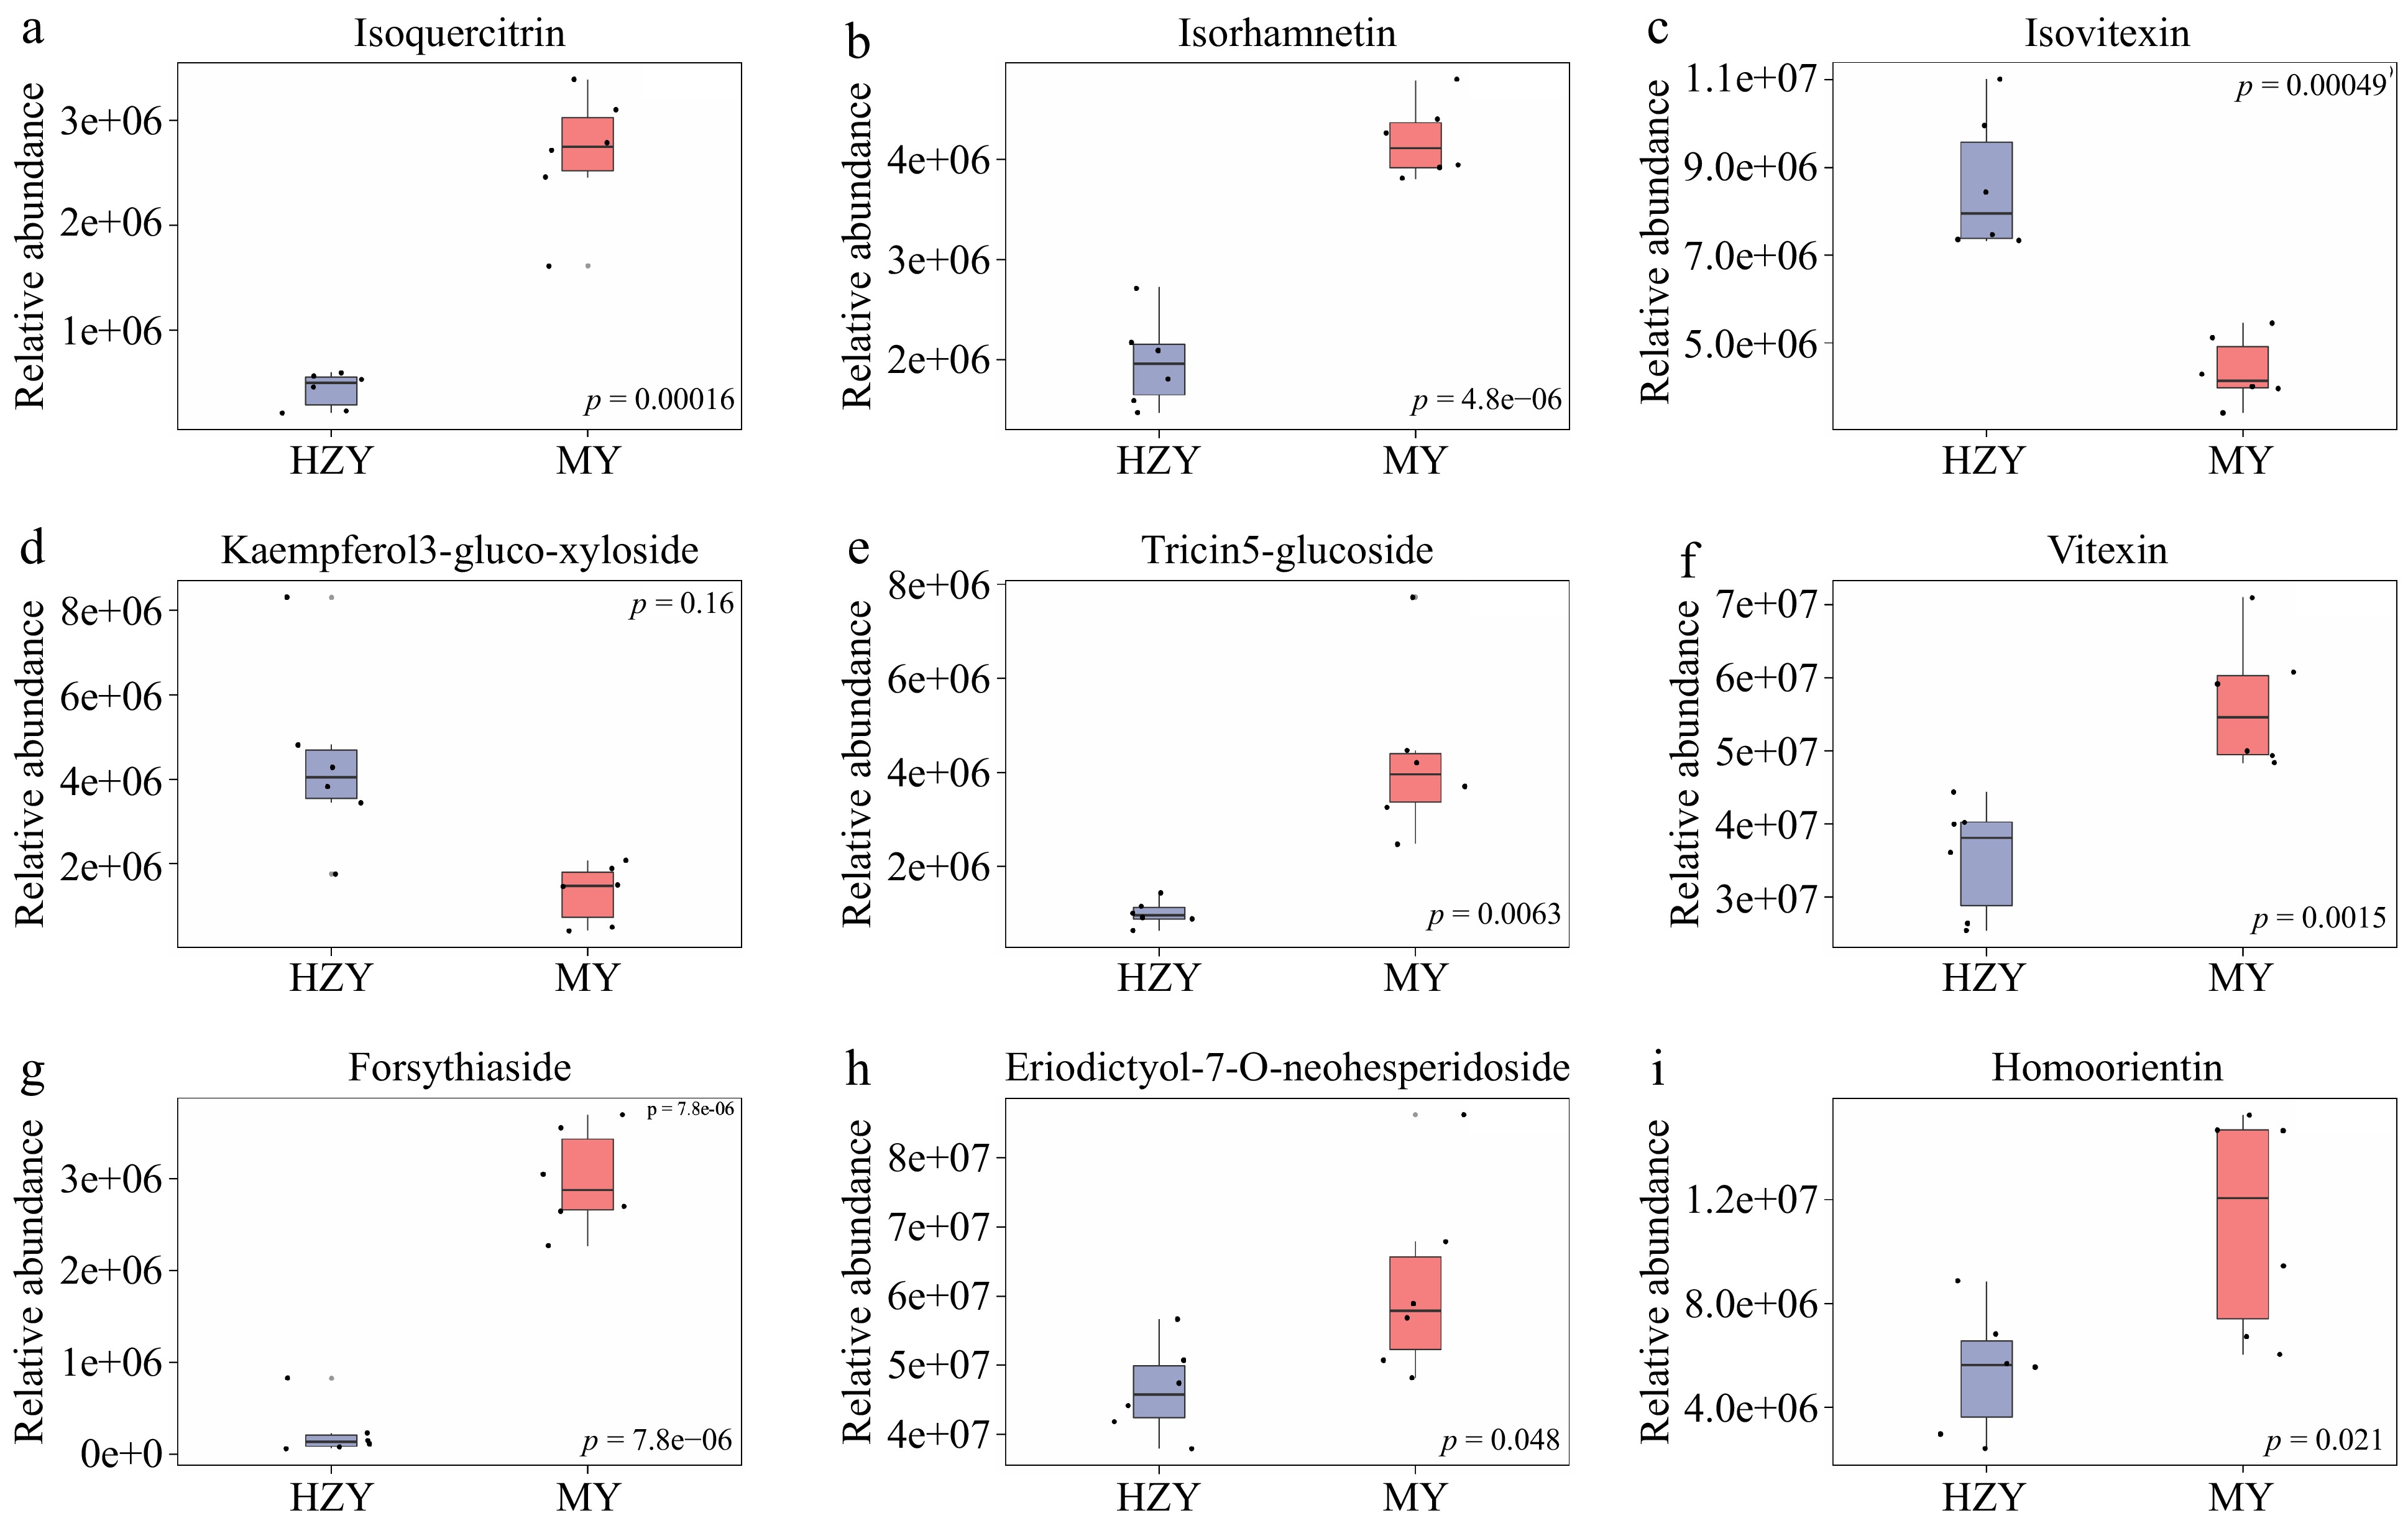
Figure 3.
Boxplots of selected differential metabolites. (a) Isoquercitrin, (b) isorhamnetin, (c) isovitexin, (d) kaempferol-3-glucoside-xylose, (e) tricin-5-glucoside, (f) vitexin, (g) forsythiaside, (h) eriodictyol-7-O-neohesperidoside, and (i) homoorientin. Note: The x-axis represents the groups, with each bar representing one group. The y-axis represents the relative abundance of metabolites. Each boxplot corresponds to five statistical measures, from top to bottom: maximum, upper quartile, median, lower quartile, and minimum.
-
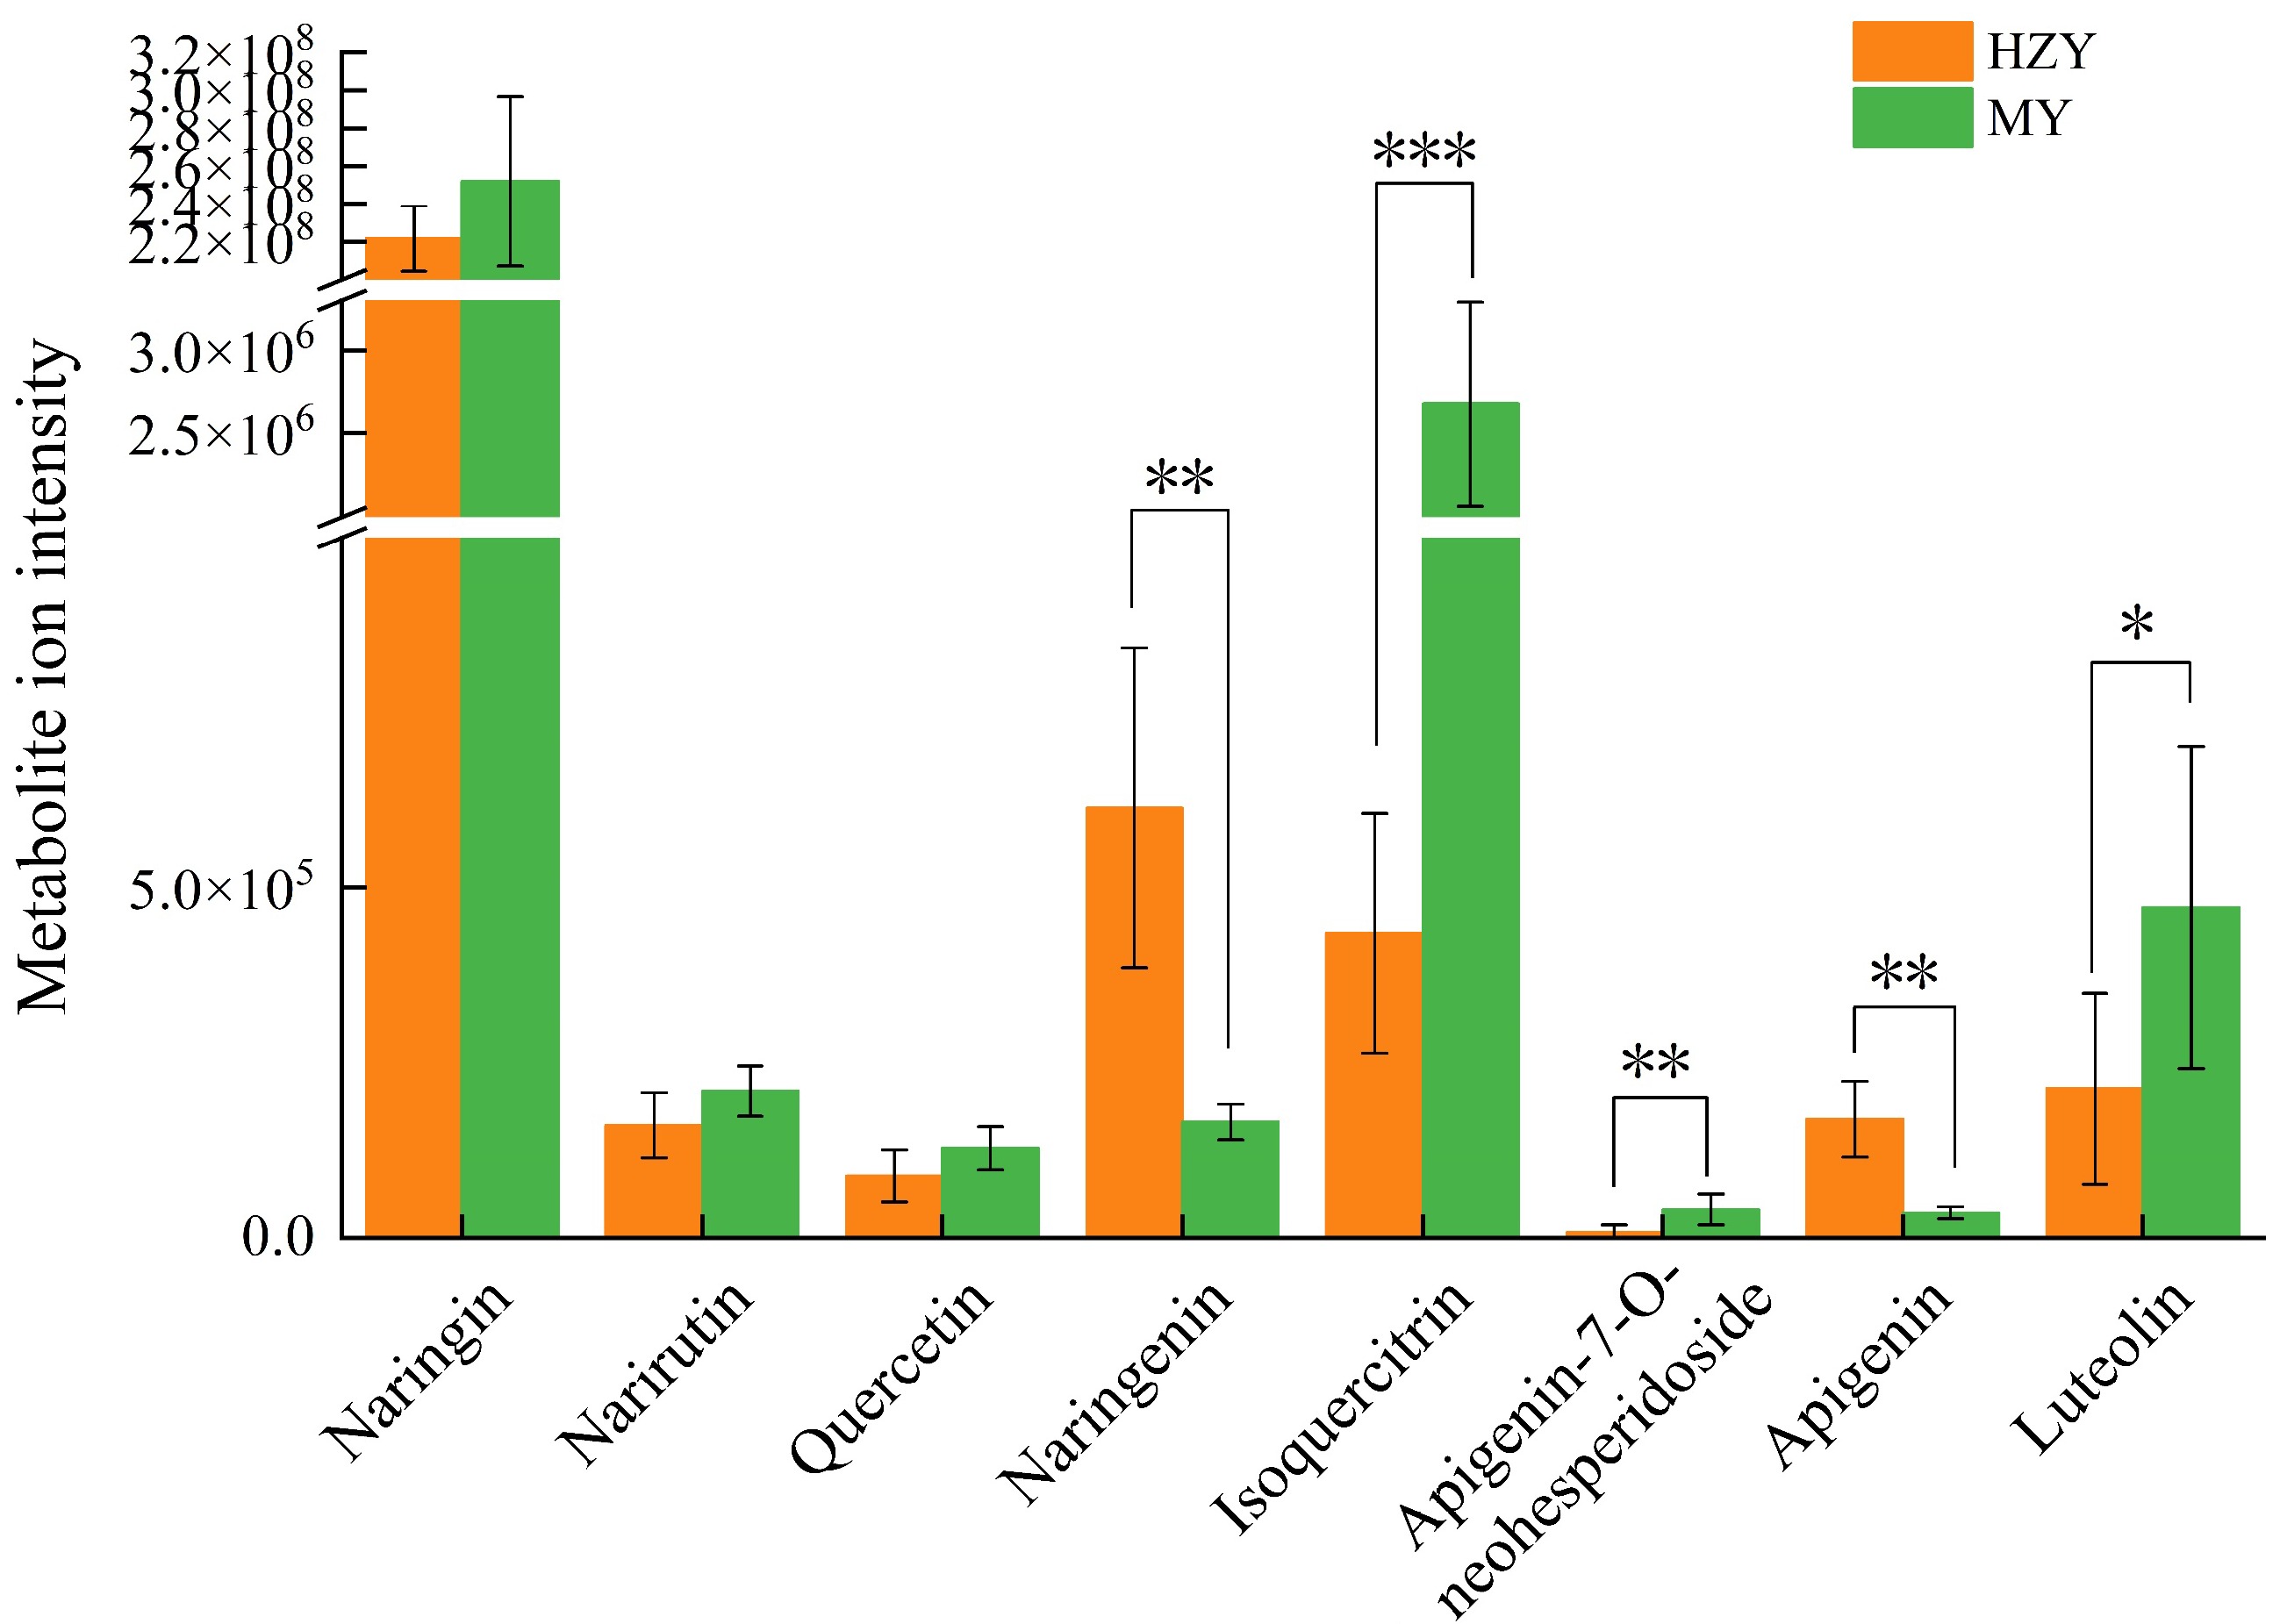
Figure 4.
Metabolite ion intensity plots for metabolites involved in flavonoid biosynthesis in Huazhou and Sanhong pomelo. High average ion intensity indicates that the metabolite has a higher abundance or concentration in the sample. Low average ion intensity indicates that the metabolite has a lower abundance or concentration in the sample. p-values are indicated as follows: *** for p < 0.001, ** for p < 0.01, and * for p < 0.05.
-
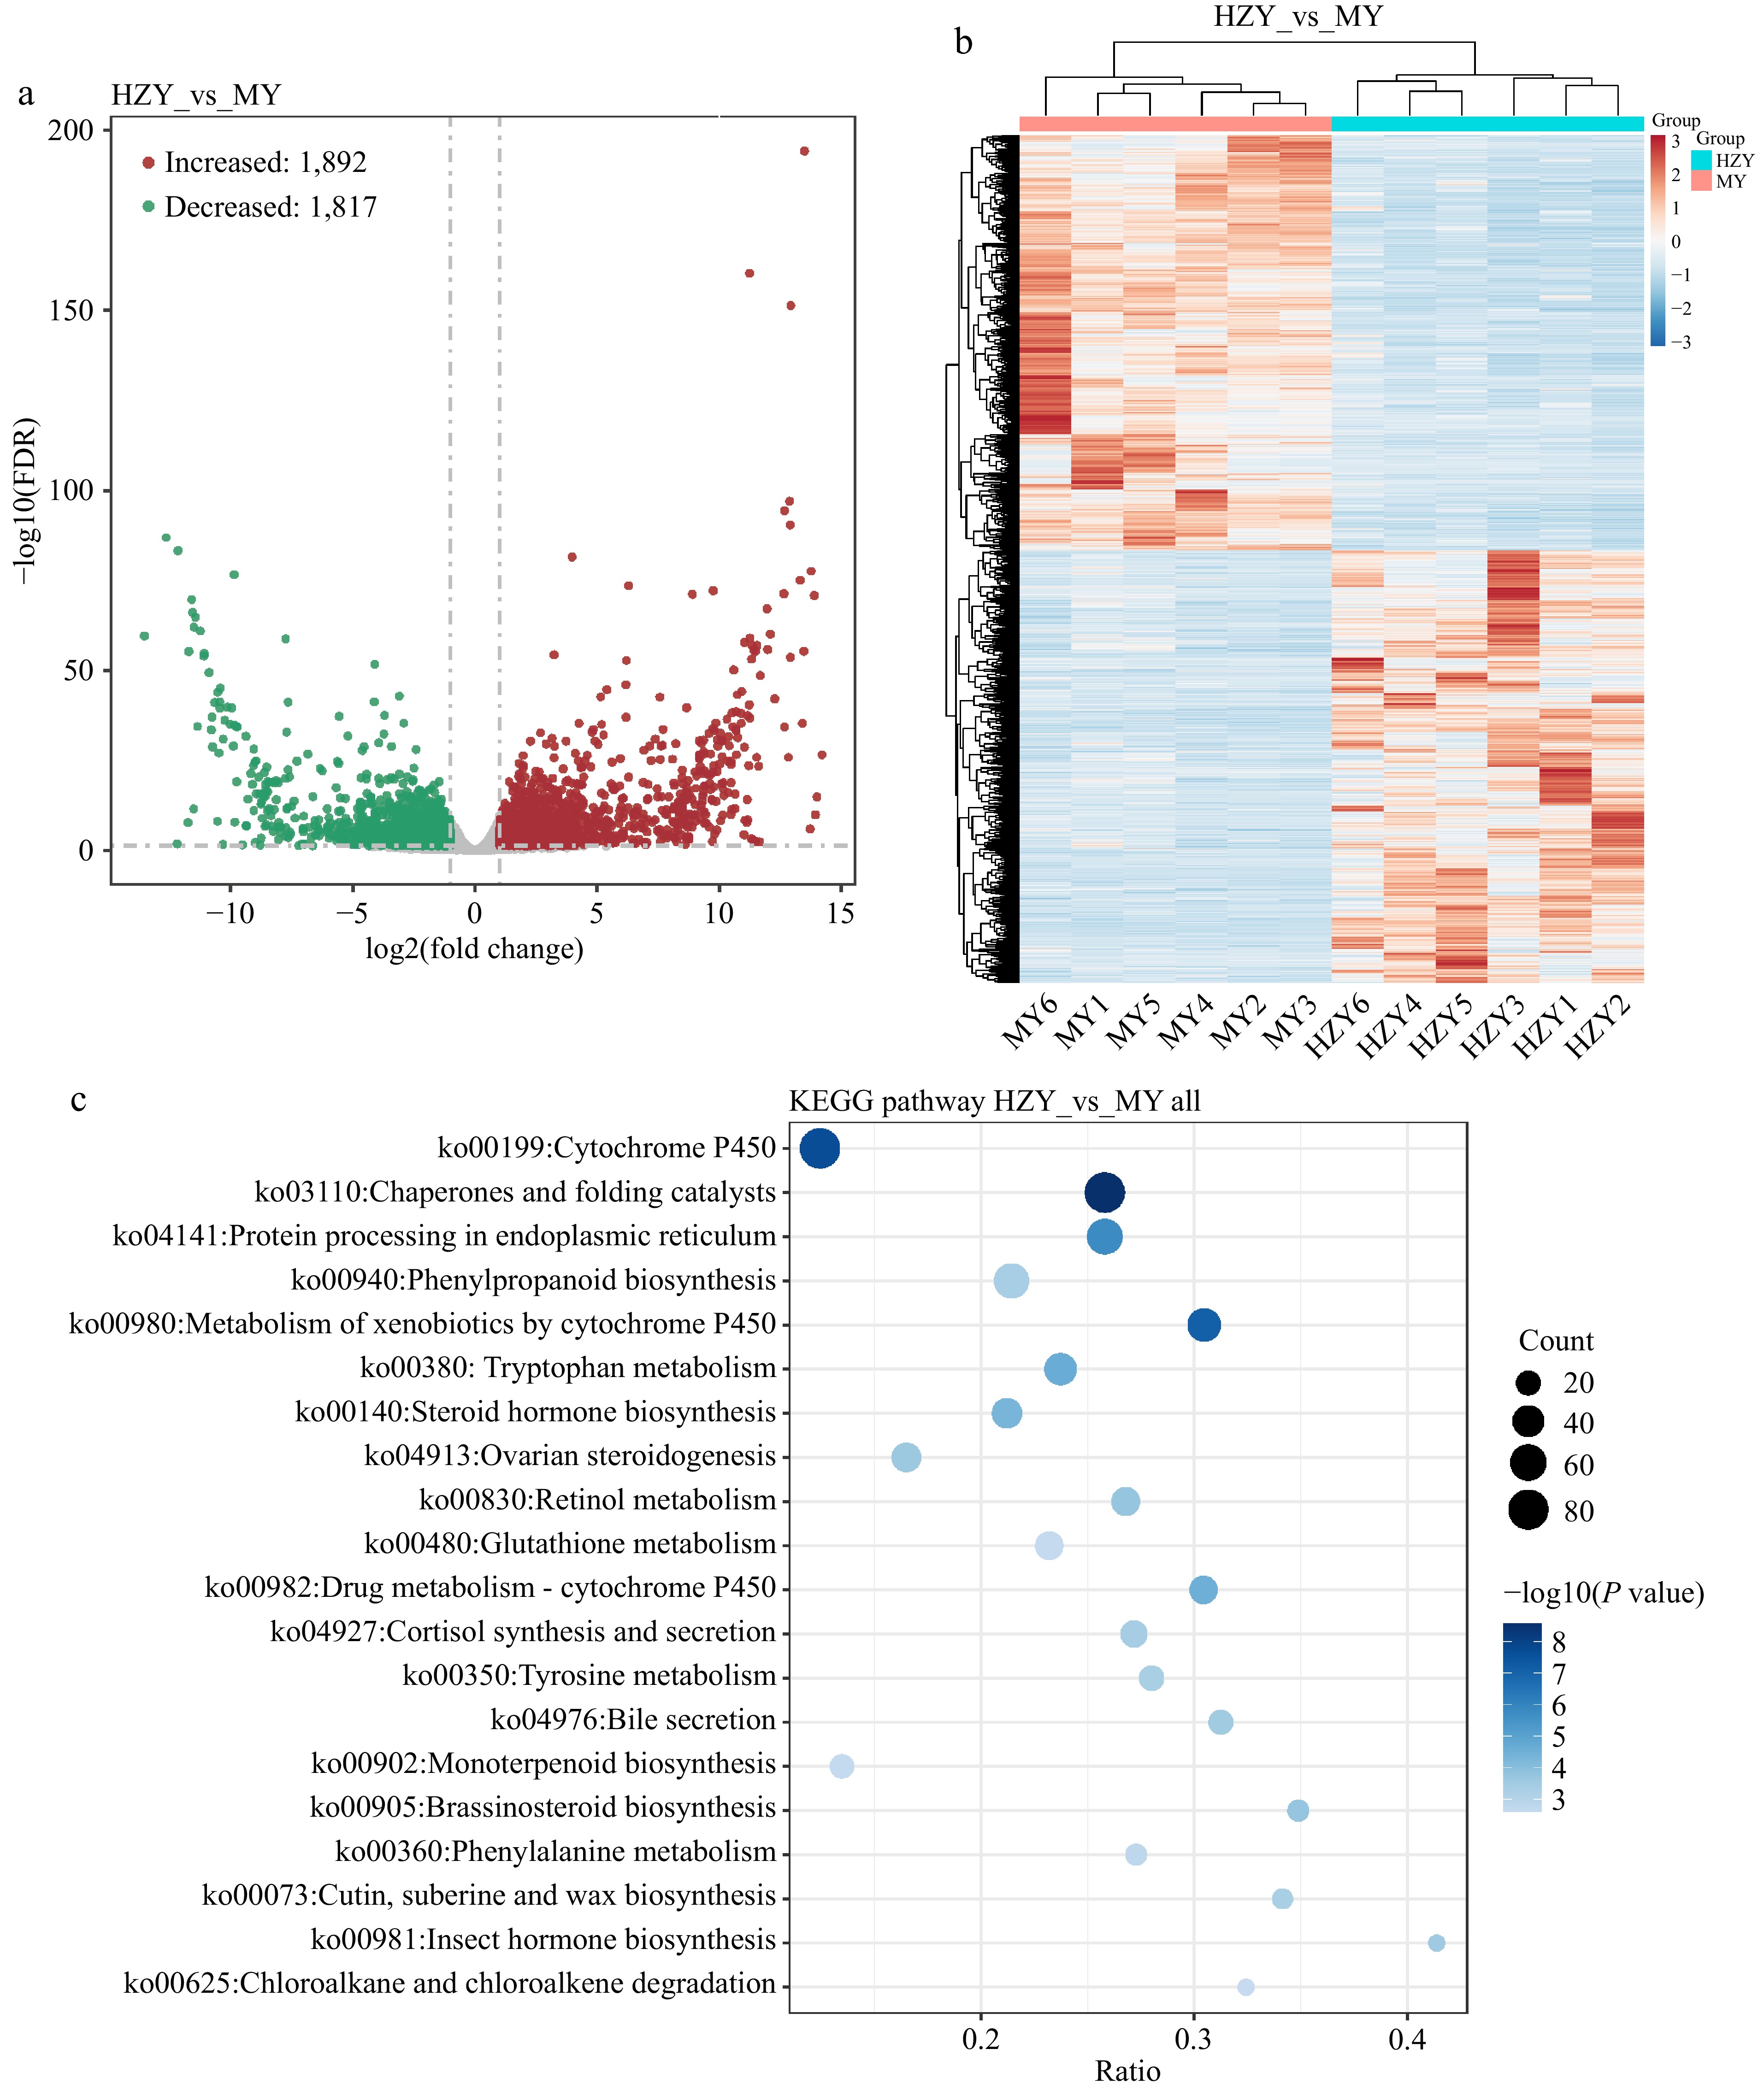
Figure 5.
Transcriptomic results of Huazhou pomelo and Sanhong pomelo. (a) Volcano plot of differentially expressed genes. The x-axis represents the logarithmic value of the fold change in gene expression (log2 fold change), and the y-axis represents the negative logarithmic value of the FDR (false discovery rate). Each point represents a gene, with red points indicating upregulated genes, green points indicating downregulated genes, and gray points indicating non-significant genes. (b) Hierarchical clustering heatmap of differentially expressed genes. Columns represent different samples, and rows represent different genes. Red and blue indicate high and low gene expression in the samples, respectively. (c) Bubble chart of KEGG pathway enrichment analysis for differentially expressed genes. The x-axis represents the ratio of differentially expressed genes enriched in the pathway to the total number of genes enriched in the pathway. Larger values indicate a higher degree of enrichment of differentially expressed genes in the KEGG pathway.
-
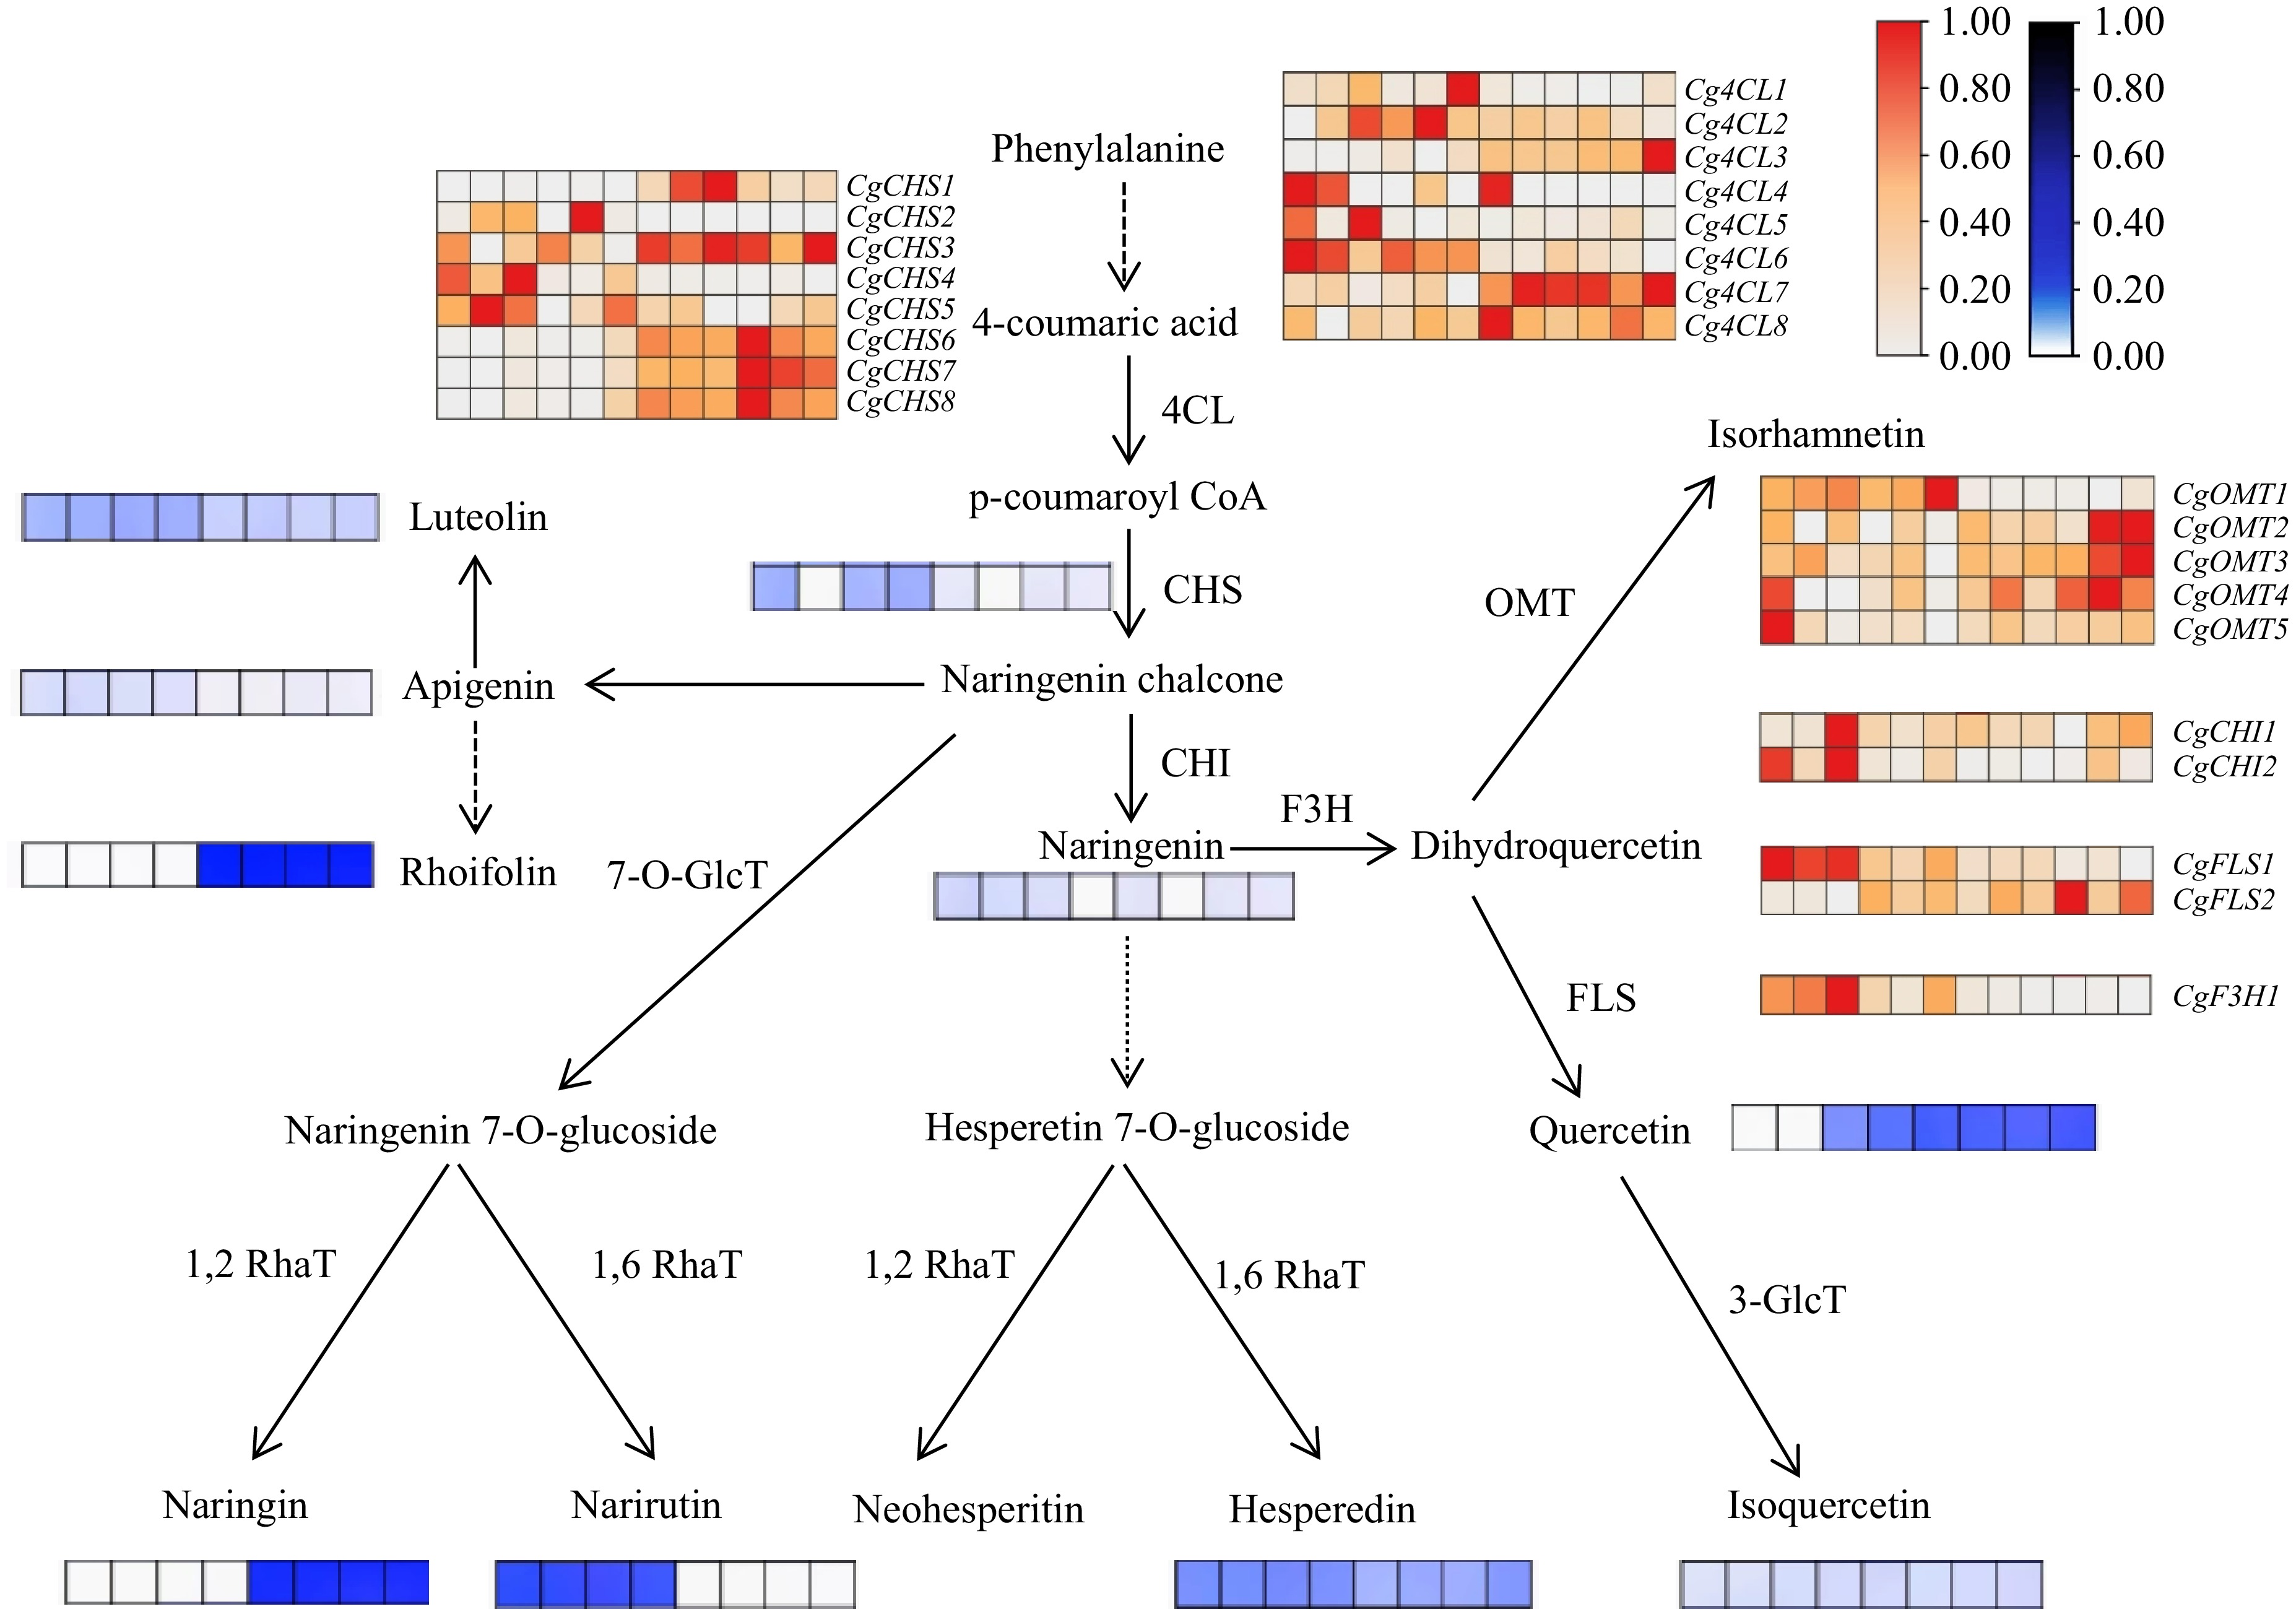
Figure 6.
Flavonoid biosynthesis pathway in Huazhou pomelo. In the heatmap, the samples are arranged from left to right as H1, H2, H3, H4, H5, H6, M1, M2, M3, M4, M5, and M6. Gene expression levels are represented by FPKM values obtained from transcriptome sequencing, with colors ranging from white to red to indicate low to high FPKM values. Additionally, heatmaps depicting the content of certain flavonoid monomers, determined via HPLC, are illustrated around the pathway. Here, colors range from white to blue to represent low to high flavonoid content. The samples for these heatmaps are arranged from left to right as H1, H2, H3, H4, M1, M2, M3, and M4.
-
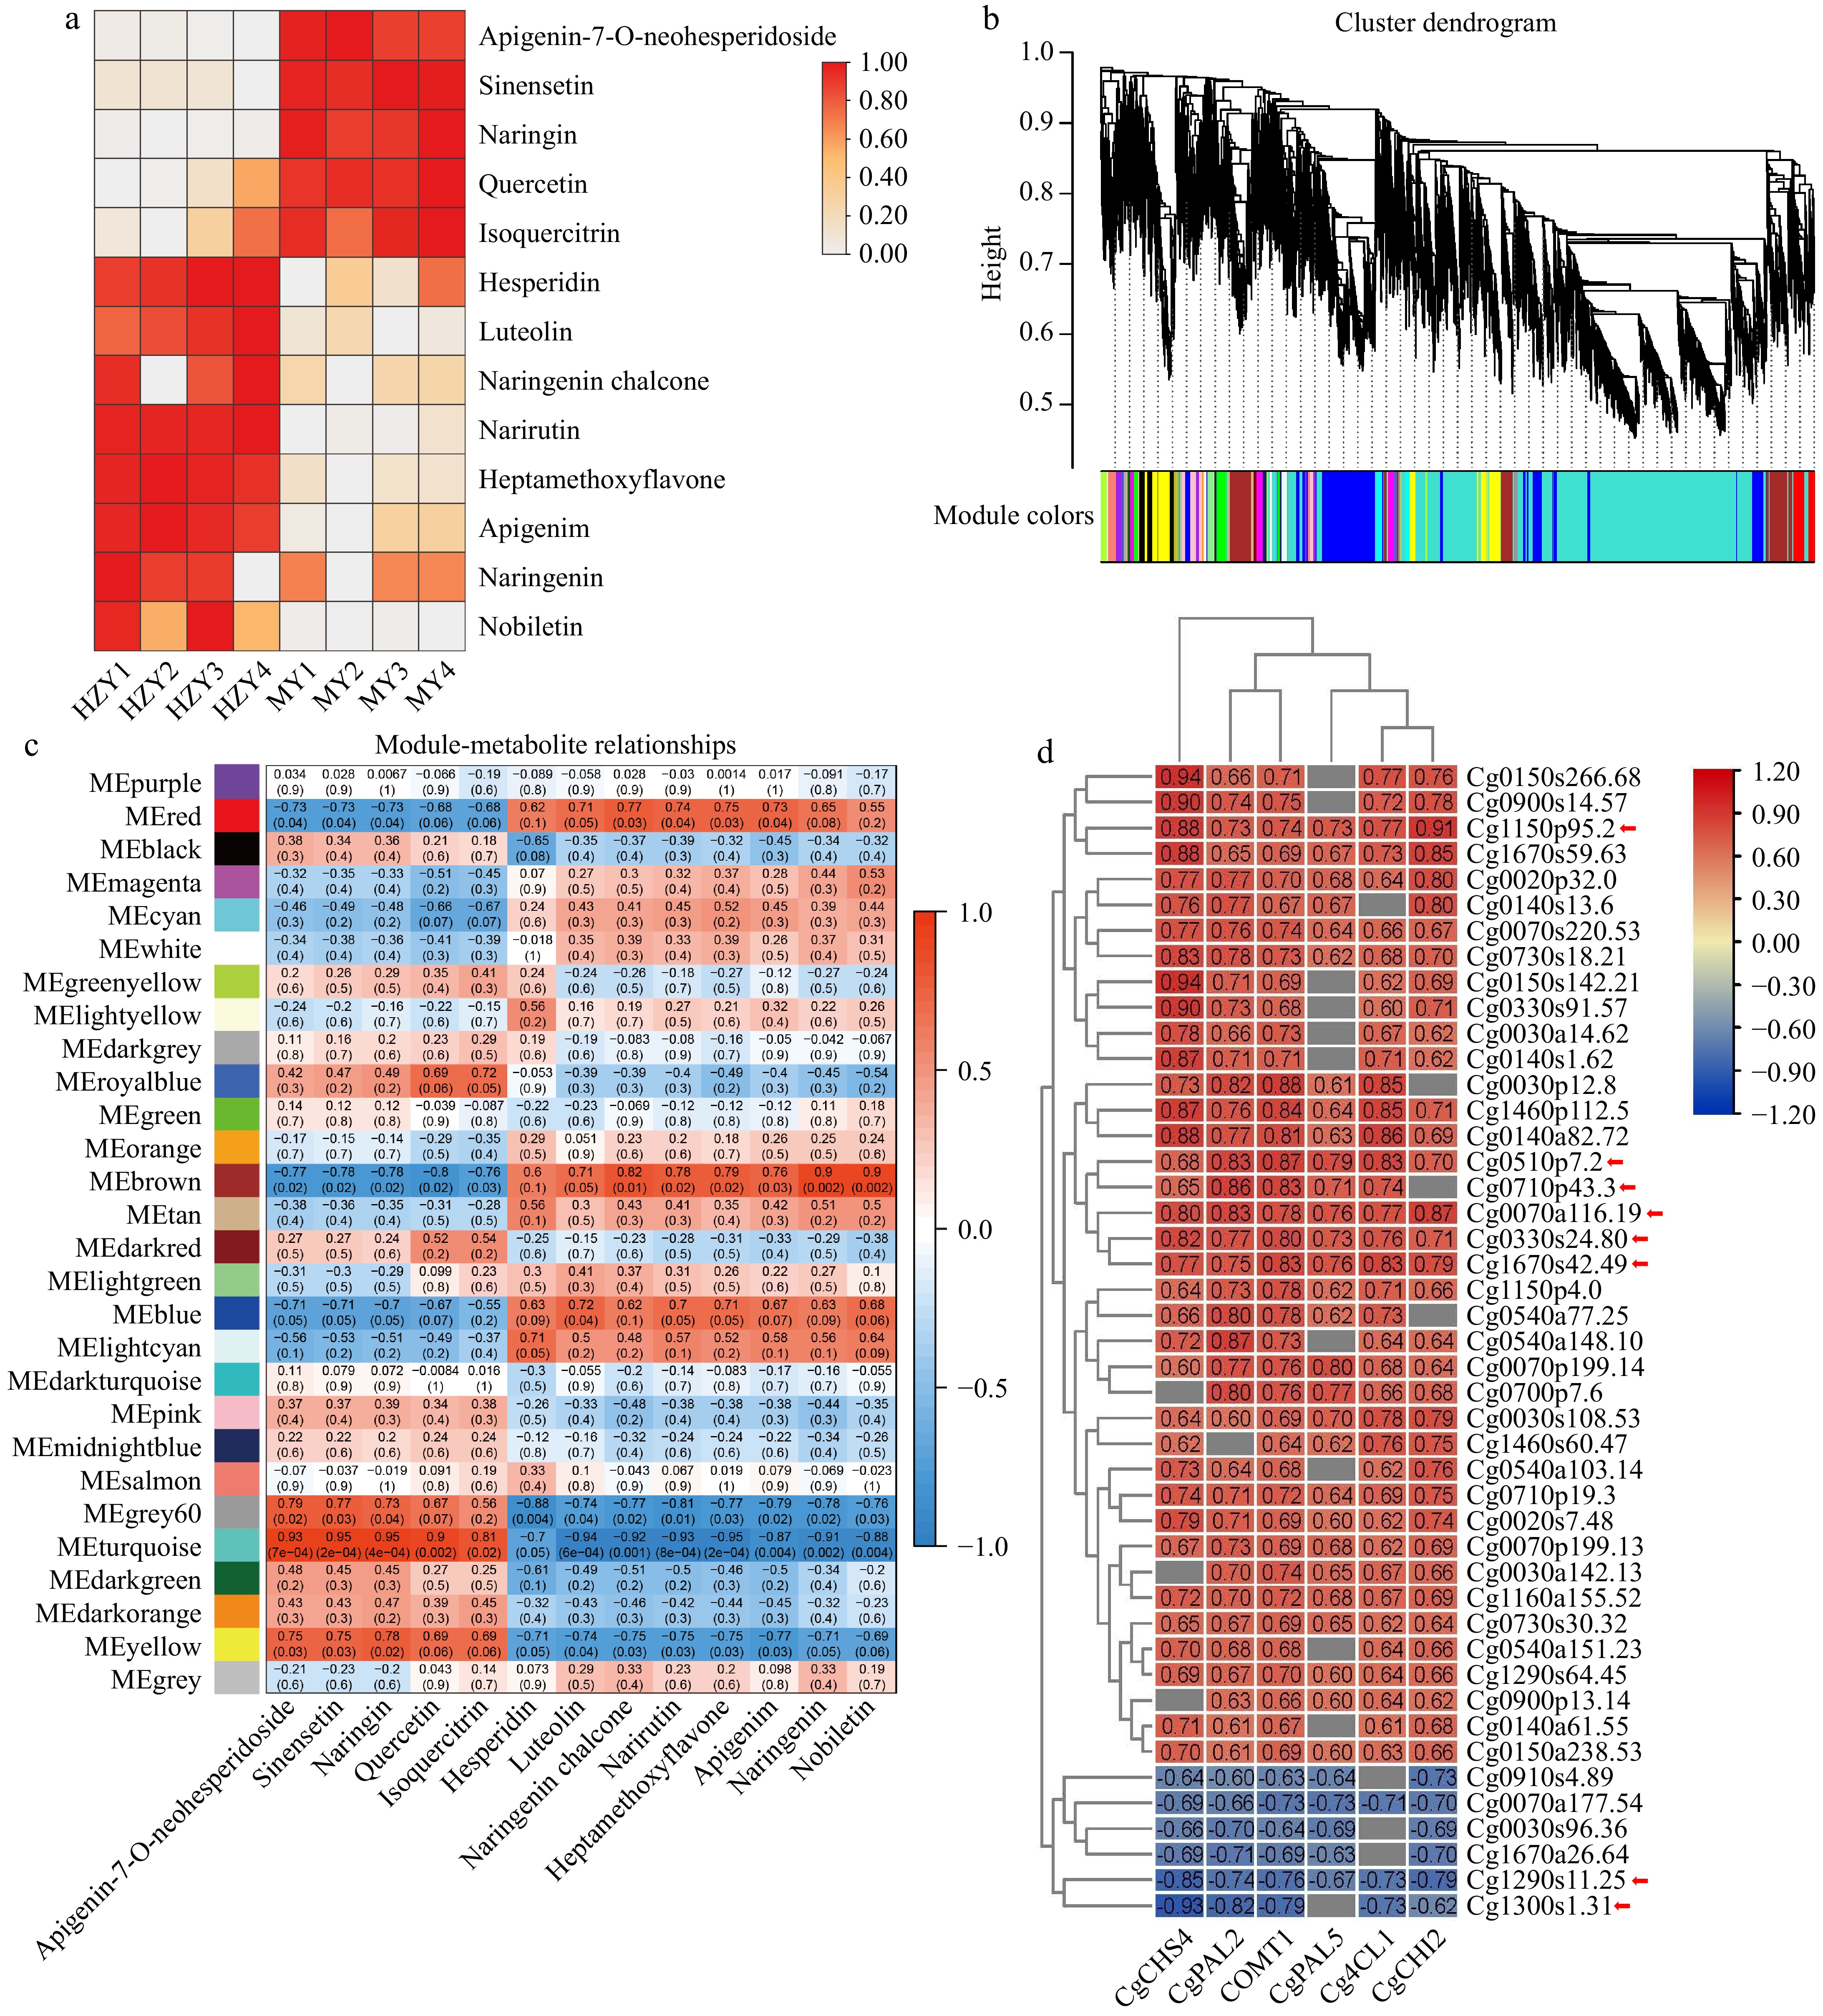
Figure 7.
Integrated analysis of metabolome and transcriptome. (a) Heatmap of the content of selected flavonoid monomers, with colors ranging from white to red indicating low to high flavonoid content. H1-4 represent Huazhou pemelo, and M1-4 represent Sanhong pomelo. (b) Hierarchical clustering dendrogram, showing 28 co-expression gene modules identified by WGCNA. (c) Correlation between flavonoids and WGCNA modules. The axes represent the 28 modules obtained from WGCNA and the different types of flavonoids, respectively. Each intersection in the grid shows the Pearson correlation coefficient and p-value for the module and flavonoid. The Pearson coefficient with large correlation indicates the strong correlation of the corresponding module with flavonoids. (d) Correlation analysis between important structural genes and genes. The x-axis represents the different structural genes, while the y-axis represents the hub genes. Each intersection in the grid displays the correlation coefficient values between the structural genes and hub genes.
-
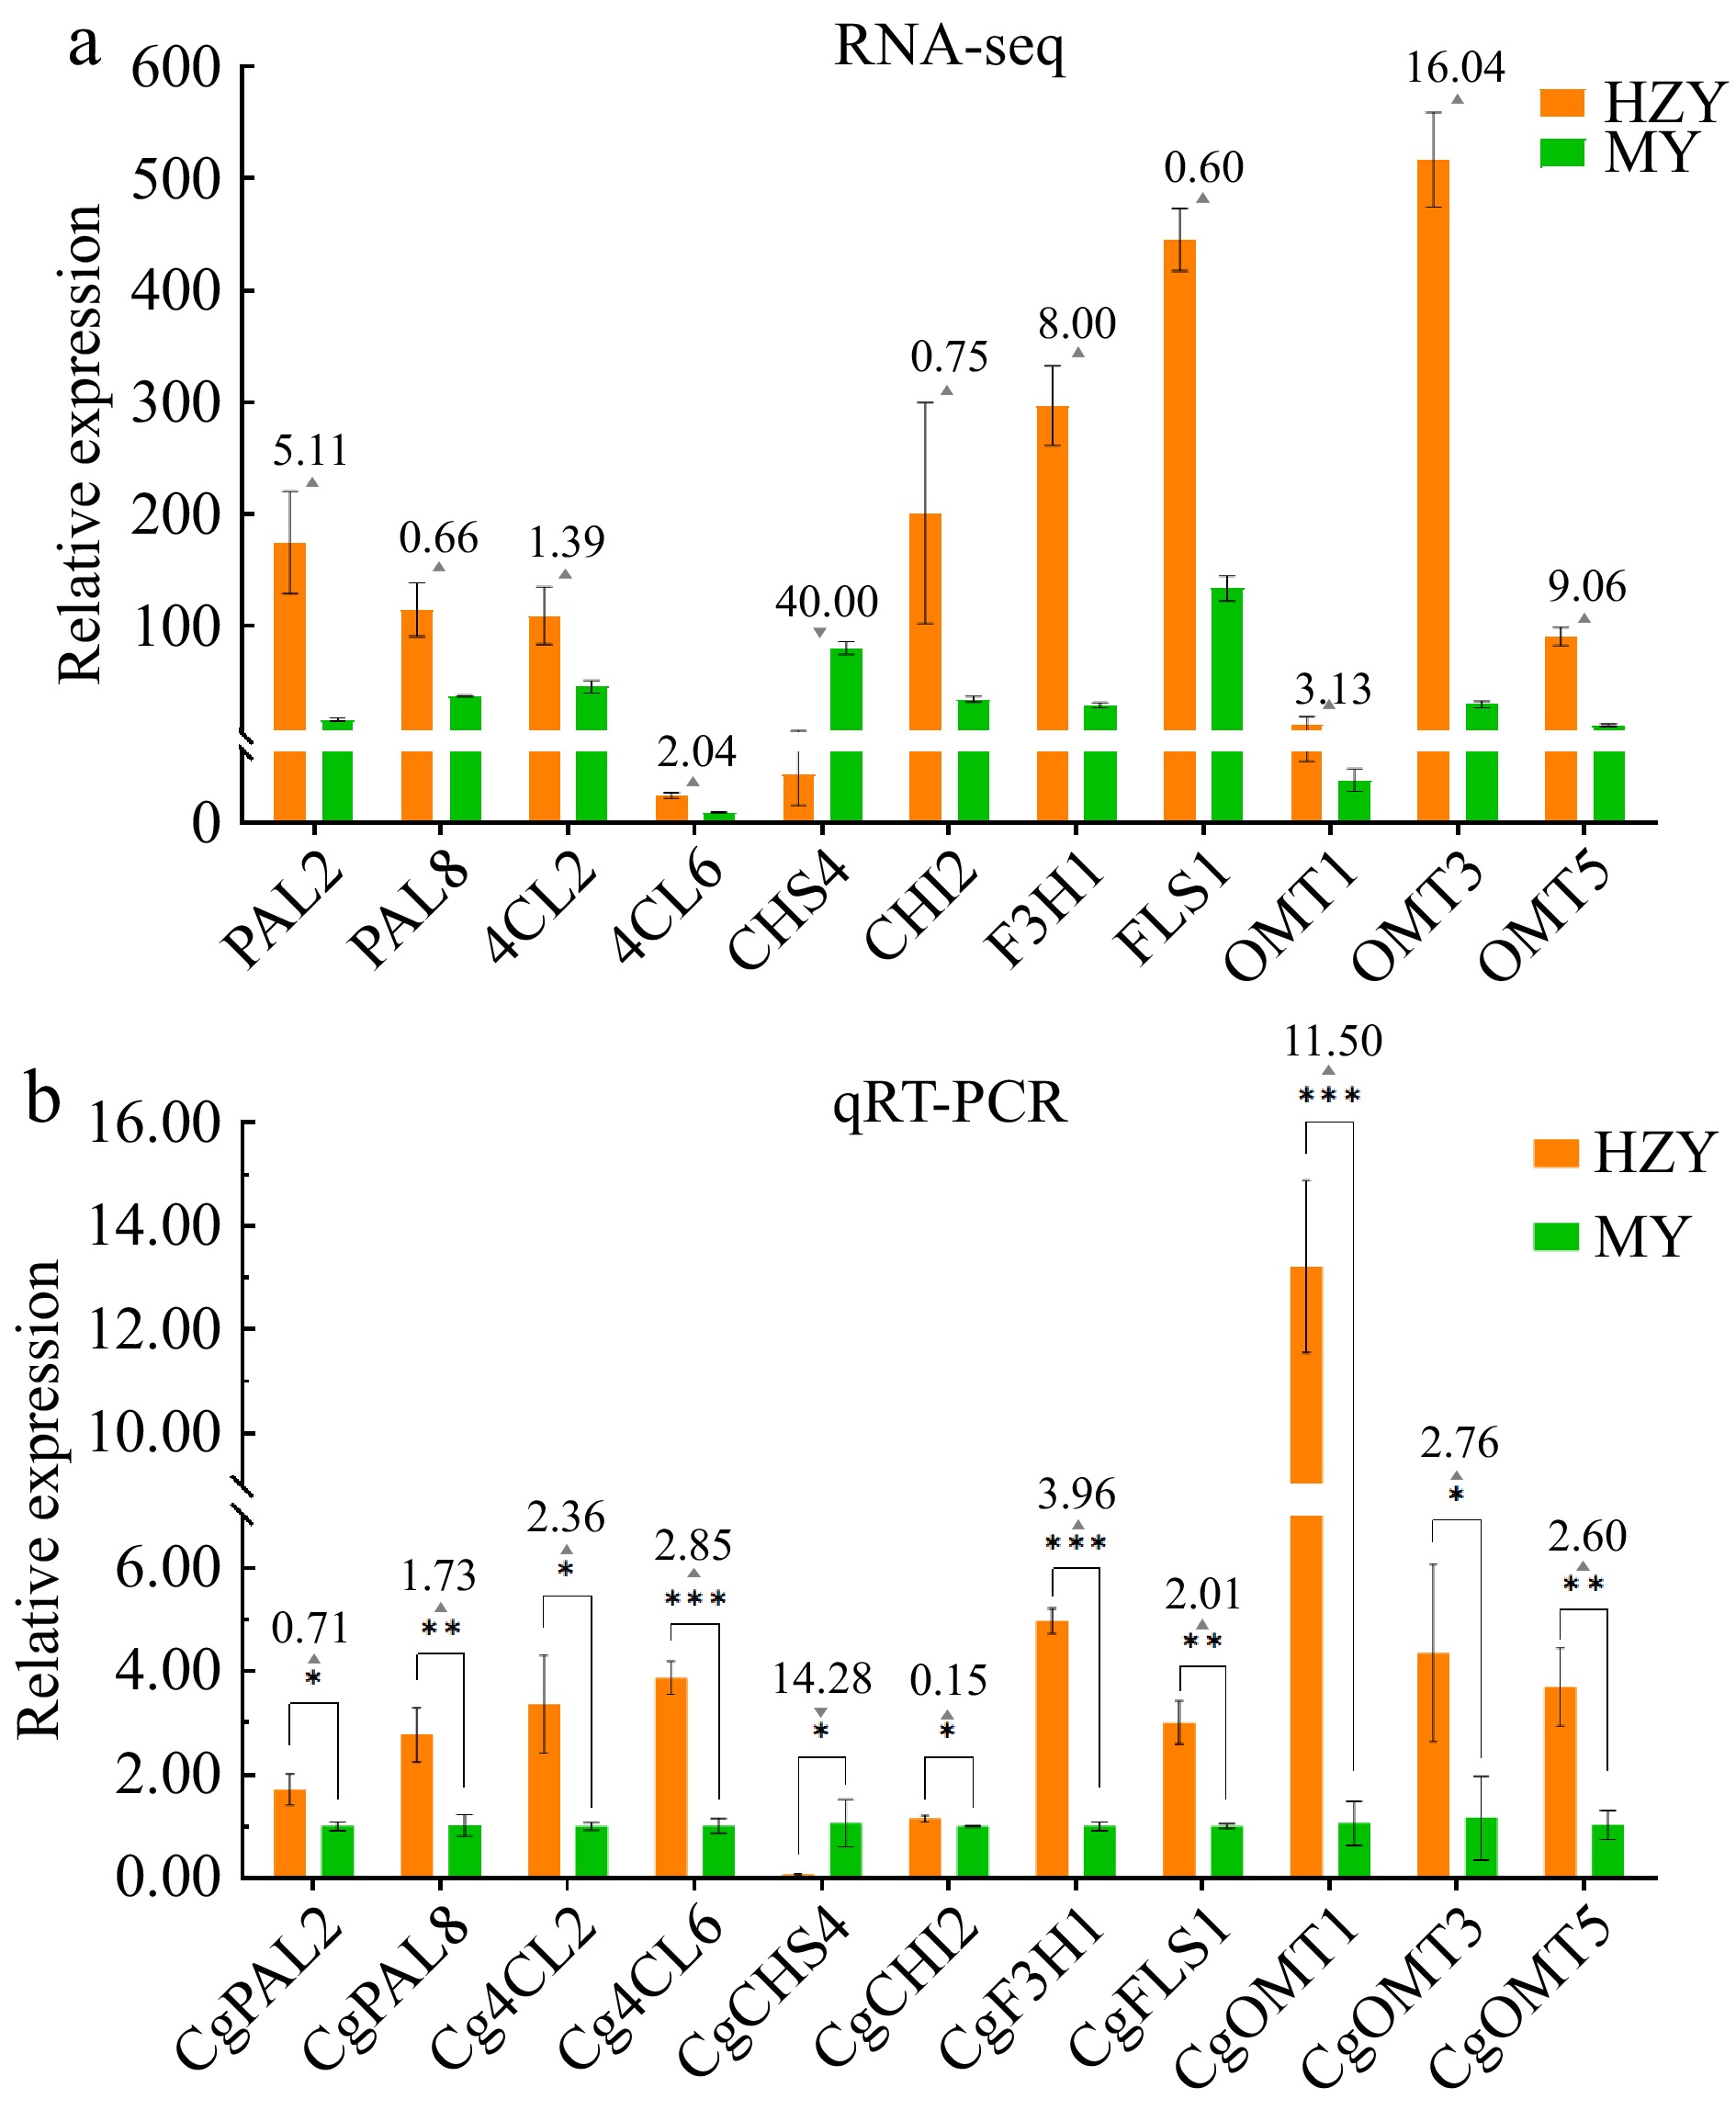
Figure 8.
Expression pattern of 11 key flavonoid biosynthesis genes in Huazhou and Sanhong pomelo. (a) Transcriptomic analysis of the expression pattern of 11 key genes in the flavonoid biosynthesis pathway. (b) Expression patterns of 11 key genes flavonoid biosynthesis pathway determined by qRT-PCR. Note: Upward triangles indicate the fold increase in relative gene expression of Huazhou pomelo (HZY) compared to Sanhong pomelo (MY). Downward triangles indicate the fold decrease in relative gene expression of Huazhou pomelo (HZY) compared to Sanhong pomelo (MY).
Figures
(8)
Tables
(0)