-
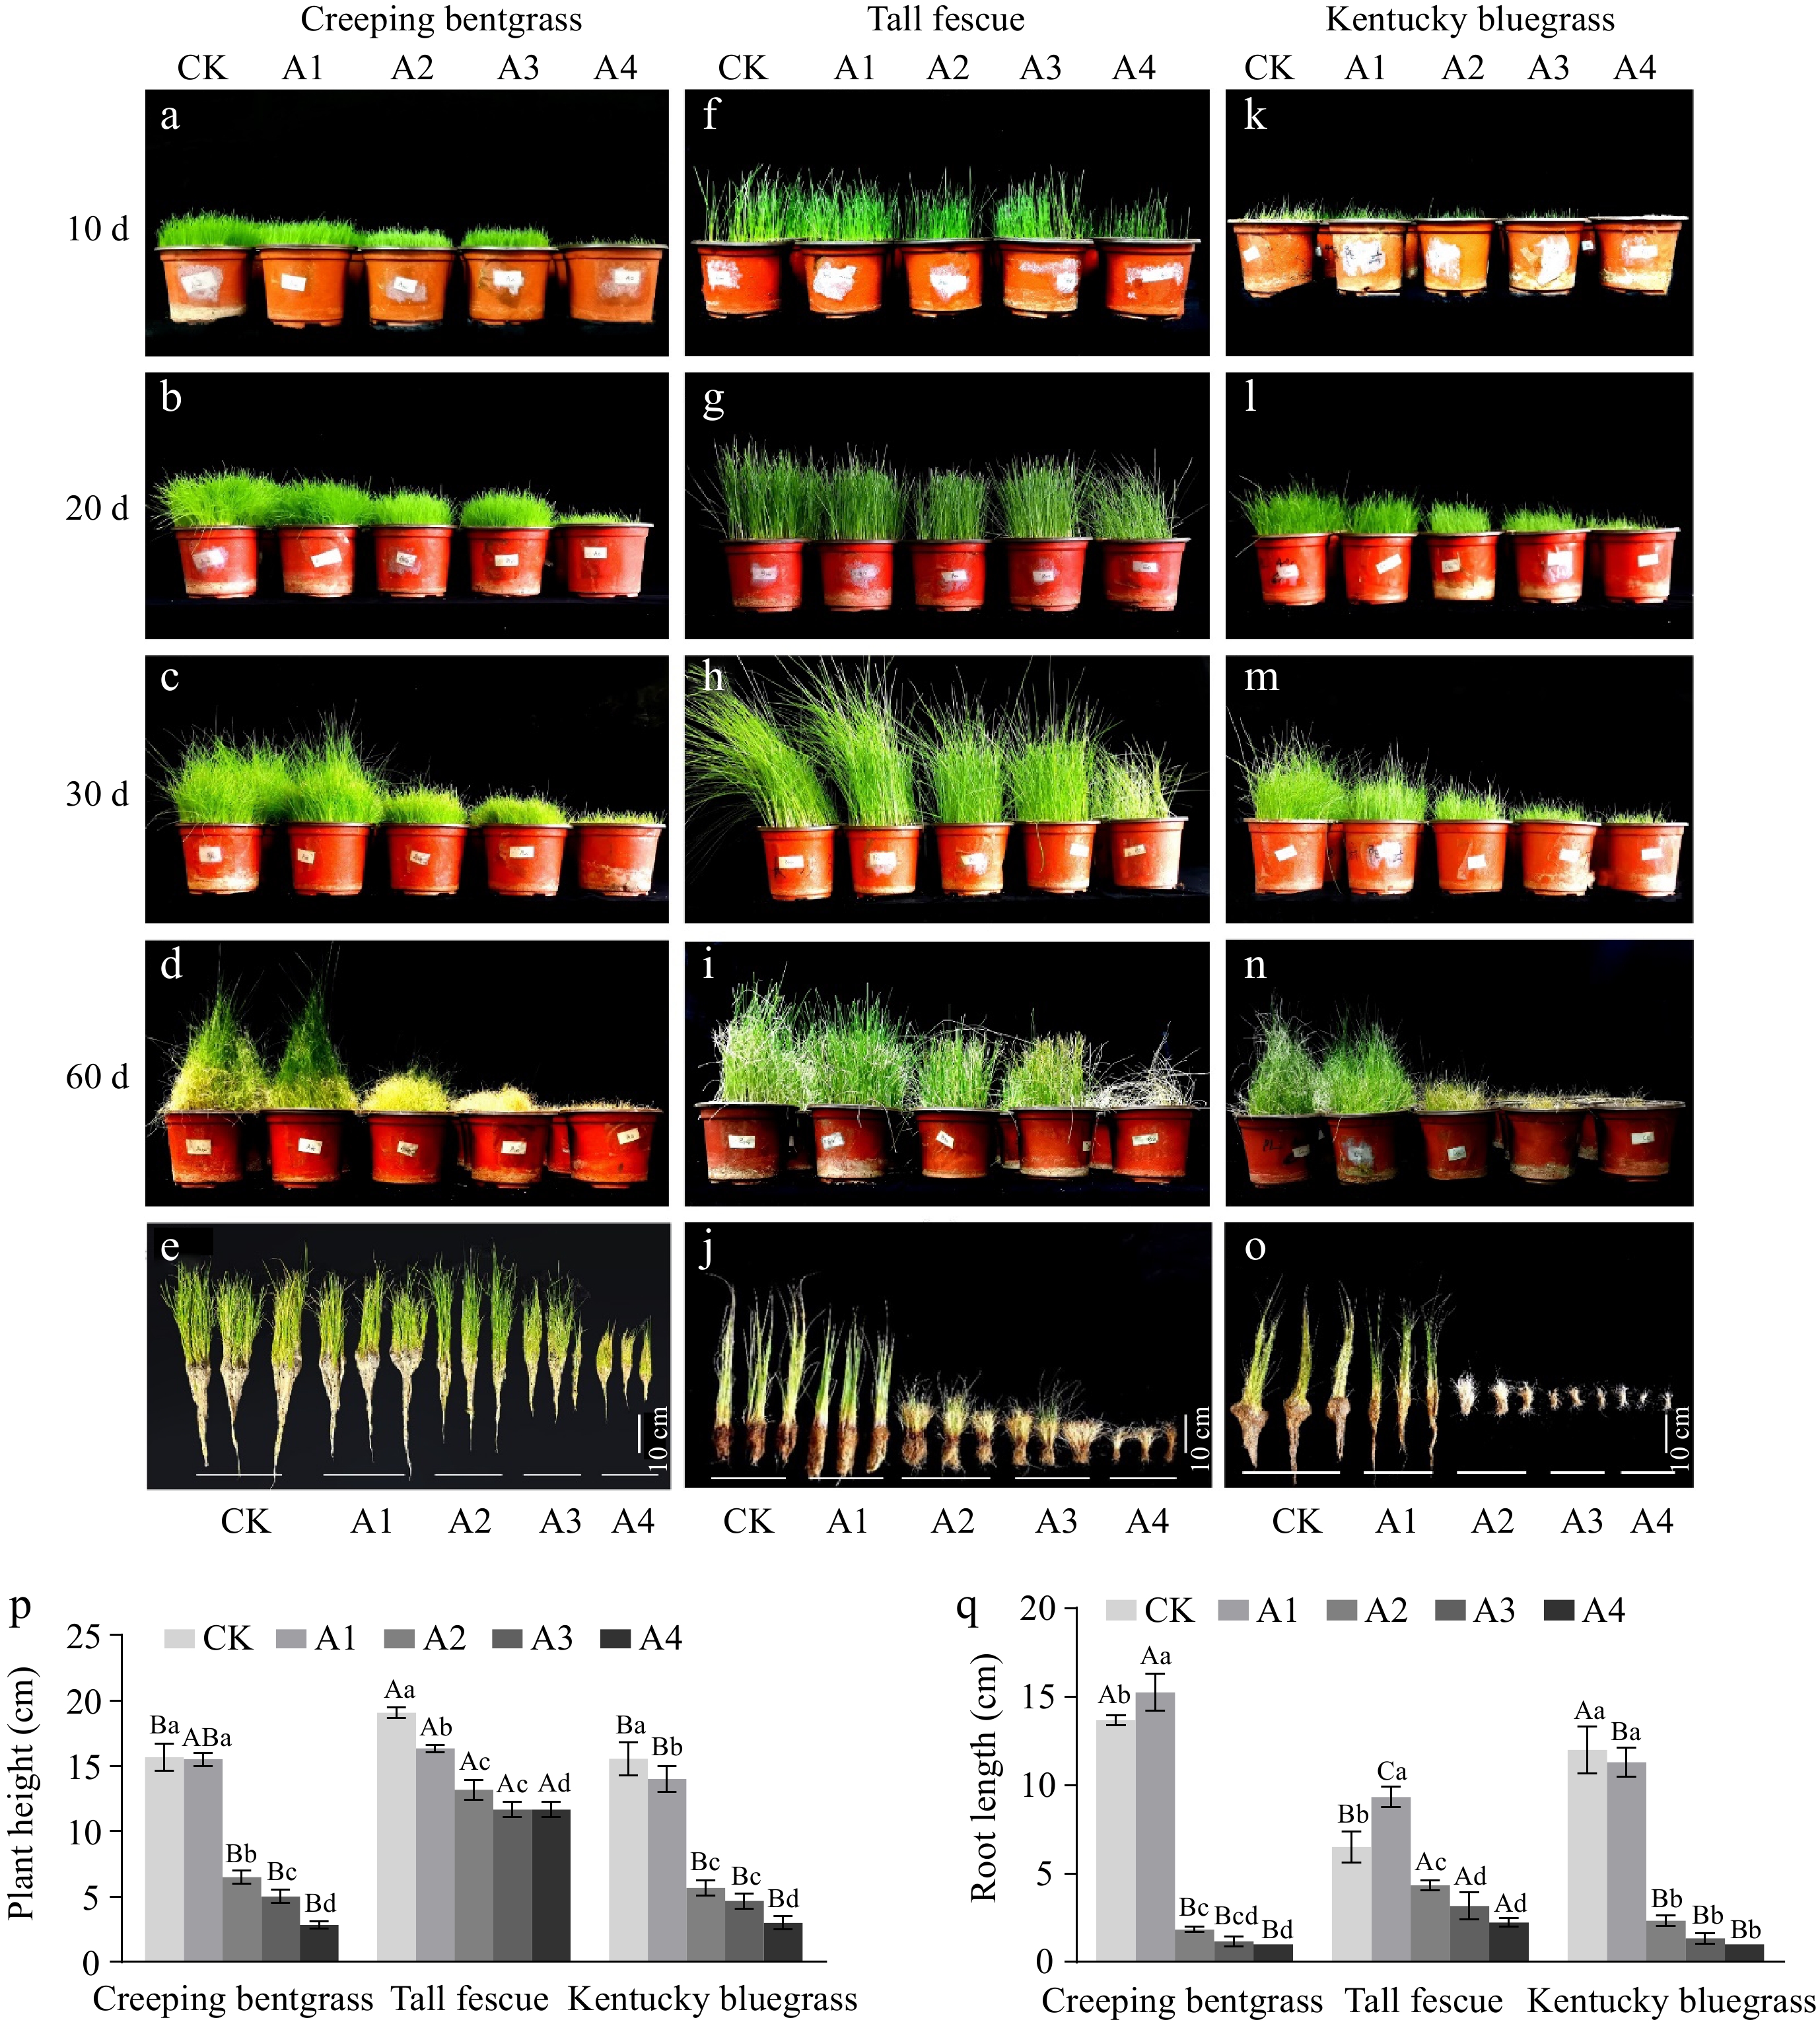
Figure 1.
Effect of adding iron tailing sand on plant height and root length of three cool-season turfgrass species. Plant height of creeping bentgrass after (a) 10, (b) 20, (c) 30, and (d) 60 d of sowing. Plant height of tall fescue after (f) 10, (g) 20, (h) 30, and (i) 60 d of sowing. Plant height after (k) 10, (l) 20, (m) 30, and (n) 60 d of sowing of Kentucky bluegrass. Root length of (e) creeping bentgrass two months after sowing, (o) Kentucky bluegrass, and (j) tall fescue six months after sowing. The (p) plant height, and (q) root length of three types of cool-season turfgrass in nutritional substrate treatments with different proportions of iron tailing sand. Data are presented as means of three technical replicates, and error bars represent SD. Different lowercase letters indicate significant differences between the same grass species and different iron tailing sand treatments (p < 0.05), different uppercase letters indicate significant differences between different grass species and the same iron tailing sand treatment (p < 0.05).
-
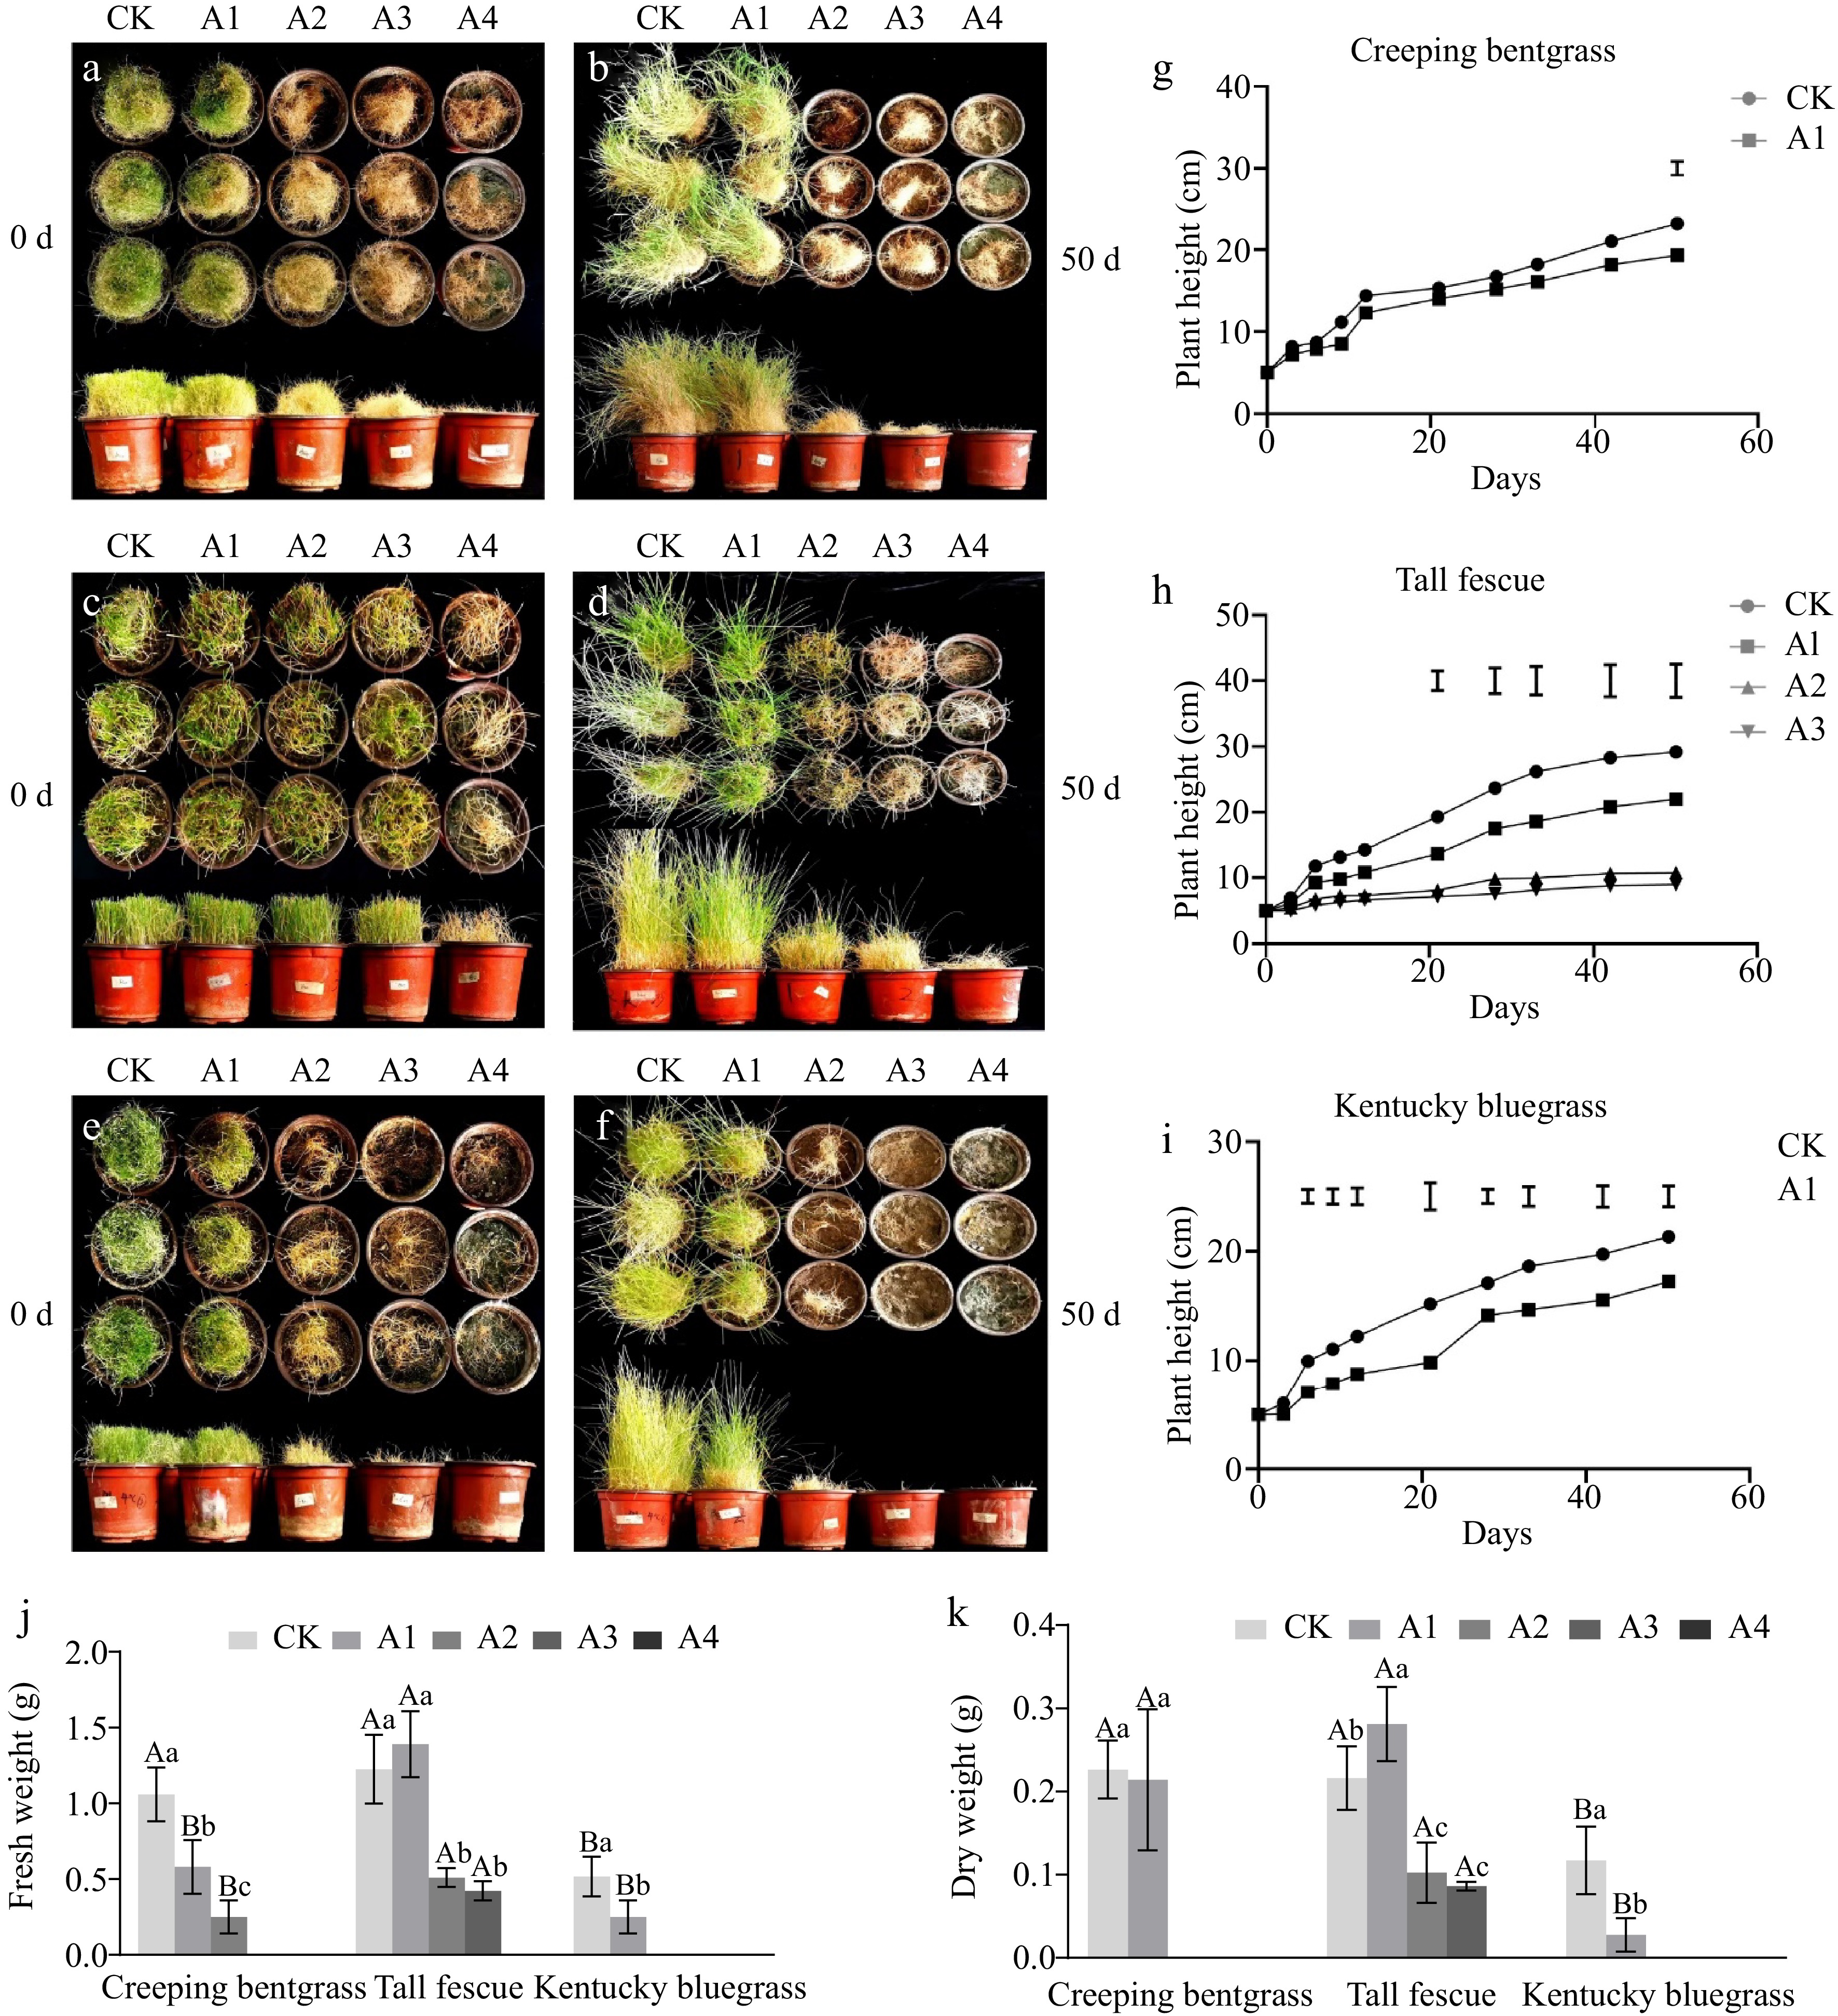
Figure 2.
Effect of nutrient substrates with different proportions of iron tailing sand on the growth rate of three cool-season turfgrasses. Fully developed (a) creeping bentgrass, (c) tall fescue, and (e) Kentucky bluegrass grown in pots were mowed to the same height of 5 cm. Fifty days growth of (b) creeping bentgrass, (d) tall fescue, and (f) Kentucky bluegrass after the first mowing. Growth rate of (g) creeping bentgrass, (h) tall fescue, and (i) Kentucky bluegrass in the natural state from the first mowing to 50 d later. The (j) fresh weight, and (k) dry weight of three types of cool-season turfgrass in nutritional substrate treatments with different proportions of iron tailing sand. A2 (50% nutrient substrate with 50% tailing sand), A3 (25% nutrient substrate with 75% iron tailing sand), A4 (pure iron tailing sand) for creeping bentgrass; A4 of tall fescue (pure iron tailing sand); A2 (50% nutrient substrate with 50% iron tailing sand), A3 (25% nutrient substrate with 75% iron tailing sand), and A4 (pure iron tailing sand) of Kentucky bluegrass were dead at the time of the first pruning and were less than 5 cm tall. Data are presented as means of three technical replicates, and error bars represent SD. Vertical bars on the top indicate least significant difference values (p < 0.05) for treatment comparison. Different lowercase letters indicate significant differences between the same grass species and different iron tailing sand treatments (p < 0.05), different uppercase letters indicate significant differences between different grass species and the same iron tailing sand treatment (p < 0.05).
-
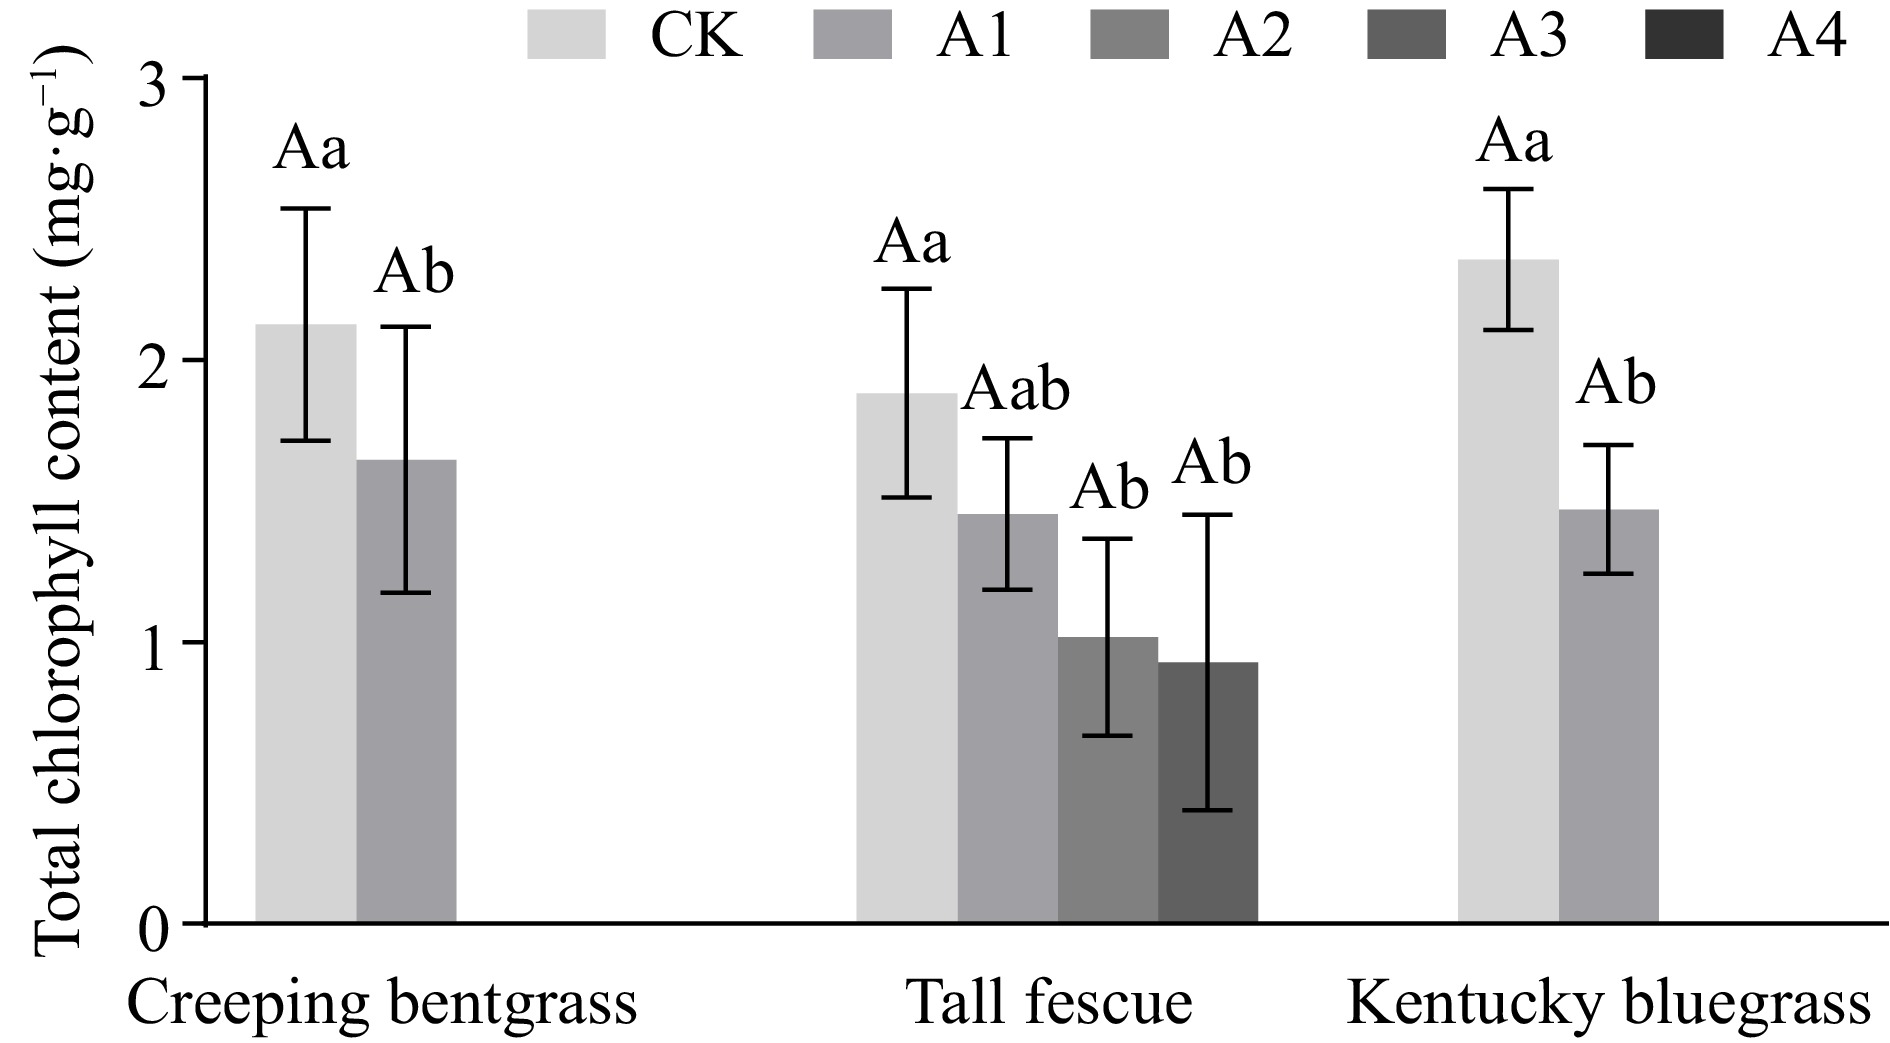
Figure 3.
Chlorophyll content of three types of cool-season turfgrass in nutritional substrate treatments with different proportions of iron tailing sand. Different lowercase letters indicate significant differences between the same grass species and different iron tailing sand treatments (p < 0.05), different uppercase letters indicate significant differences between different grass species and the same iron tailing sand treatment (p < 0.05).
-
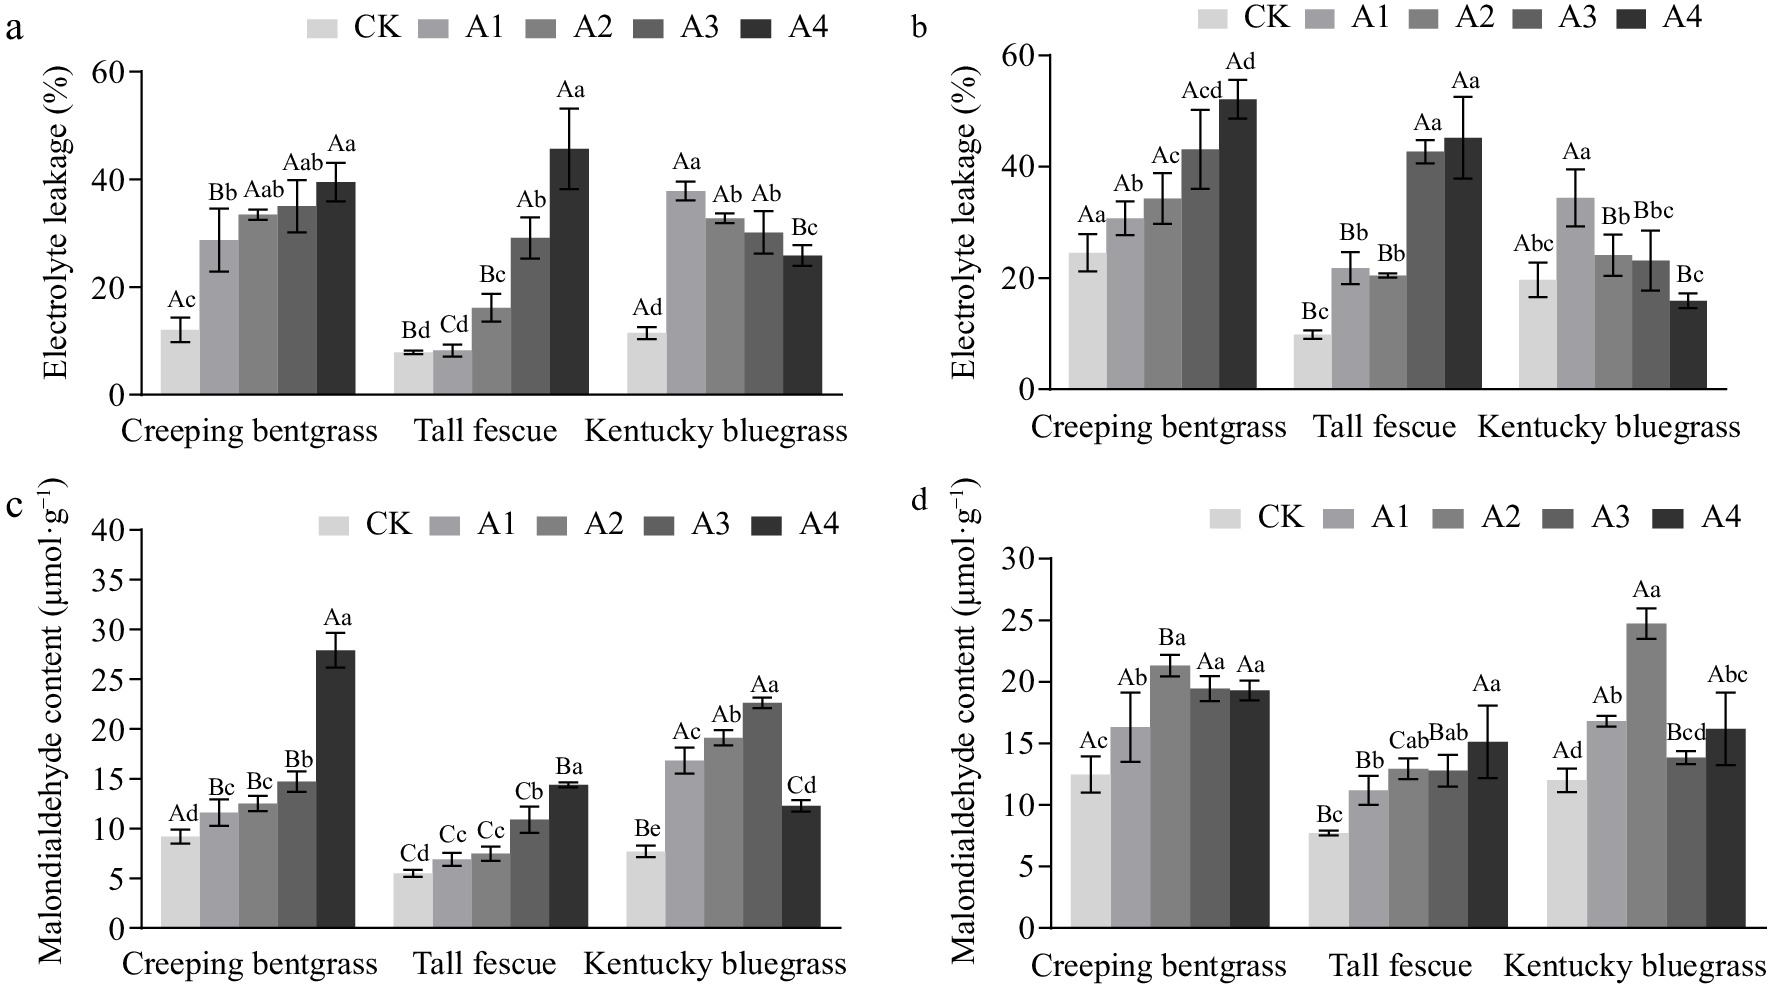
Figure 4.
Electrolyte leakage at (a) 20 and (b) 60 d and malondialdehyde content at (c) 20 and (d) 60 d in three cool-season turfgrasses treated with nutrient substrates supplemented with different proportions of iron tailing sand. Different lowercase letters indicate significant differences between the same grass species and different iron tailing sand treatments (p < 0.05), different uppercase letters indicate significant differences between different grass species and the same iron tailing sand treatment (p < 0.05).
-
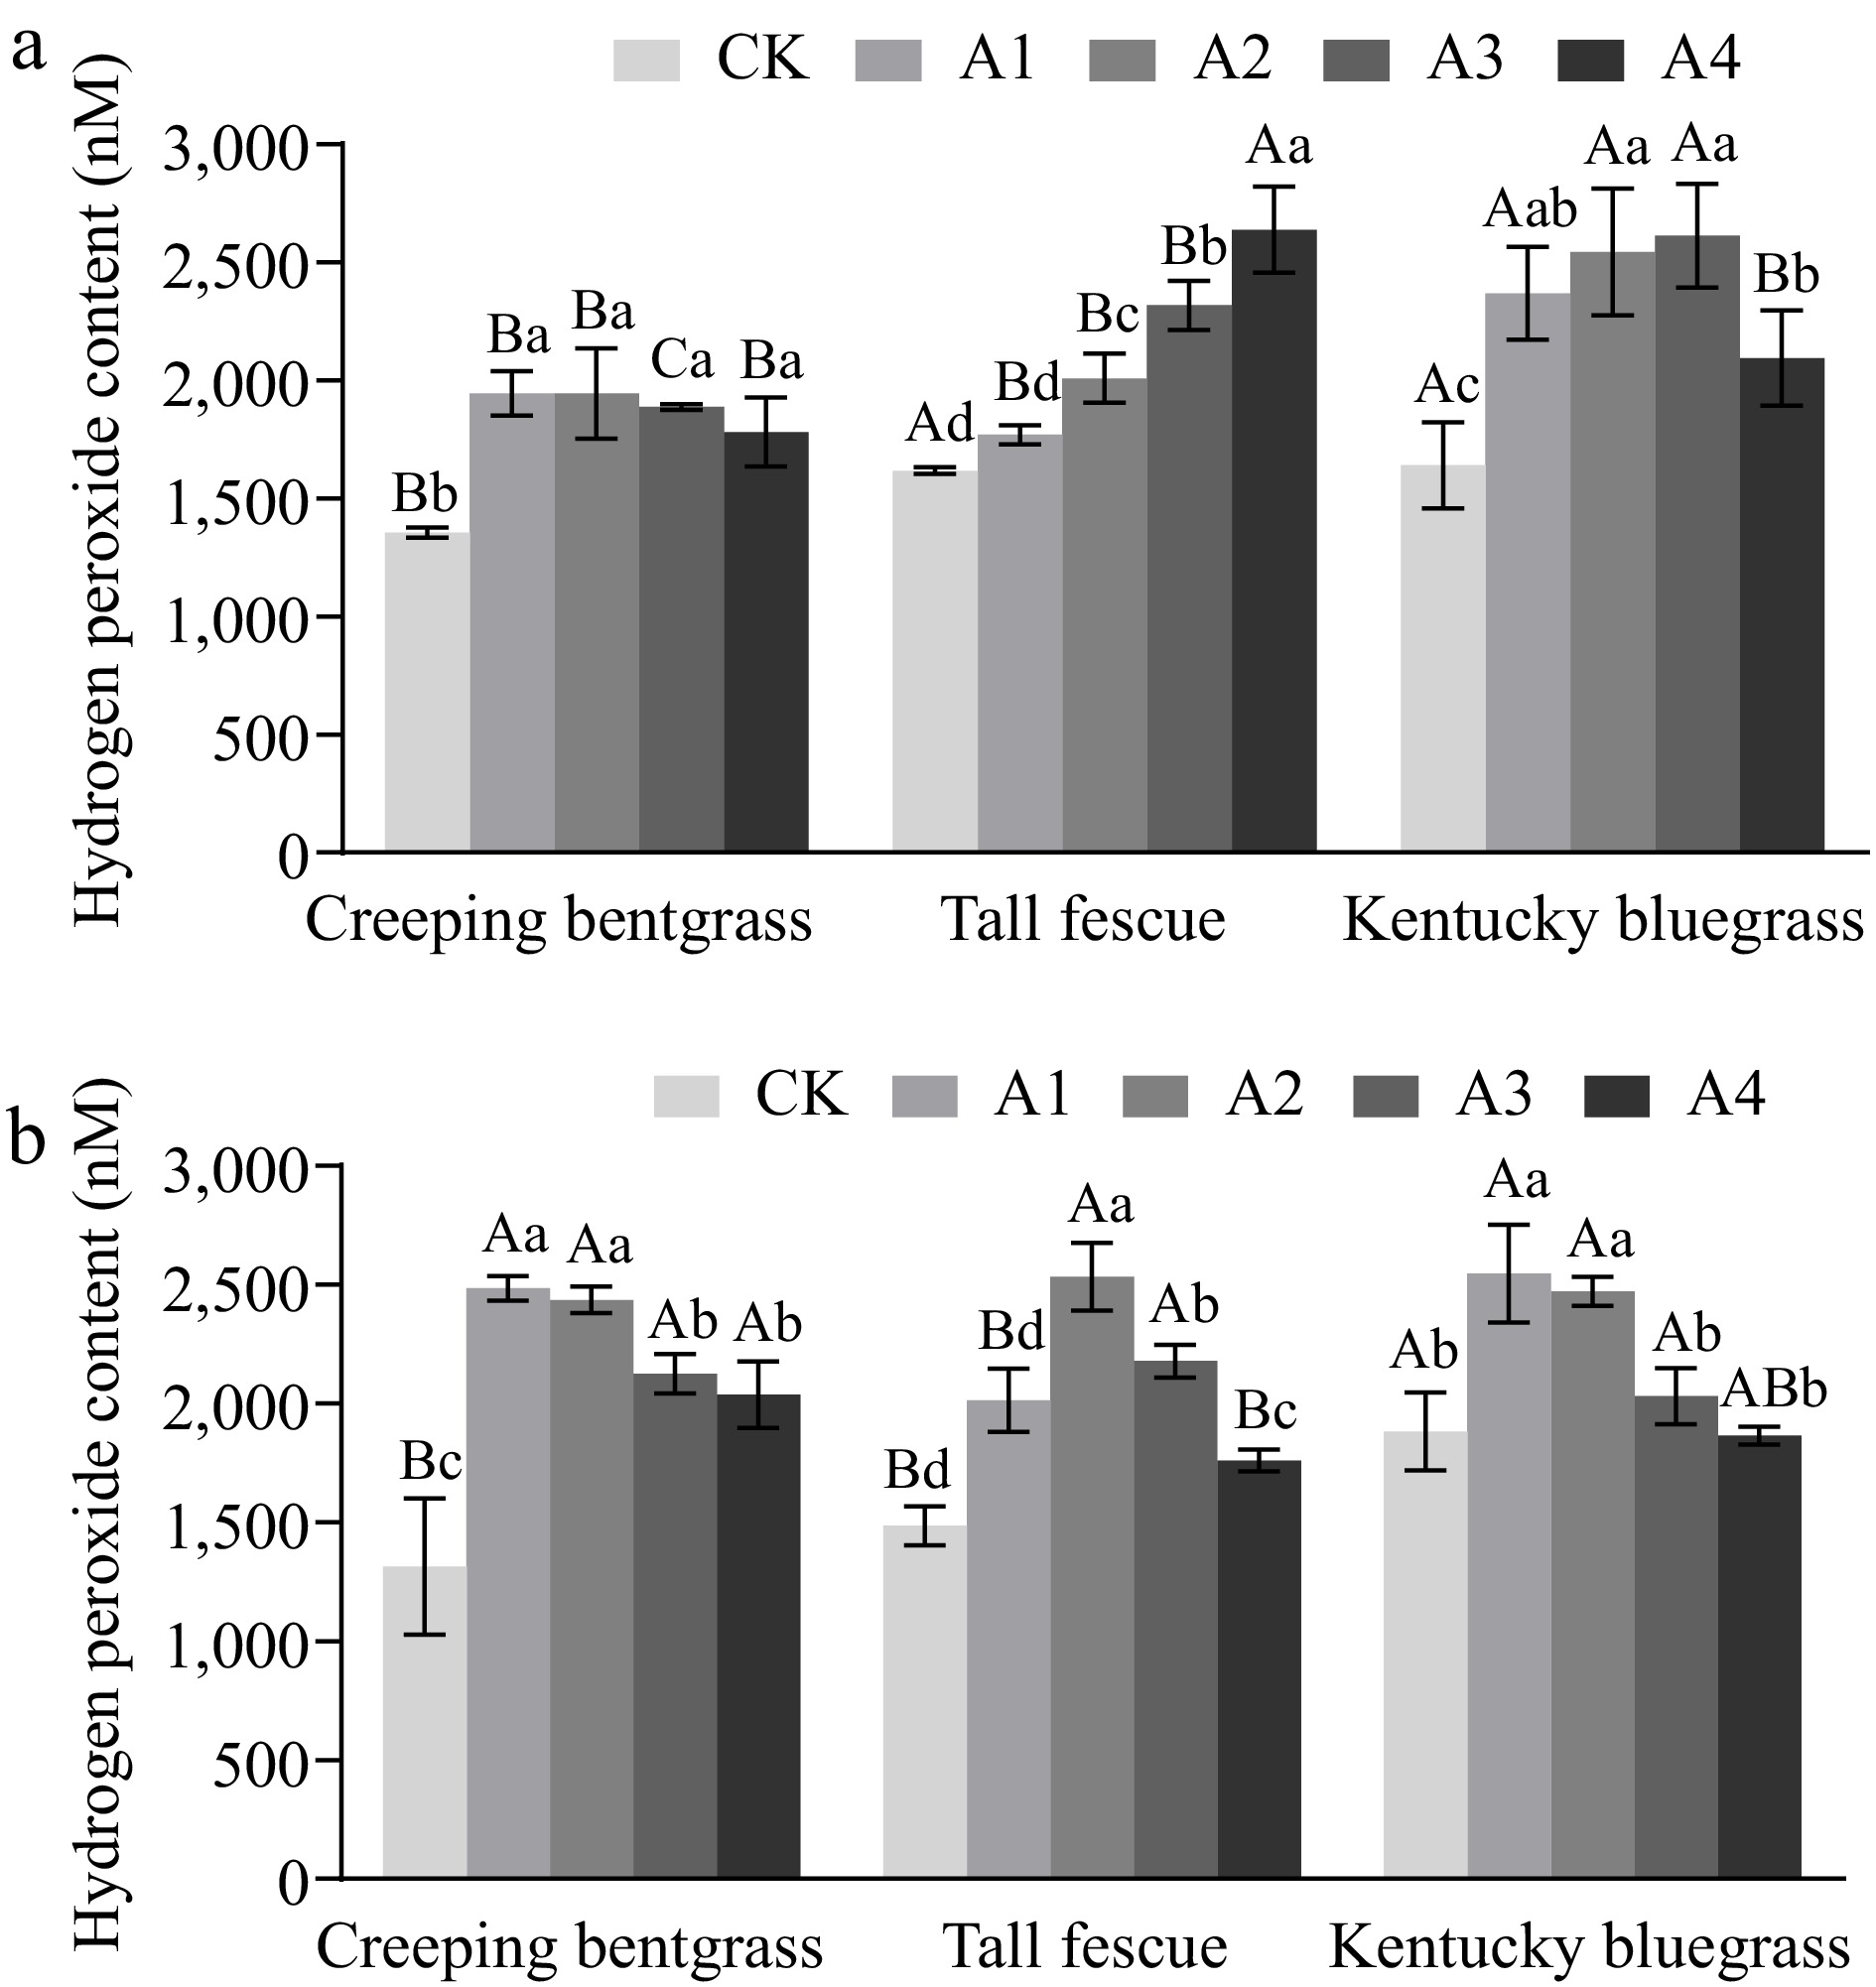
Figure 5.
H2O2 content of three types of cool-season turfgrass after (a) 20 and (b) 60 d of treatment with nutritional substrates amended with different proportions of iron tailing sand. Different lowercase letters indicate significant differences between the same grass species and different iron tailing sand treatments (p < 0.05), different uppercase letters indicate significant differences between different grass species and the same iron tailing sand treatment (p < 0.05).
-

Figure 6.
Soluble protein content of three types of cool-season turfgrass in substrates treated with iron tailing sand at different ratios after (a) 20 and (b) 60 d. Different lowercase letters indicate significant differences between the same grass species and different iron tailing sand treatments (p < 0.05), different uppercase letters indicate significant differences between different grass species and the same iron tailing sand treatment (p < 0.05).
-
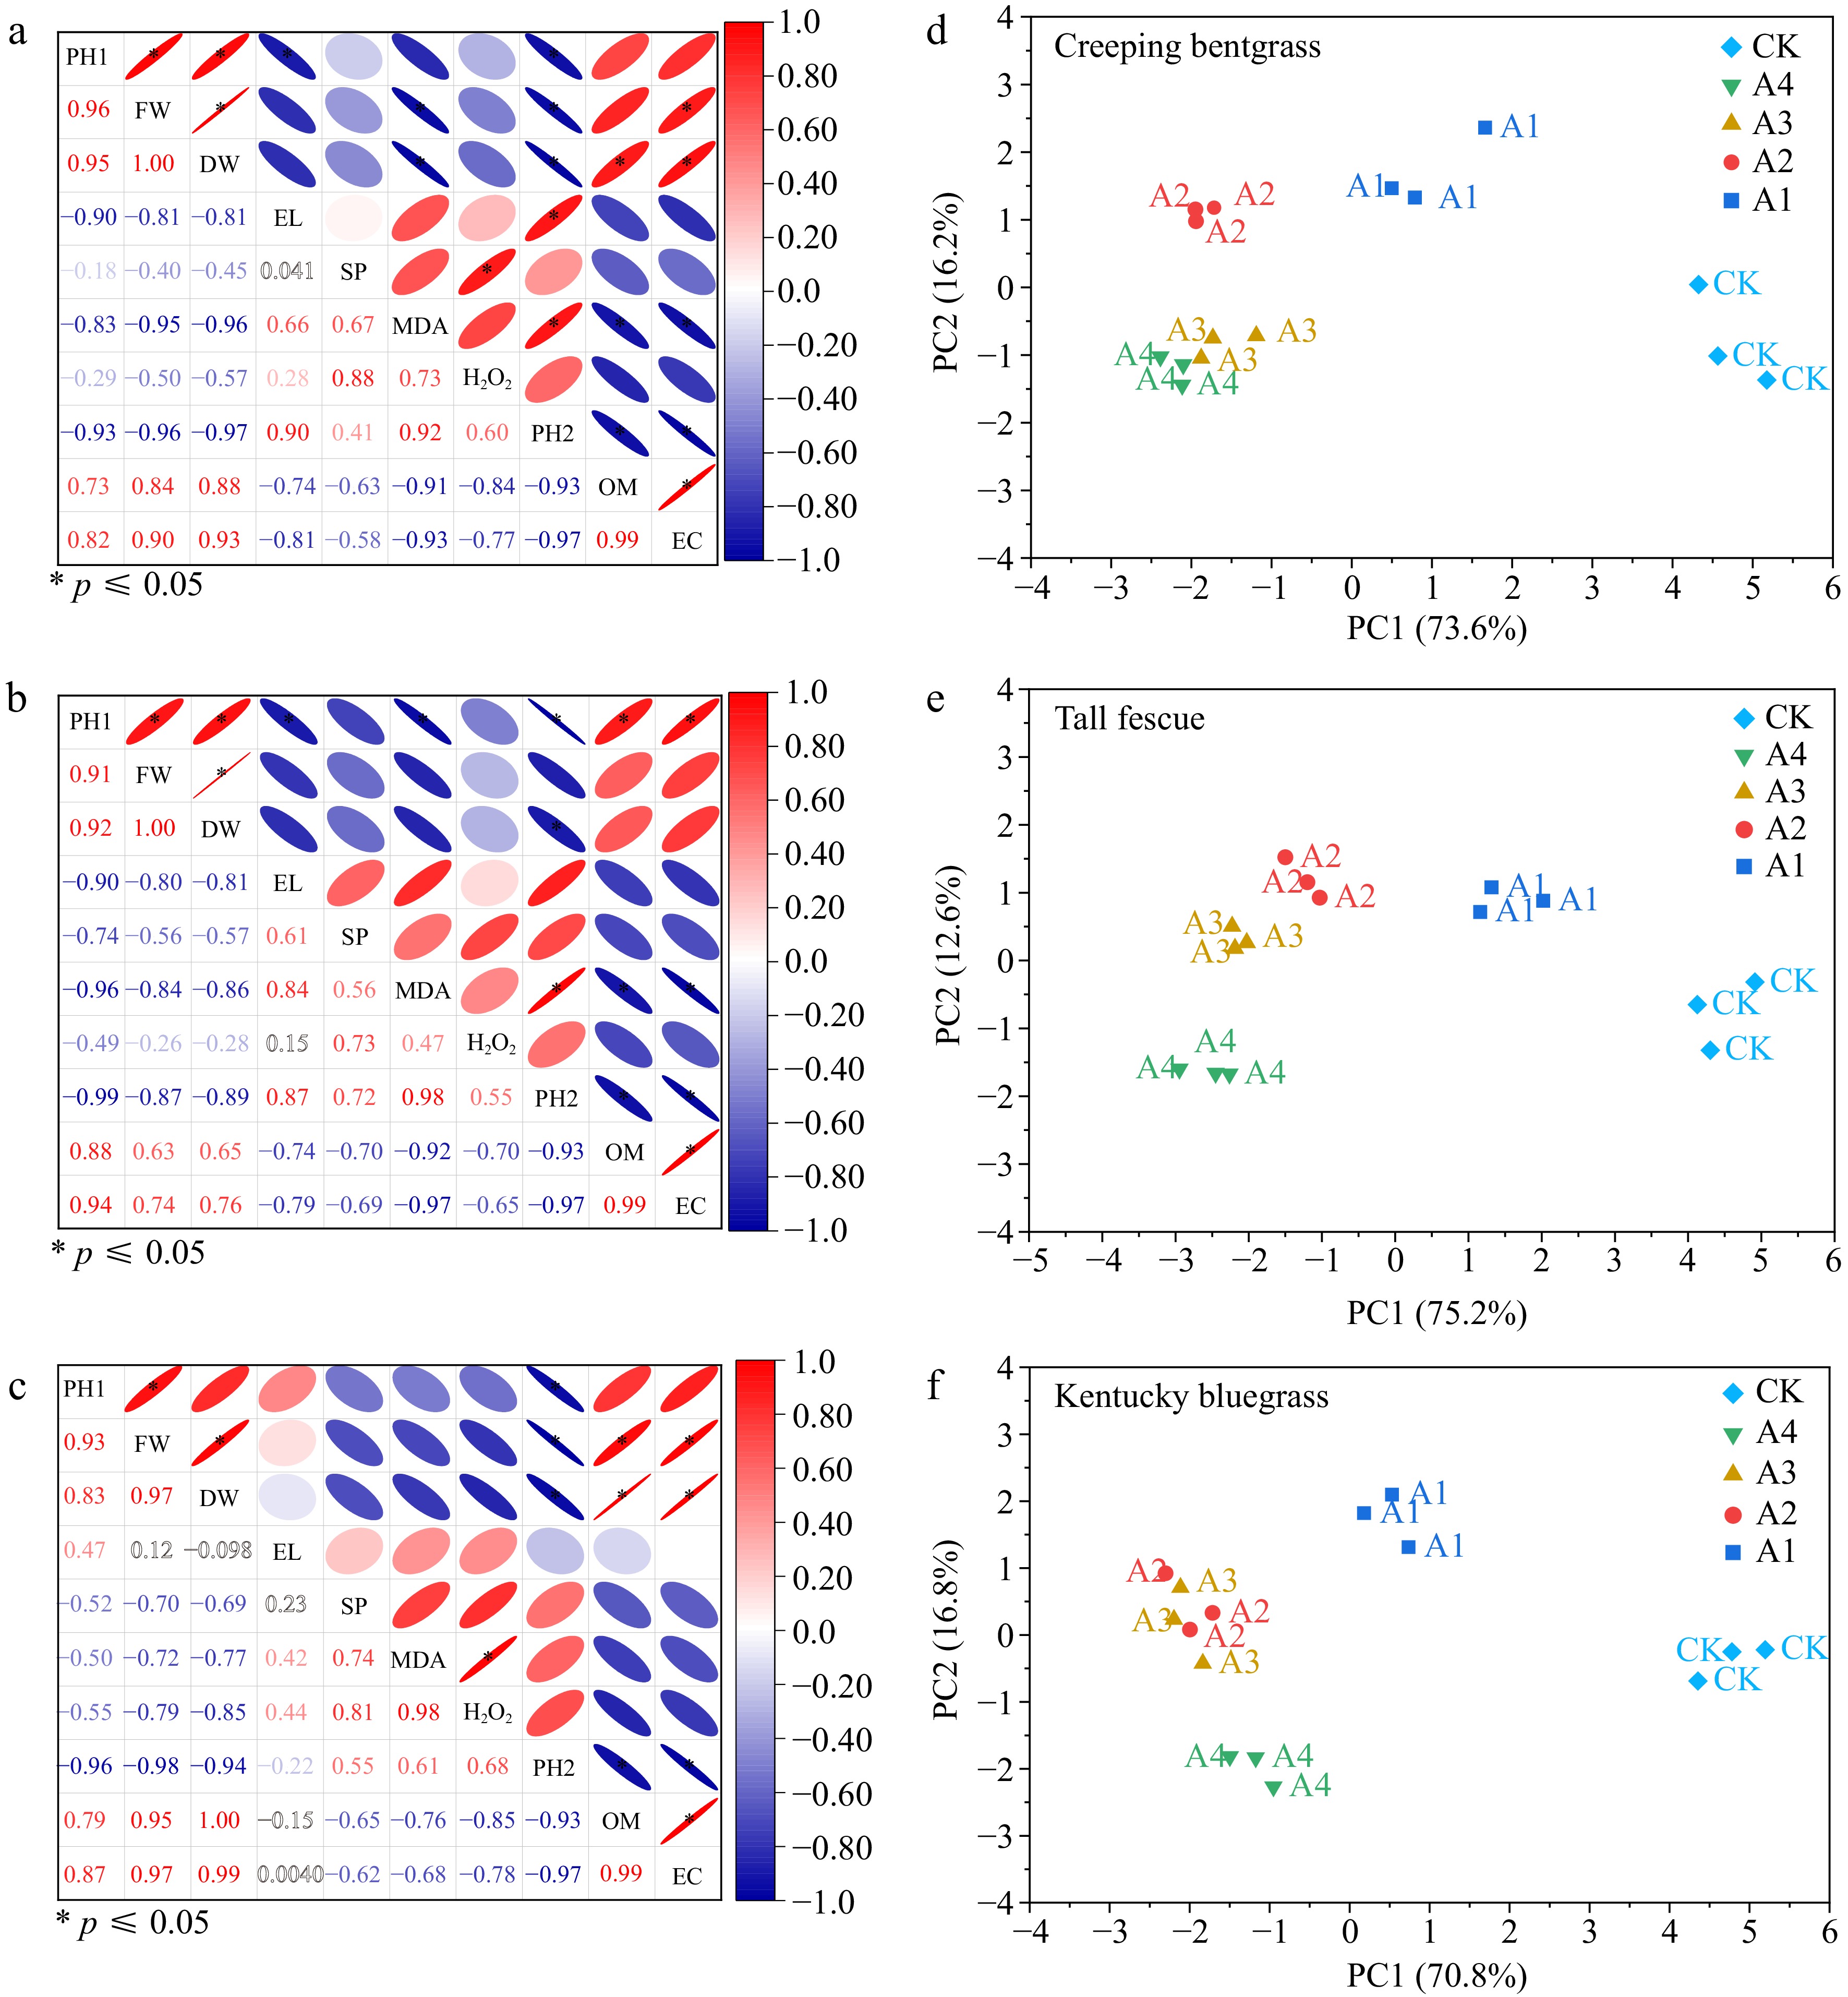
Figure 7.
Correlation matrix and principal component analysis of cool-season turfgrasses in nutrient substrates added with iron tailings sand. Correlation analysis of morpho-physiological, physico-chemical properties of substrates attributes of (a) creeping bentgrass, (b) tall fescue, and (c) Kentucky bluegrass under iron tailings treatment. PH1: plant height; FW: fresh weight; DW: dry weight; EL: Electrolyte leakage; SP: soluble protein; MDA: malondialdehyde; H2O2: hydrogen peroxide; PH2: cultivation substrate PH; OM: cultivation substrate organic matter; EC: cultivation substrate electric conductivity. Principal component analysis biplot between morpho-physiological, physico-chemical properties of substrates of (d) creeping bentgrass, (e) tall fescue, and (f) Kentucky bluegrass under different iron tailings treatments.
-
Treatment CK (A0) A1 A2 A3 A4 Iron tailing ore 0% 25% 50% 75% 100% Nutritional mechanisms 100% 75% 50% 25% 0% Table 1.
Potting experiment treatments.
-
Ingredient Fe Al Mn Zn Cu Ti In Sr Co Content (g·kg−1) 72.97 ± 12.19 9.13 ± 1.03 5.00 ± 0.32 1.10 ± 0.23 0.26 ± 0.02 0.44 ± 0.05 0.48 ± 0.03 0.11 ± 0.03 0.30 ± 0.02 Table 2.
Chemical composition analysis of iron tailing sand.
-
Treatment pH value Electric conductivity EC (mS·m−1) Organic matter (g·kg−1) CK 6.05 ± 0 17.4 ± 0.78 380 ± 12.35 A1 7.84 ± 0.16 12.07 ± 0.03 85 ± 0.17 A2 9.25 ± 0.08 10.23 ± 0.29 34.53 ± 0.09 A3 9.63 ± 0.01 10.2 ± 0.17 24.57 ± 0.12 A4 10.15 ± 0.03 9.27 ± 0.35 19.17 ± 0.41 CK: Pure nutritional substrate, A1: 75% nutritional substrate with 25% iron tailing sand, A2: 50% nutritional substrate with 50% iron tailing sand, A3: 25% nutritional substrate with 75% iron tailing sand, A4: Pure iron tailing sand. Table 3.
Physico-chemical properties of iron tailing sand with different treatments (n = 3, mean ± SE).
Figures
(7)
Tables
(3)