-
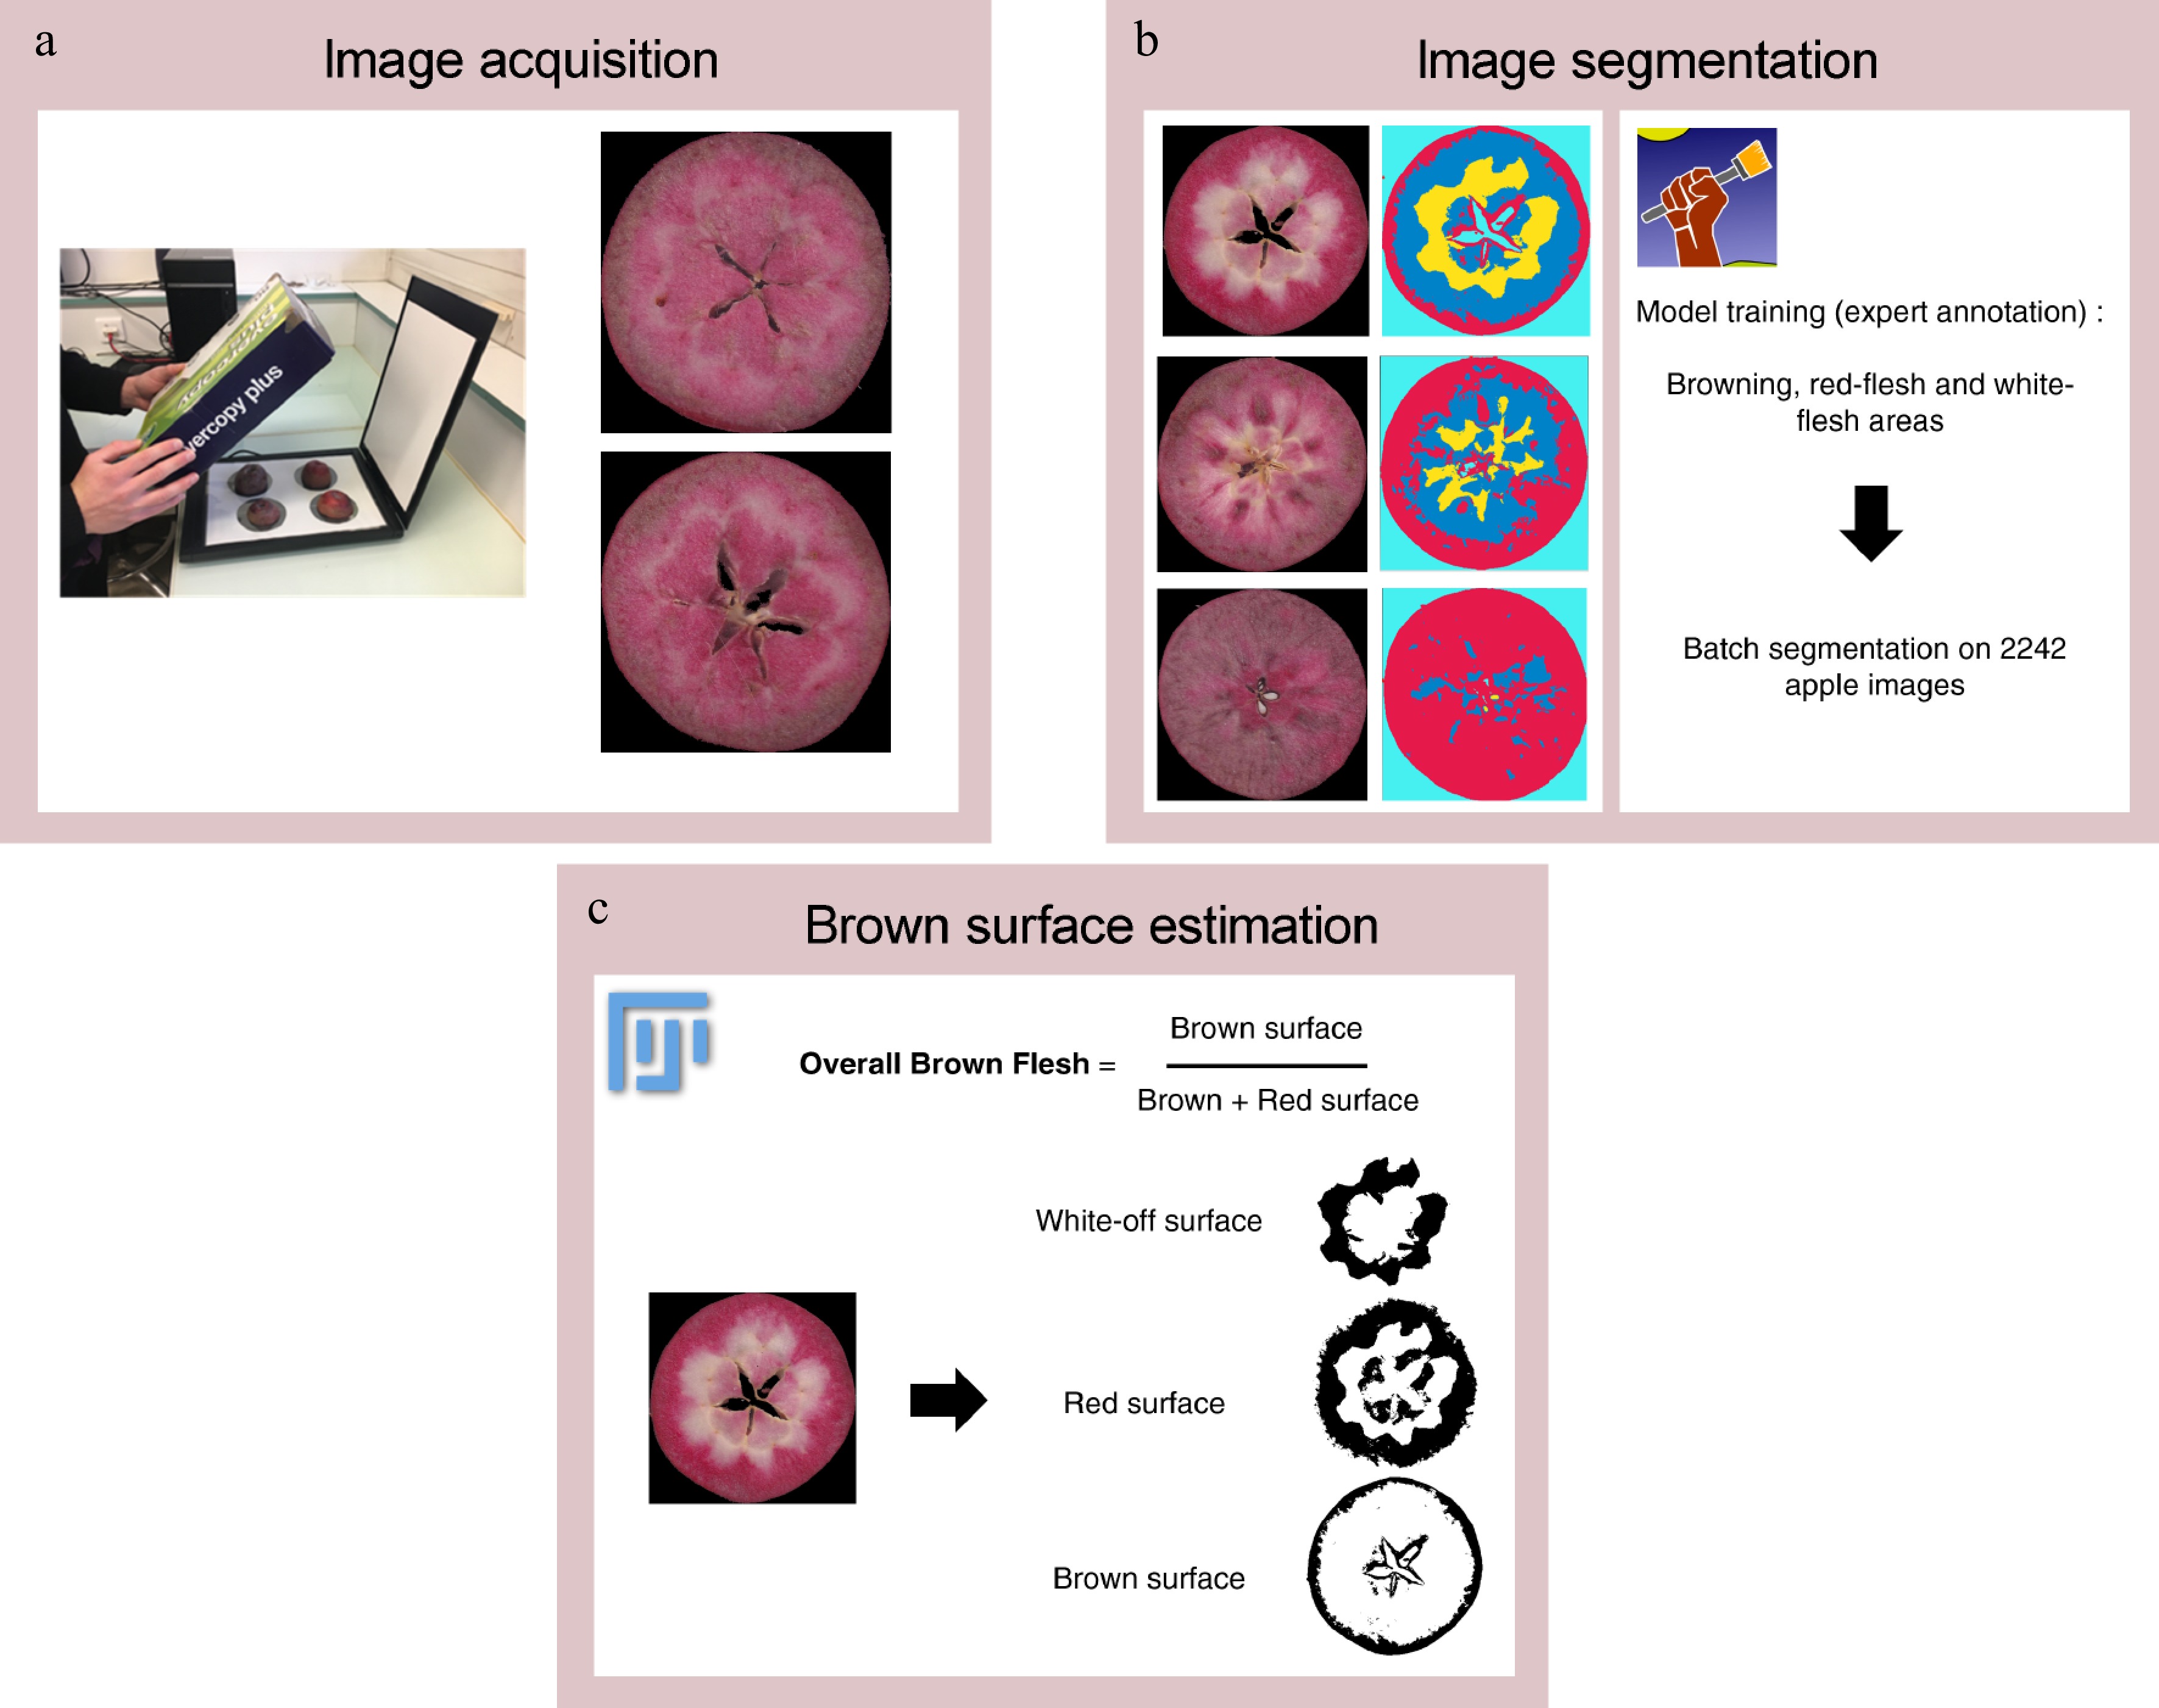
Figure 1.
Overview of image analysis workflow. (a) Image acquisition is performed with a RGB flatbed scanner. (b) Image segmentation is performed with Ilastik software and extract 'brown', 'red- flesh', 'white-flesh', 'background' pixel classes. (c) Brown flesh is estimated from segmented images (number of pixels annotated as 'brown' divided by sum of number of pixels annotated as 'brown' and number of pixels annotated as 'red-flesh') with an ImageJ macro.
-
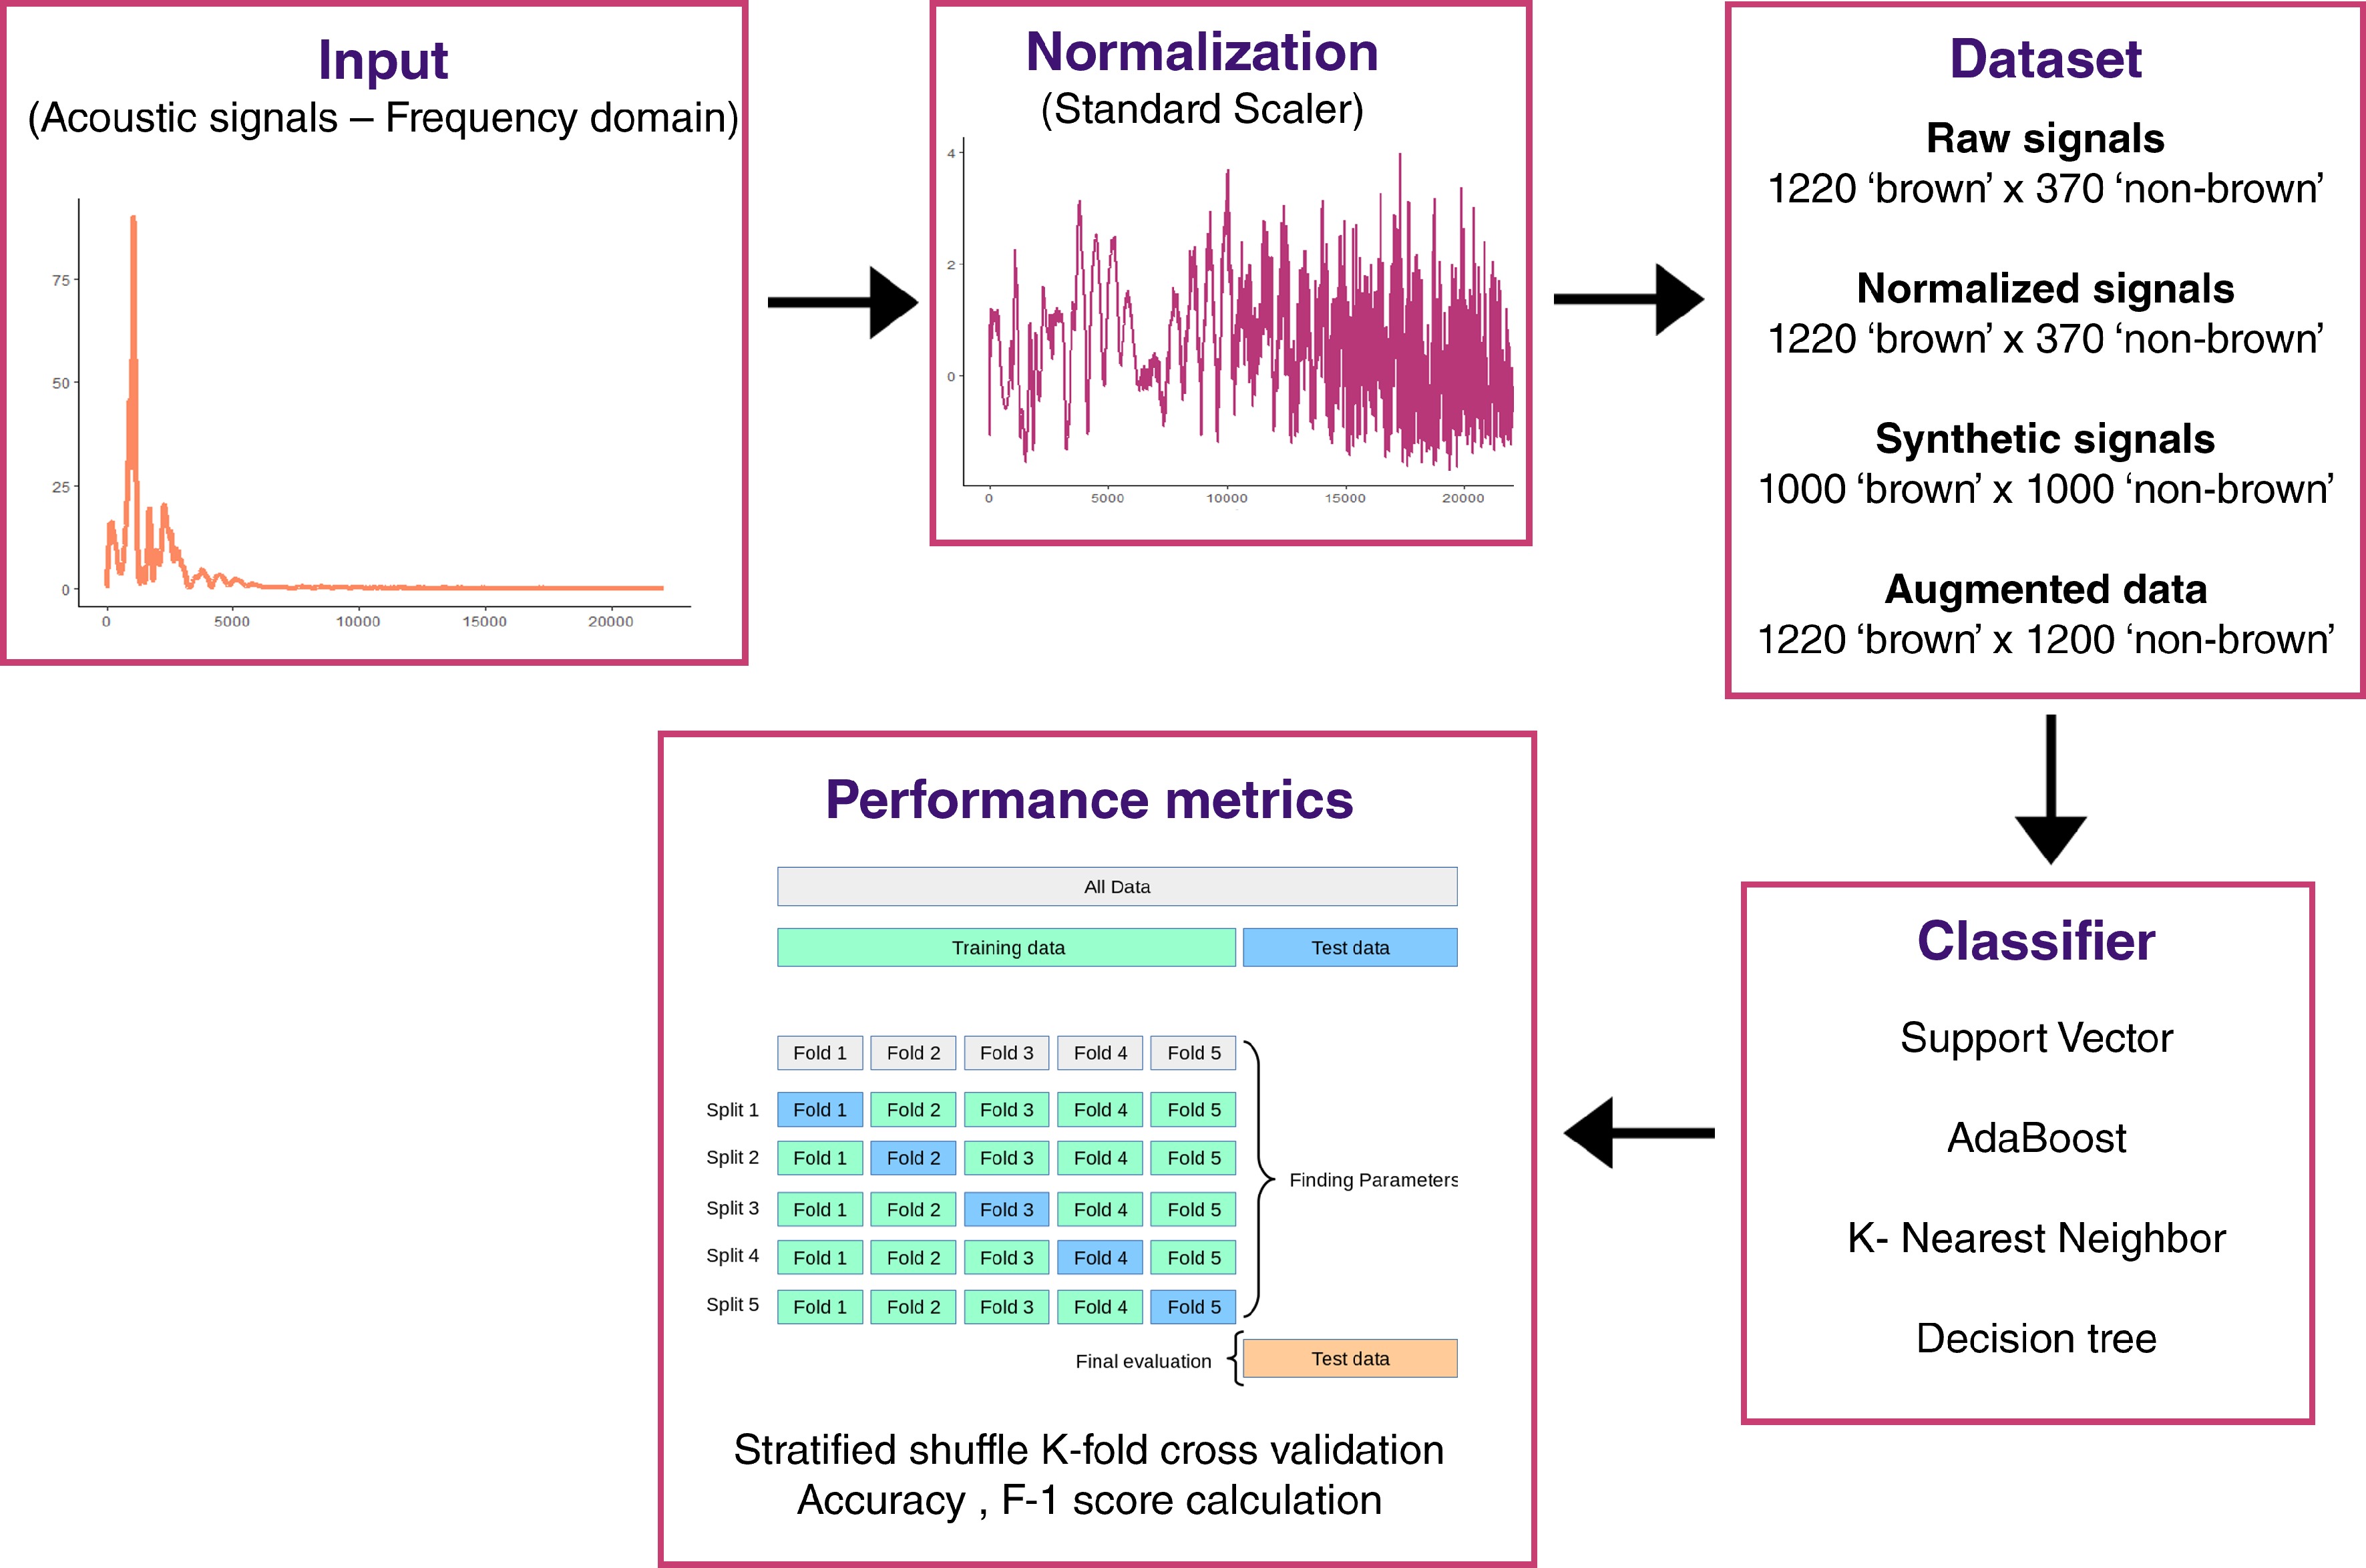
Figure 2.
Overview of acoustic signal analysis workflow.
-
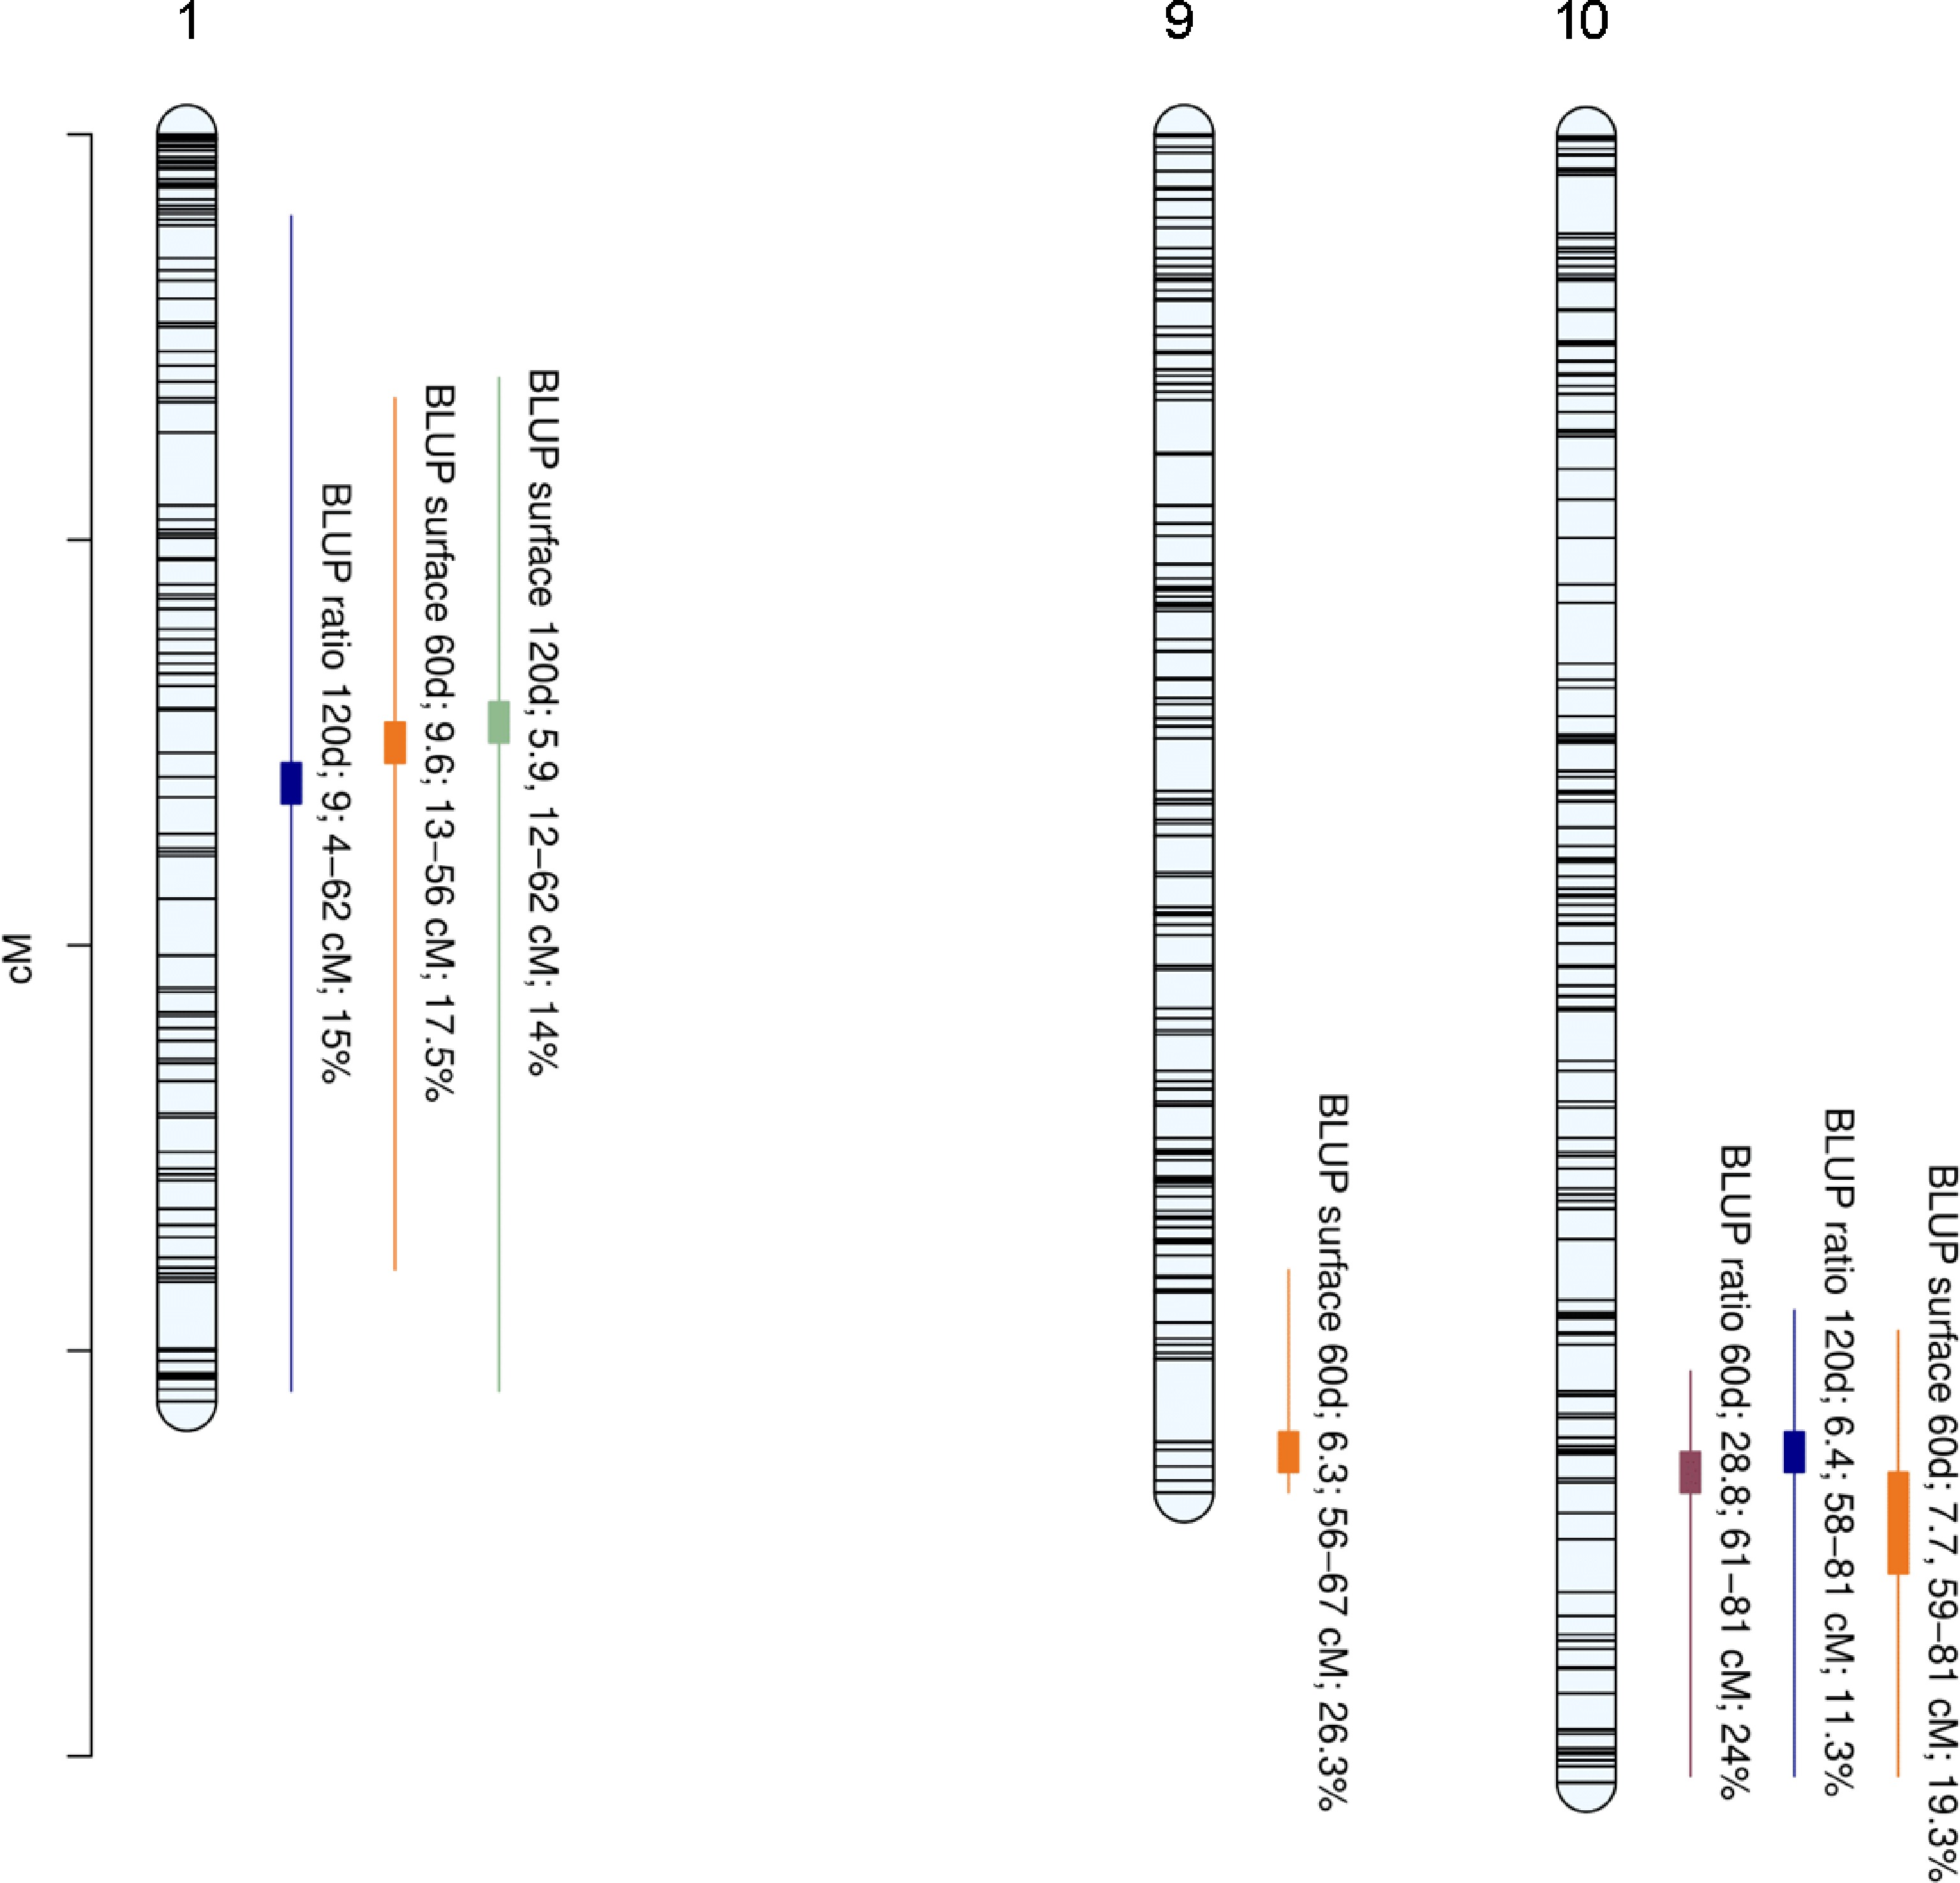
Figure 3.
Positions of QTLs controlling internal browning related traits. Linkage group (LG) numbers are indicated above each group. Positions of SNPs are indicated on the genetic map. Name of the trait is followed by Bayes Factor (BF); QTL region and phenotypic variance explained (PVE).
-
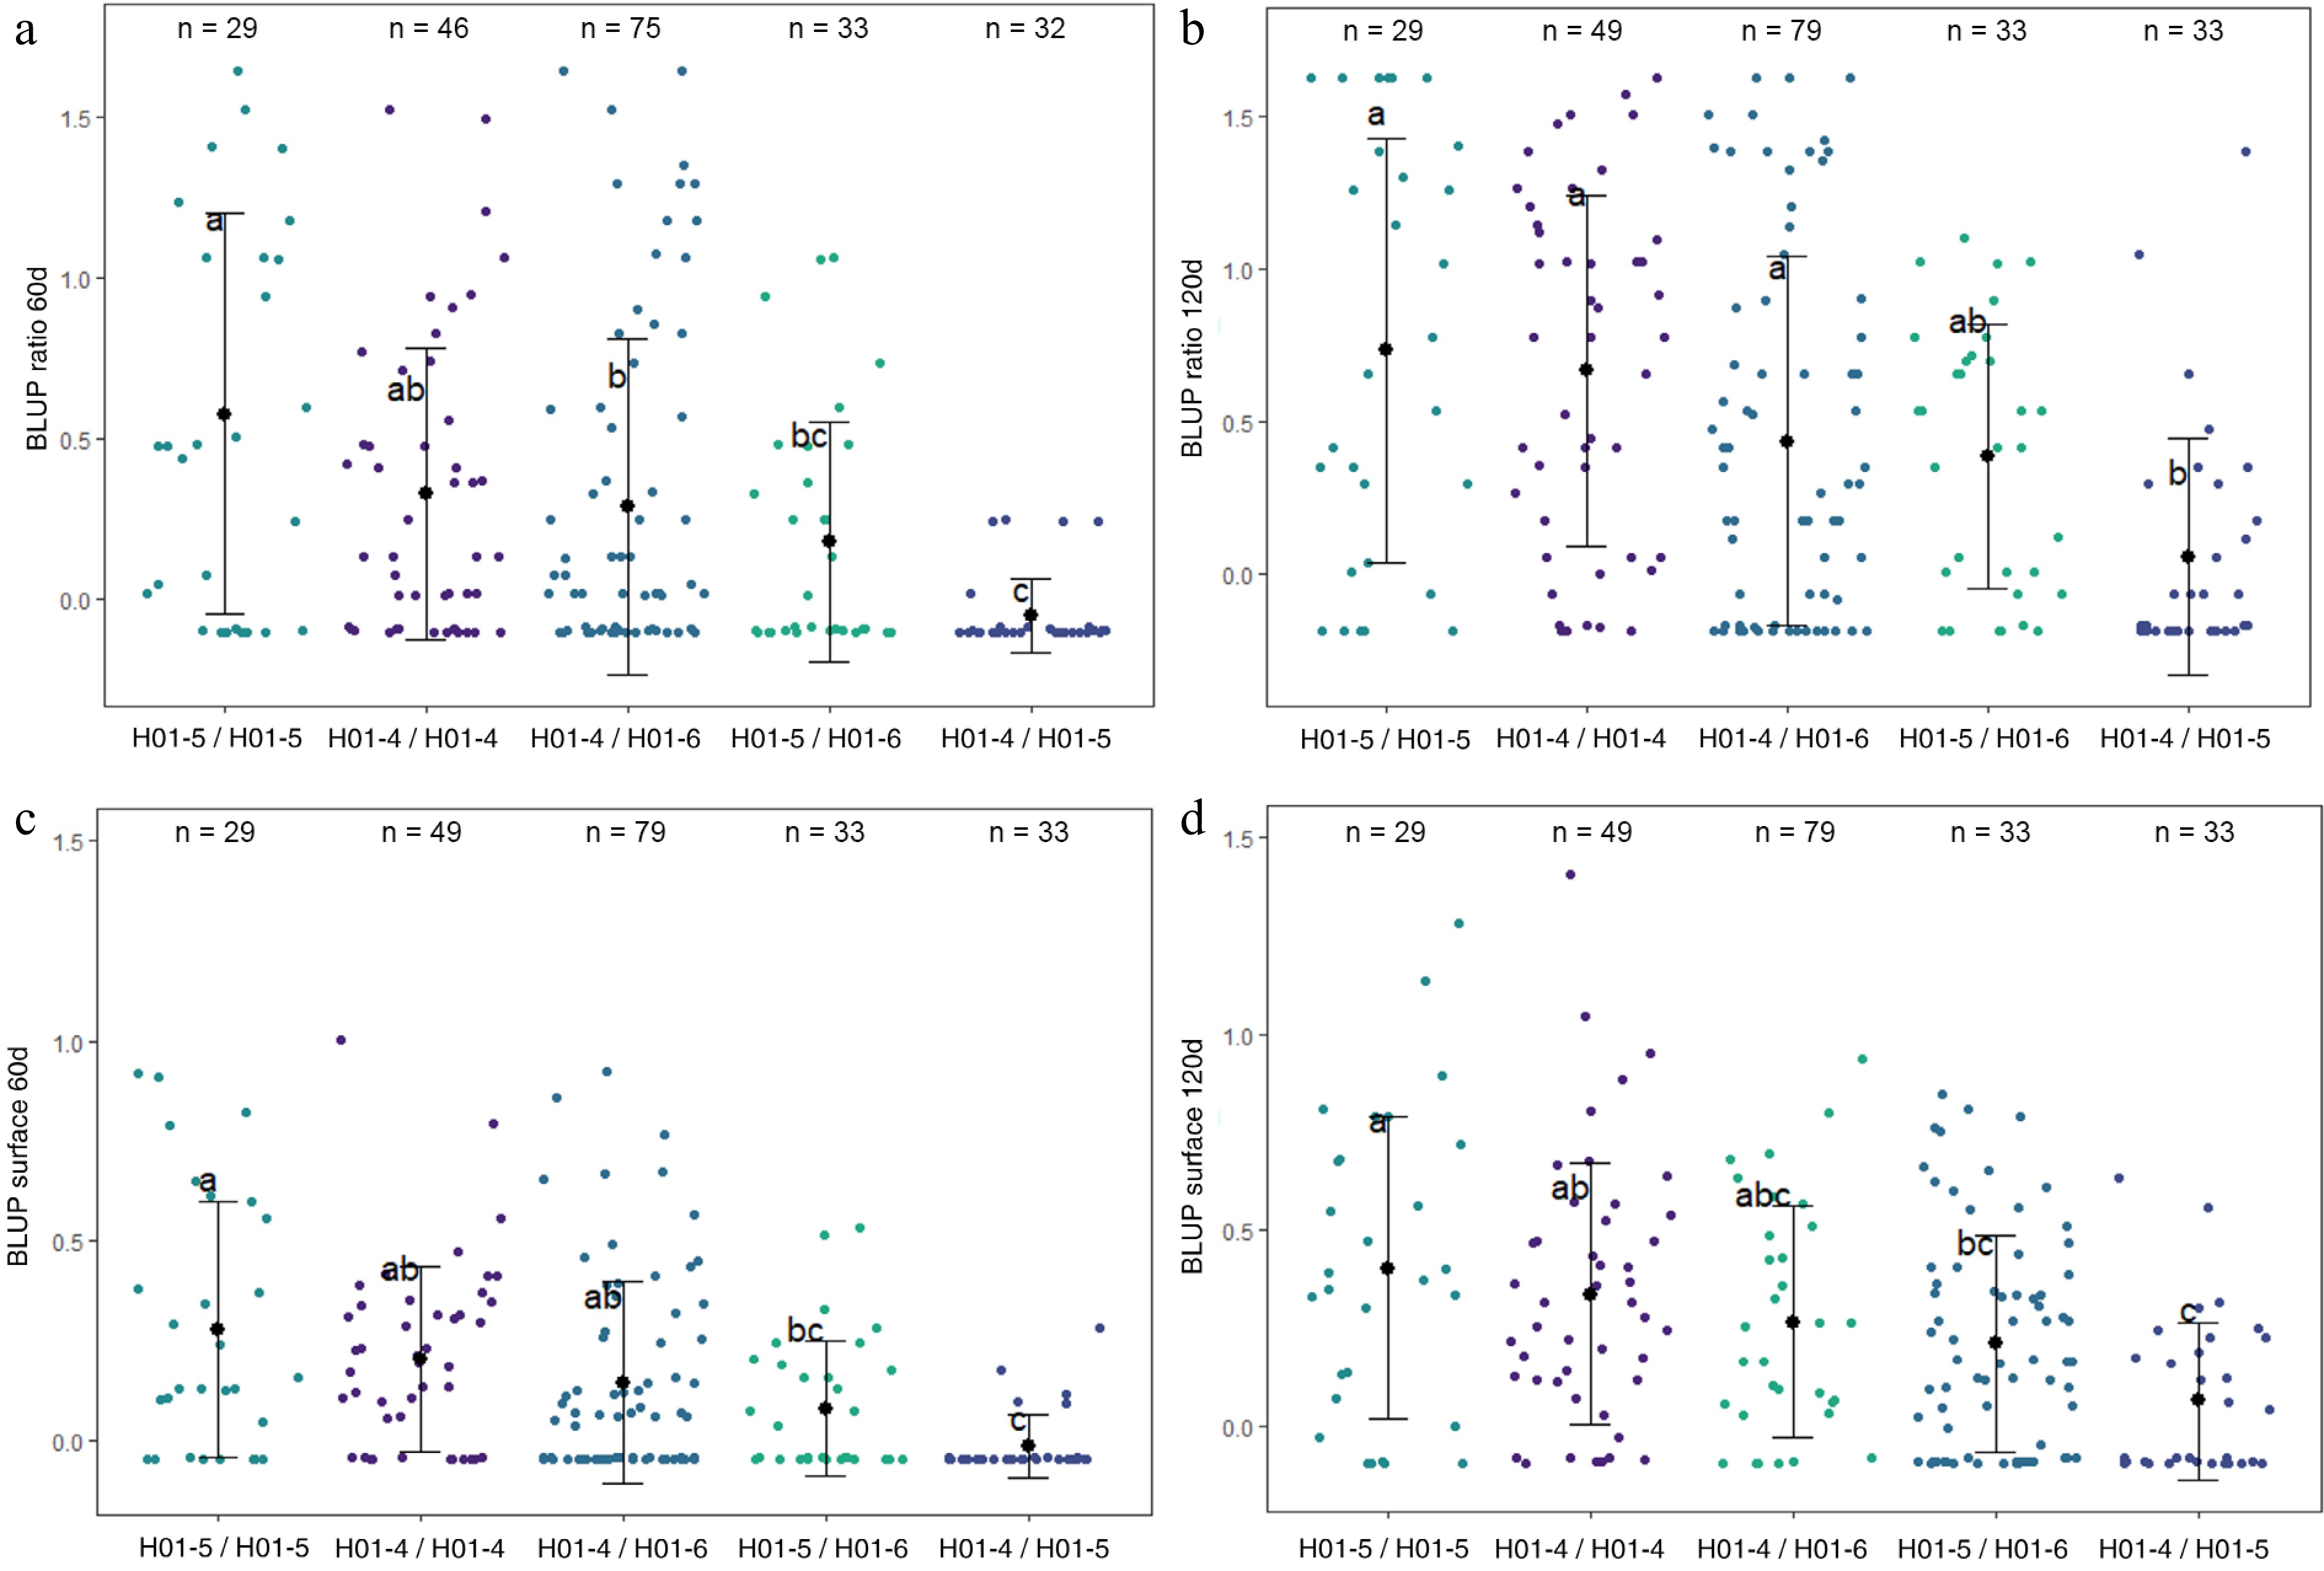
Figure 4.
Distribution of (a) BLUP ratio 60d, (b) BLUP ratio 120d, (c) BLUP surface 60d, and (d) BLUP surface 120d values for the four F1 offspring haplotypes for LG1-QTL. The mean (denoted by colored biggest dot), the standard deviation (vertical line), and single observations (dots) are represented. Number of genotypes (n) are listed above. Significantly different phenotypic means between segregating classes are identified by different letters (Tukey HSD, p < 0.05).
-
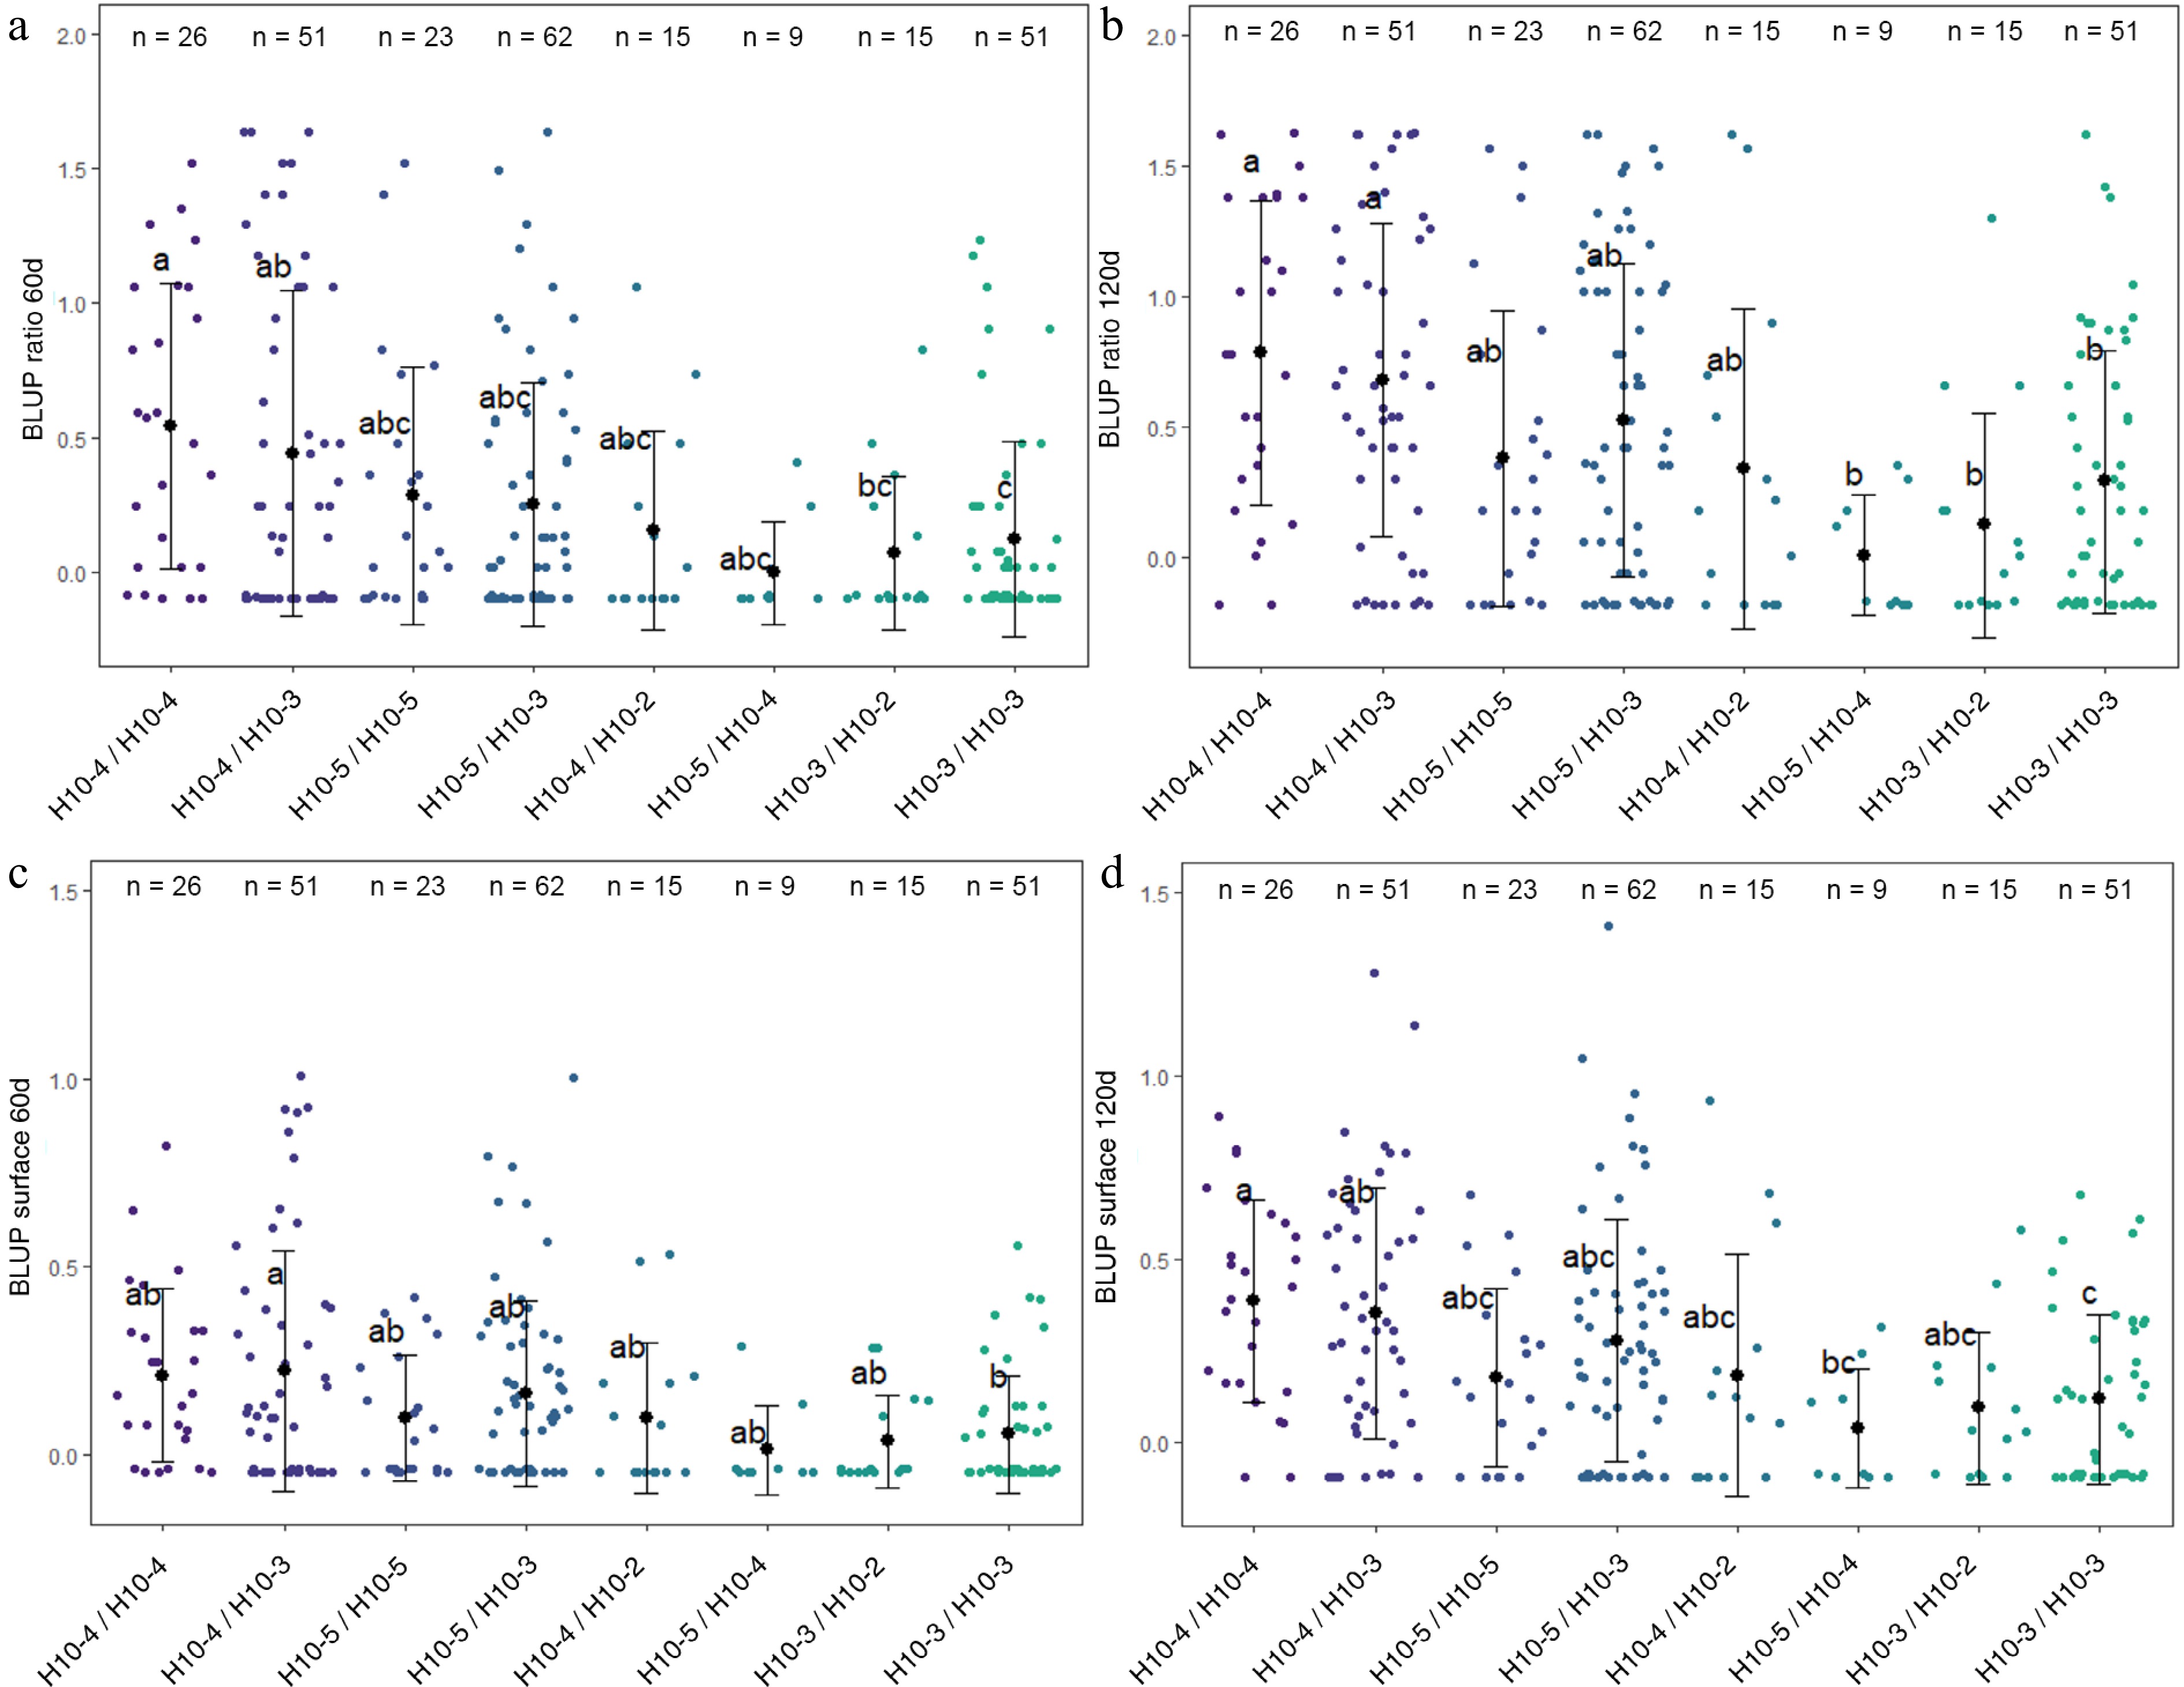
Figure 5.
Distribution of (a) BLUP ratio 60d, (b) BLUP ratio 120d, (c) BLUP surface 60d, and (d) BLUP surface 120d values for the four F1 offspring haplotypes for LG10-QTL. The mean (denoted by colored biggest dot), the standard deviation (vertical line), and single observations (dots) are represented. Number of genotypes (n) are listed above. Significantly different phenotypic means between segregating classes are identified by different letters (Tukey HSD, p < 0.05).
-
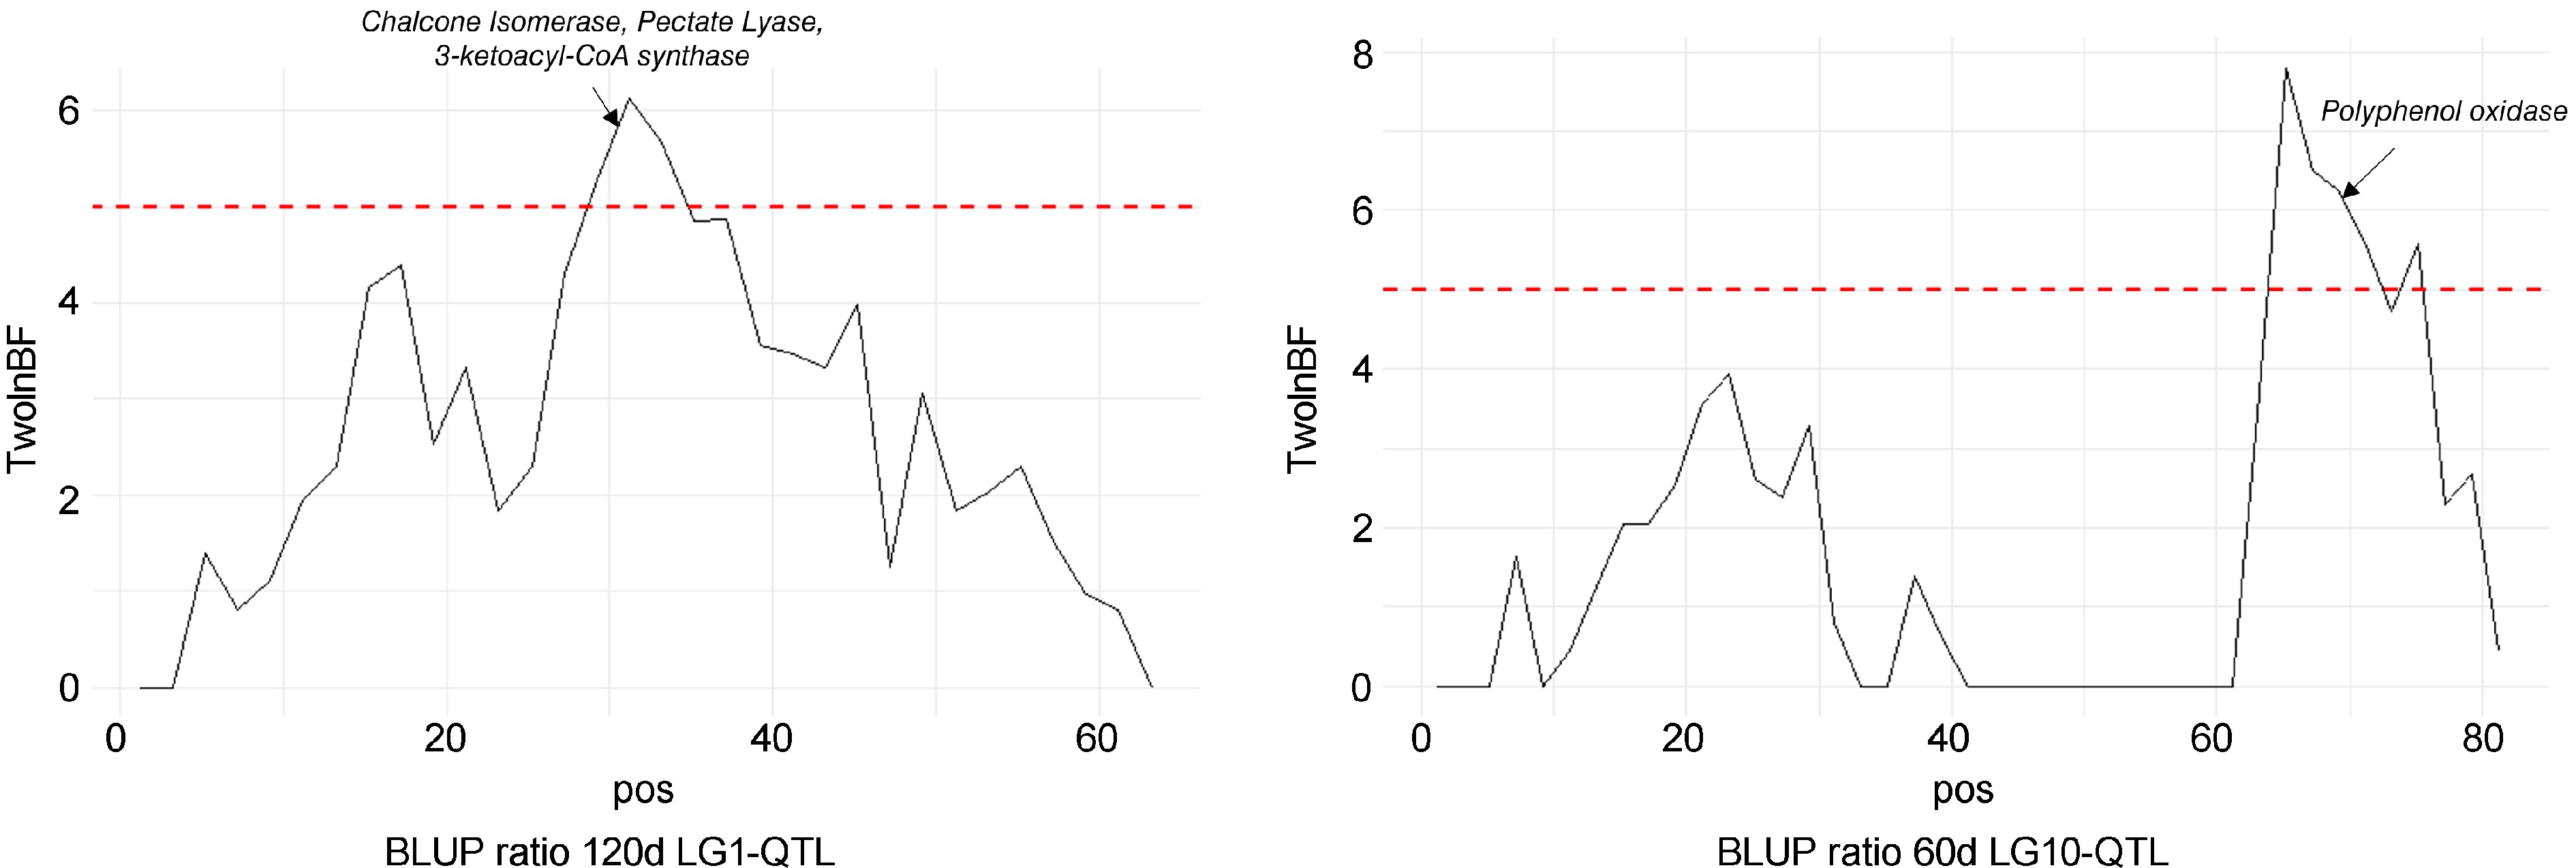
Figure 6.
Bayes factor across linkage groups (LGs) 1 and 10. The horizontal line indicates the significance threshold. Putative candidate genes are also indicated.
-
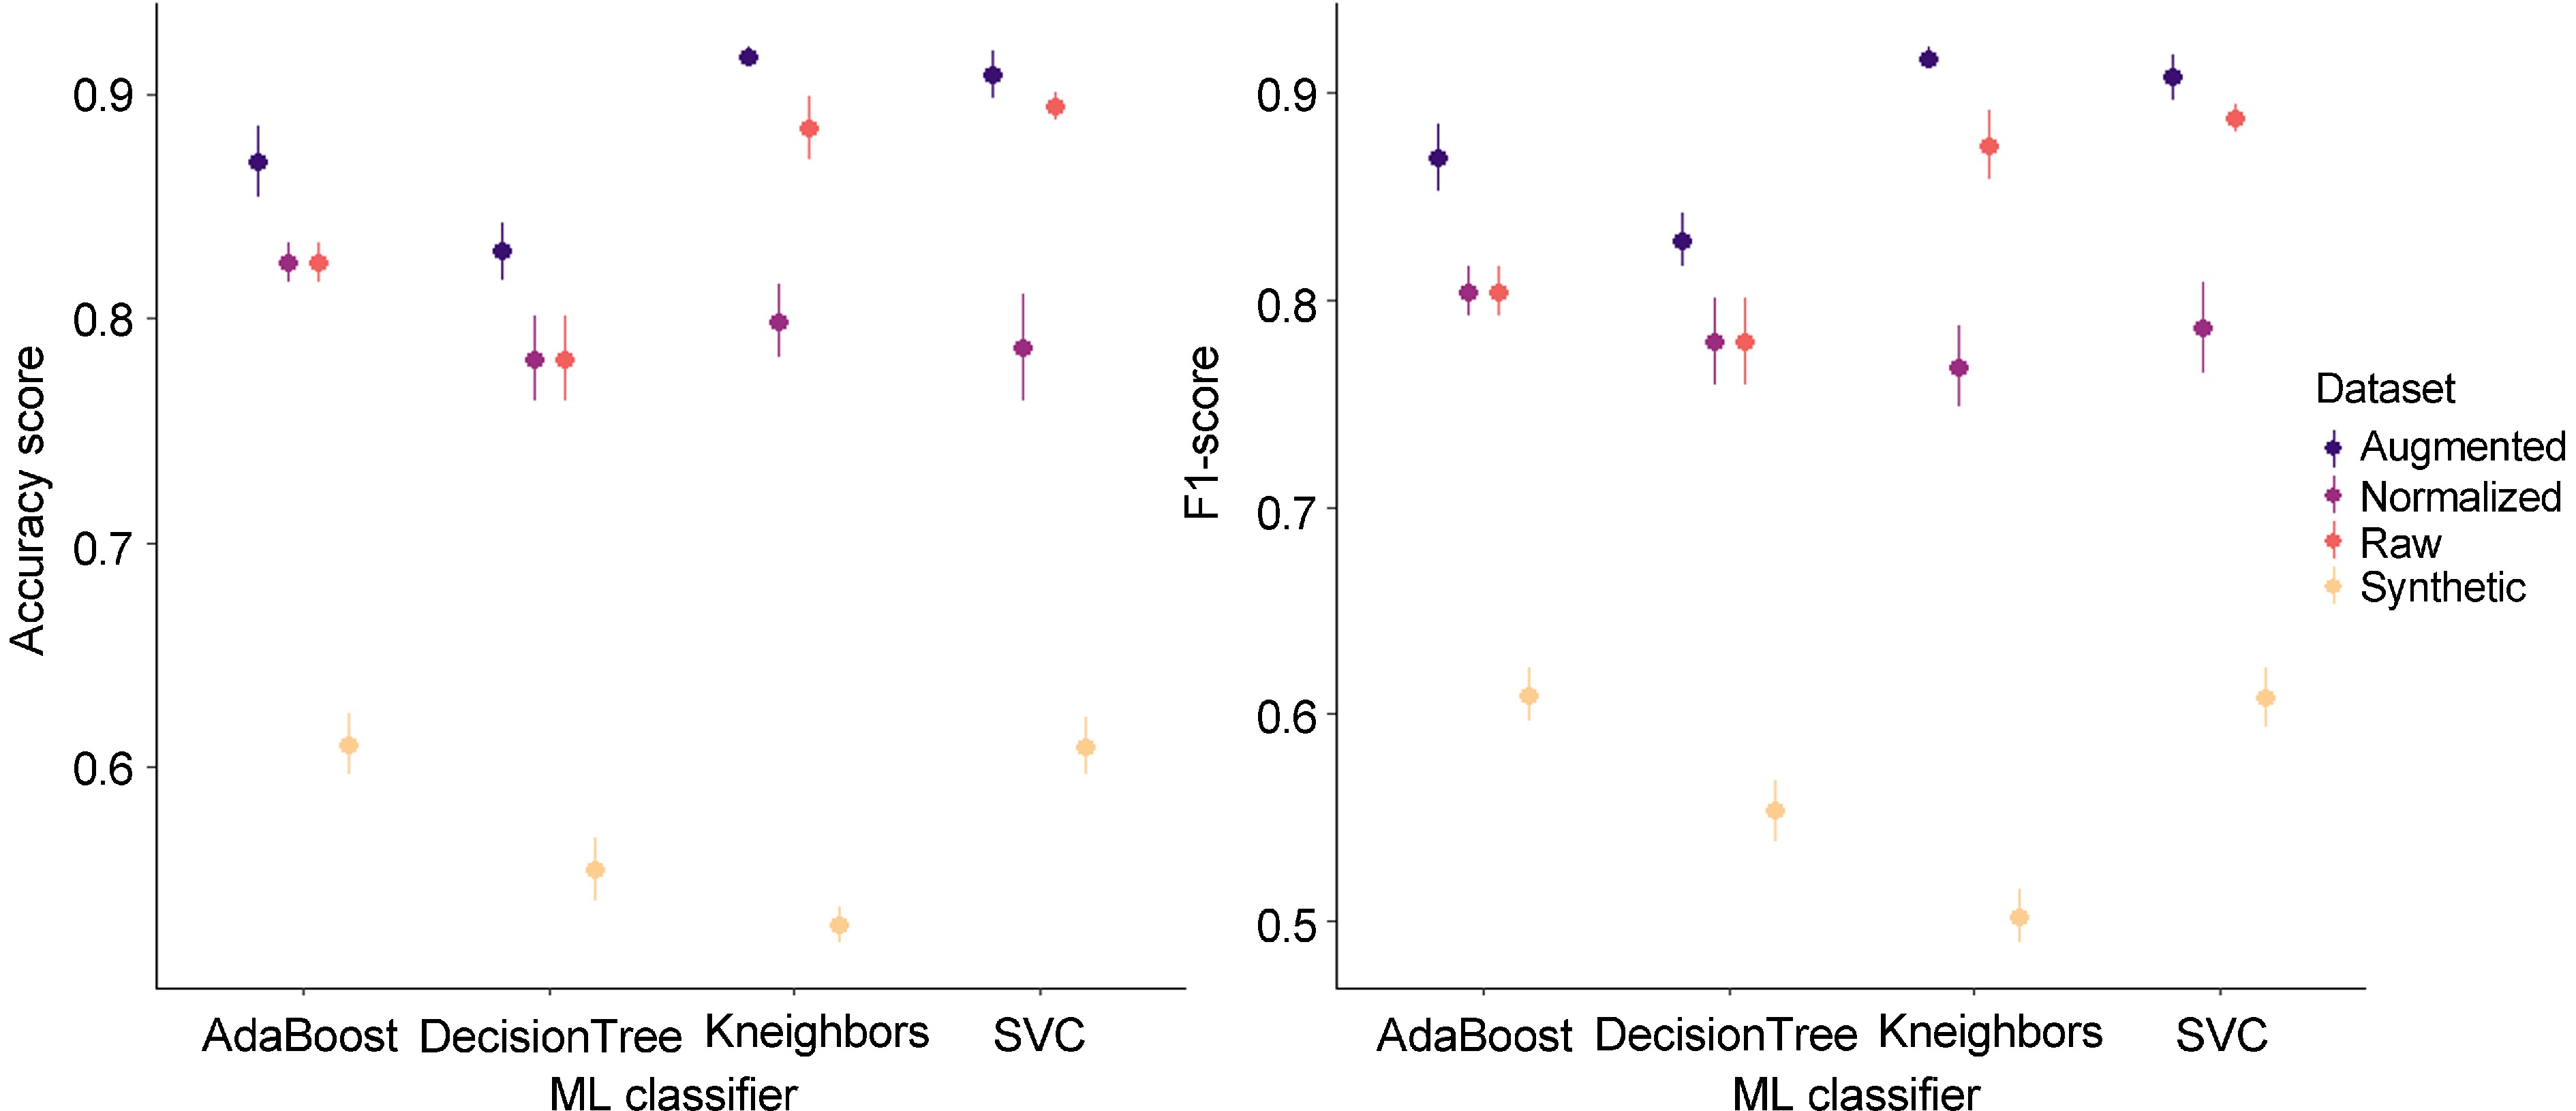
Figure 7.
Model performances on acoustic signal datasets. The mean (dot) and the standard deviation (vertical line) are represented in each range-plot. Four classifiers (AdaBoost, DecisionTree, Kneighbors, SVC) were evaluated to discriminate 'brown' and 'non-brown' acoustic signals from four datasets (raw, normalized, synthetic, and augmentated).
-
Trait (Year) broad-sense heritability Chr Replicate Run BF (1 vs. 0) BF (2 vs. 1) QTL interval (cM) Mode (cM) PVE (%) BLUP ratio60 0.567 10 1 28.8 2.7 [61,81] 66 24 10 2 12 3 [57,81] 65 24.9 BLUP ratio120 0.656 1 1 9 2.4 [4,62] 33 15 1 2 8.3 2.1 [2,62] 32 14.4 10 1 6.4 1.4 [58,81] 65 11.3 10 2 6.3 1.6 [57,81] 66 11.9 BLUP surface 60 0.477 1 1 9.6 0.5 [13,56] 30 17.5 1 2 10.8 0.7 [13,46] 29 17.6 9 1 6.3 −0.6 [56,67] 65 26.3 9 2 5.6 −0.1 [57,67] 65 21.1 10 1 7.7 2.2 [59,81] 66 19.3 10 2 7.9 2.6 [56,81] 71 17.5 BLUP surface 120 0.592 1 1 5.9 1.9 [12,62] 29 14 1 2 6.3 2.3 [9,62] 28 14 Table 1.
Summary of BLUP internal browning related QTLs
Figures
(7)
Tables
(1)