-
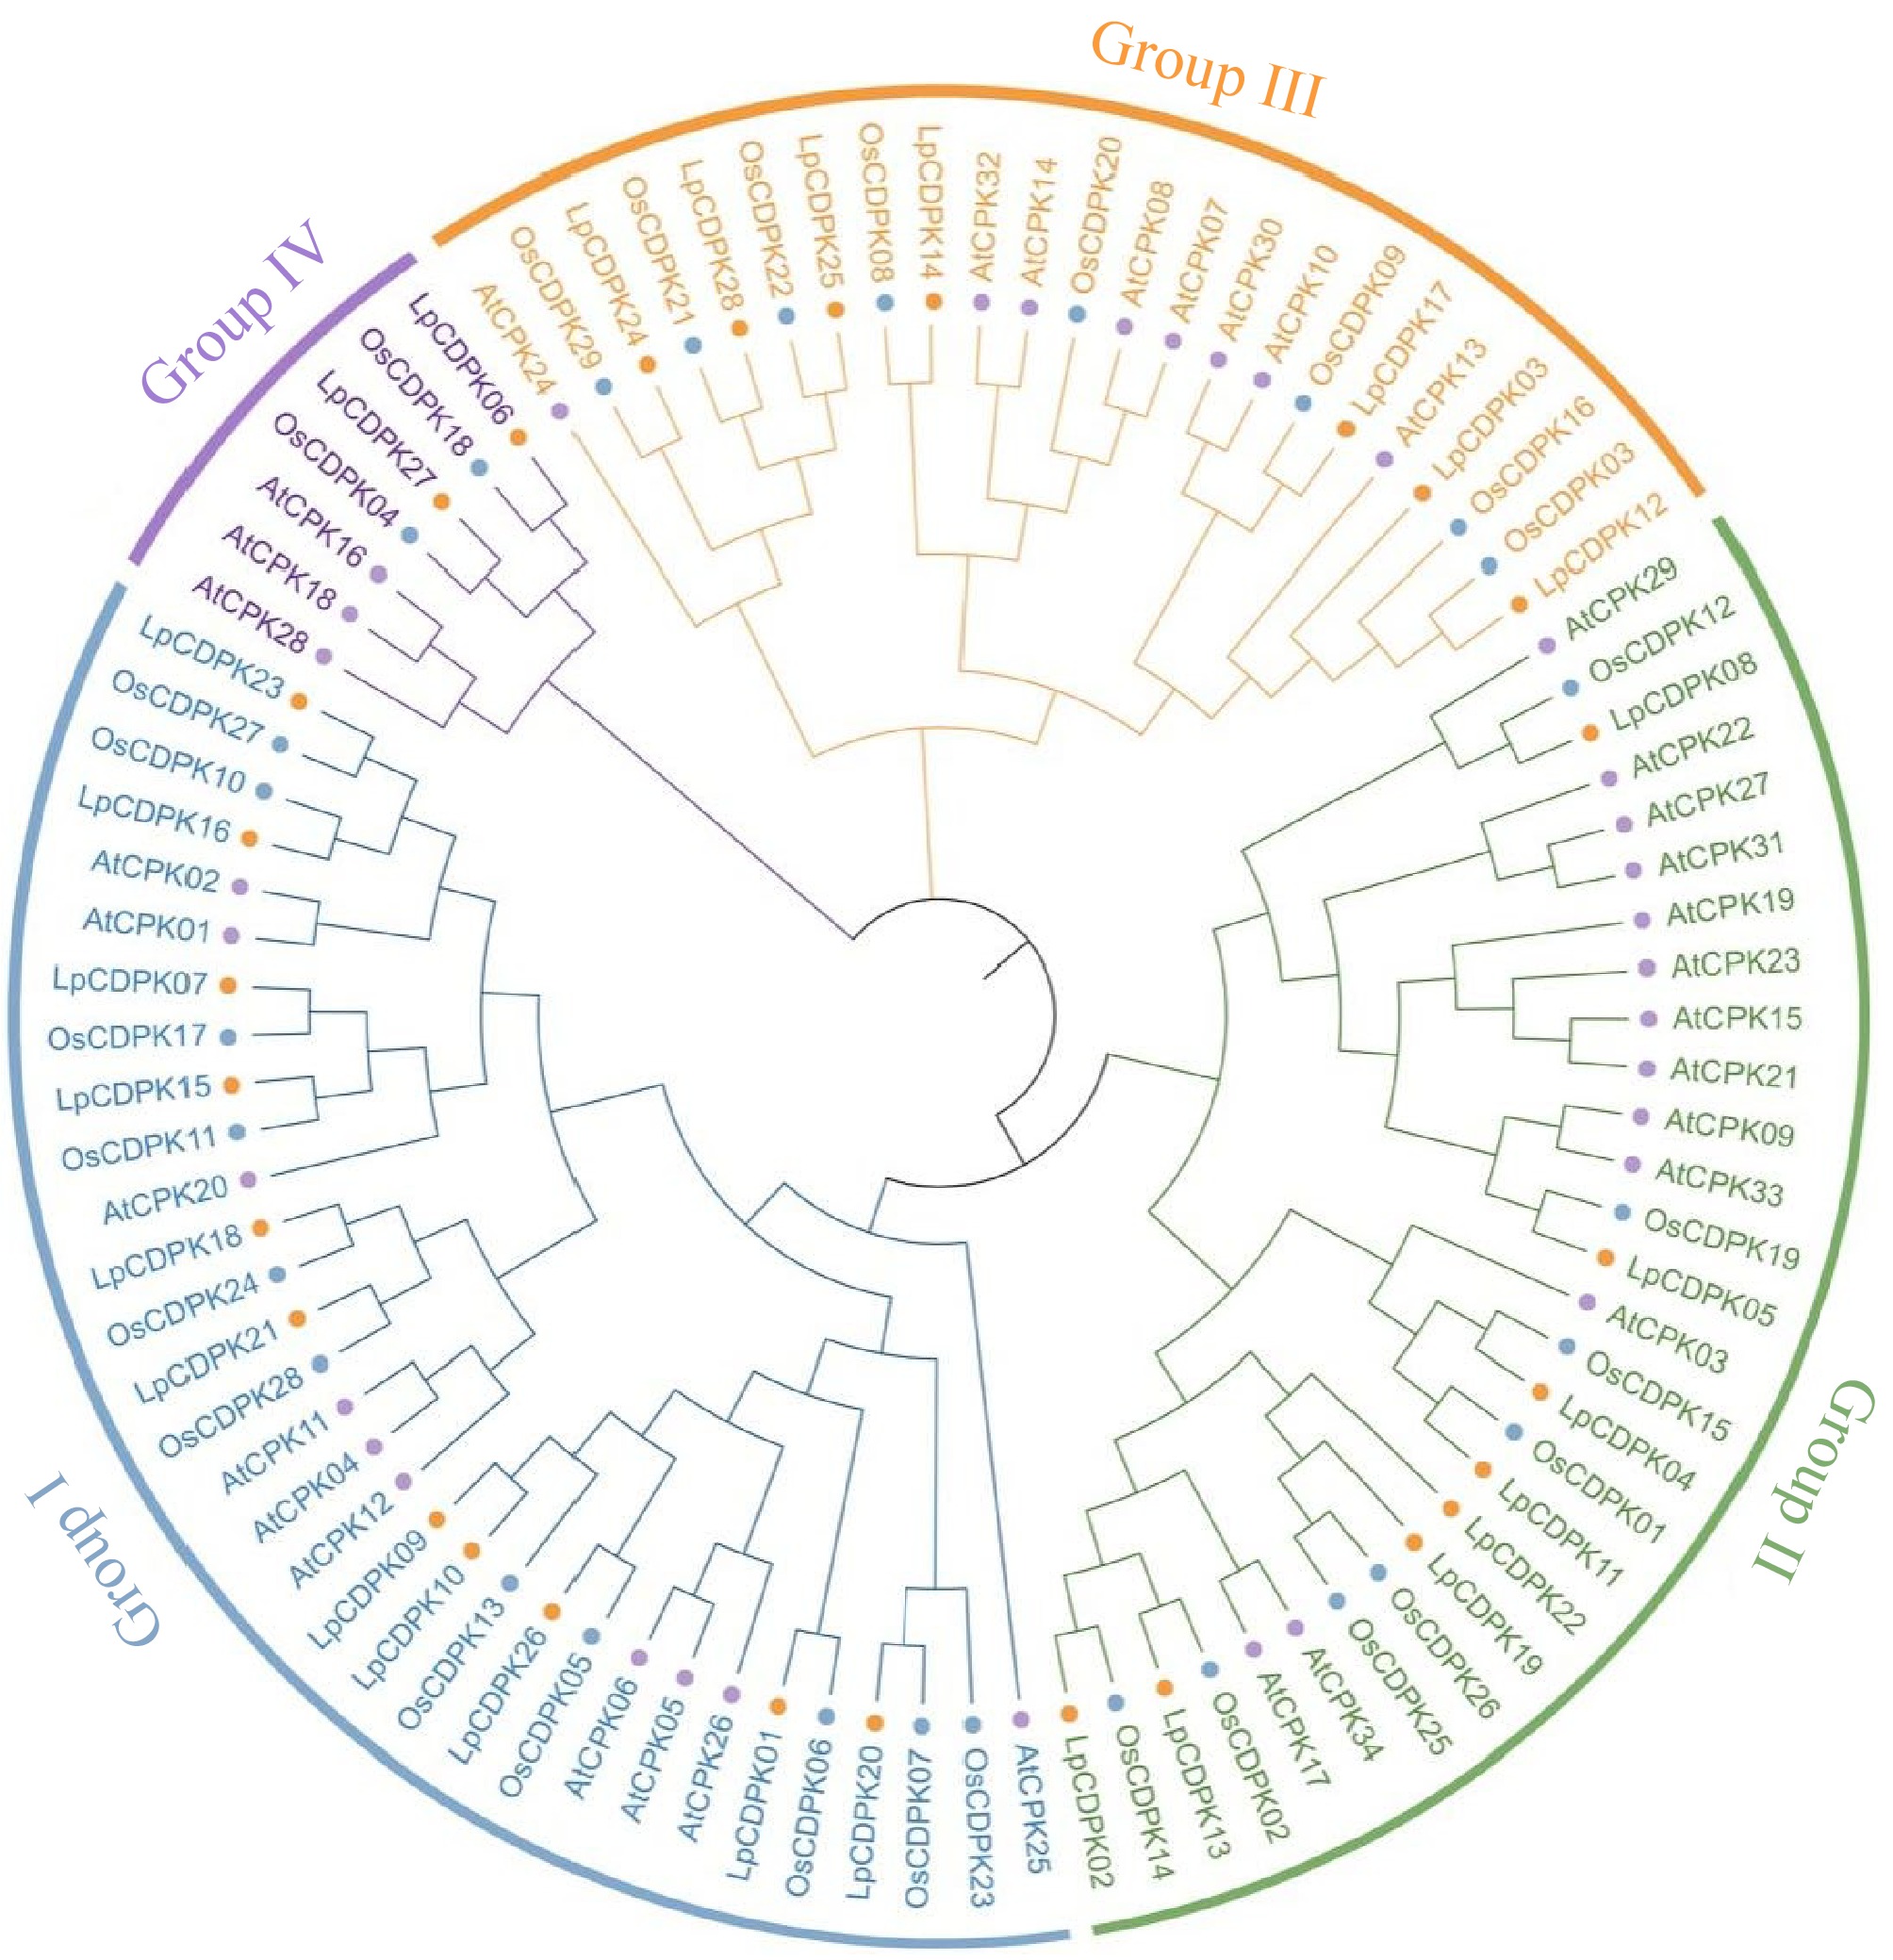
Figure 1.
Phylogenetic tree of CDPK proteins in L. perenne (orange circle), A. thaliana (purple circle), and O. sativa (blue circle). Different colors represent different groups of LpCDPK.
-
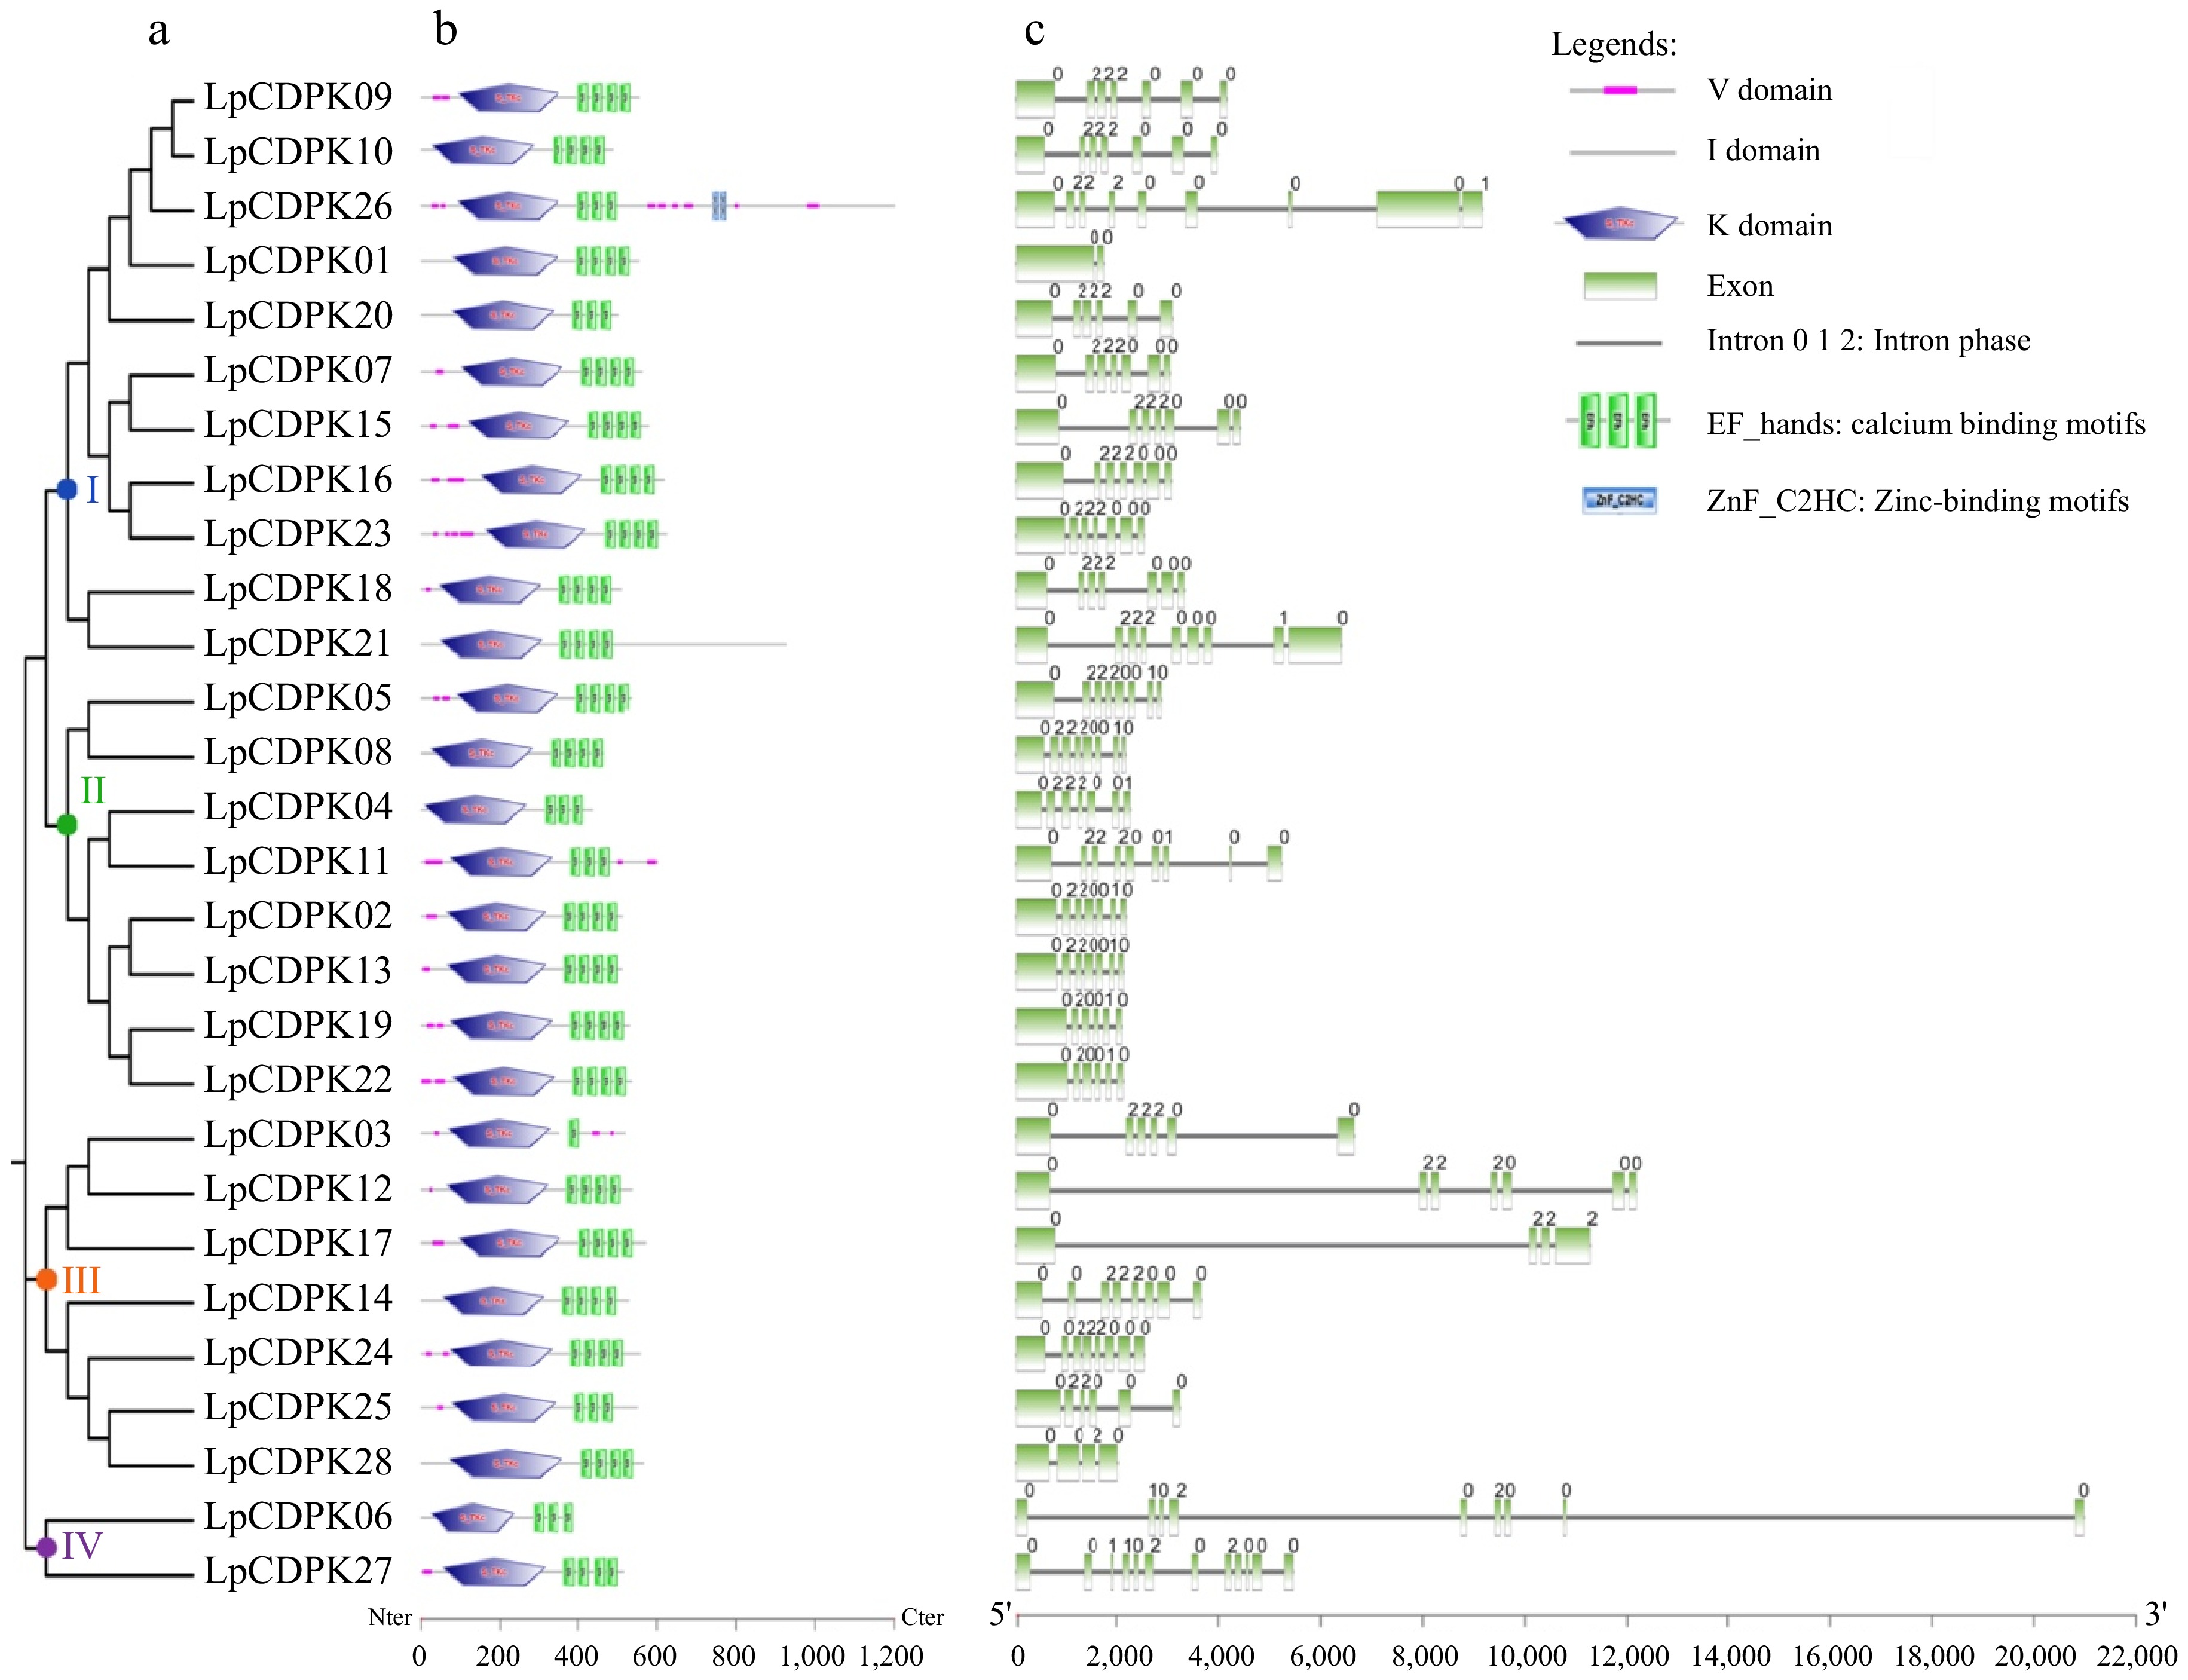
Figure 2.
Analyses of the evolutionary ties, domain architecture, and exon-intron pattern of CDPK family members in L. perenne. (a) An unrooted phylogenetic tree illustrating the LpCDPKs is drawn using the maximum-likelihood method in MEGA 11.0. (b) The domain architecture of LpCDPKs is presented. Visual representations of these domains were sourced from the EMBL-EBI and SMART online tools and modified using Adobe Photoshop CS6. (c) The exon/intron pattern of CDPK family genes in L. perenne is detailed, with the numbers 0, 1, and 2 denoting the intron phase within the sequence.
-
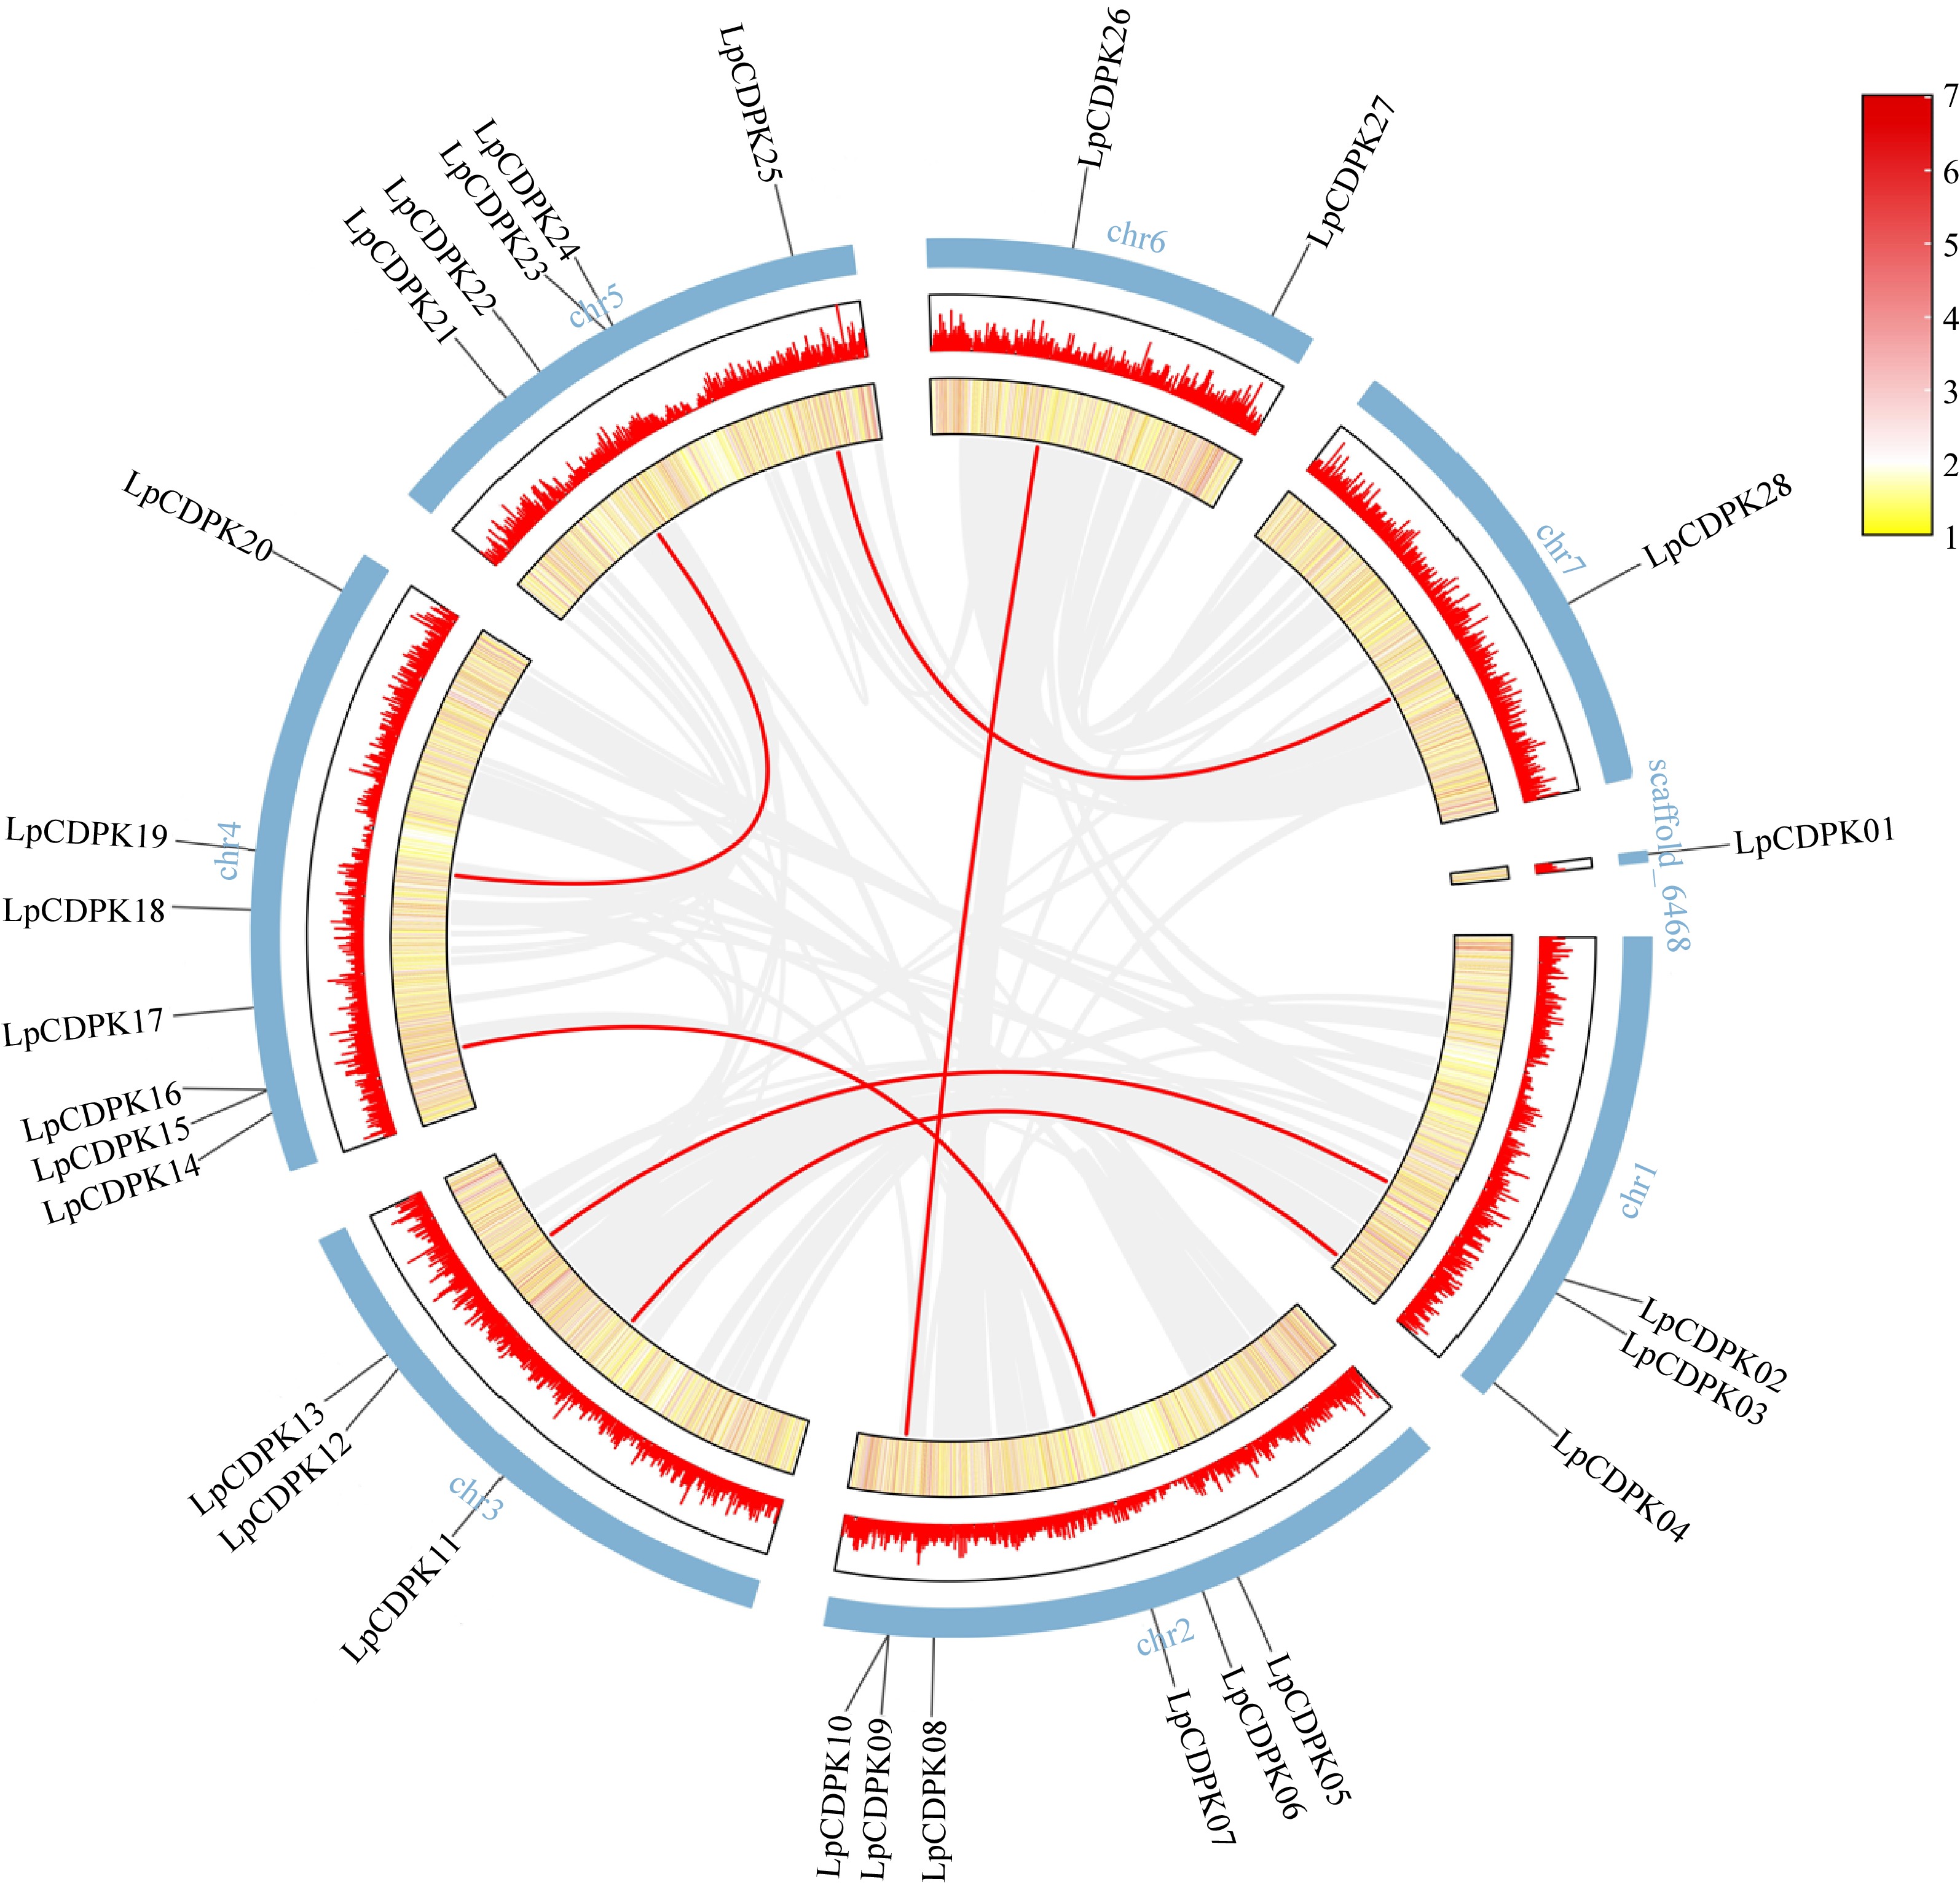
Figure 3.
Chromosomal locations and synteny analysis of LpCDPK genes. Red lines indicate duplicate gene pairs. The density of genes on chromosomes is represented by the heatmap (the yellow ring and the red ring).
-
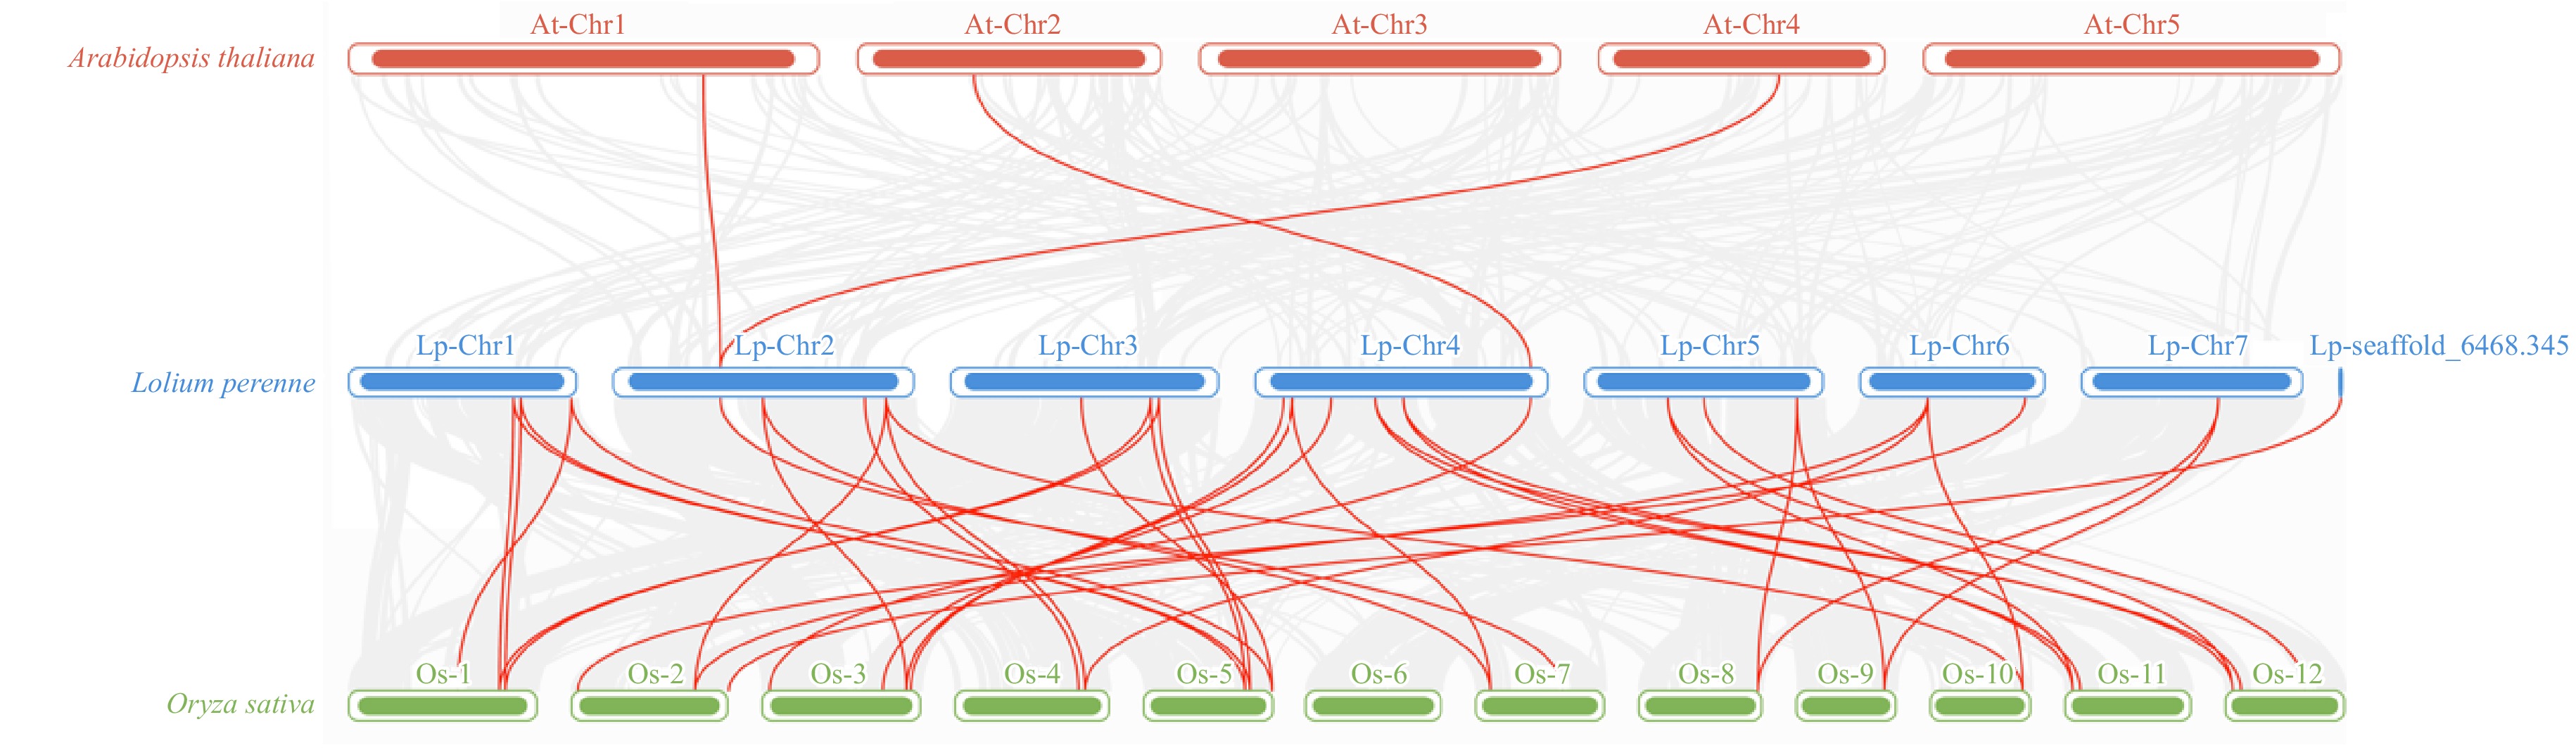
Figure 4.
The analysis of synteny among LpCDPK genes in the genomes between L. perenne and A. thaliana or O. sativa. The red lines indicate the syntenic gene pairs between L. perenne and A. thaliana or O. sativa, with chromosome numbers displayed above each chromosome.
-
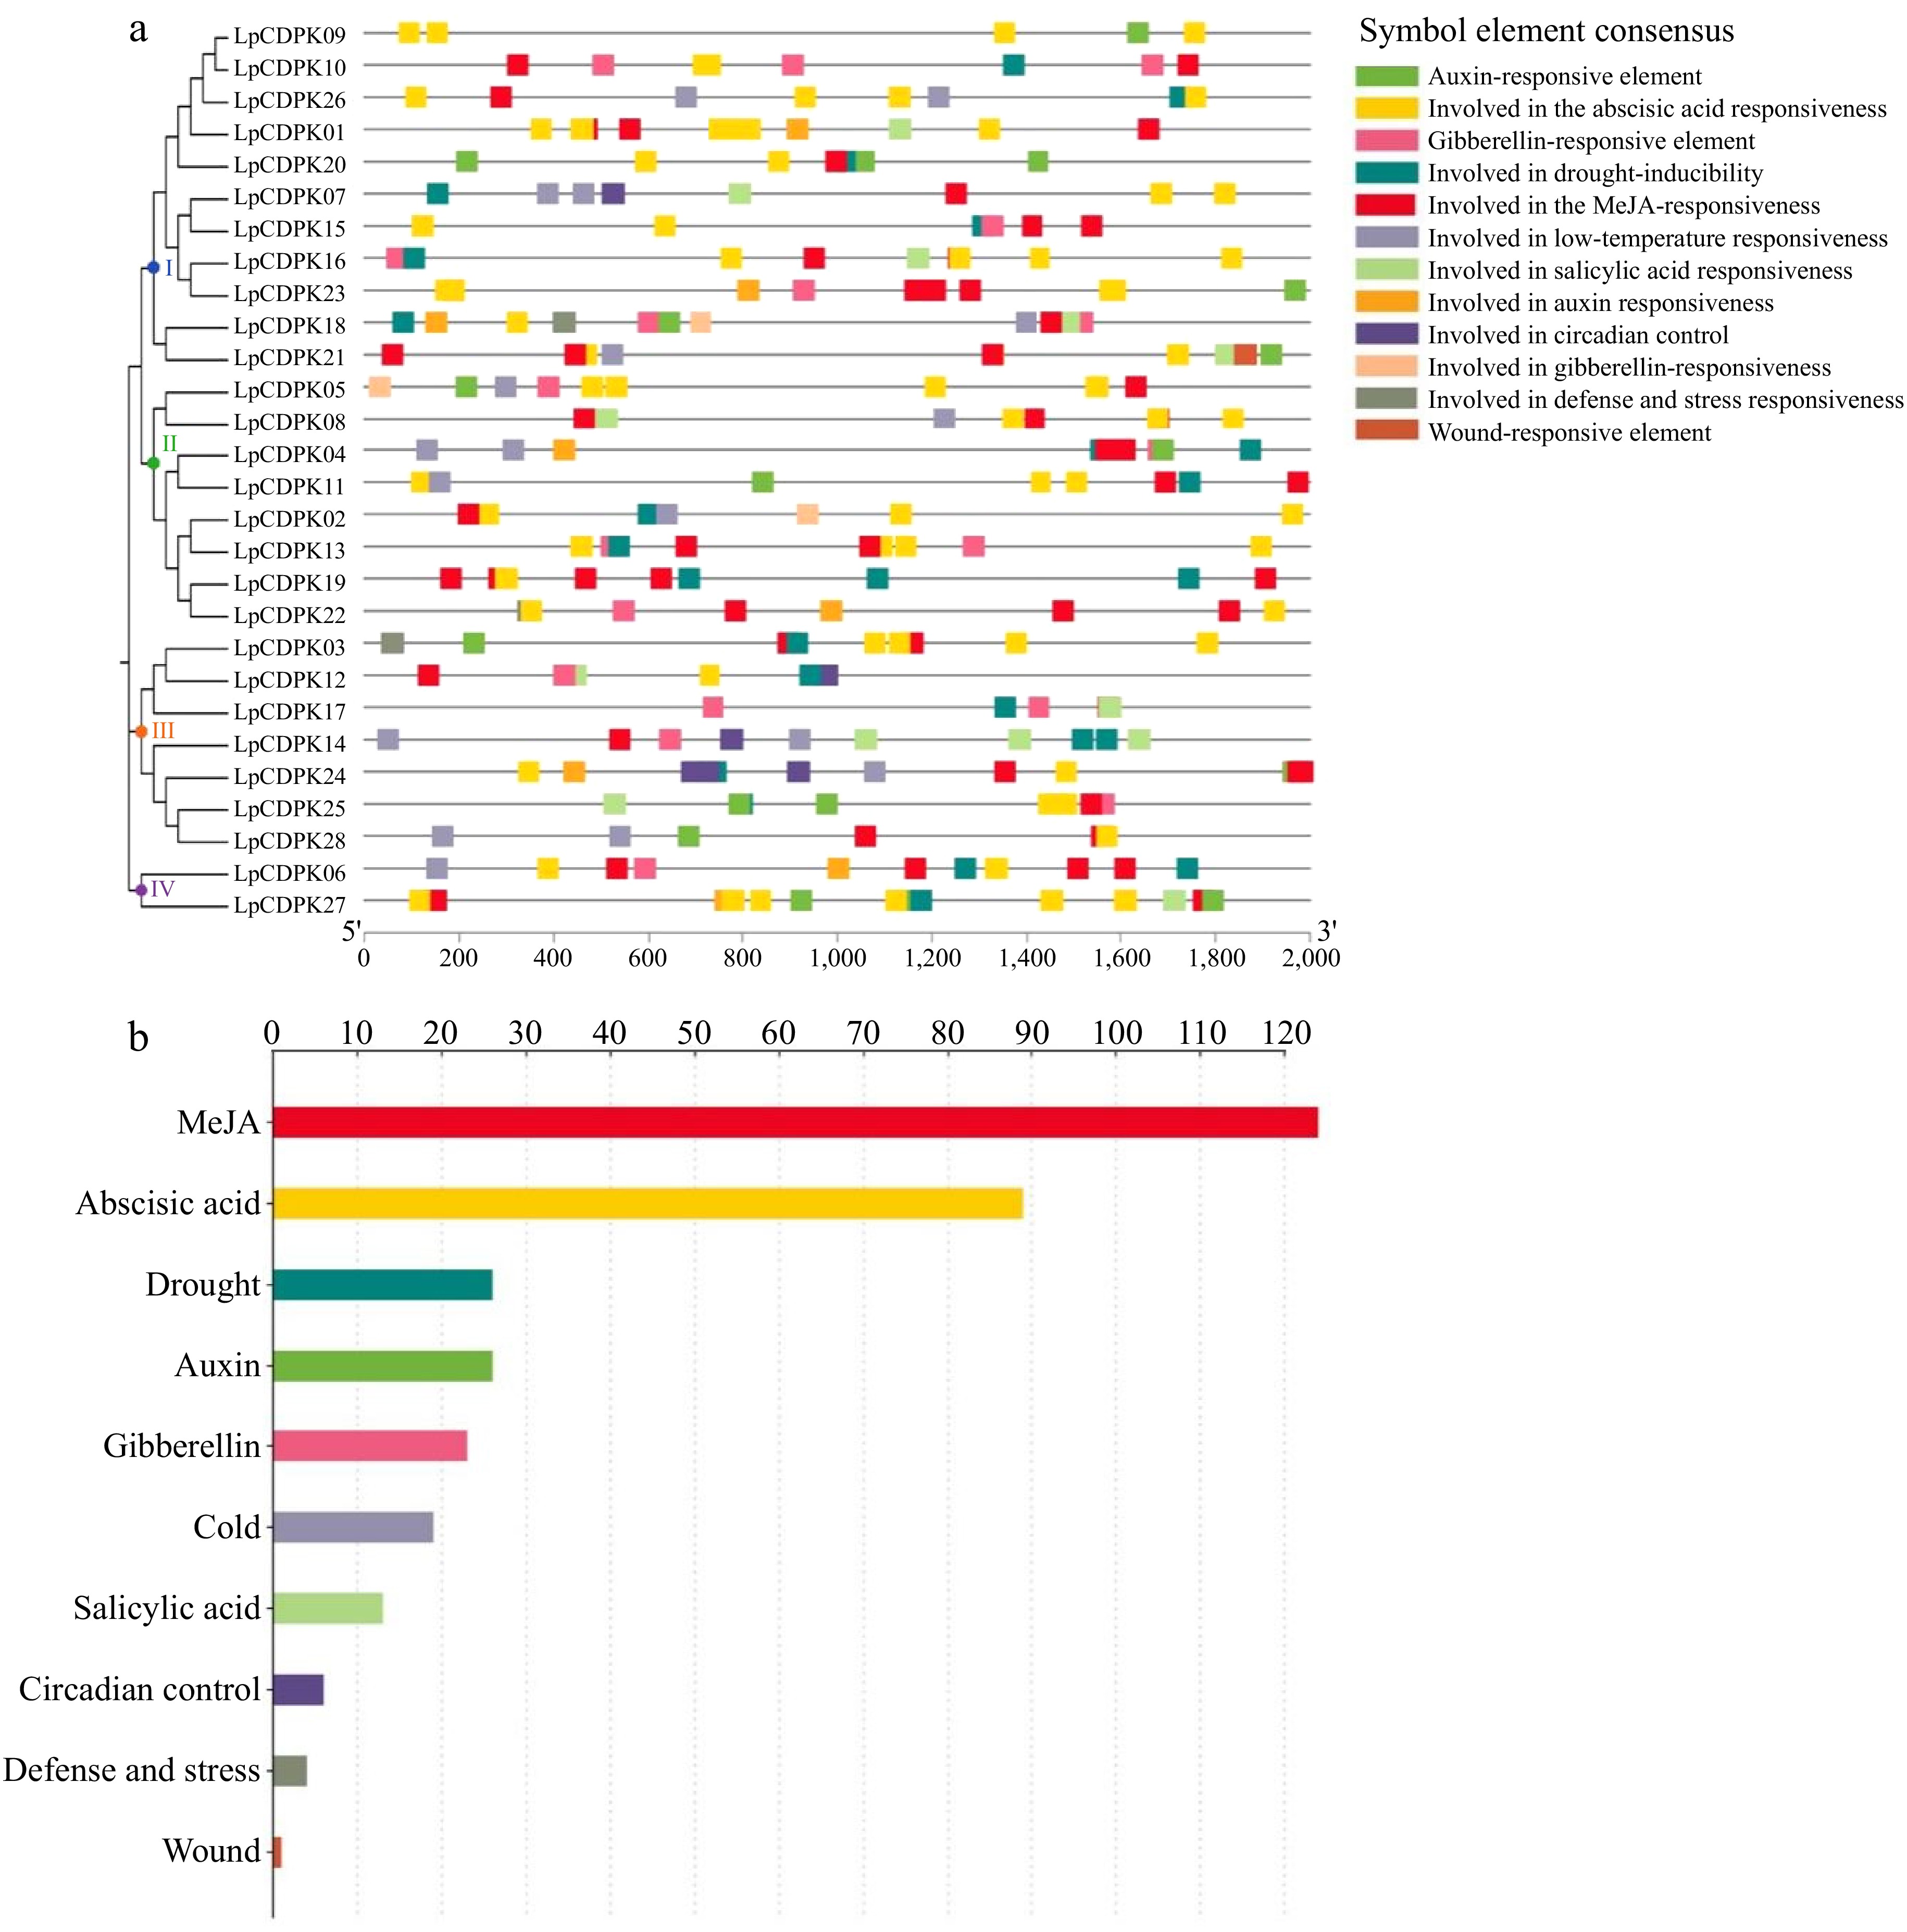
Figure 5.
Investigating the cis-acting elements within the LpCDPK gene promoters. (a) Identifying the location of the promoter cis-element, (b) assessing the quantity of these elements within the LpCDPK promoter regions, with the annotations of their functions provided on the left side of the corresponding image.
-
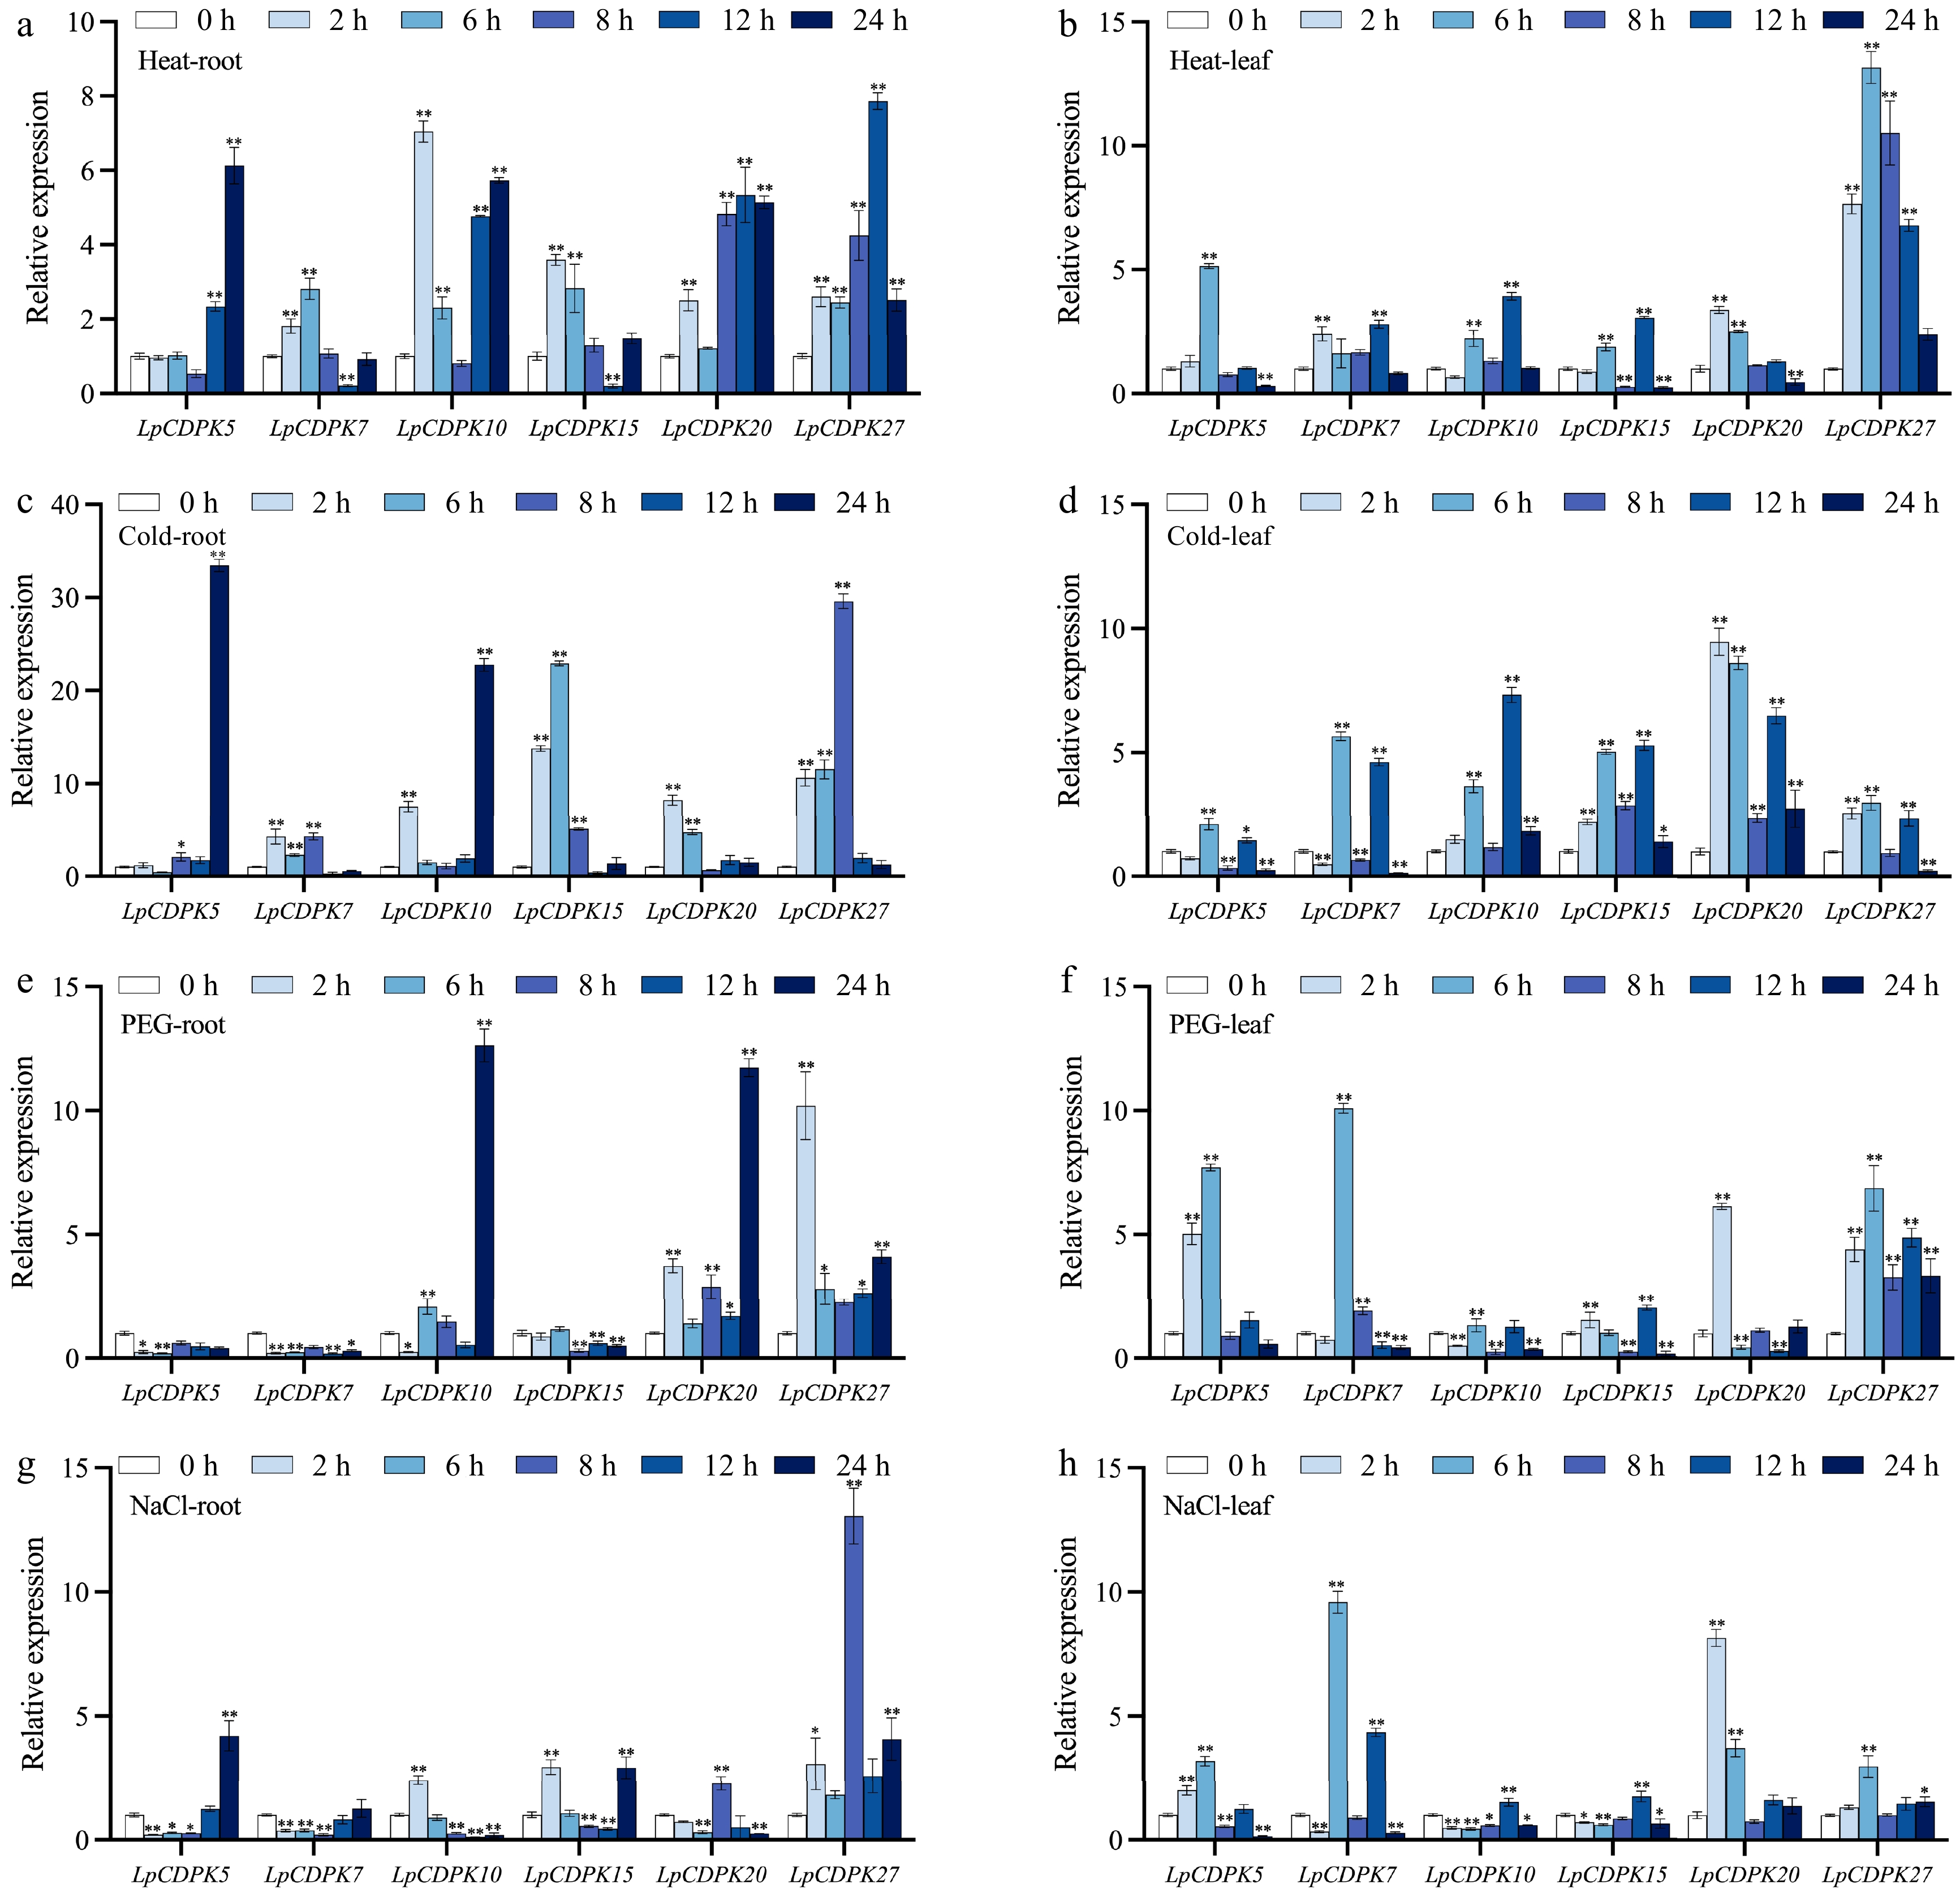
Figure 6.
The expression patterns of LpCDPKs in both roots and leaves of perennial ryegrass were examined under a variety of abiotic stress conditions. (a), (b) Exposure to high temperature stress at 38 °C; (c), (d) subjected to cold stress at 4 °C; (e), (f) challenged with osmotic stress with 15% PEG 6000; (g), (h) treated with salt stress at a concentration of 255 mM. Values are depicted as mean values coupled with their standard deviations (n = 3). The relative expression levels of the LpCDPK genes were determined using the 2−ΔΔCᴛ method. * p < 0.05, ** p < 0.01.
-
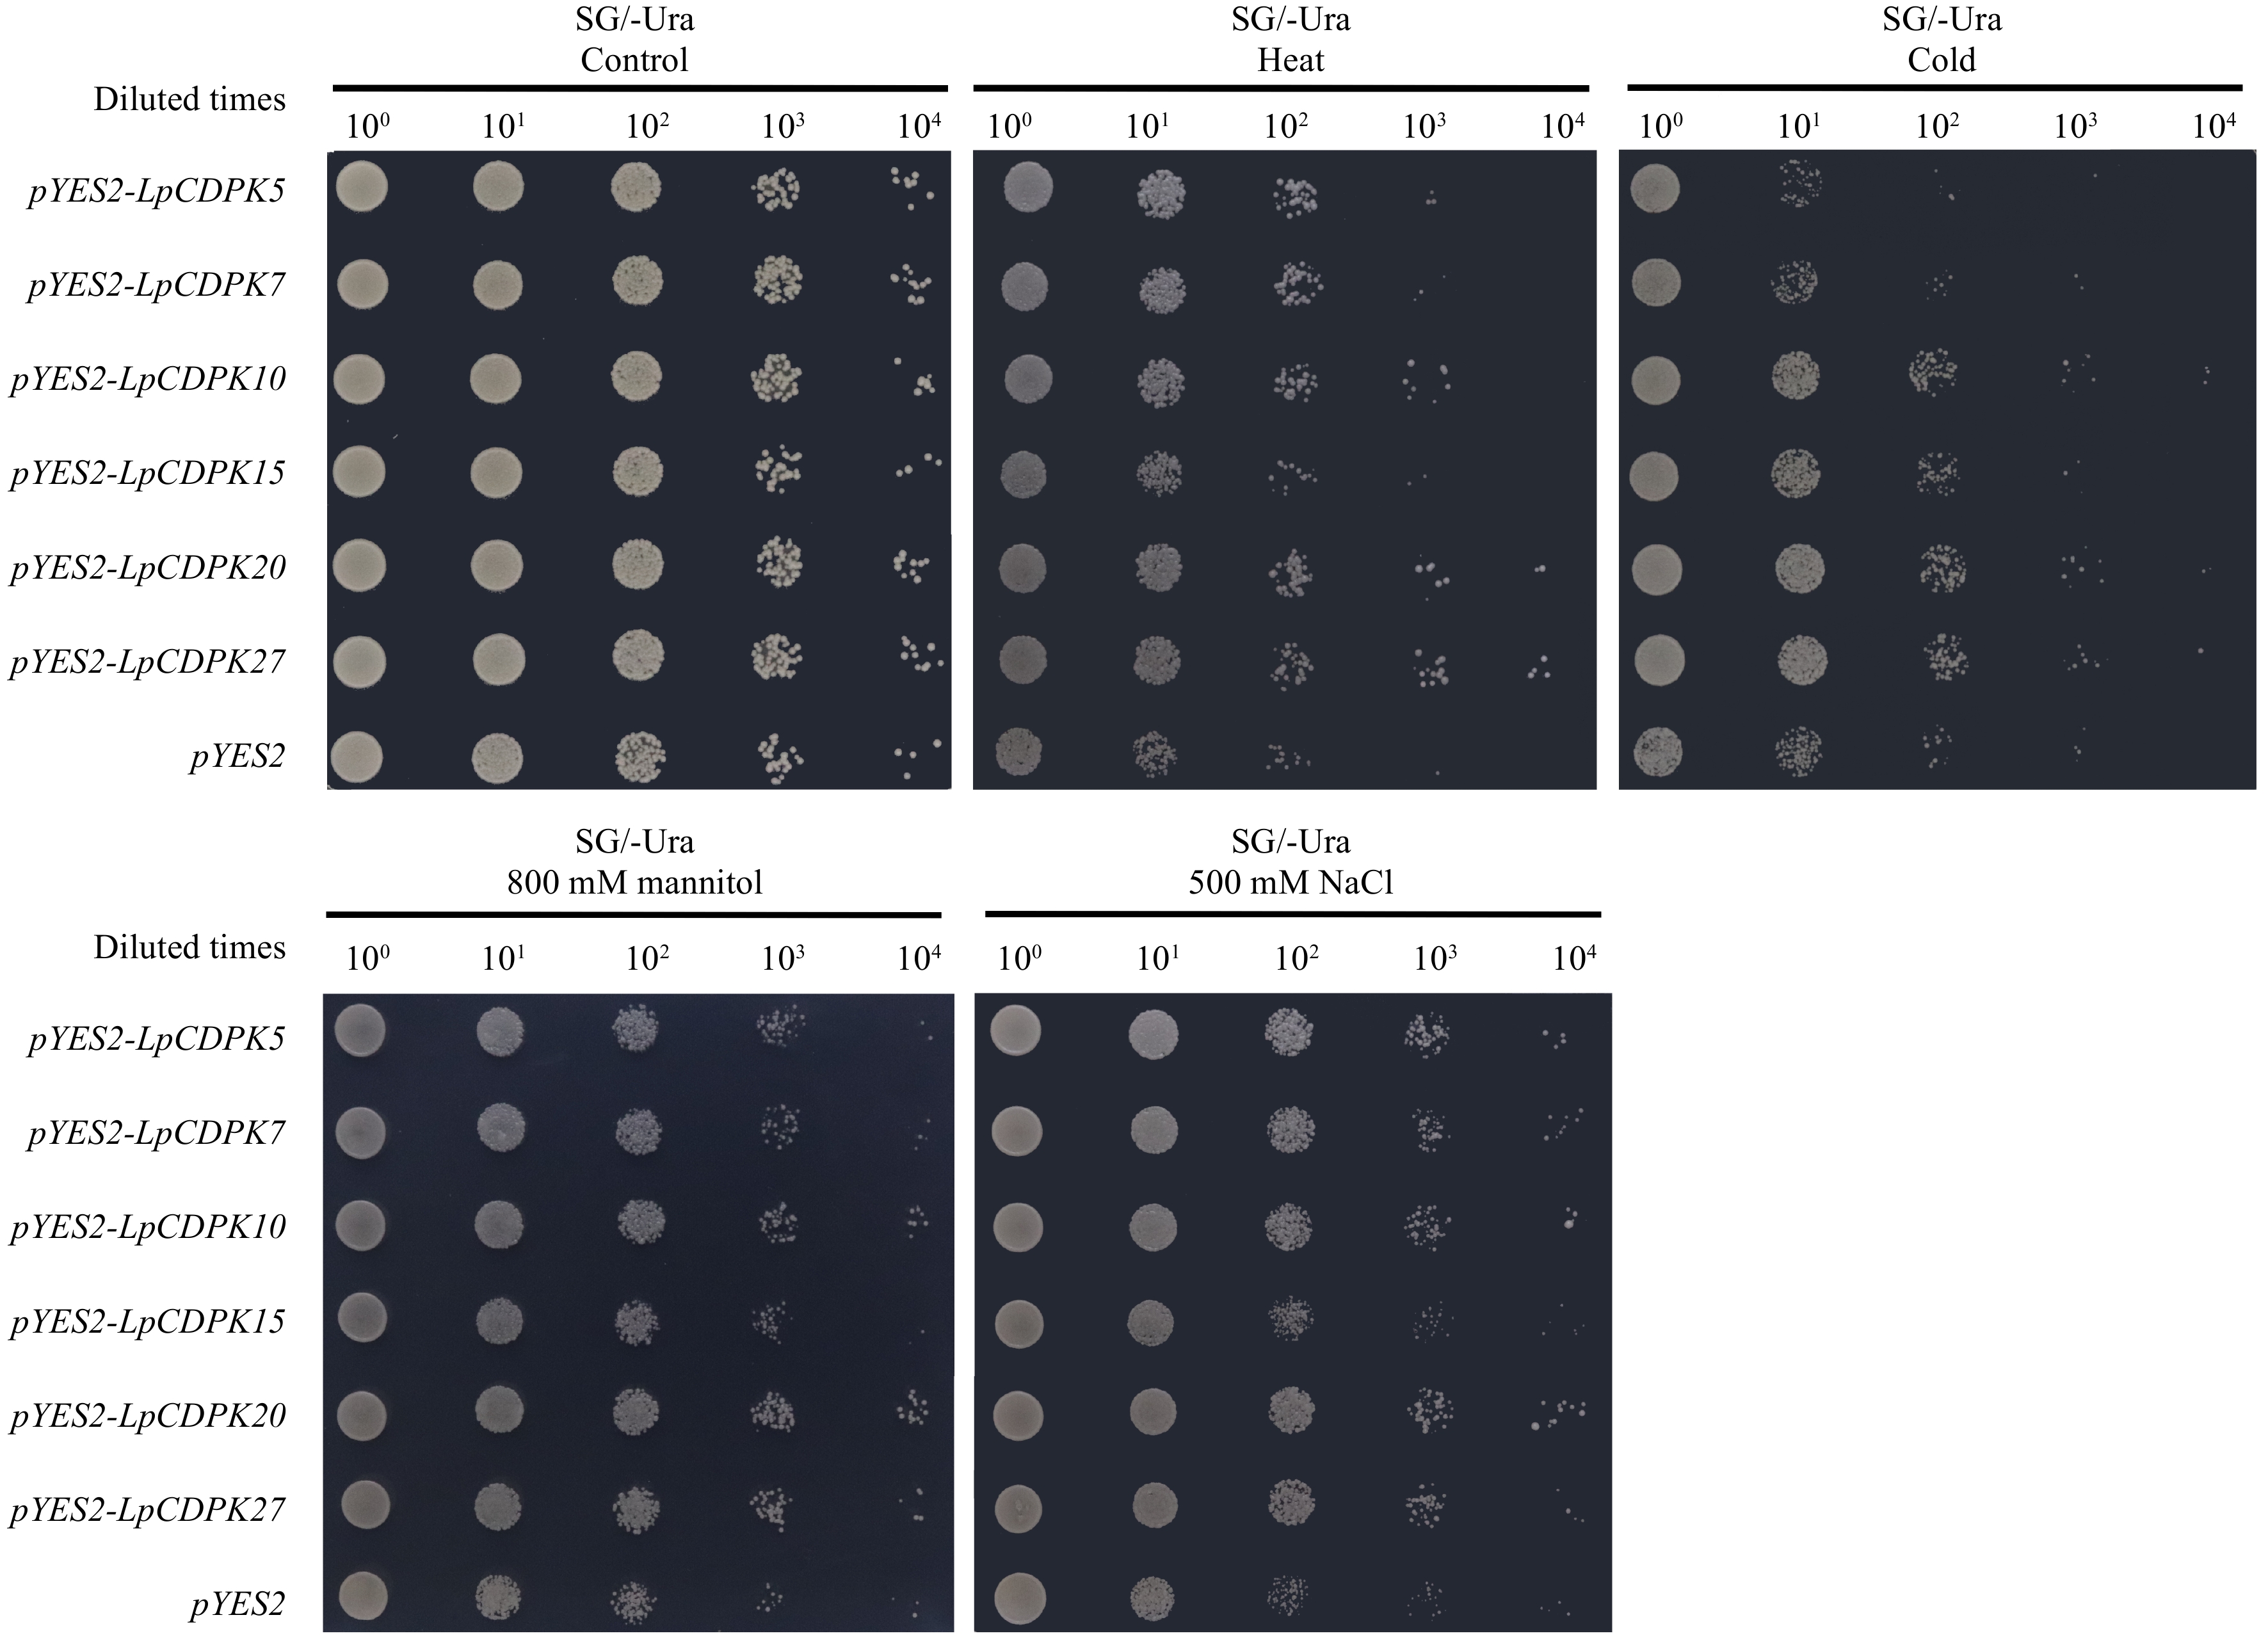
Figure 7.
Heat, cold, drought, and salt stress tolerance of LpCDPK5, LpCDPK7, LpCDPK10, LpCDPK15, LpCDPK20, and LpCDPK27 in a yeast expression system, using yeast with an empty pYES2 vector as a control.
-
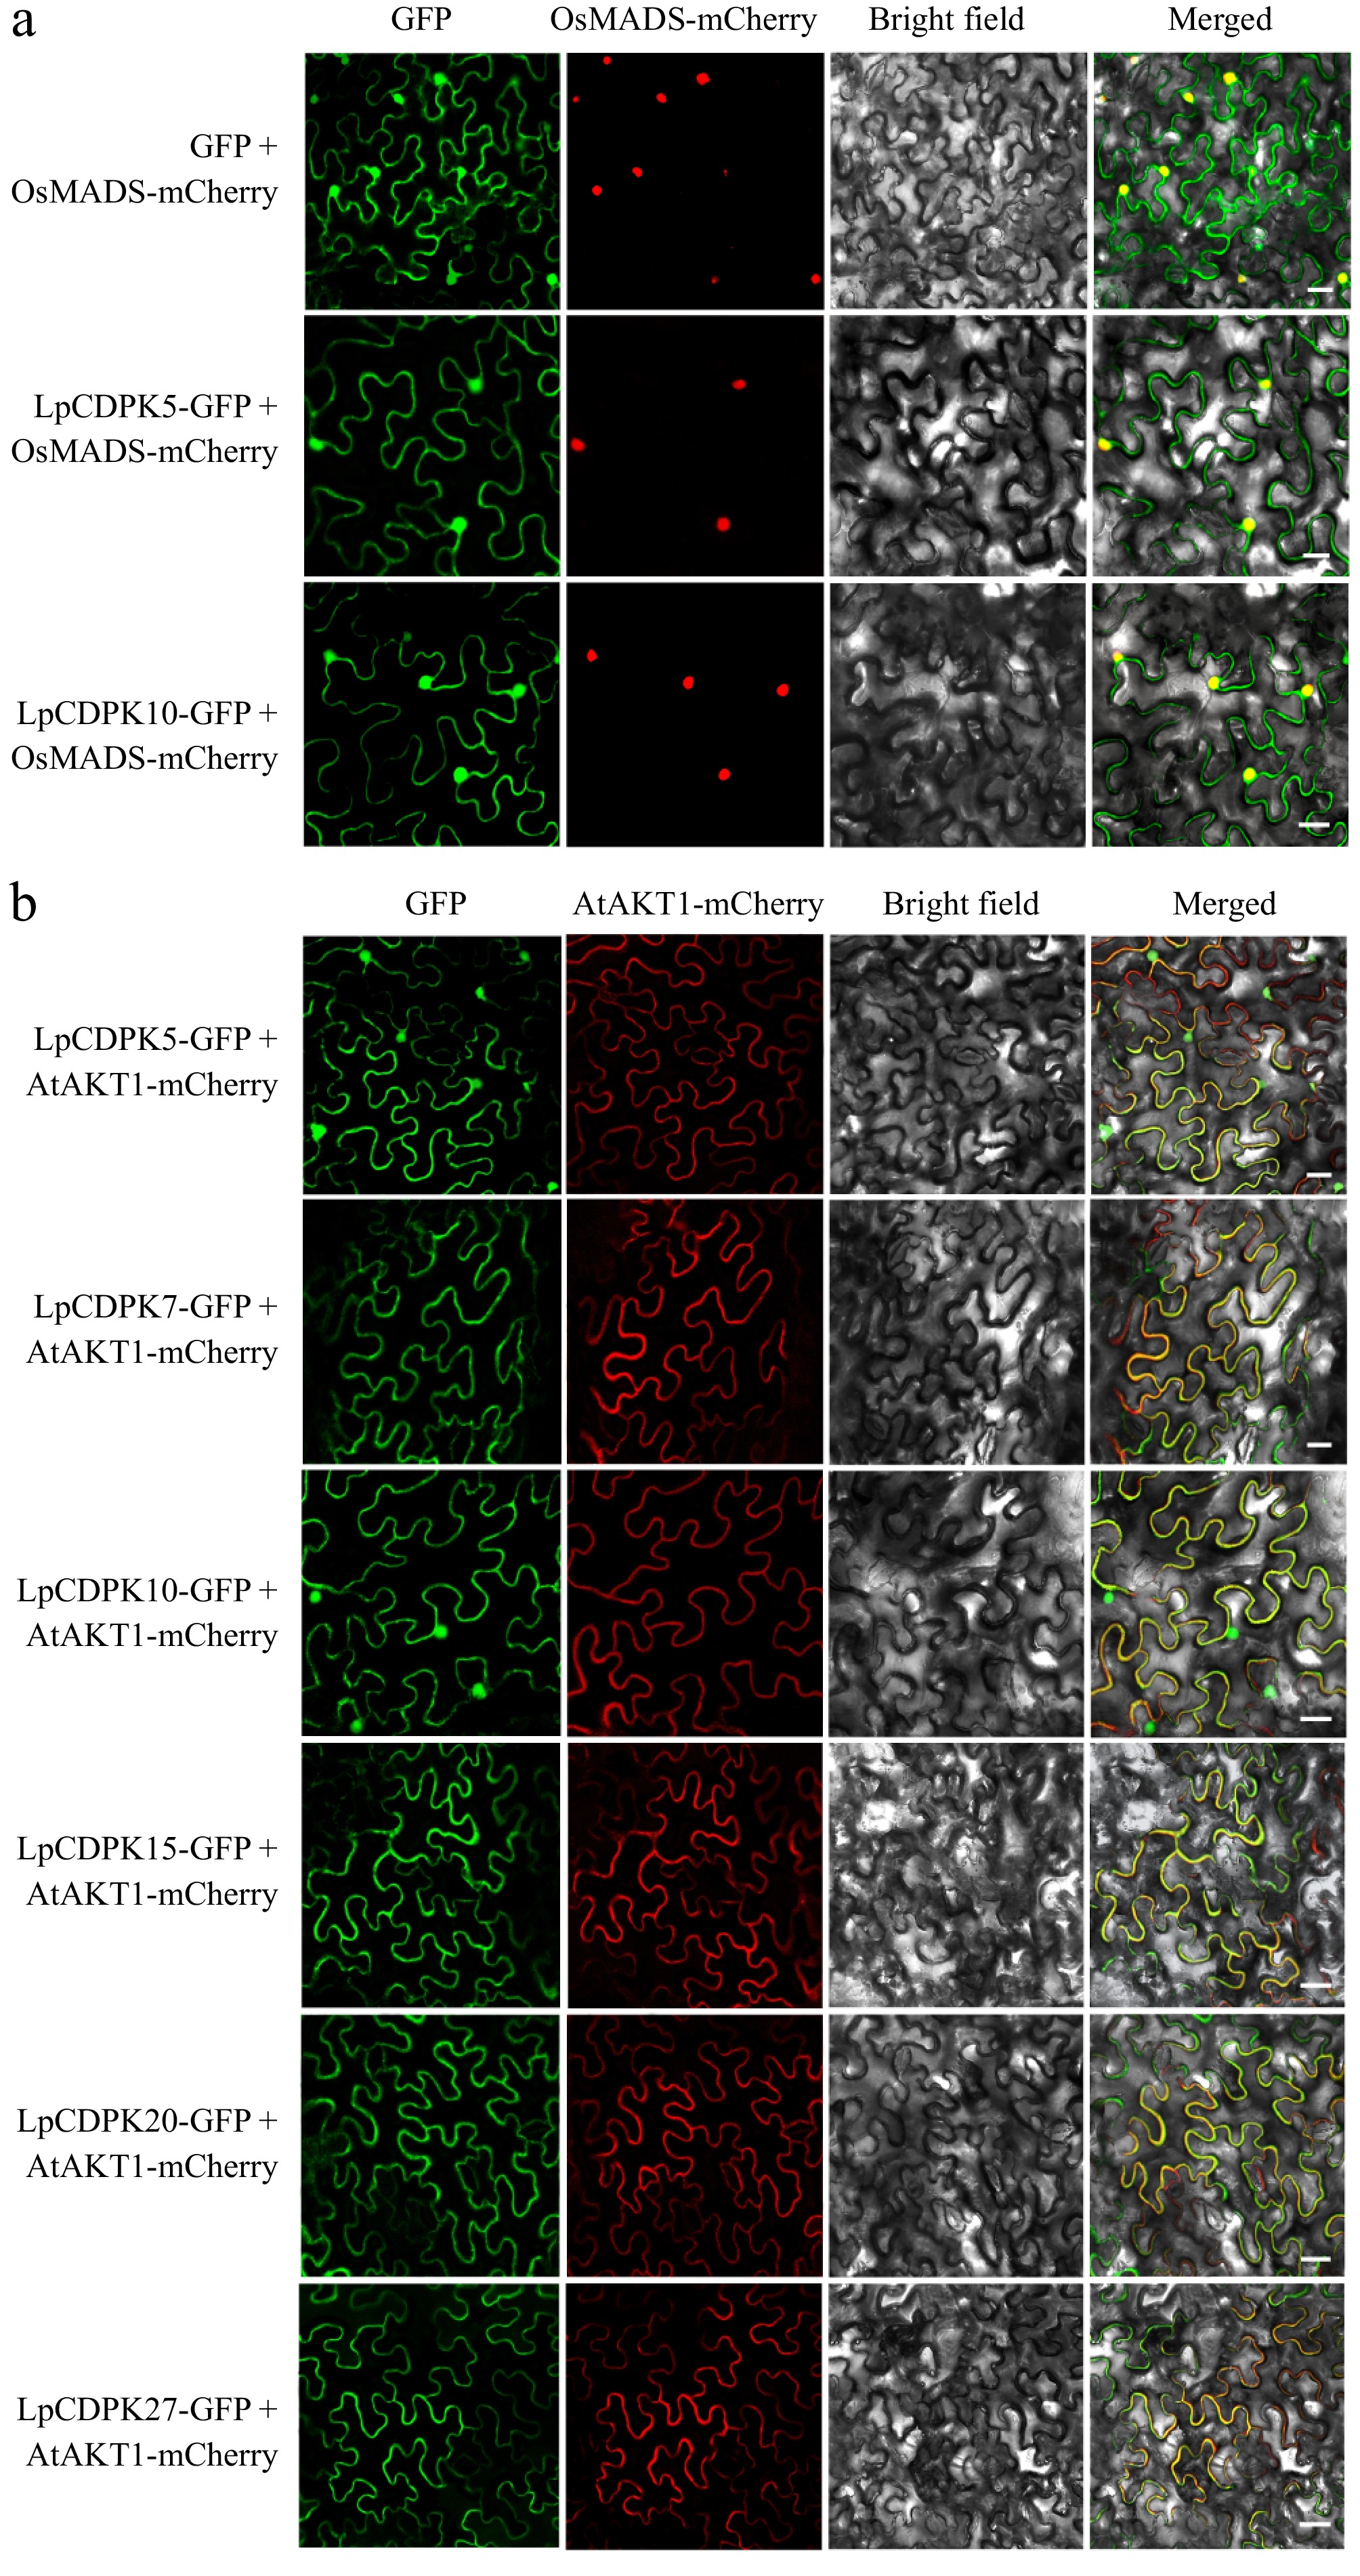
Figure 8.
Subcellular localization of LpCDPKs. The injected tobacco was used for observation. The vector pCAMBIA1305 was used as the control. The nucleus-marker: (a) nucleus localization protein OsMADS, and PM-marker: (b) plasma membrane localization protein AtAKT1 were used, respectively. Bars = 20 μm.
-
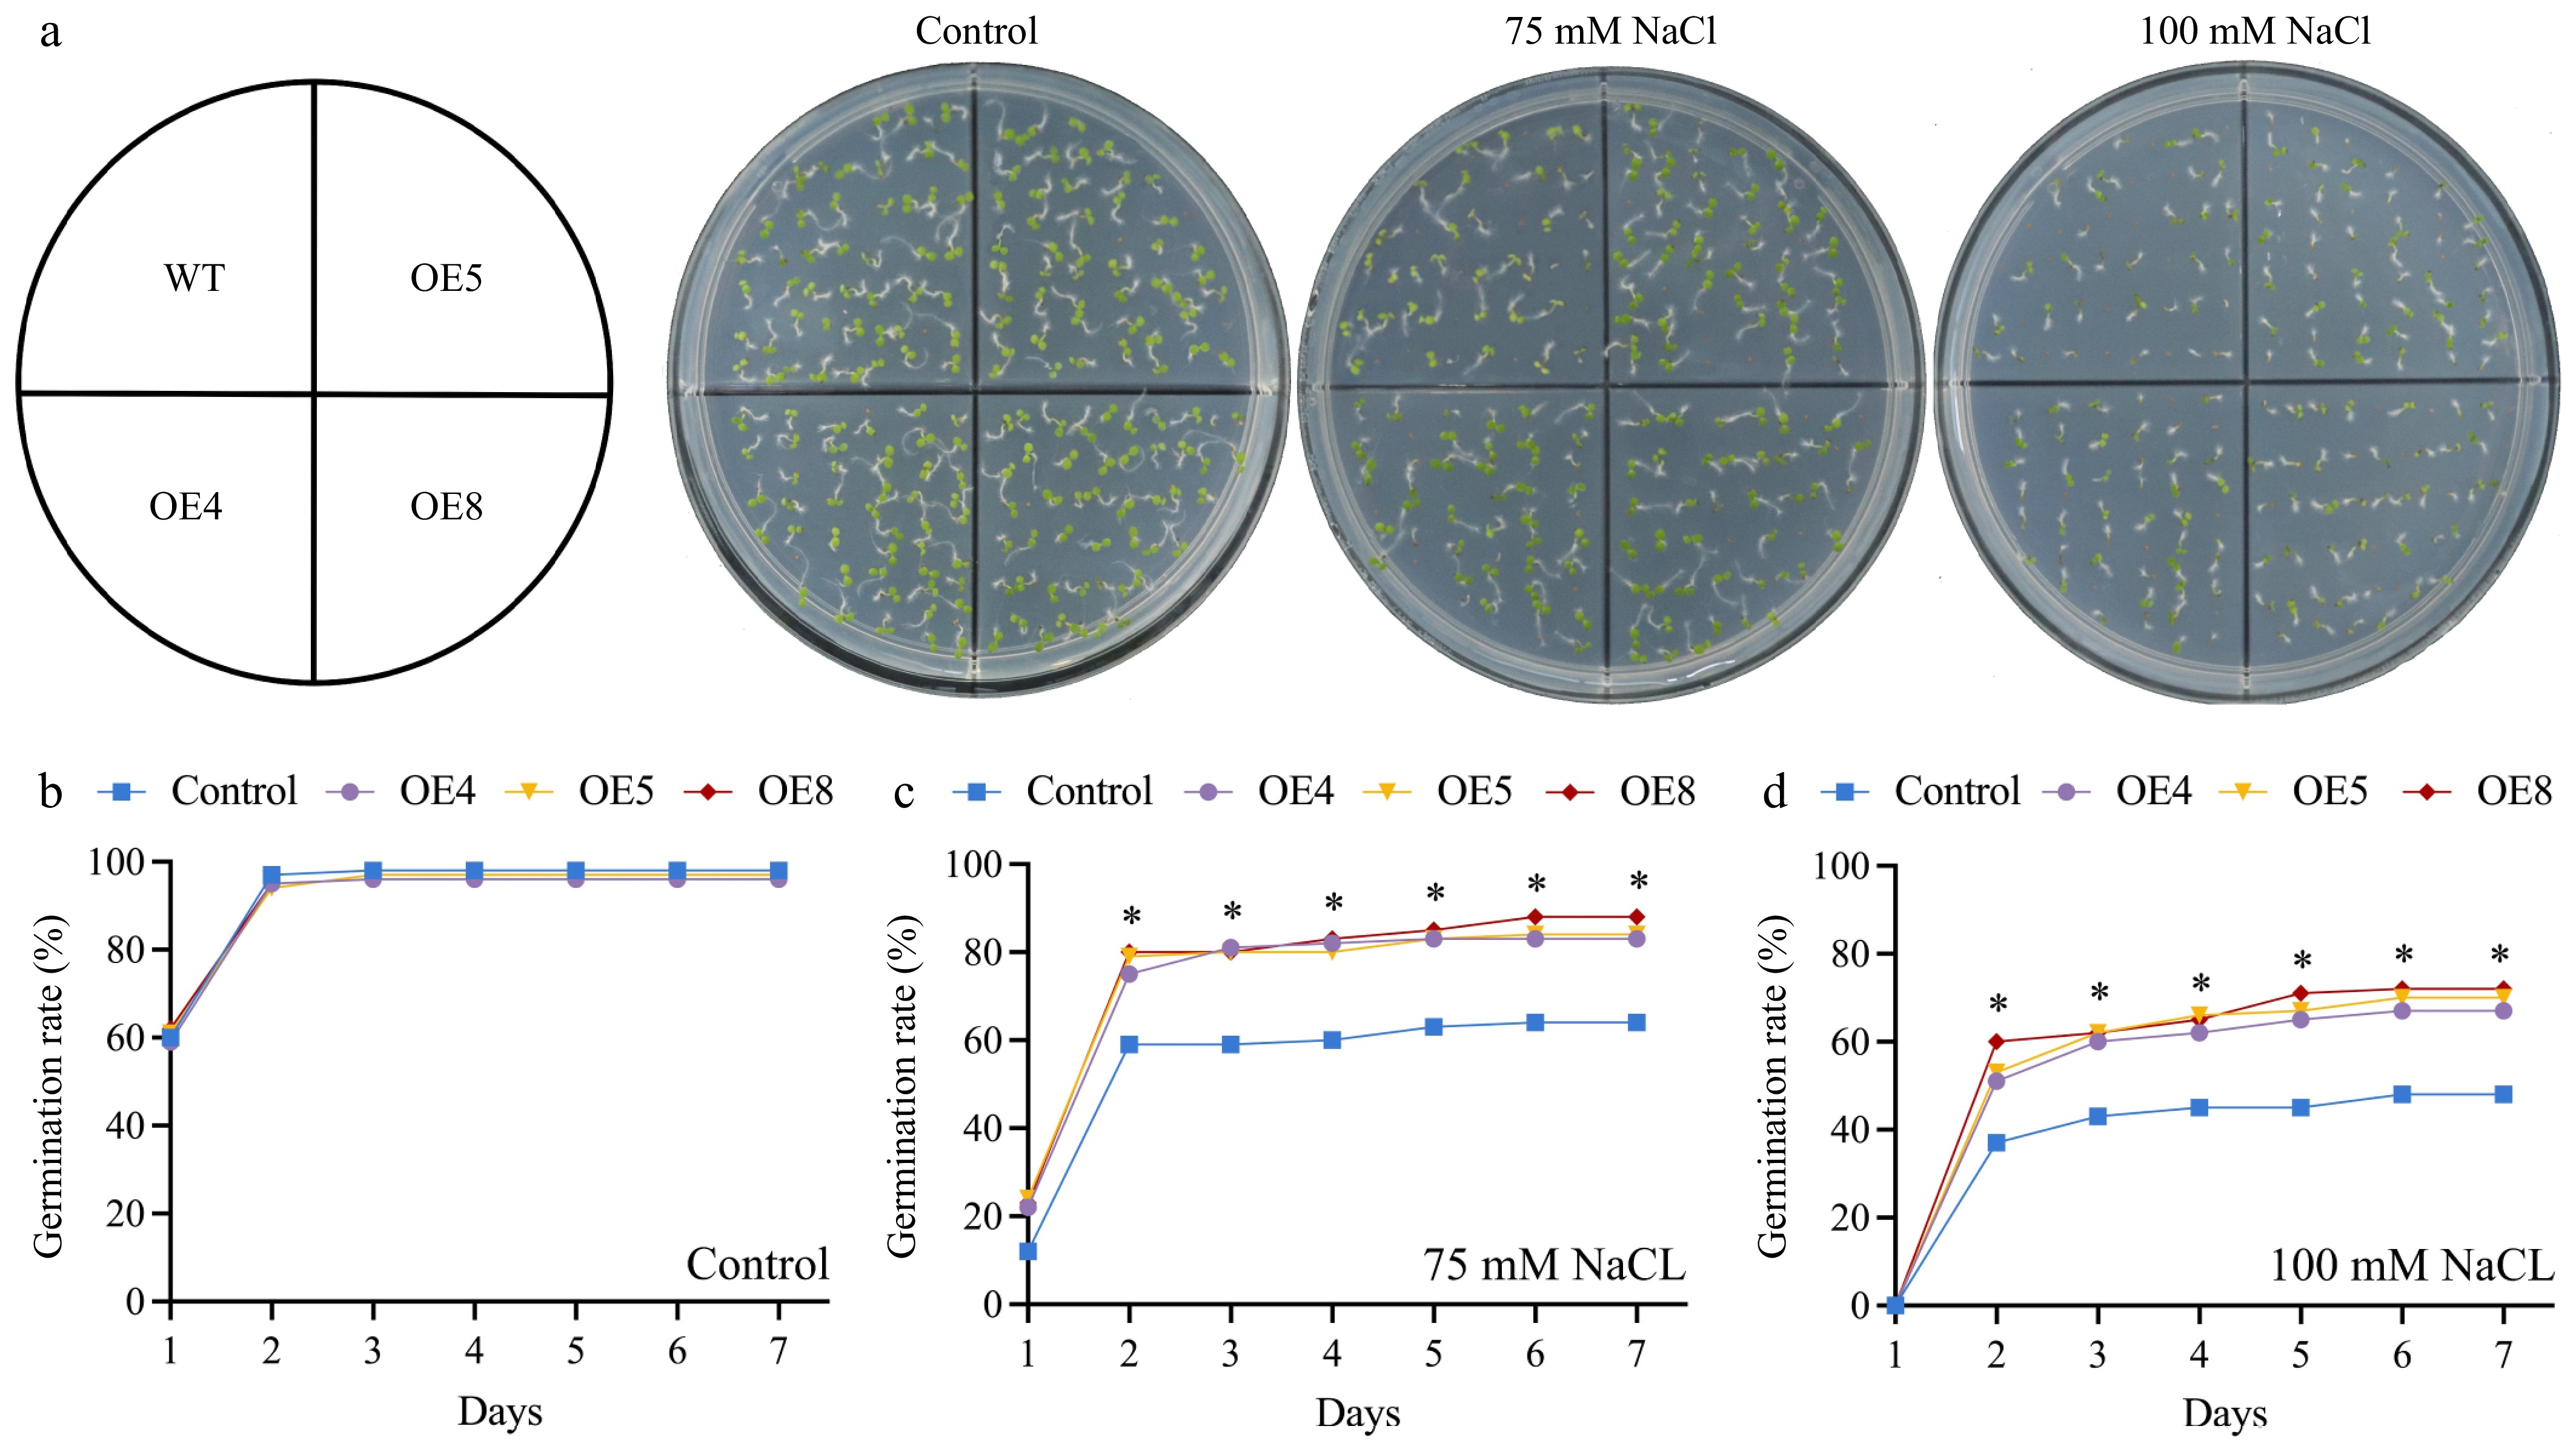
Figure 9.
Assessing the impact of LpCDPK27 overexpressing Arabidopsis on seed germination under saline conditions involved comparing these lines to wild-type controls. (a) Photos were captured after a 7-d germination period on 1/2 MS medium supplemented with either 0, 75, or 100 mM NaCl. The germination rates on 1/2 MS medium with (b) 0, (c) 75, and (d) 100 mM NaCl were examined. Values are depicted as mean values coupled with their standard deviations (n = 3, with 50 seeds per replicate). * denotes a statistically significant difference between the transgenic and wild-type lines for the specified time point (p < 0.05).
-
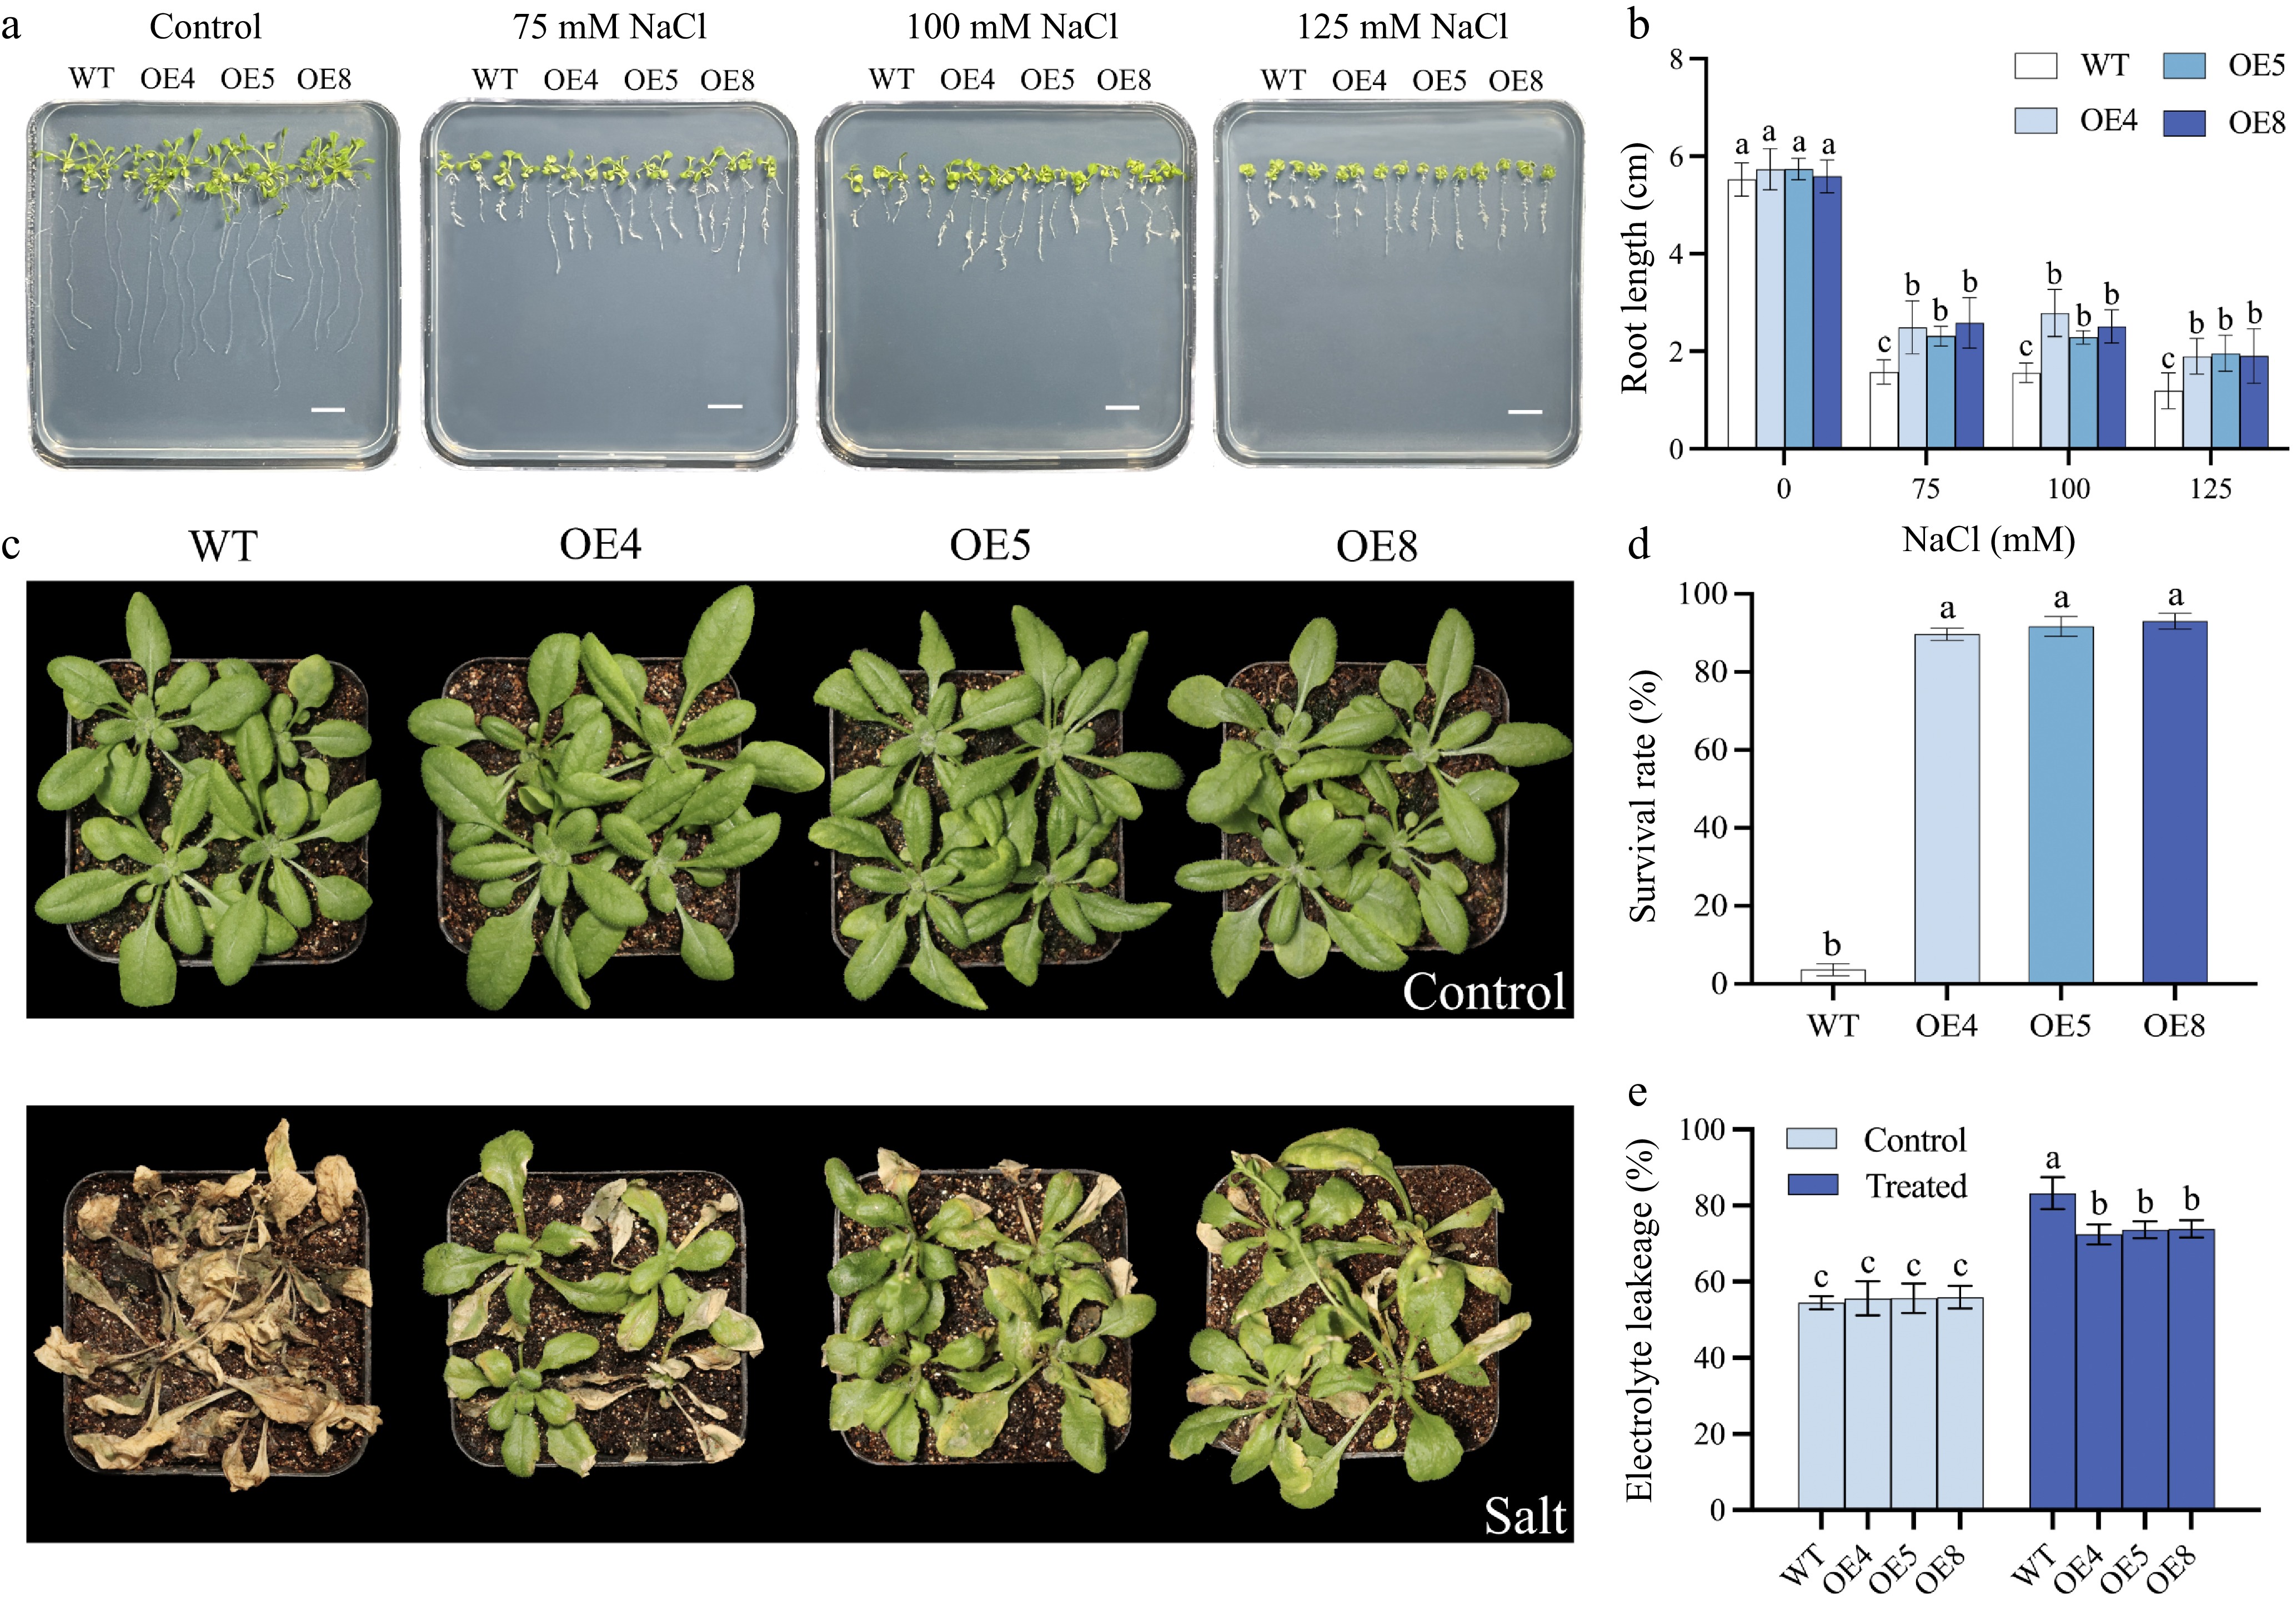
Figure 10.
Salt tolerance assessment of Arabidopsis over-expressed of LpCDPK27. (a) Germinated seeds were grown on 1/2 MS medium with varying NaCl concentrations of 0, 75, 100, or 125 mM. Images were captured after 14 d of growth (scale bars = 10 mm), (b) after which the length of the primary roots is determined. (c) The appearance of transgenic and wild-type Arabidopsis at 4 weeks of age, with or without NaCl treatment for 22 d, is documented following a 2-week salt removal period through watering. (d) The survival rates are figured out by comparing the count of surviving plants to the total number of plants. (e) Electrolyte leakage is assessed 5 d post-salt treatment. Data presented are the mean and standard deviation (n = 3, with four replicate pots per treatment). A common letter superimposed on the bars signifies no significant difference at the p > 0.05 level.
-
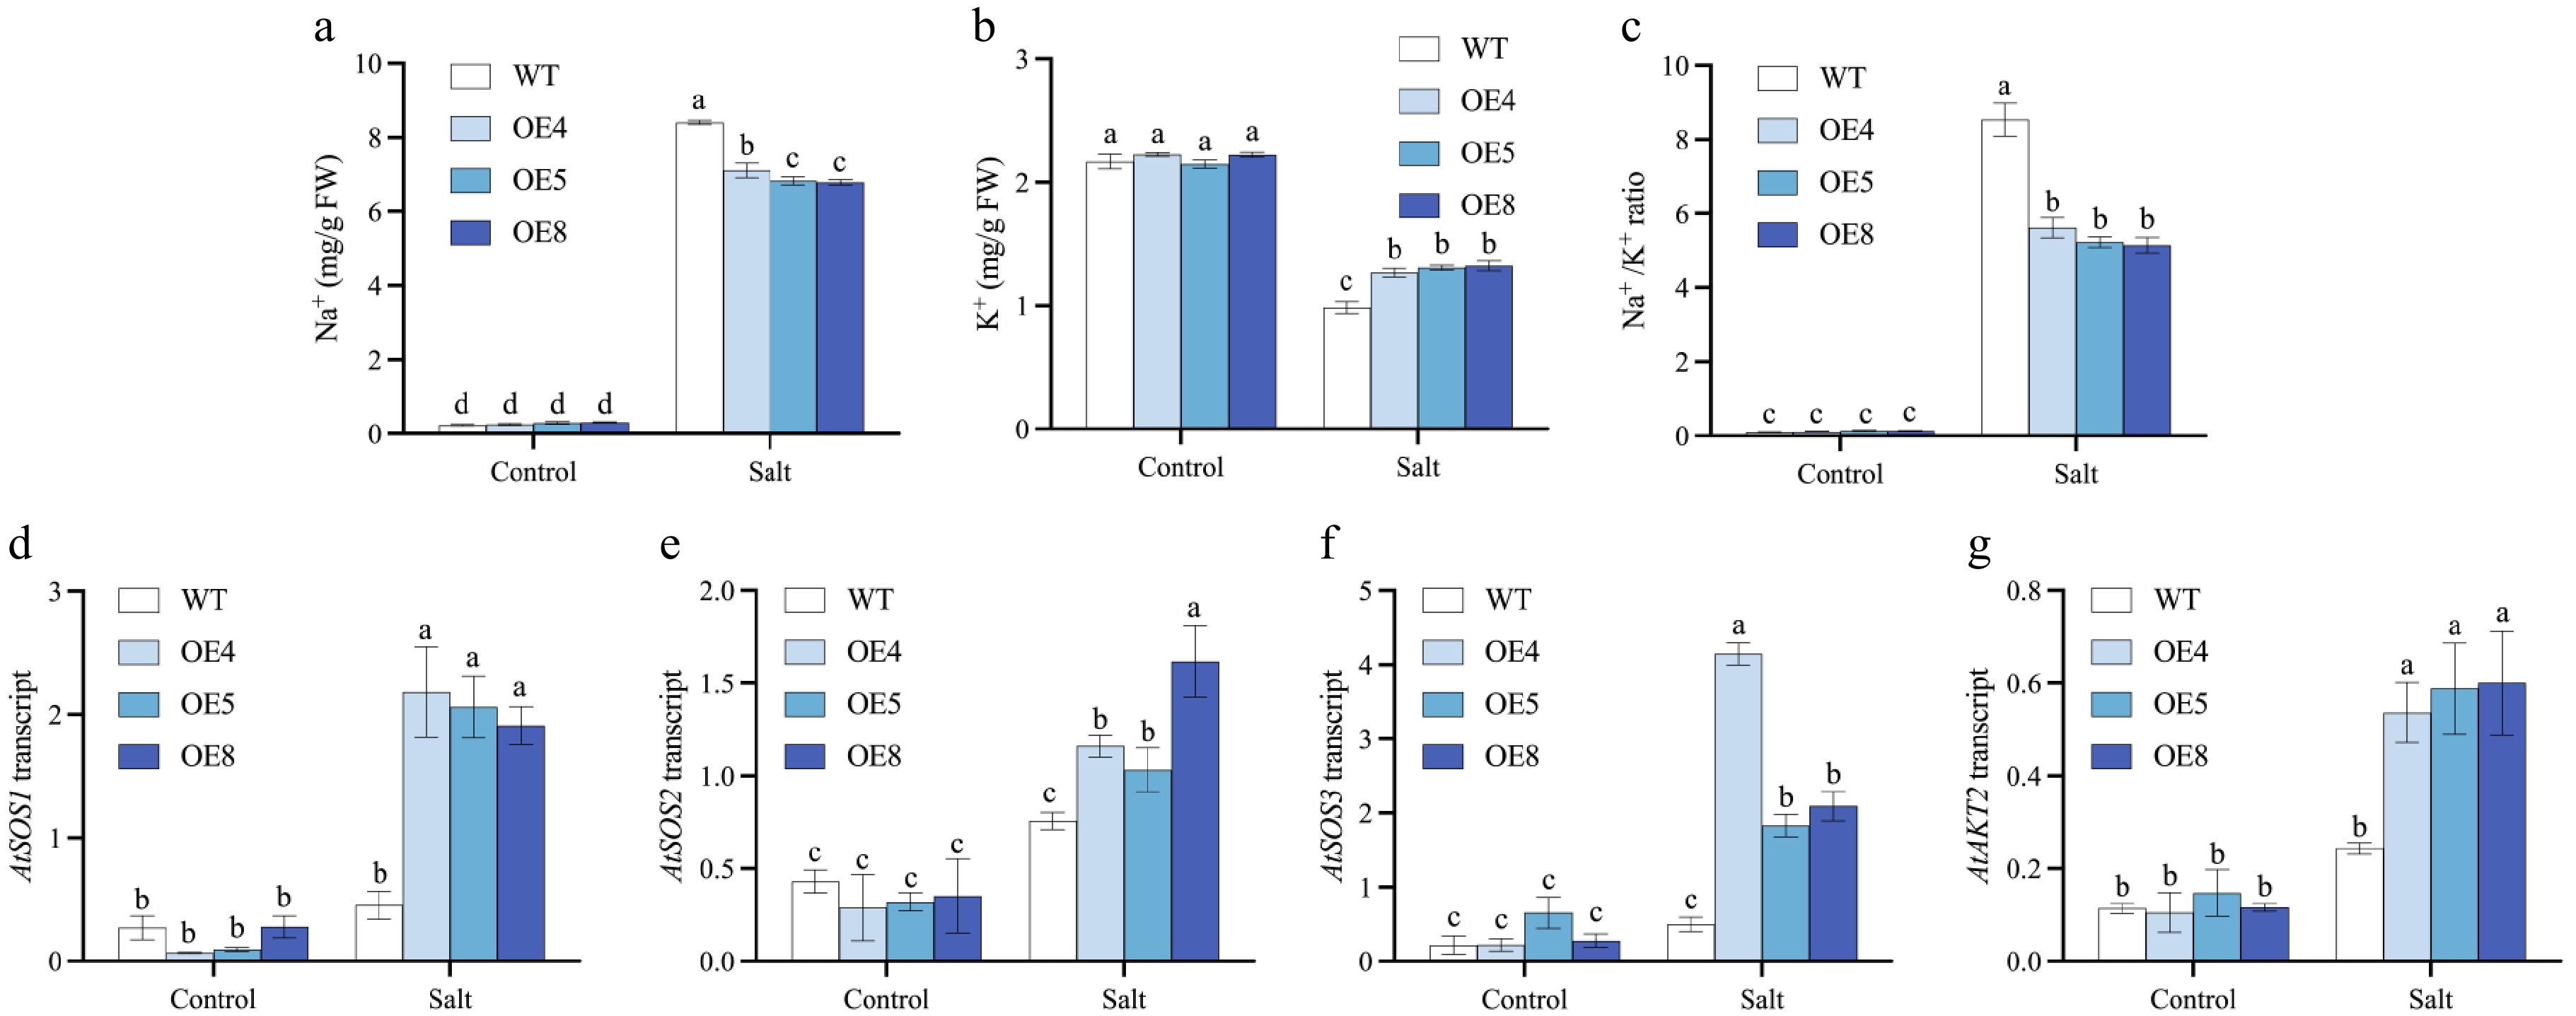
Figure 11.
Investigations are conducted on the levels of Na+ and K+, as well as the relative expression levels of genes related to ion homeostasis and stress responsiveness, in LpCDPK27 overexpressing Arabidopsis lines vs wild-type plants following exposure to saline conditions. Three-week-old seedlings are subjected to 75 mM NaCl for 10 d, after which the shoots were collected for (a) Na+ and (b) K+ level measurements. (c) The Na+/K+ ratio is derived from these measurements. Following a 6-h treatment with 50 mM NaCl, total RNA extraction is performed from leaf tissues. The transcript levels of (d) SOS1, (e) SOS2, (f) SOS3, and (g) AKT2 are subsequently quantified using qRT-PCR. Values are depicted as mean values coupled with their standard deviations (n = 3). A common letter superimposed on the bars signifies no significant difference at the p > 0.05 level.
Figures
(11)
Tables
(0)