-
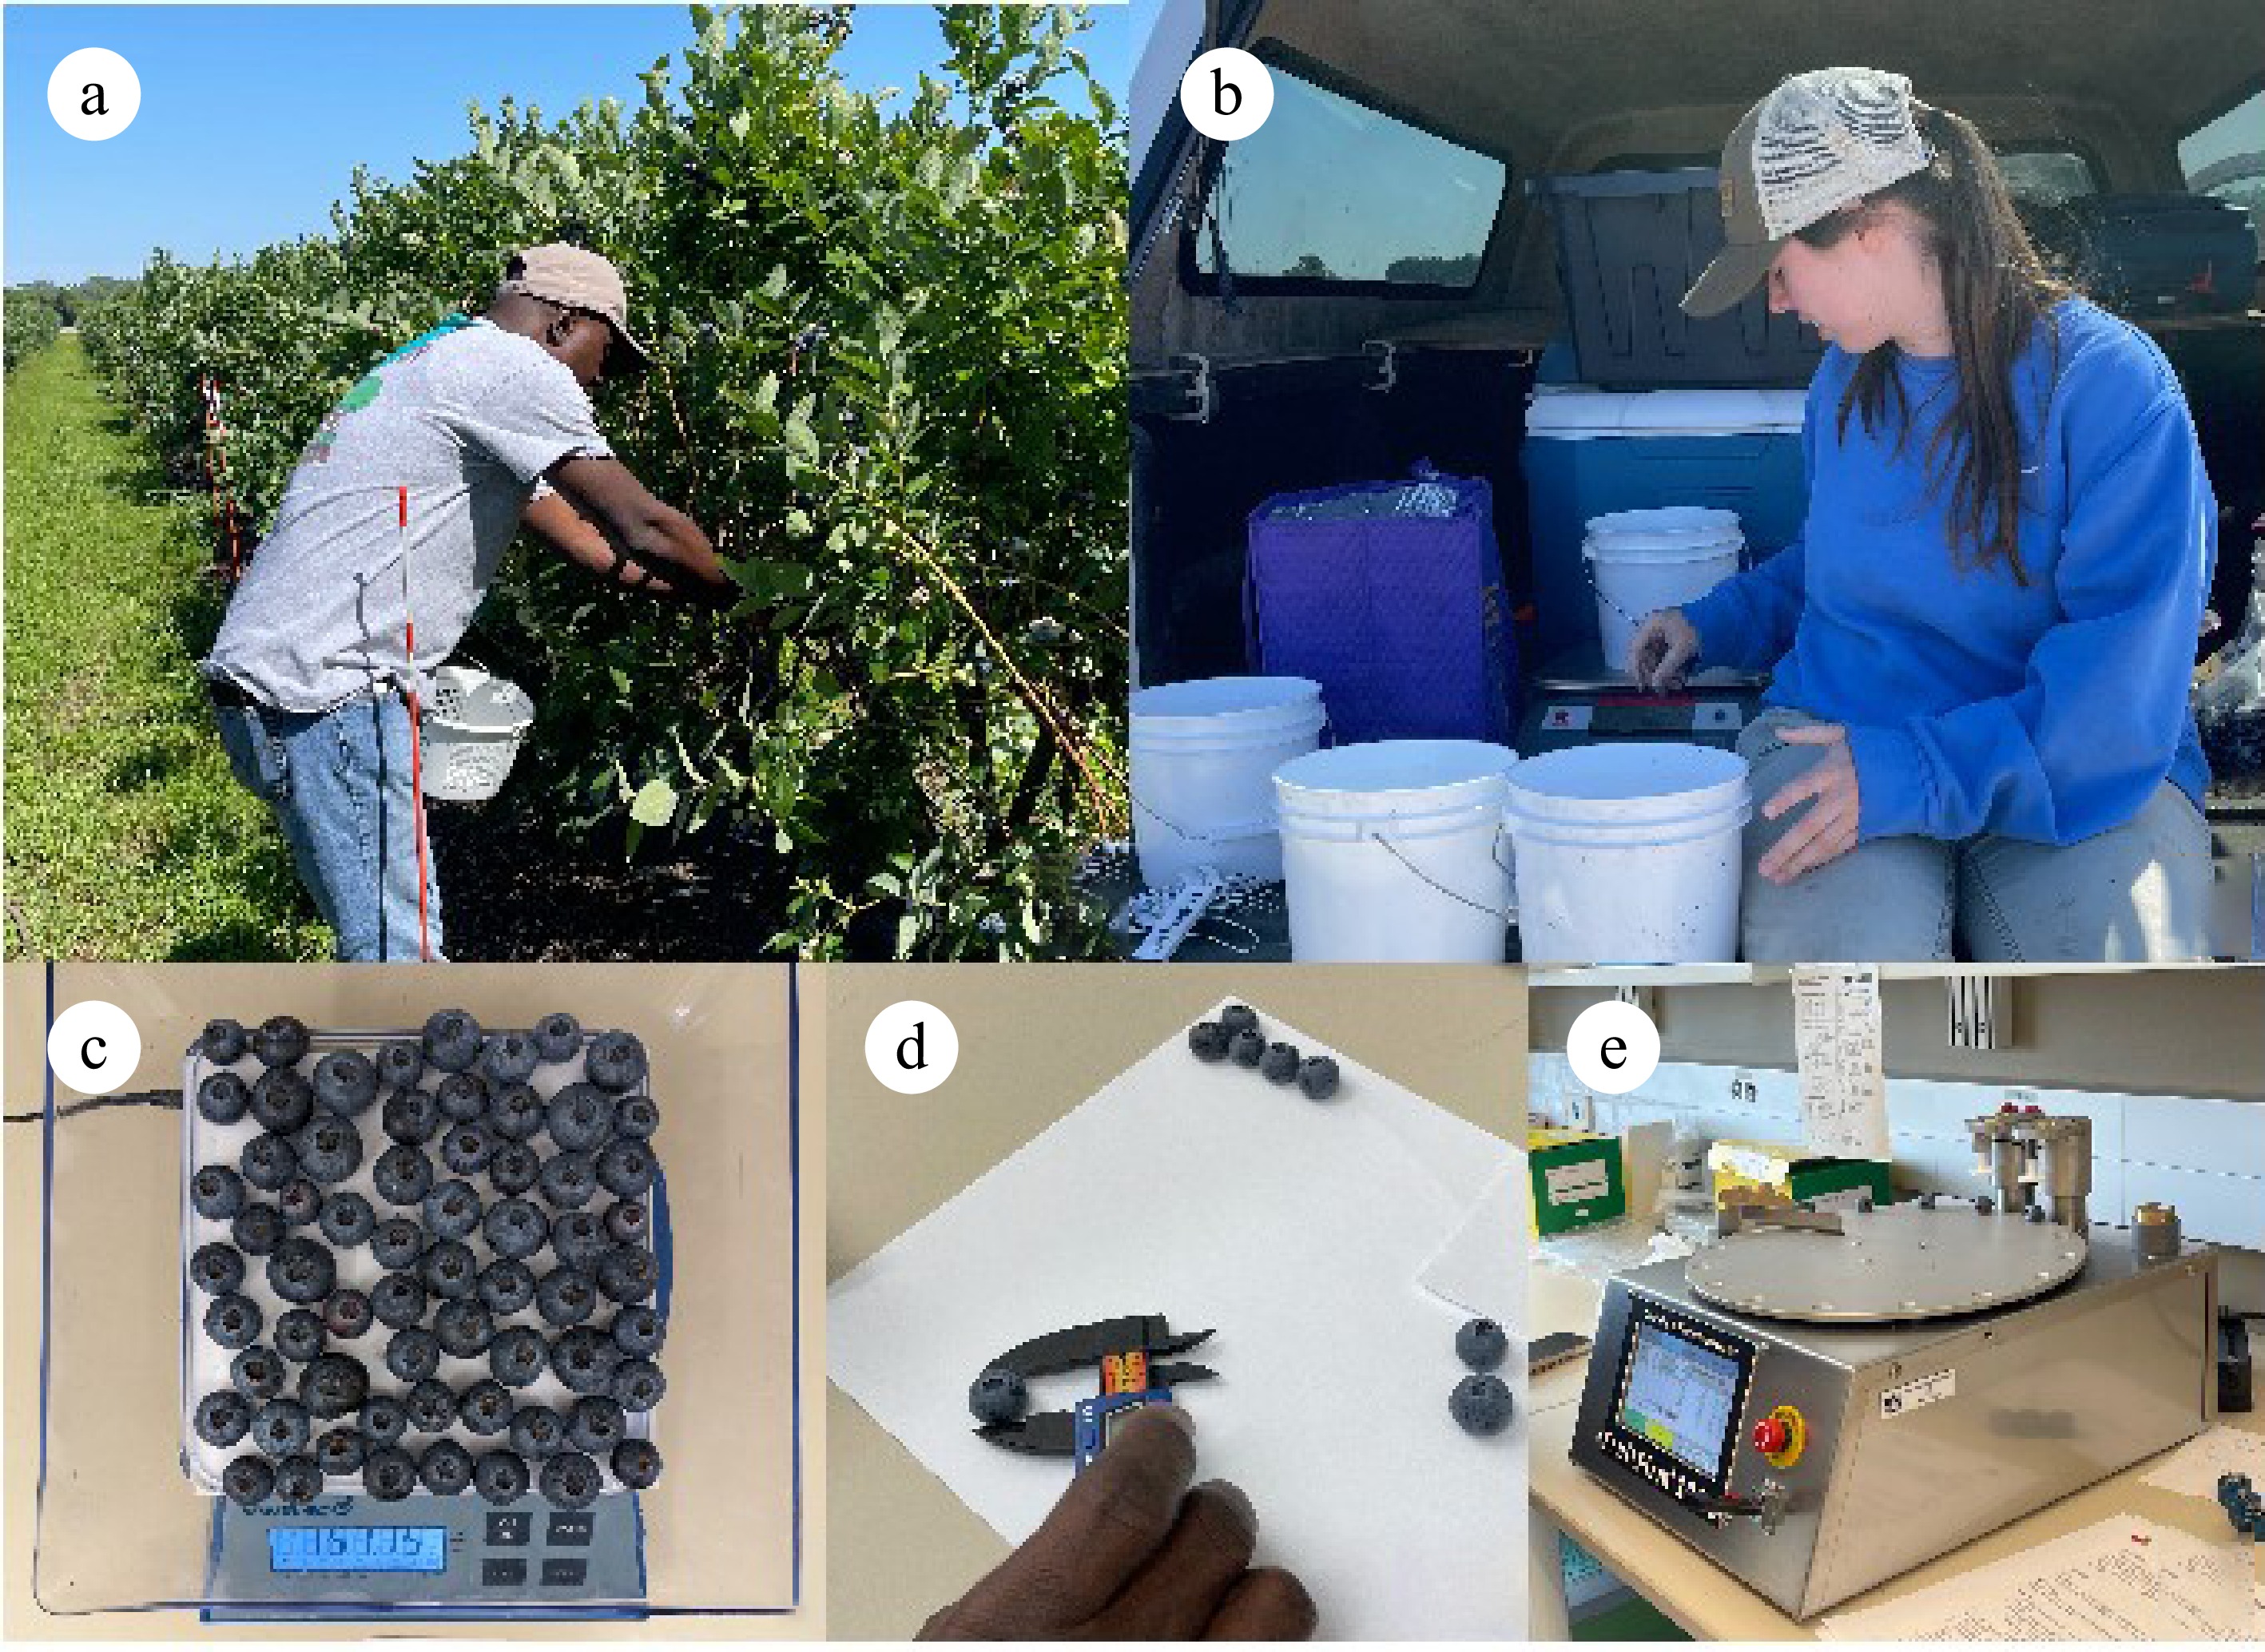
Figure 1.
Process of blueberry phenotyping for yield, average berry weight, and size. (a) Blueberry harvesting, (b) yield measurement, (c) average berry weight measurement, (d) manual measurement of berry size with an electronic digital caliper, (e) berry size and firmness measurement with FruitFirm® 1000 (CVM Inc., Pleasanton, CA, USA).
-
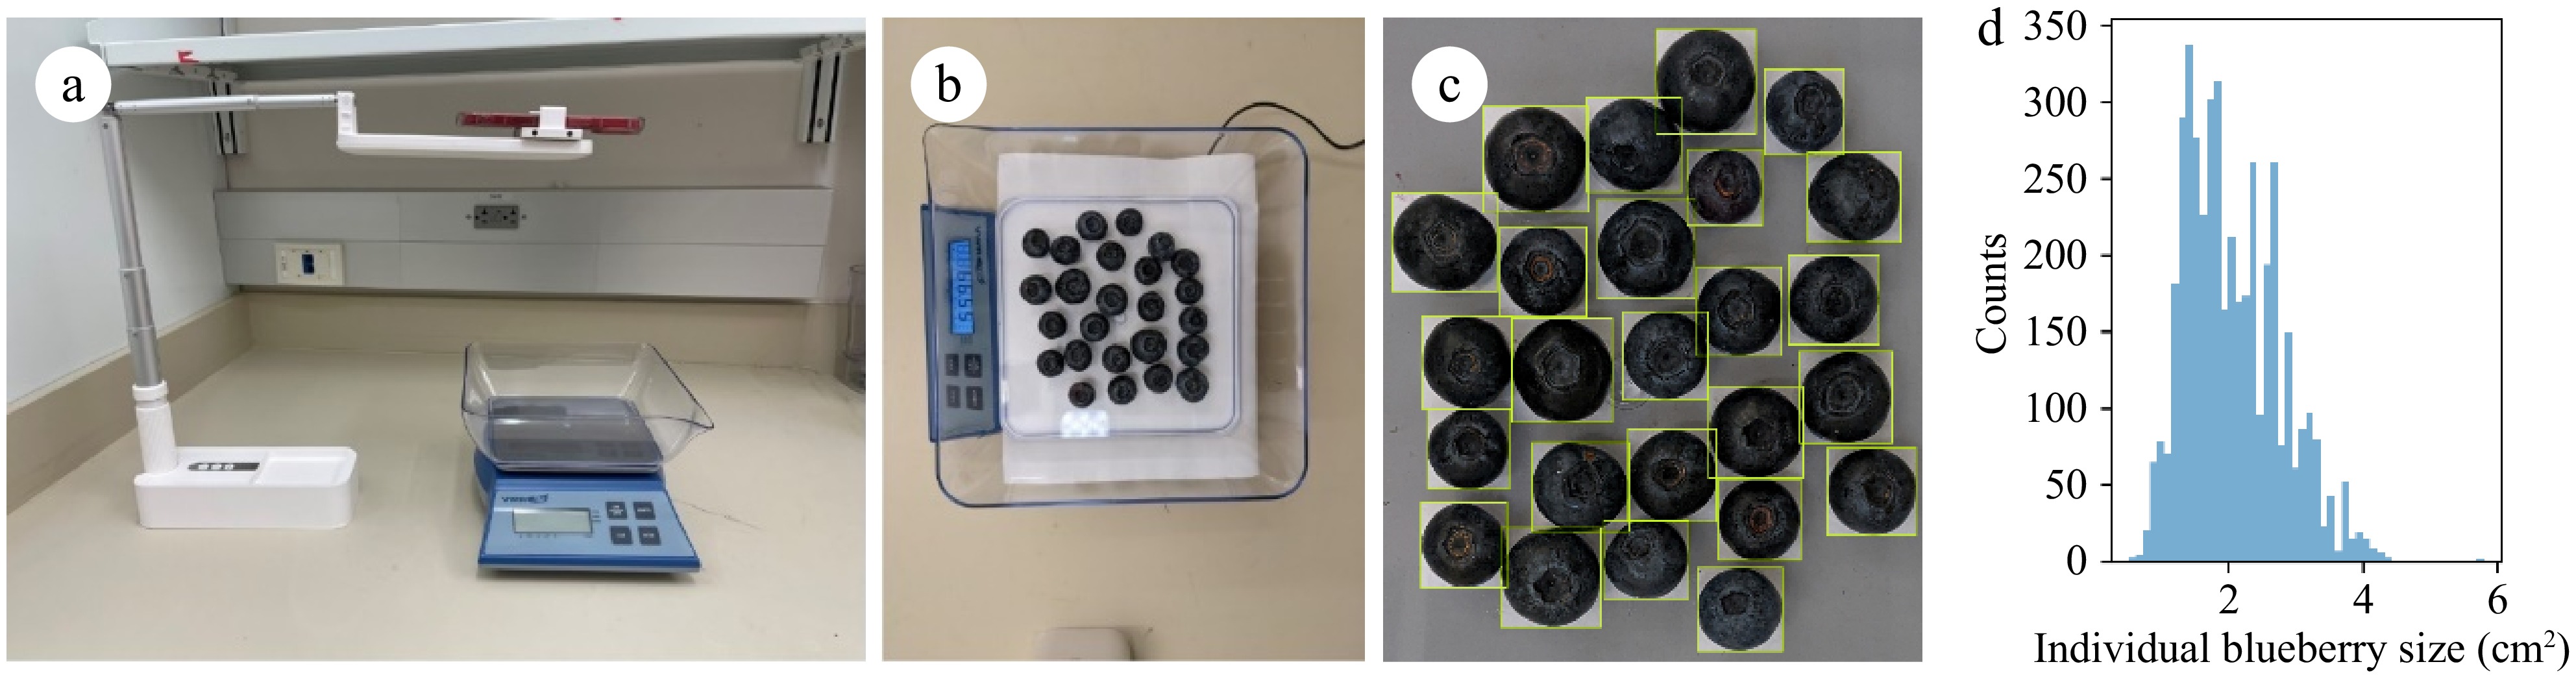
Figure 2.
Weight data collection: (a) setup of berry weight and image data collection; (b) image of blueberries from one sample; (c) zoomed-in image of manually annotated blueberries; (d) histogram of labeled individual blueberry sizes.
-
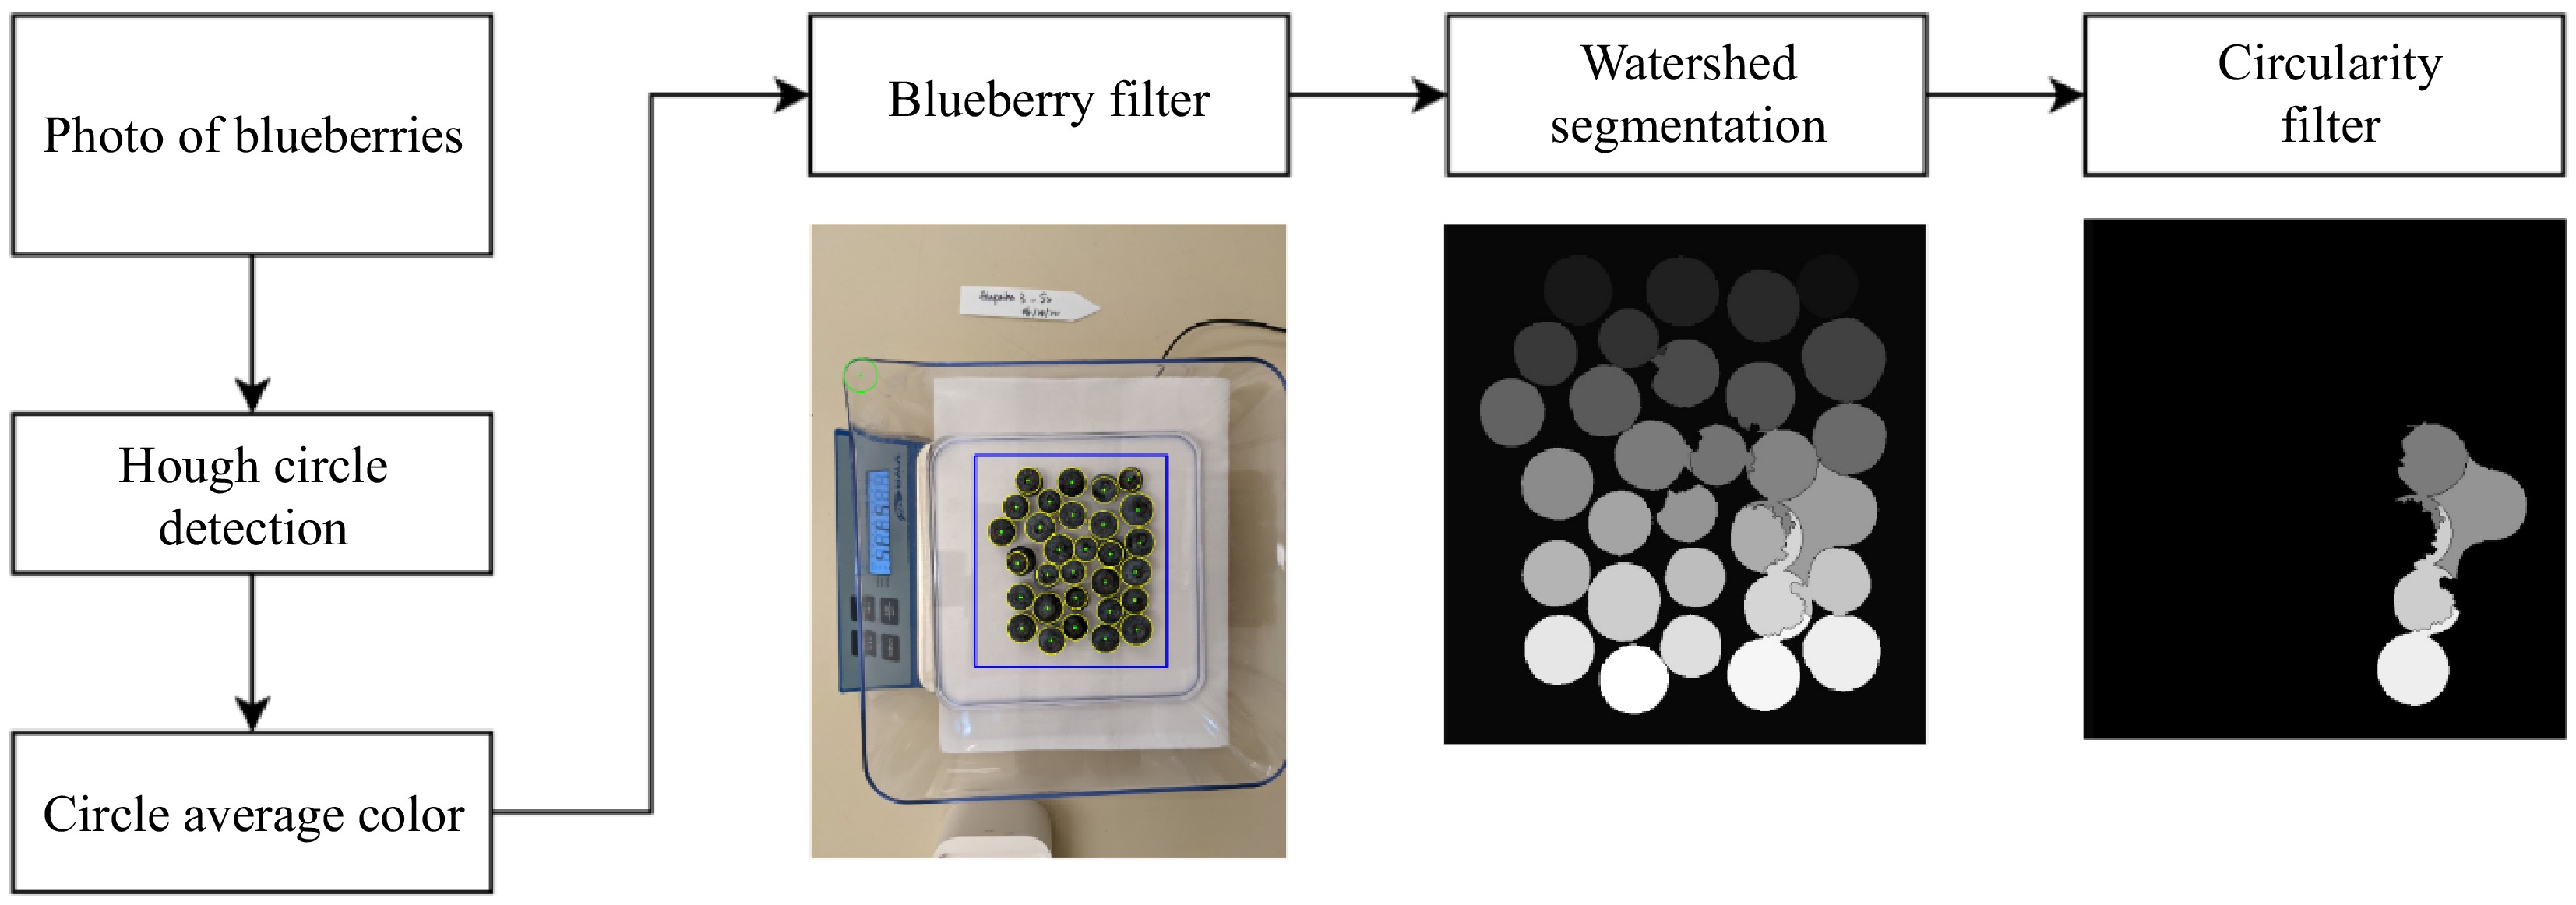
Figure 3.
Overview of the Hough Transform-based pipeline. After computing the average color of each Hough circle, the blueberry filter determines the count of blueberries (yellow circles) and their segmentation based on Watershed algorithms (middle). The right image shows the blueberries removed in average size estimation based on their segmentation circularity (not removed in counting).
-
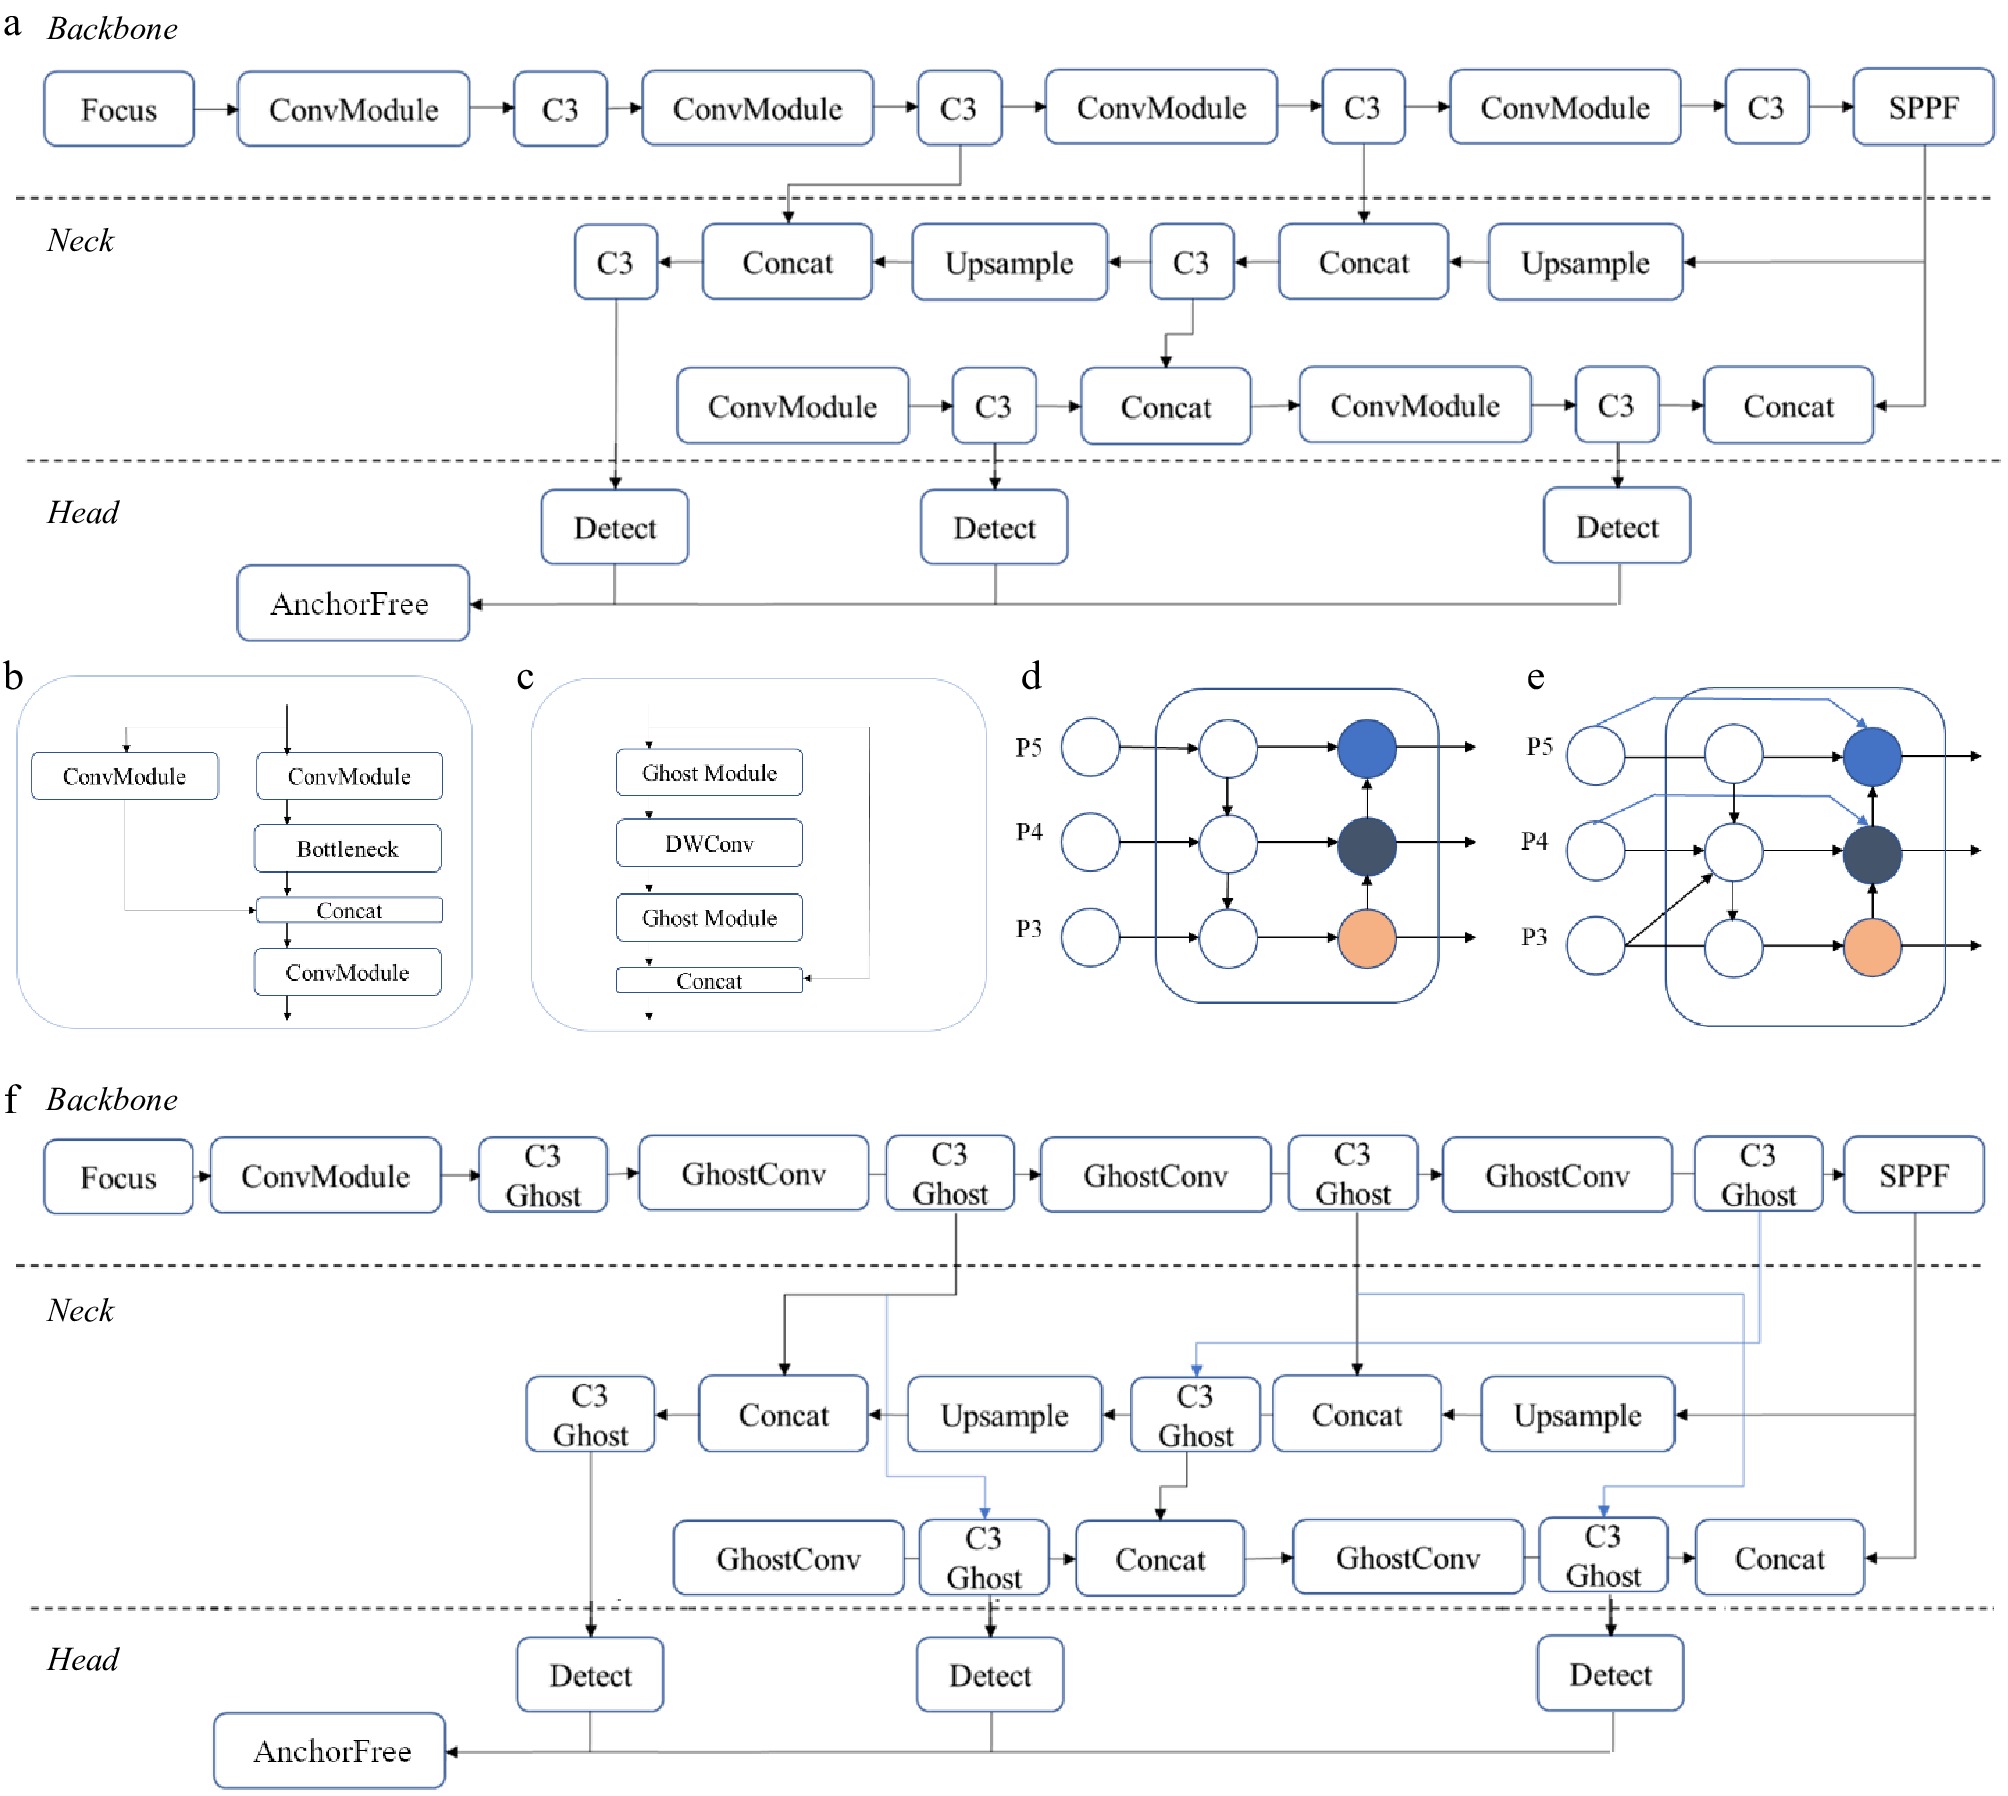
Figure 4.
YOLOv5 and key modules: a) YOLOv5 architecture b) C3 module; c) Ghost module; d) PANet neck as FPN (top-down path), and PAN (down-top path); e) BiFPN neck; f) modified YOLOv5 architecture.
-
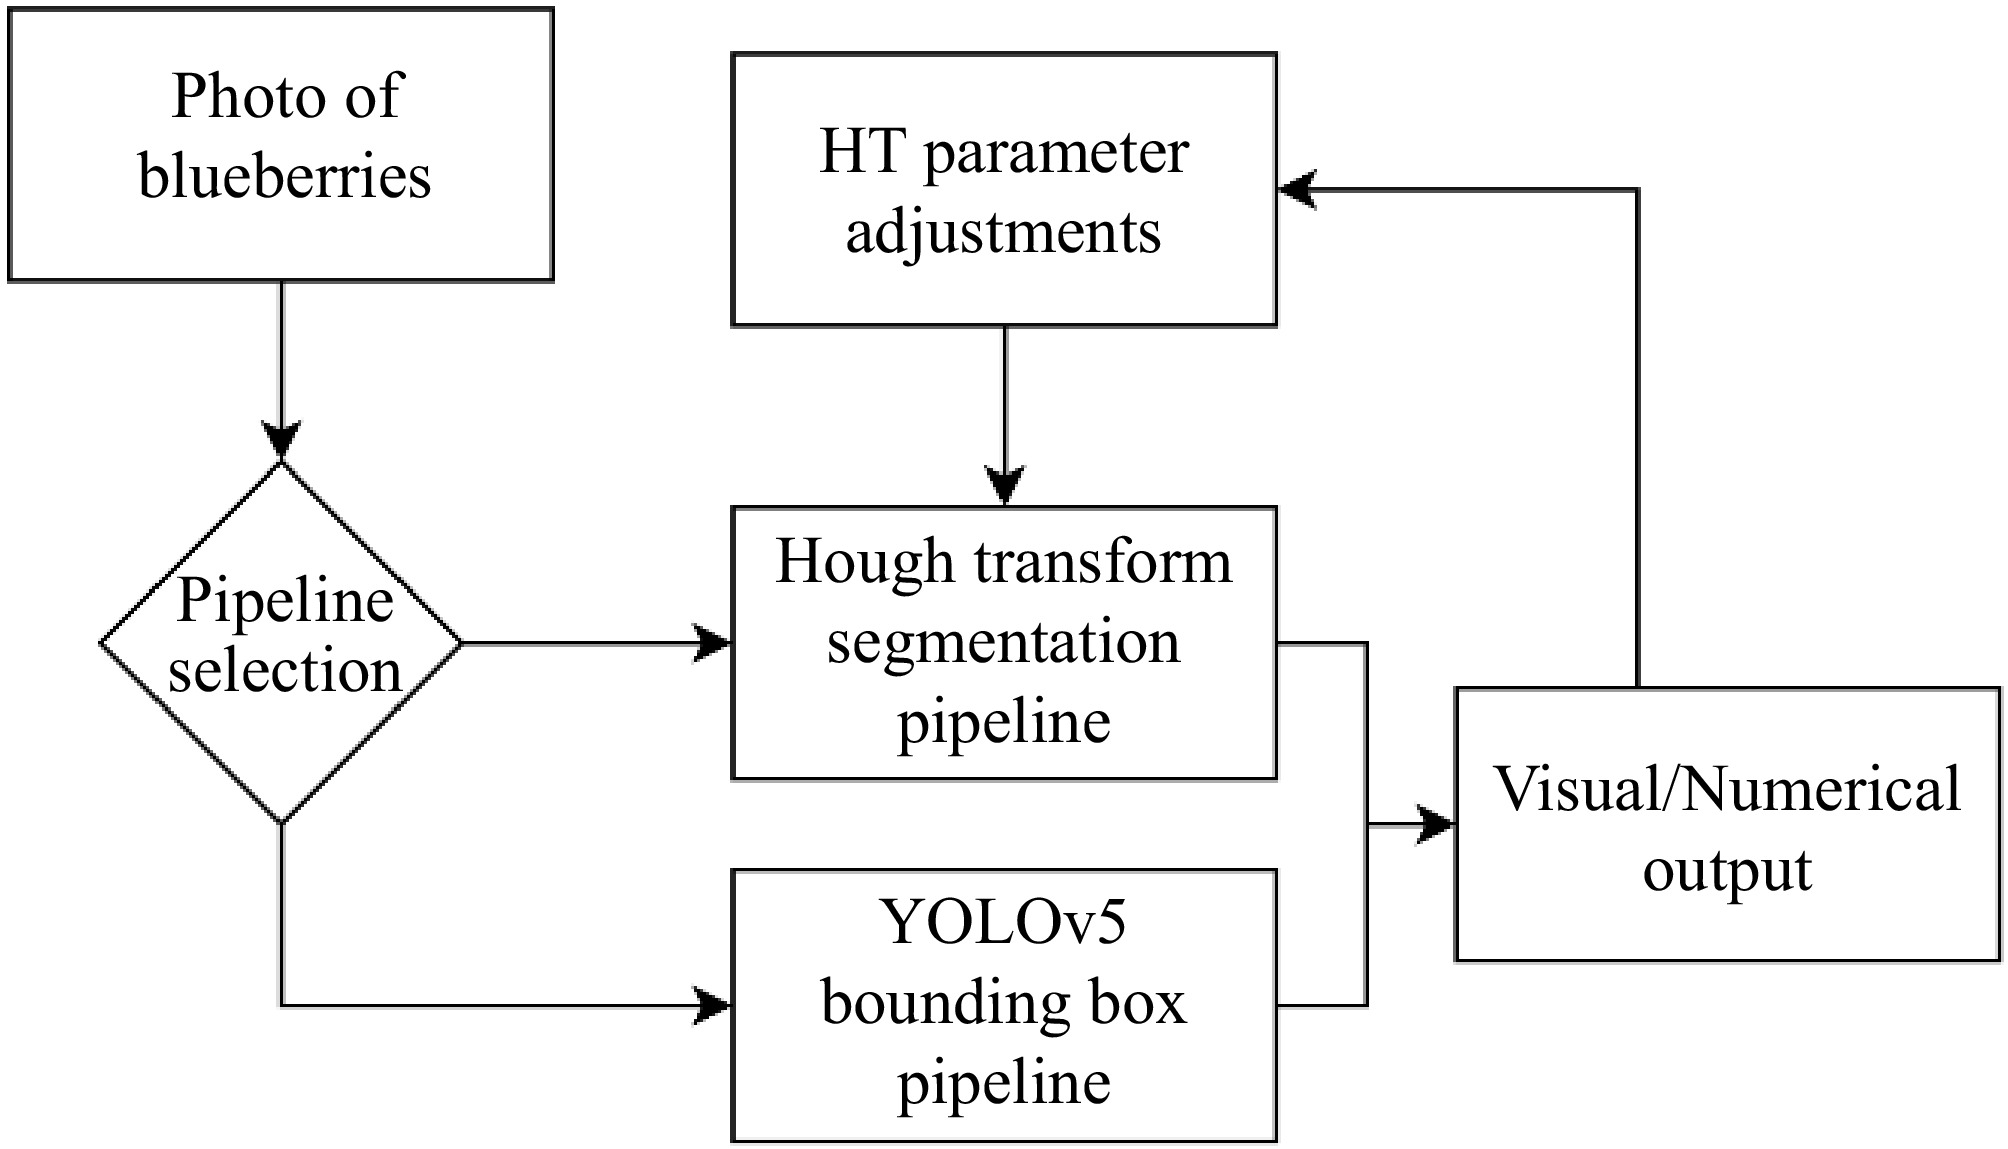
Figure 5.
Android application flowchart. The user captures an image from the camera, selects a pipeline and obtains the results in a feedback image and recorded CSV entry.
-
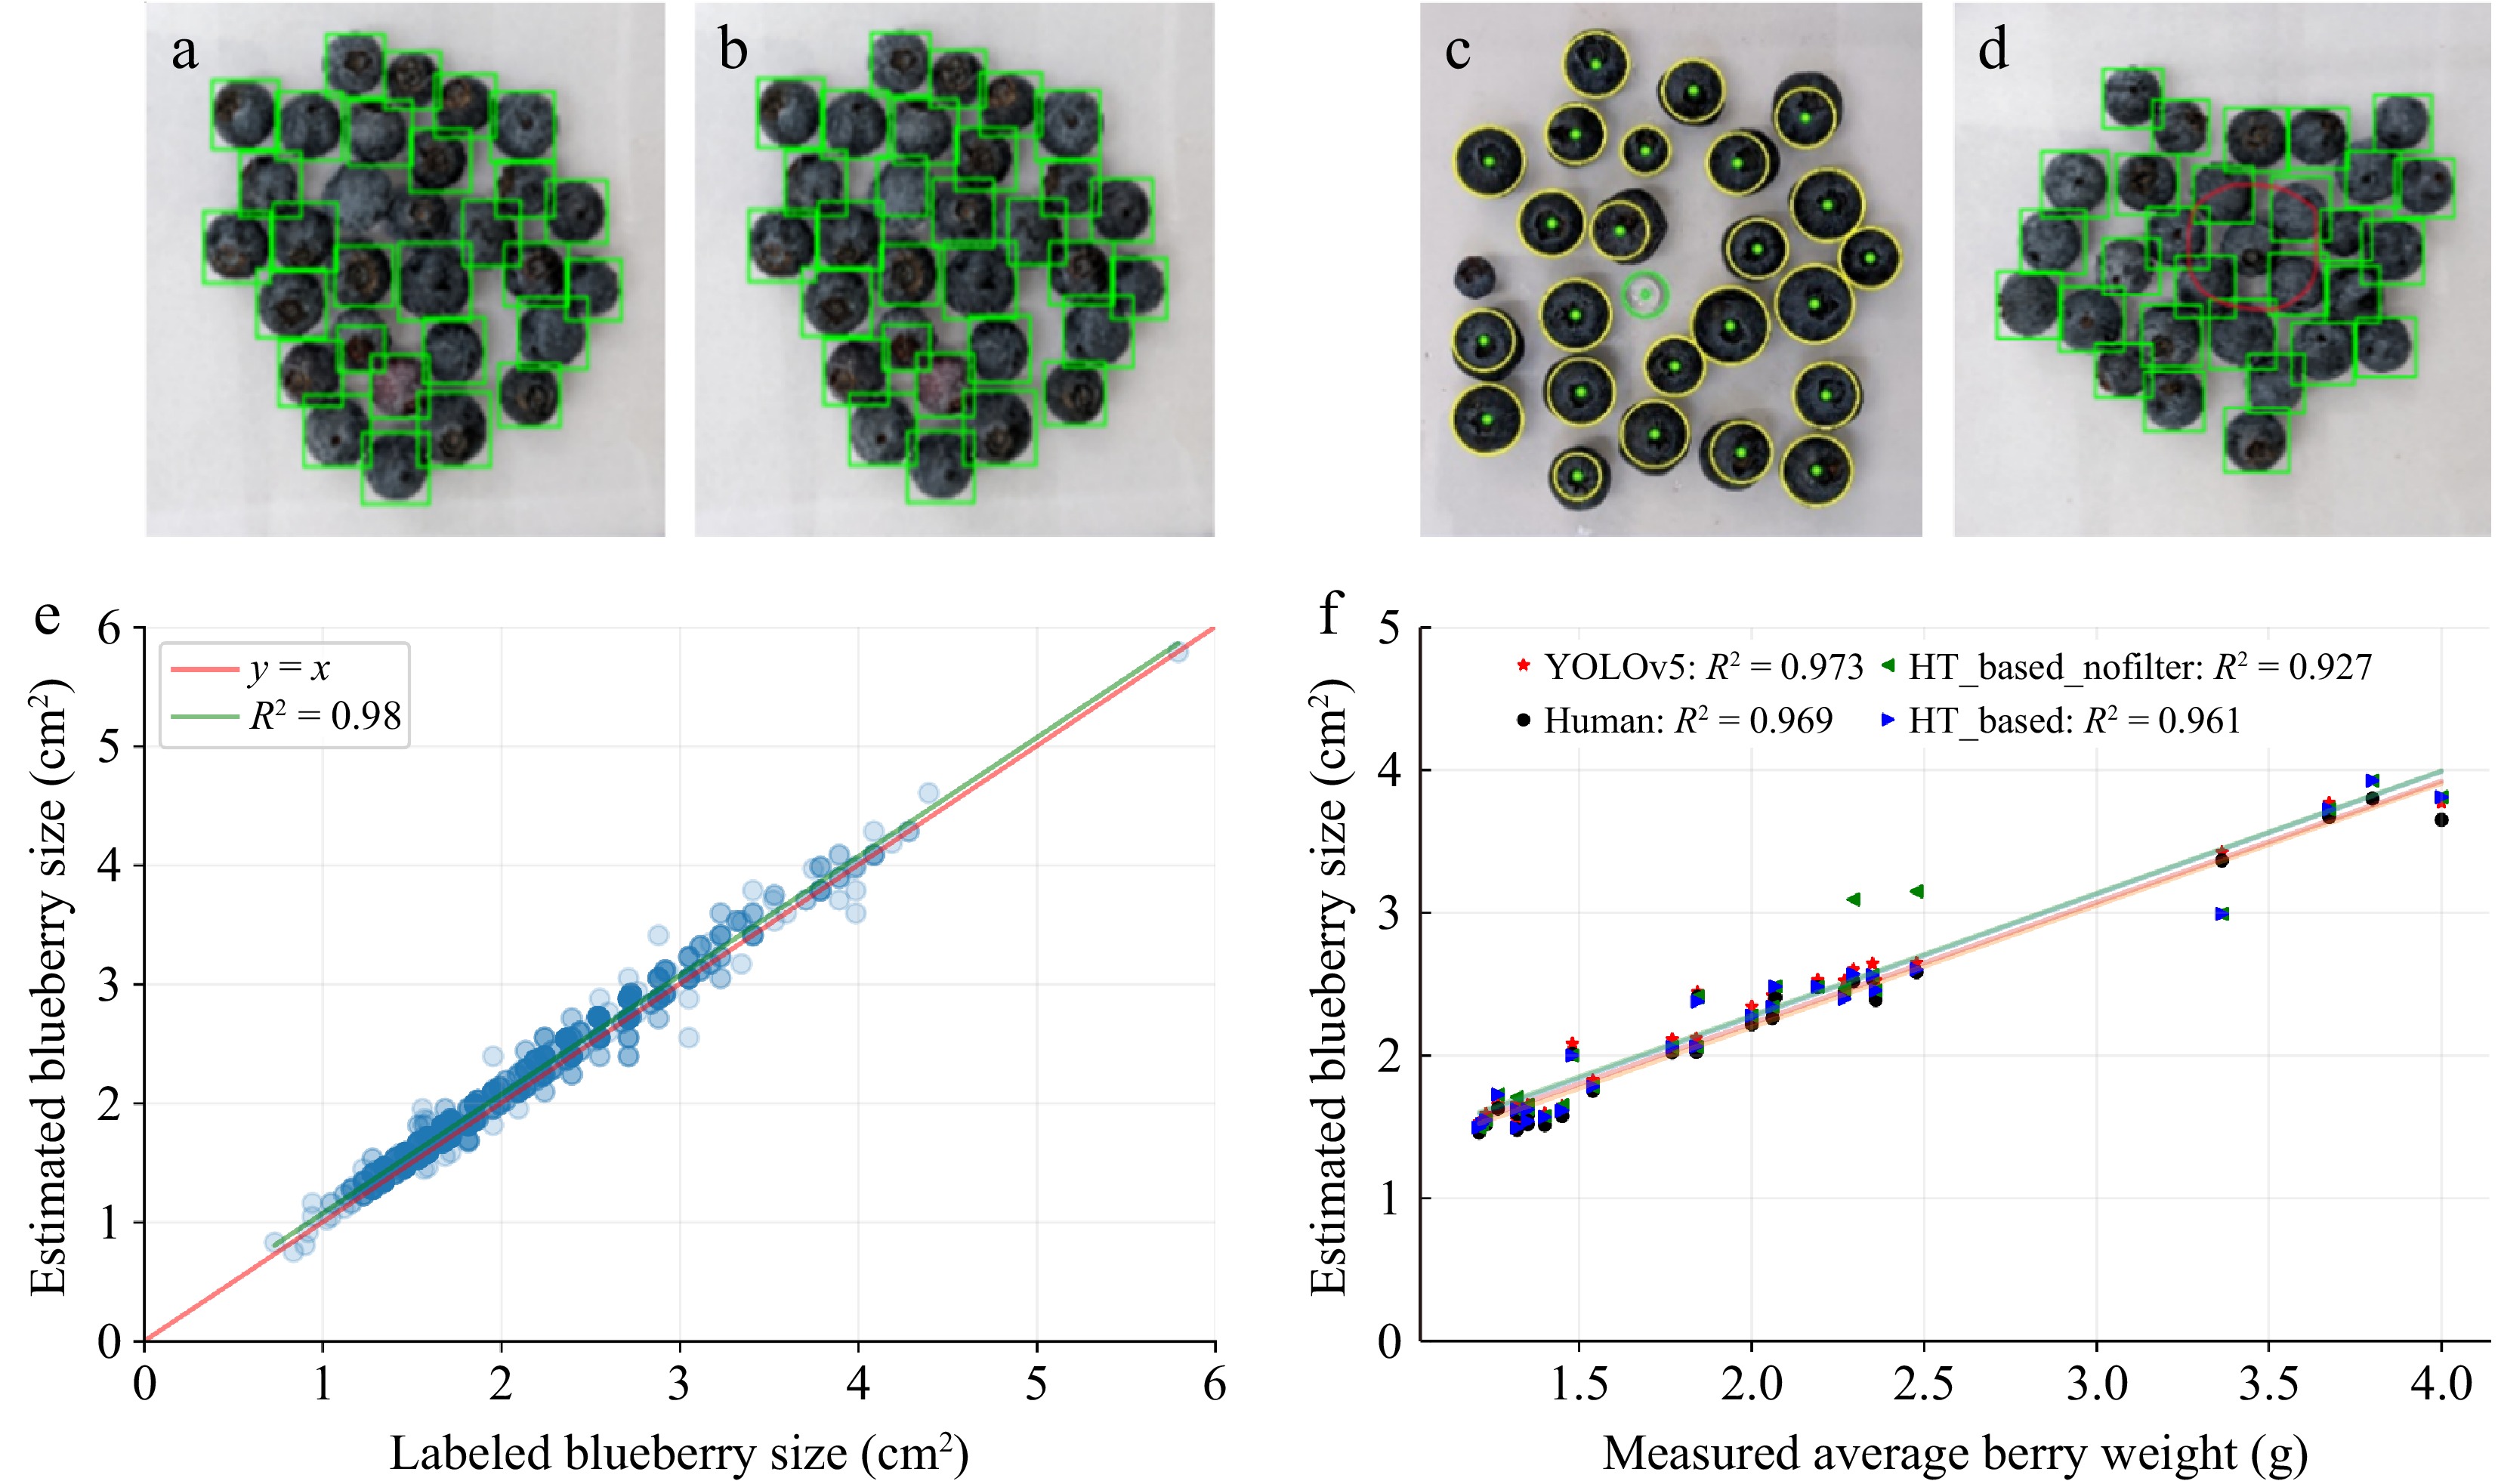
Figure 6.
Model performances in counting, size estimation, and weight estimation. (a), (b) confidence threshold miscounts for YOLOv5. (c), (d) Miscount examples from both methods. HT-based filtered the green circle but misses the left small blueberry. YOLOv5 failed to detect the red circled blueberry in cluster. (e) Comparison between individual blueberry size estimations by YOLOv5 and manually labeled size estimations for the test set. (f) The correlation between estimated average berry weight (g) and manually measured berry weight (g).
-
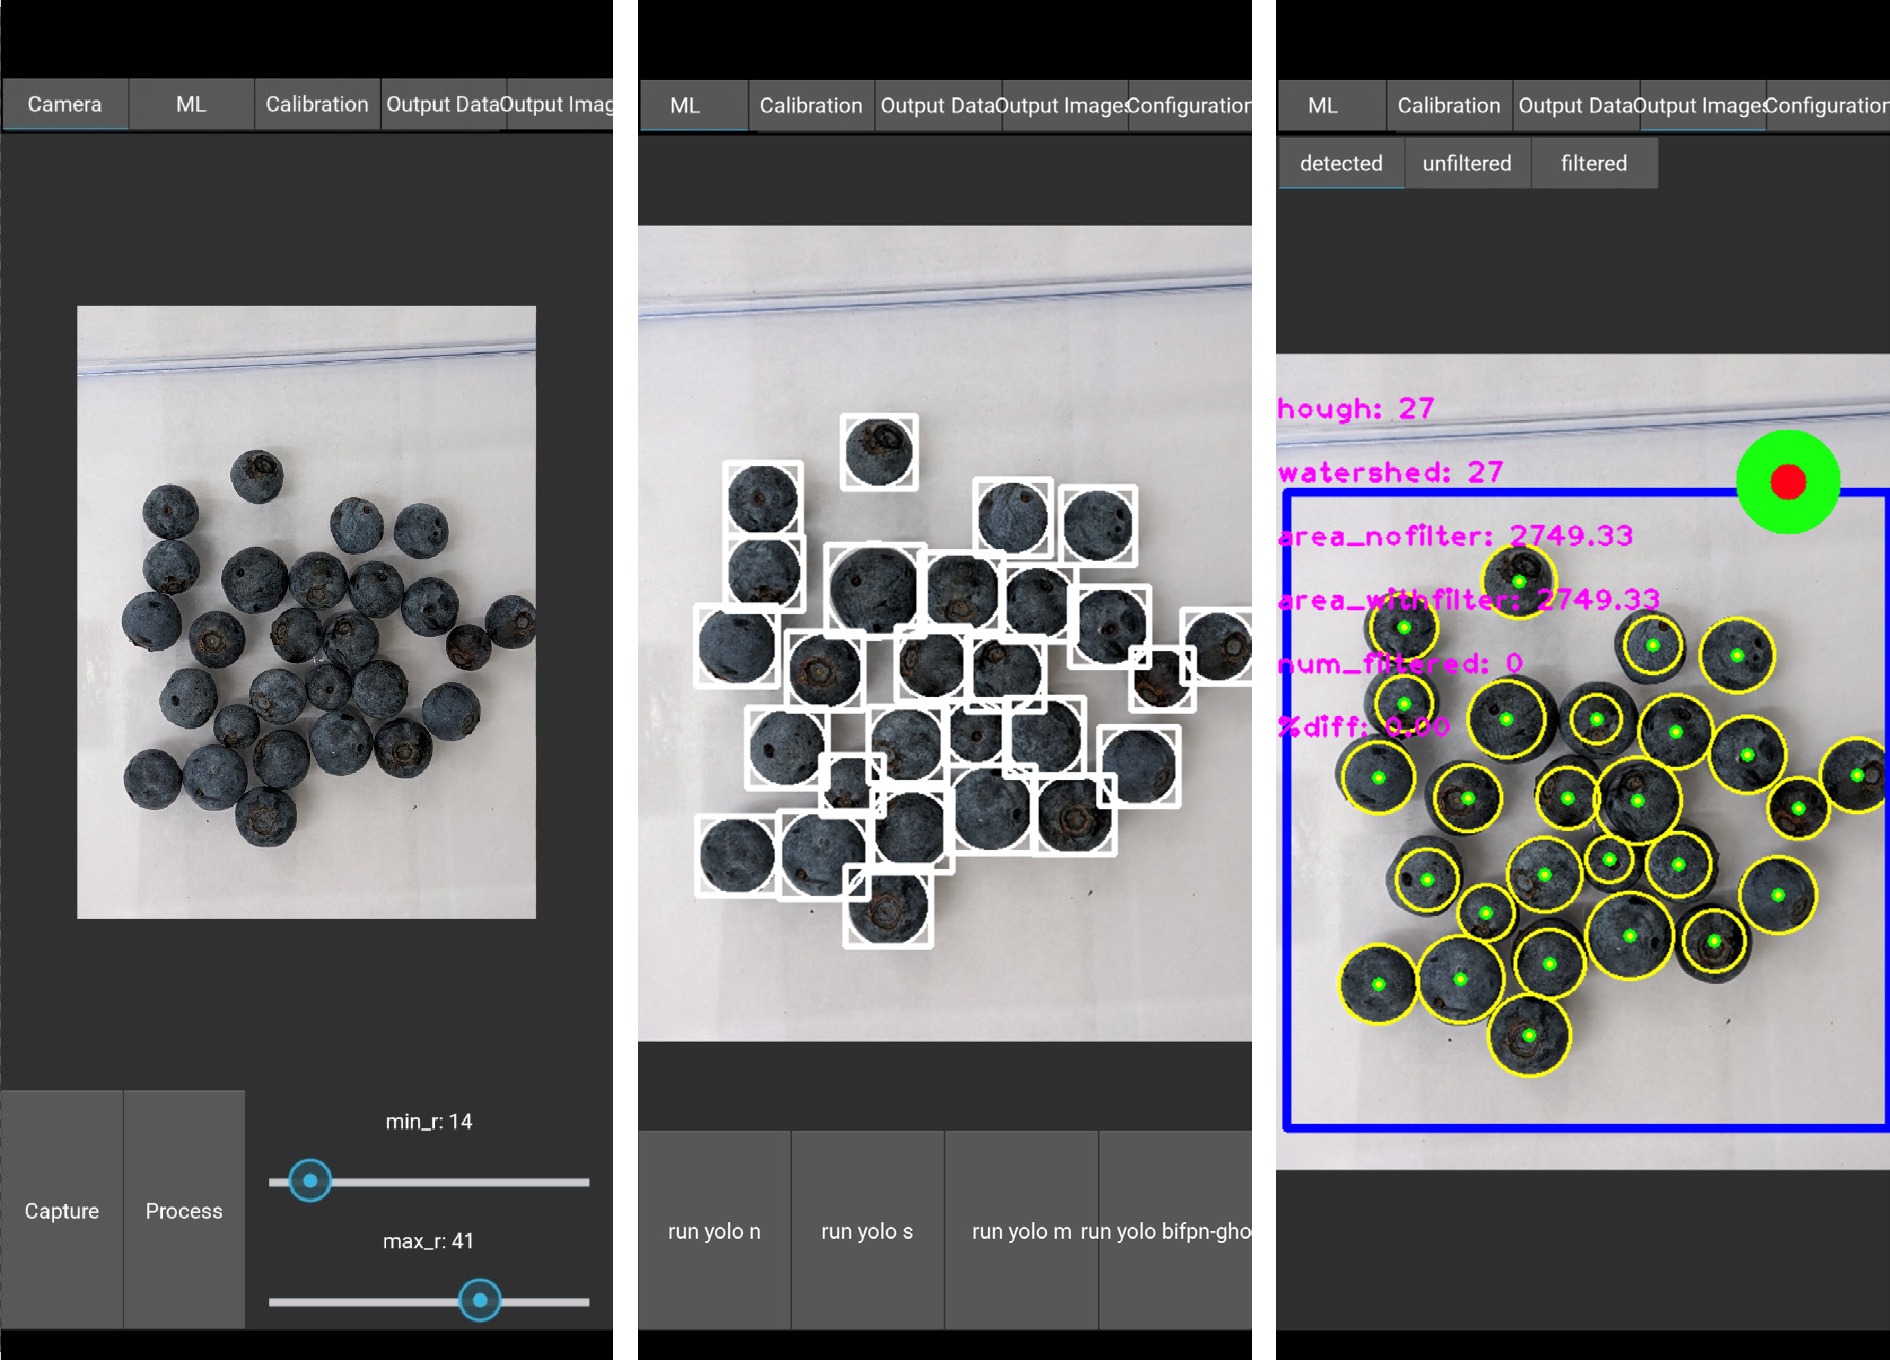
Figure 7.
Screenshots of the Android application in portrait mode, from left to right: the captured image with radius parameters, the YOLOv5-based detection, and the HT-based detection.
-
Model Parameters Inference time mAP50 mAP50-95 ×106 ms % % YOLOv5n 2.50 65.3 99.4 91.2 YOLOv5s 9.11 203.4 99.4 92.7 YOLOv5s-A 5.77 136.0 99.4 91.6 YOLOv5s-B 9.18 202.6 99.4 92.9 YOLOv5s-C 5.84 143.5 99.5 91.9 YOLOv5m 25.0 531.8 99.3 93.5 YOLOv8n 3.00 71.9 99.4 91.8 YOLOv8s 11.1 206.5 99.4 92.7 YOLOv8m 25.8 571.0 99.4 92.9 YOLOv11n 2.58 62.9 99.4 91.0 YOLOv11s 9.41 190.5 99.4 92.7 YOLOv11m 20.1 549.7 99.4 93.2 Table 1.
Comparison of the model performance on the test dataset. All models were converted to TensorFlow Lite with fp16 quantization.
Figures
(7)
Tables
(1)