-
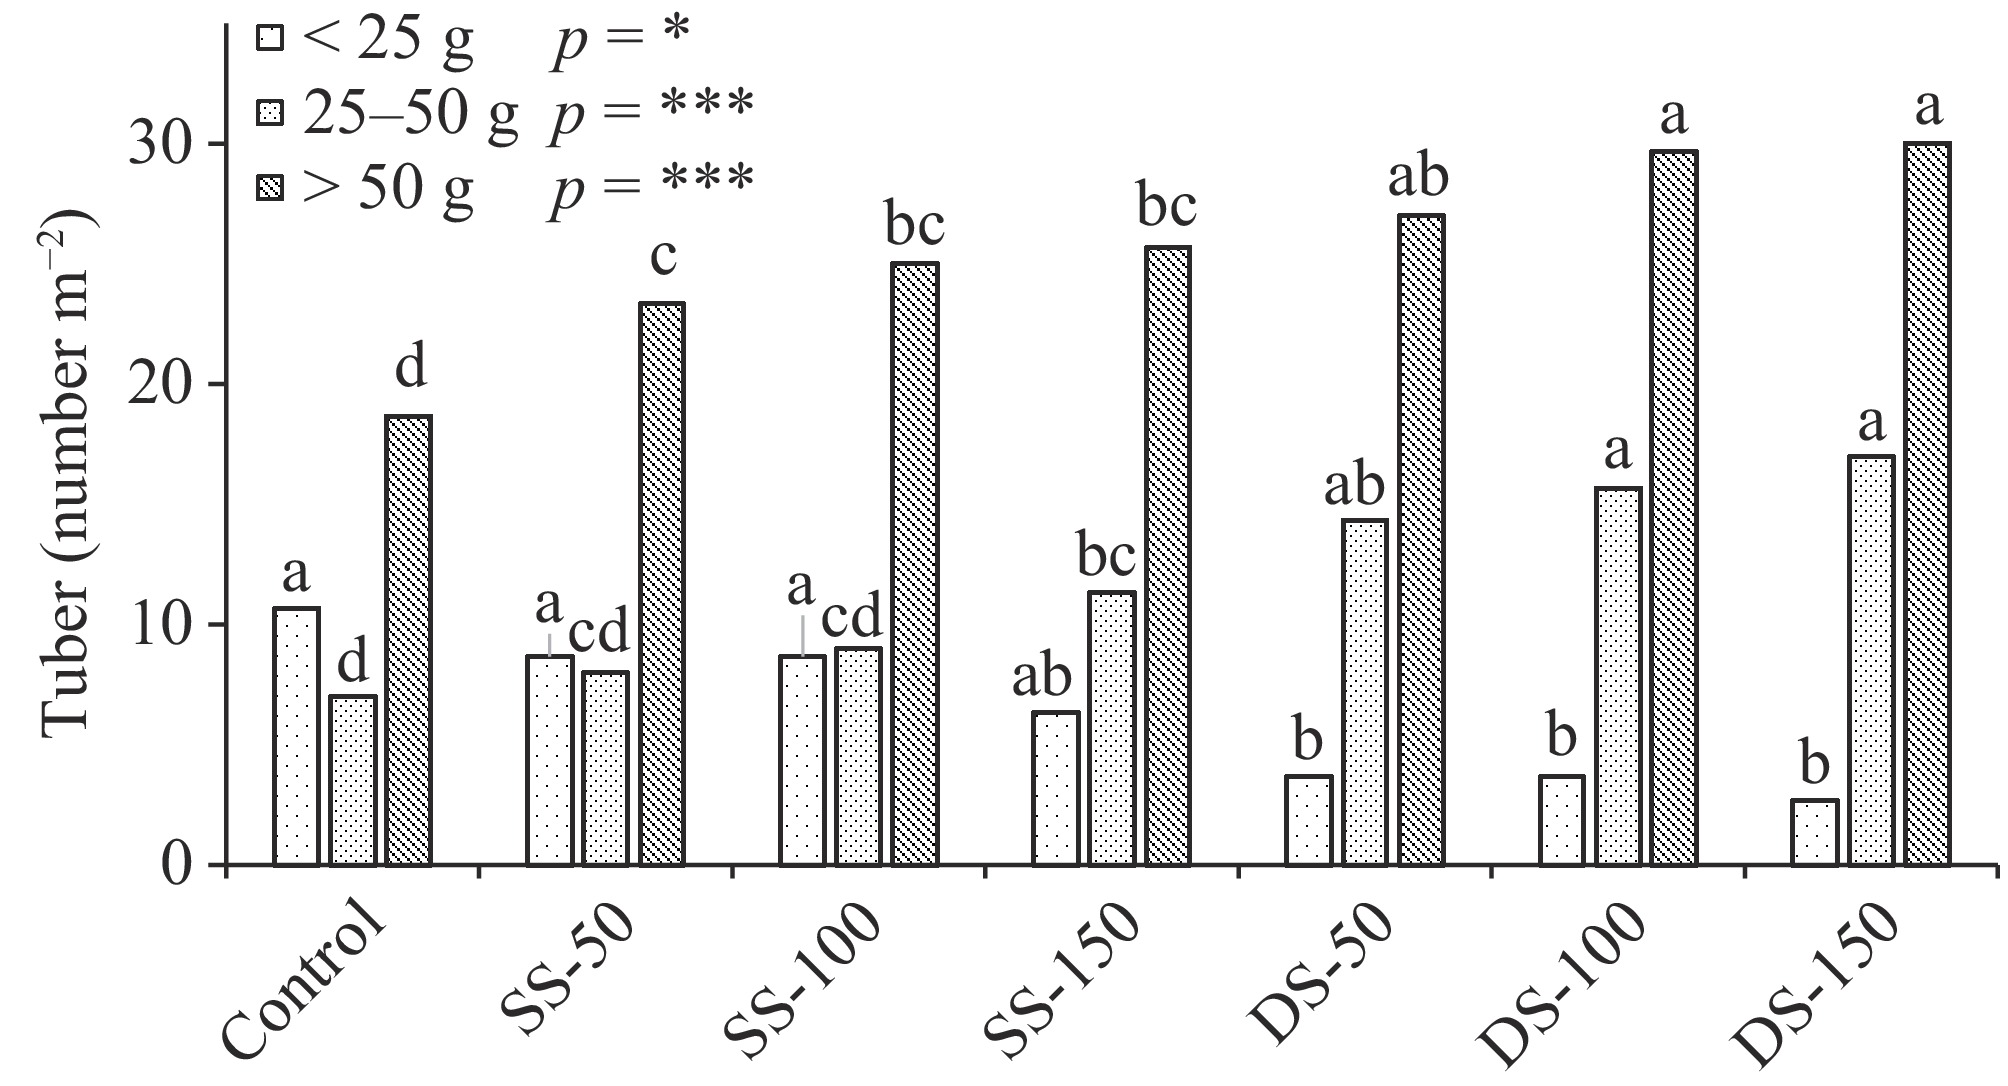
Figure 1.
Categorical tuber number per square meter as influenced by different concentrations of Zn-EDTA at Dunai, Dolpa, Nepal, 2022. Different alphabets in lowercase indicate significant treatment mean difference at p ≤ 0.05. *, ** and *** indicate significant results at 5%, 1% and 0.1% levels of significance respectively.
-
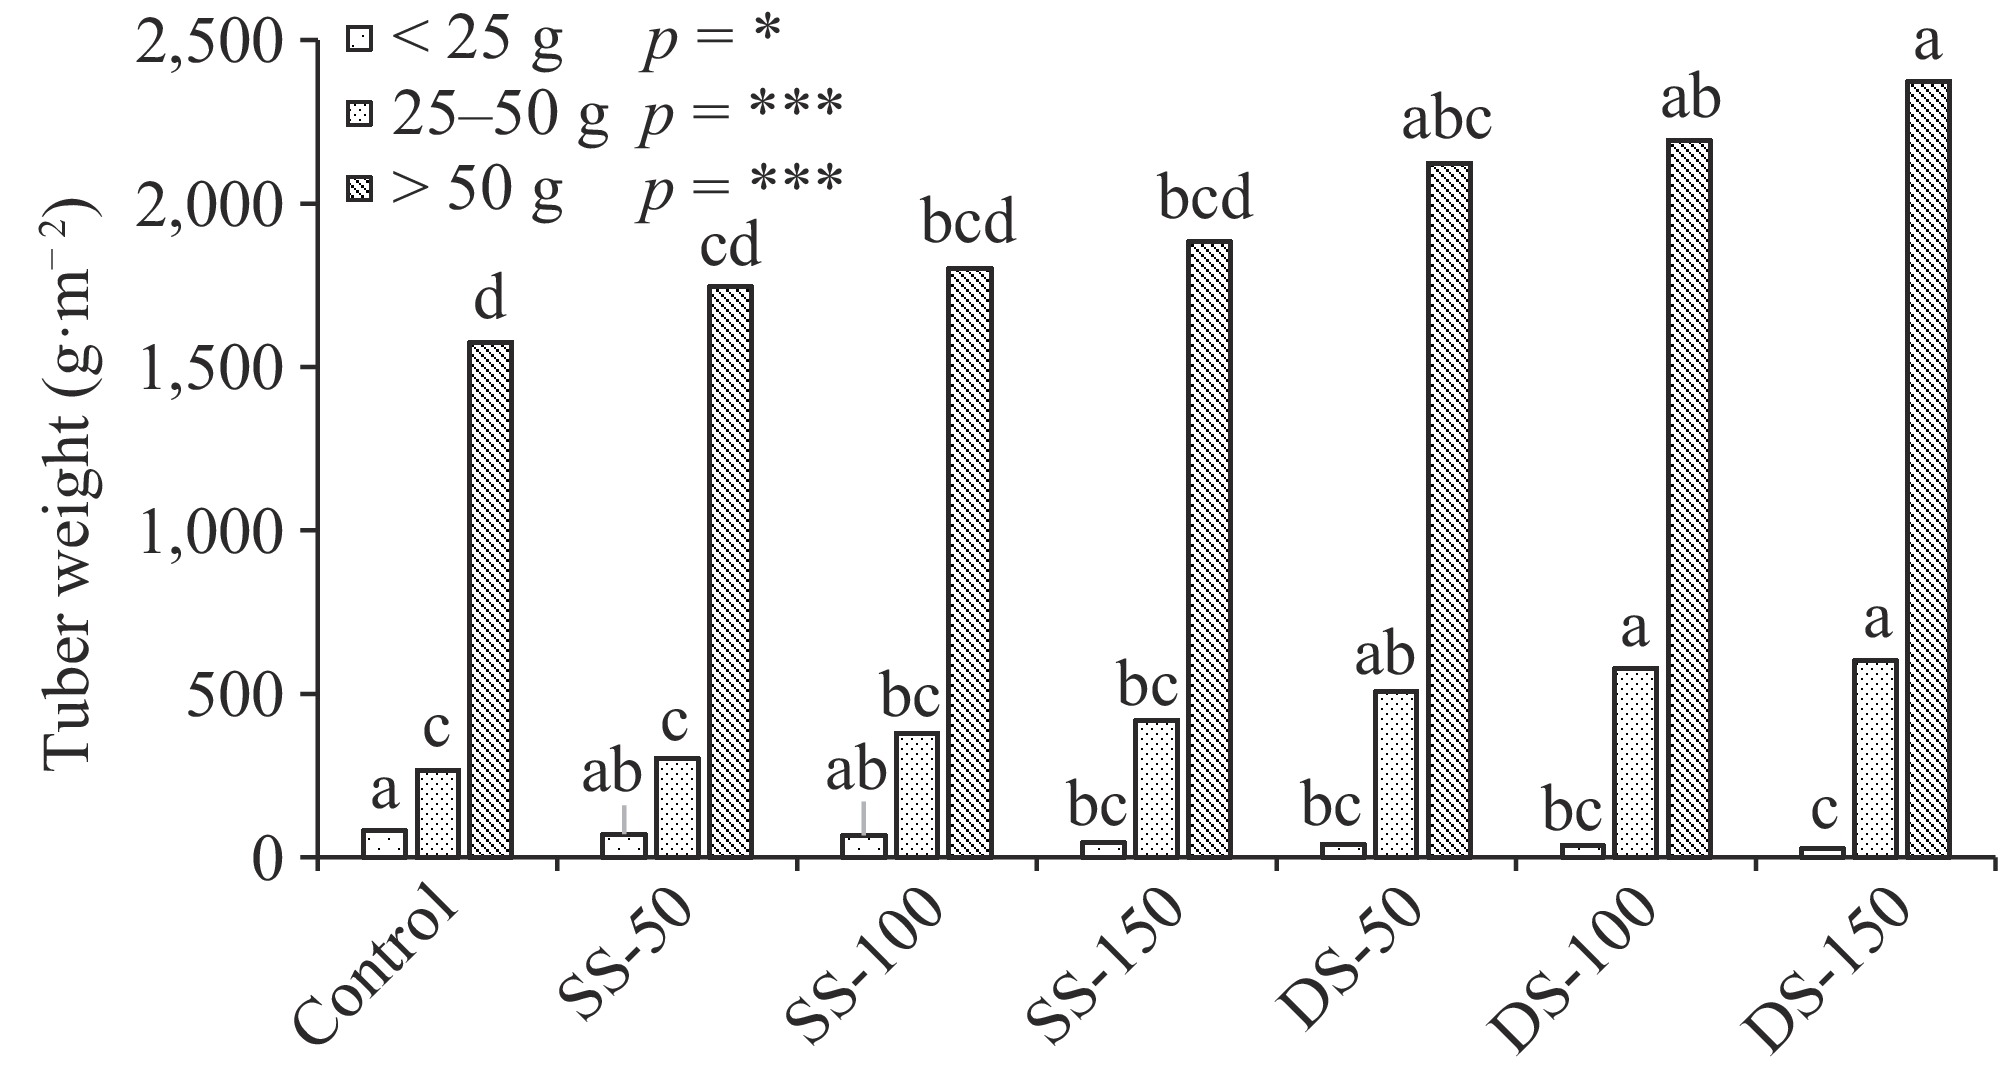
Figure 2.
Categorical tuber weight of potato per square meter as influenced by different concentrations of Zn-EDTA at Dunai, Dolpa, Nepal, 2022. Different alphabets in lowercase indicate significant treatment mean difference at p ≤ 0.05. *, ** and *** indicate significant results at 5%, 1% and 0.1% levels of significance respectively.
-
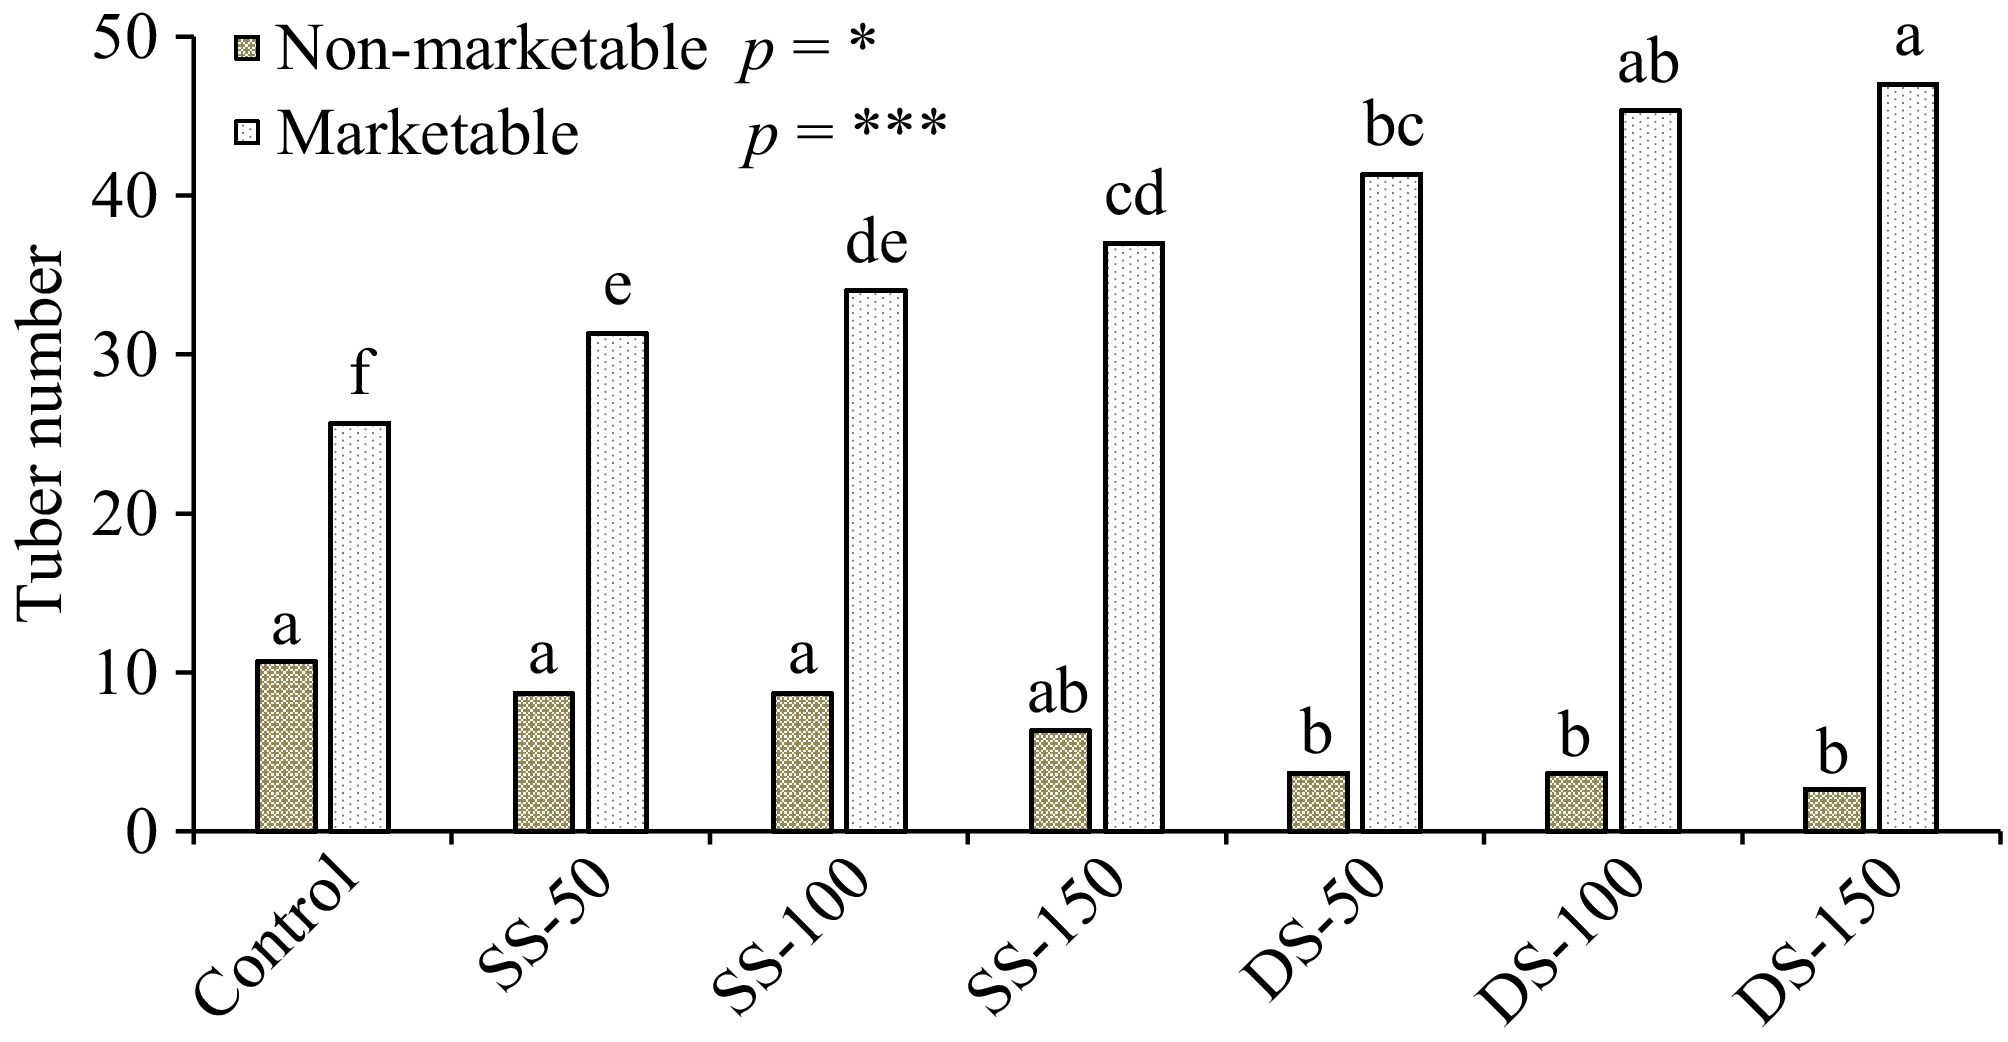
Figure 3.
Total tuber number based on marketability as influenced by different concentrations of Zn-EDTA at Dunai, Dolpa, Nepal, 2022. Different alphabets in lowercase indicate significant treatment mean difference at p ≤ 0.05. *, ** and *** indicate significant results at 5%, 1% and 0.1% levels of significance respectively.
-
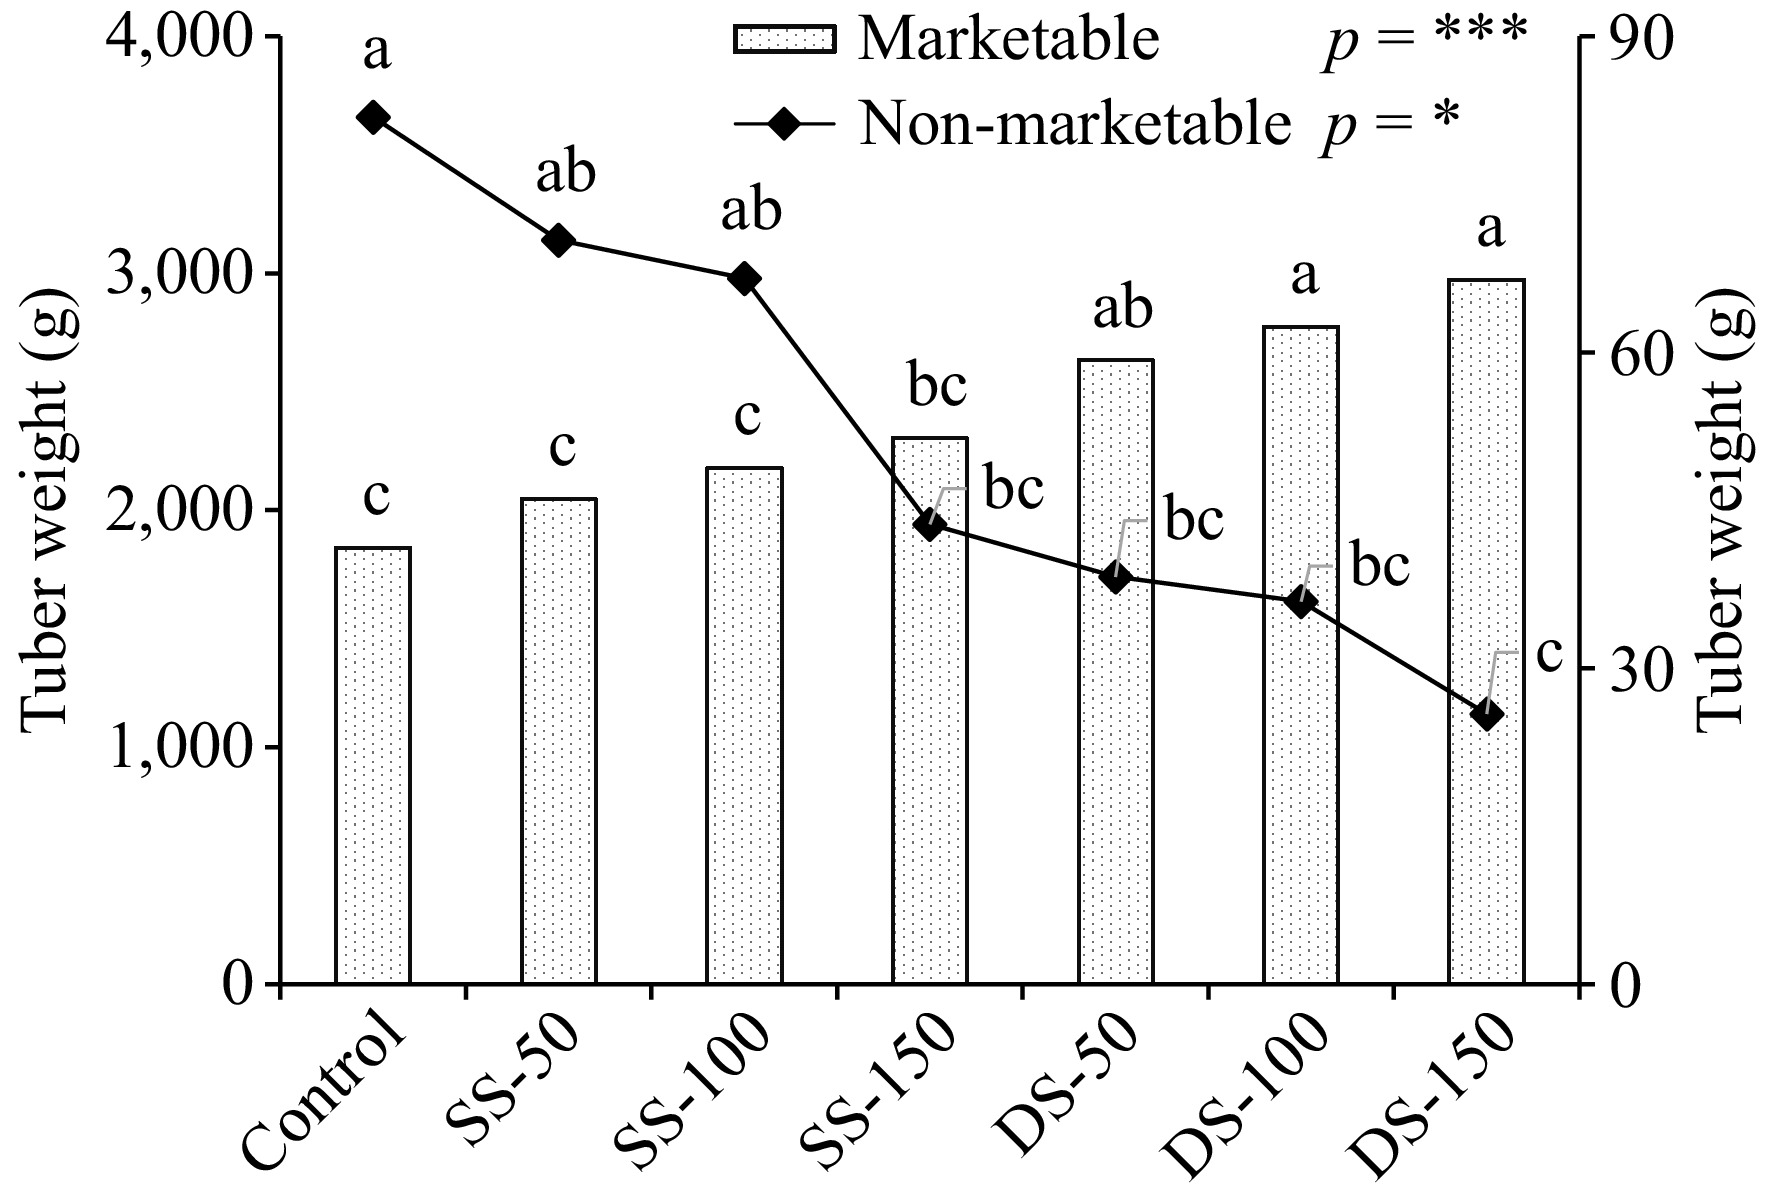
Figure 4.
Total tuber weight based on marketability as influenced by different concentrations of Zn-EDTA at Dunai, Dolpa, Nepal, 2022. Different alphabets in lowercase indicate significant treatment mean difference at p ≤ 0.05. *, ** and *** indicate significant results at 5%, 1% and 0.1% levels of significance respectively.
-
Treatments (ppm) Plant height (cm) Stem diameter (cm) Leaf number Canopy diameter (cm) 75 DAP 95 DAP 75 DAP 95 DAP 75 DAP 95 DAP 75 DAP 95 DAP Control 19.6d# 41.8c 1.2d 1.3d 24.0c 37.0d 36.9c 53.7e SS-50 22.3cd 43.4c 1.2d 1.3d 26.0bc 45.0cd 41.4bc 56.2de SS-100 23.8bc 44.0c 1.3cd 1.4cd 26.0bc 45.0cd 41.4bc 60.1cd SS-150 24.1bc 46.1bc 1.3bc 1.5bc 26.0bc 49.0bc 48.0ab 62.5cd DS-50 24.2bc 52.5ab 1.3bc 1.5ab 30.0ab 55.0ab 50.0a 66.2bc DS-100 27.0ab 54.0a 1.4ab 1.6ab 33.0a 58.0ab 52.3a 69.0ab DS-150 27.8a 58.3a 1.5a 1.6a 34.0a 63.0a 54.2a 72.9a p-value ** ** *** *** ** *** ** *** # Means followed by a different letter(s) within a column are significantly different from each other at p ≤ 0.05. DAP indicates days after planting. *, **, and *** indicate significant results at 5%, 1%, and 0.1% levels of significance respectively. Table 1.
Effect of different concentrations of foliar application of Zn-EDTA in potato height, stem diameter, leaf number, and canopy diameter at 75 and 95 DAP in potatoes in Dolpa, Nepal in 2022.
-
Treatments (ppm) Tuber diameter Tuber number per square meter Individual tuber weight (g) Tuber yield (t·ha−1) Control 1.11d# 35.0d 58.1a 19.26c SS-50 1.17cd 40.0c 47.5a 21.19c SS-100 1.20cd 42.7bc 61.6a 22.46bc SS-150 1.26bc 43.3bc 53.6a 23.47bc DS-50 1.34ab 45.0b 48.8a 26.70ab DS-100 1.40ab 49.7a 51.3a 28.09a DS-150 1.44a 51.0a 69.6a 29.99a p-value *** *** NS ** # Means followed by a different letter(s) within a column are significantly different from each other at p ≤ 0.05. DAP indicates days after planting. *, **, and *** indicate significant results at 5%, 1%, and 0.1% levels of significance respectively. NS, not significant. Table 2.
Yield and yield attributes of potato as influenced by different concentrations of Zn-EDTA in Dolpa, Nepal in 2022.
-
Treatments (ppm) Cost of cultivation (USD ${\$} $ Gross income (USD ${\$} $ Net income (USD ${\$} $ BC ratio Control 1,654.76 7,237.17c# 5,582.40c 3.50c SS-50 1,660.40 7,965.02c 6,304.62c 3.83c SS-100 1,666.04 8,442.32bc 6,776.28bc 4.05bc SS-150 1,671.67 8,819.40bc 7,147.72bc 4.22bc DS-50 1,666.04 1,0034.57ab 8,368.53ab 4.81ab DS-100 1,677.31 1,0556.97a 8,879.66a 5.03a DS-150 1,688.59 11,272.29a 9,583.70a 5.34a p-value ** ** ** # Means followed by different letter(s) within a column are significantly different from each other at p ≤ 0.05. DAP indicates Days after planting. *, **, and *** indicate significant results at 5%, 1%, and 0.1% levels of significance respectively. Table 3.
Economic analysis of potato production (USD
${\$} $
Figures
(4)
Tables
(3)