-
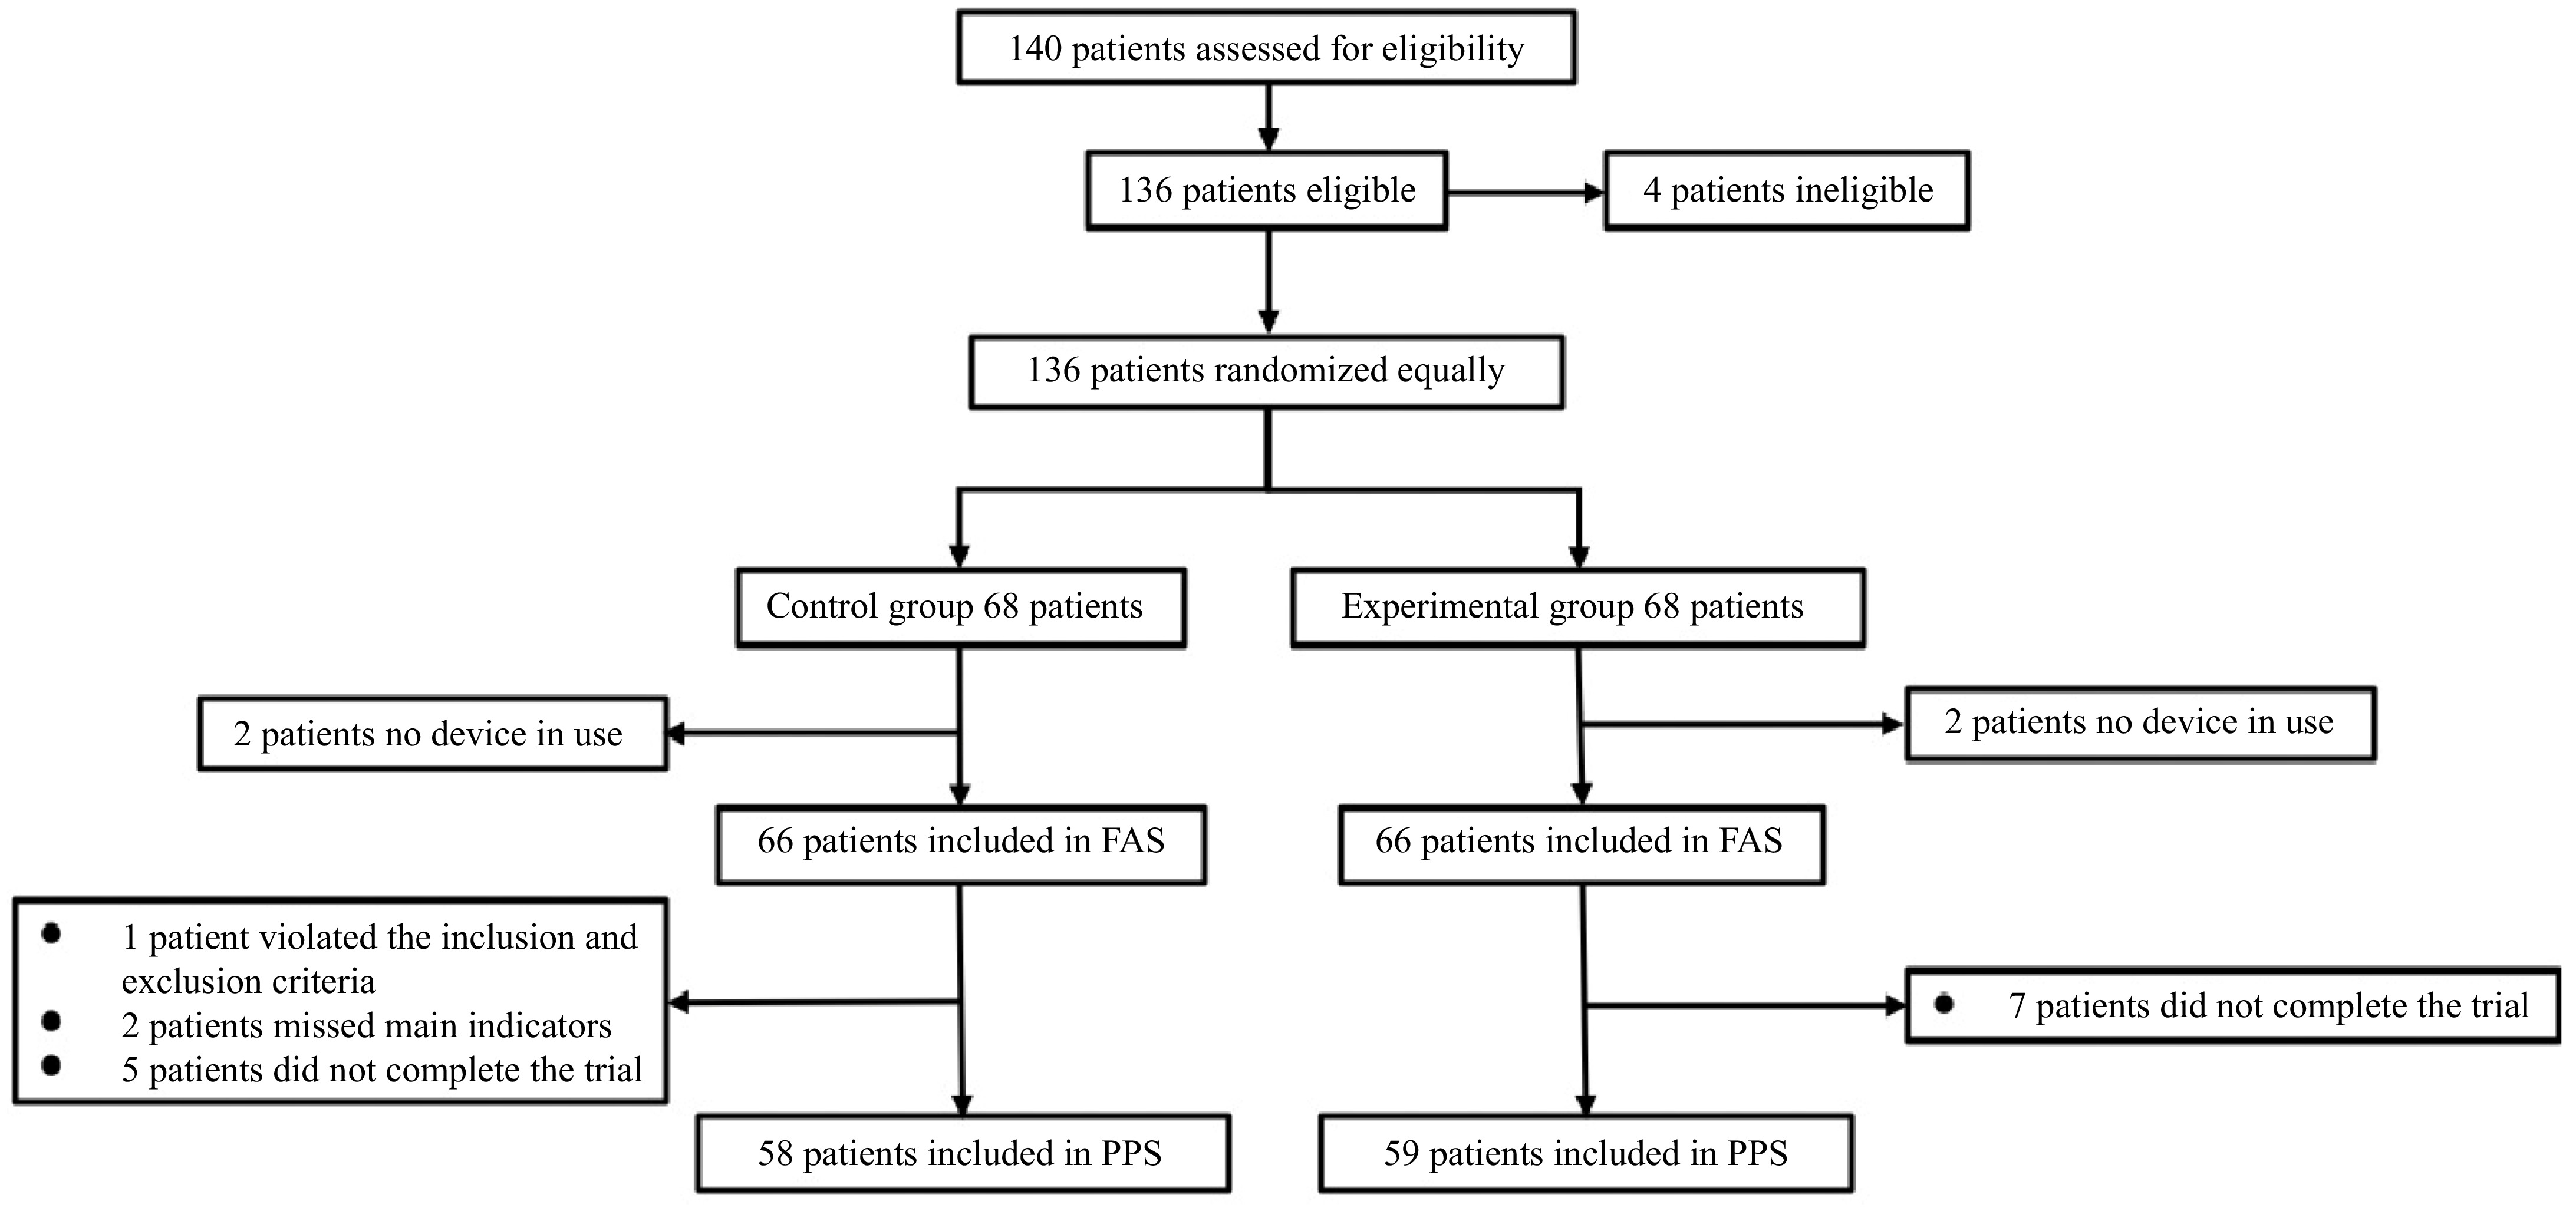
Figure 1.
Study flow chart.
-
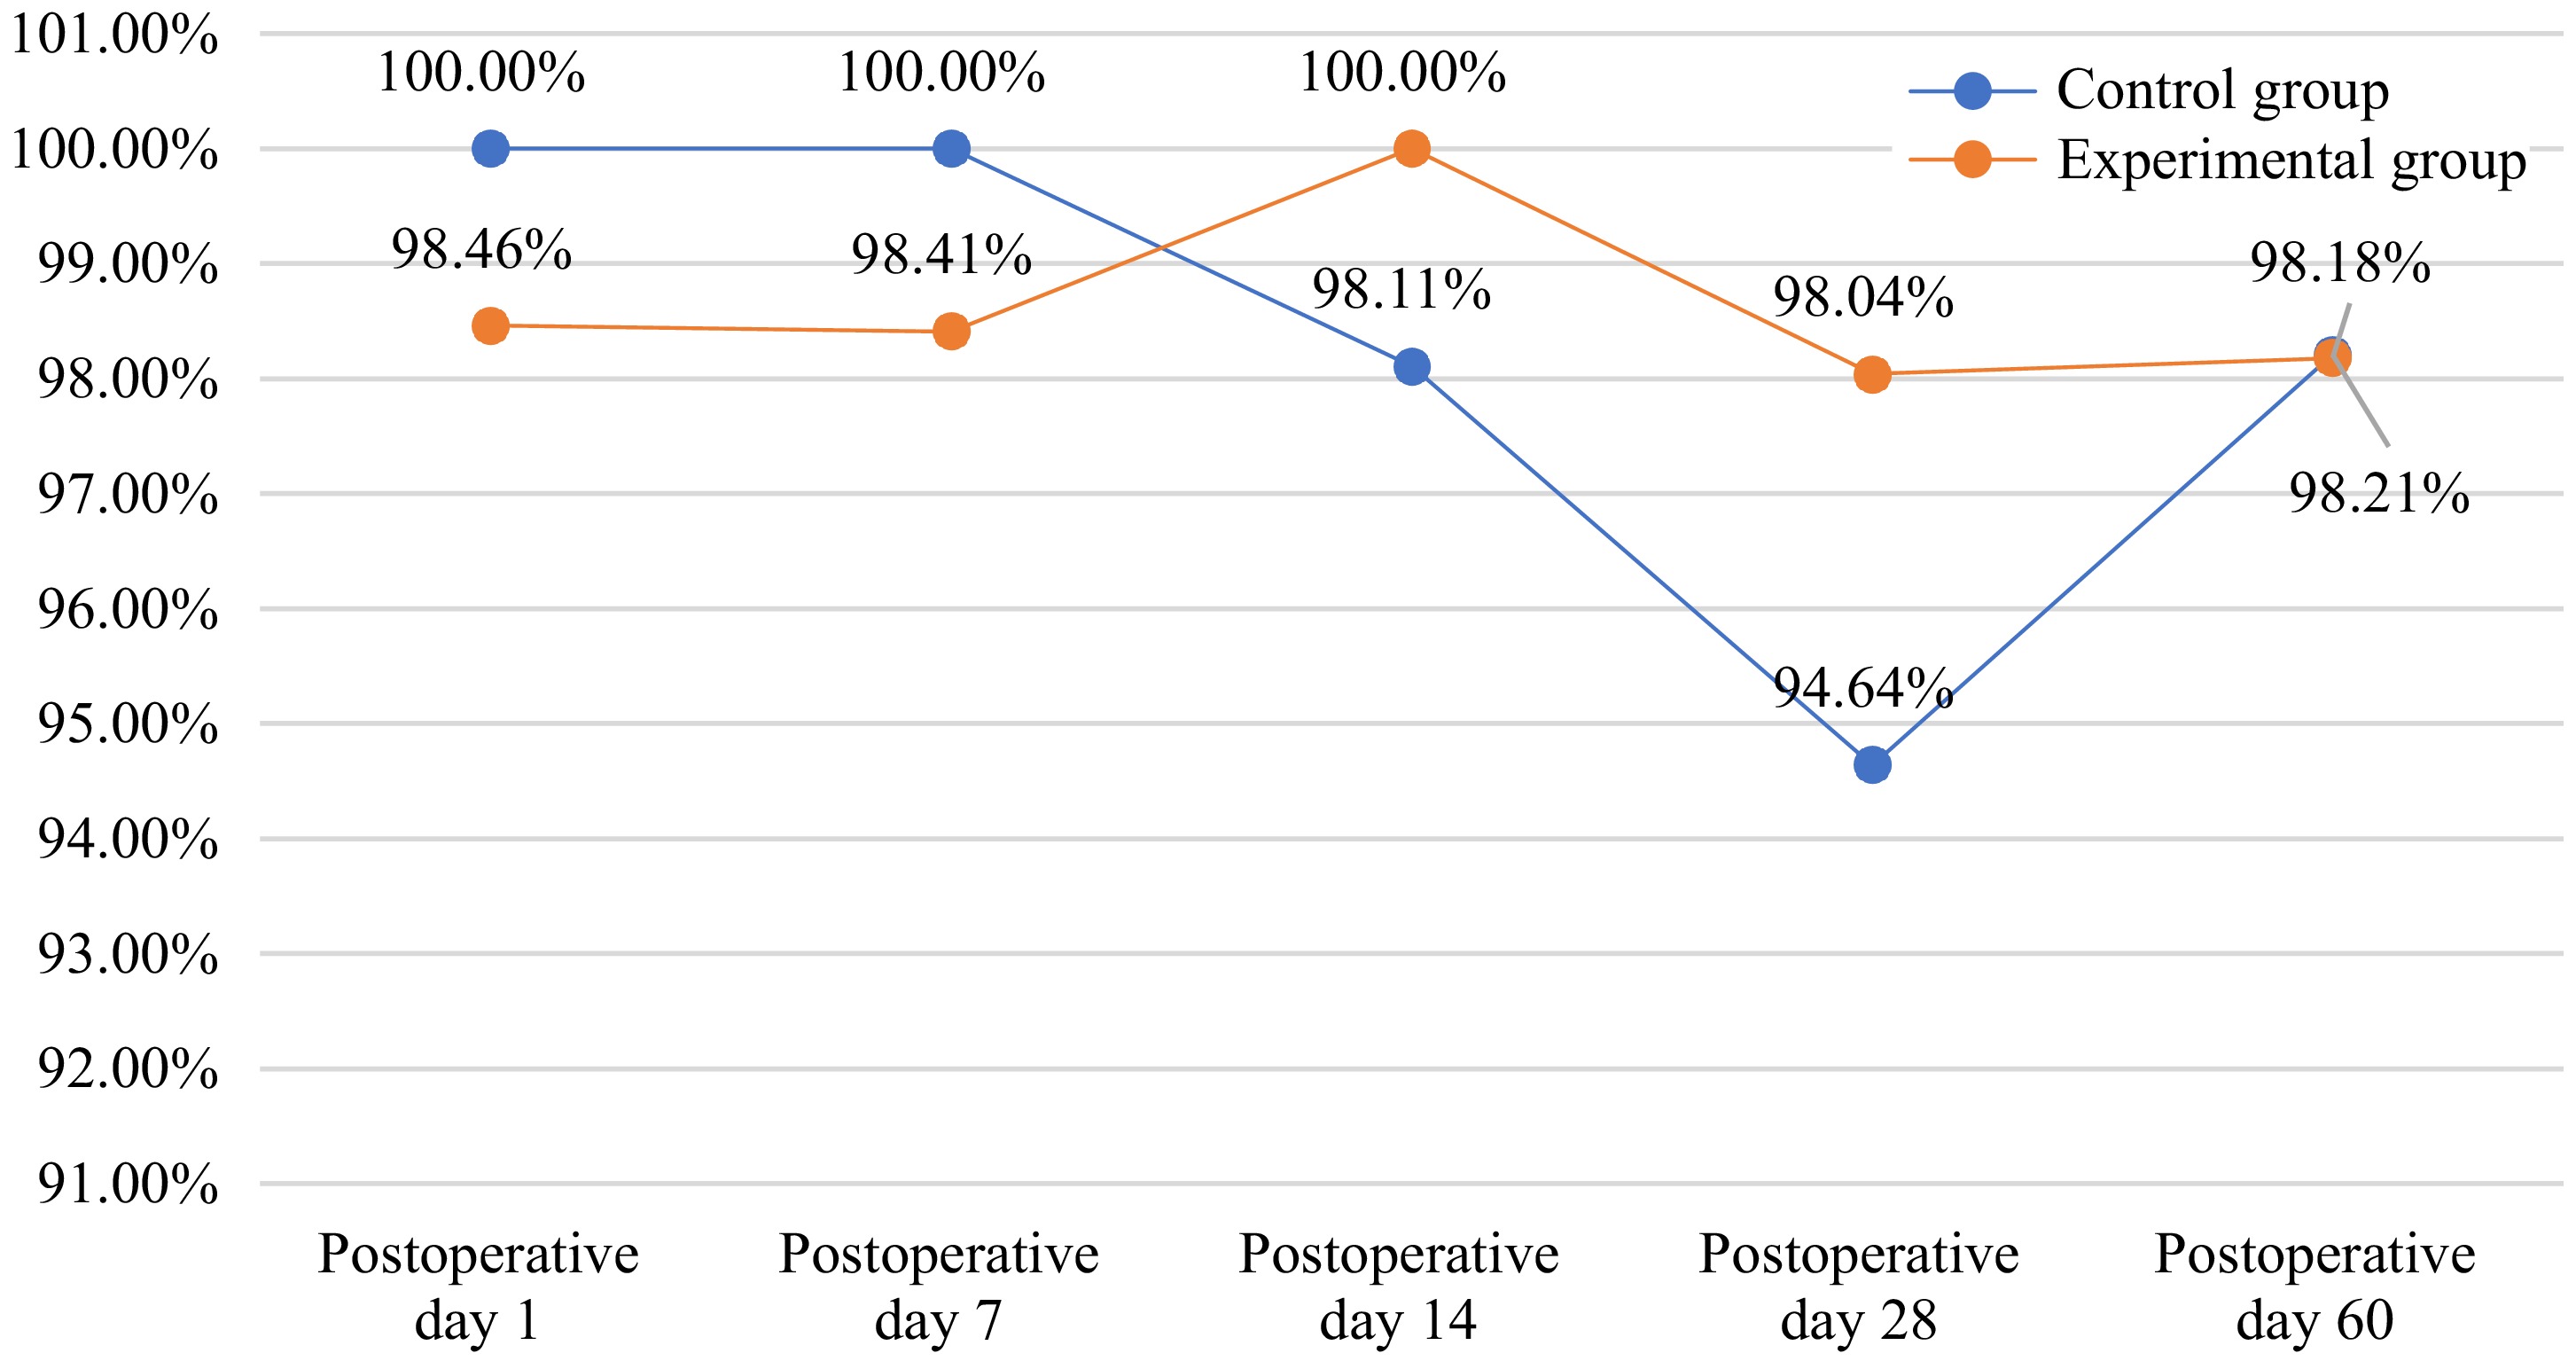
Figure 2.
Postoperative retinal reattachment rate.
-
Observation item Experimental group Control group Actual enrollment 68 (100.00%) 68 (100.00%) Completing the trial 61 (89.71%) 59 (86.76%) Without the use of device 2 (2.94%) 2 (2.94%) Violation of criteria 1 (1.47%) 0 (0.00%) Efficacy analysis population FAS 66 (97.06%) 66 (97.06%) PPS 58 (85.29%) 59 (86.76%) Safety analysis population SS 66 (97.06%) 66 (97.06%) FAS: full analysis set, PPS: per-protocol set, SS: safety analysis set. Table 1.
Enrolled patients and safety and efficacy analysis population.
-
Observation item Experimental group Control group Statistical approach Statistical magnitude p value Age (year) N (nmiss) 66 (0) 66 (0) T-test 0.289 0.773 Mean ± SD 54.71 ± 10.56 54.17 ± 11.15 Sex N (nmiss) 66 (0) 66 (0) Chi-square test 1.107 0.293 Male 40 (60.61%) 34 (51.52%) Female 26 (39.39%) 32 (48.48%) Table 2.
The demographic data at baseline (FAS).
-
Observation item Experimental group Control group Statistical approach Statistical magnitude p value BCVA (LogMAR) N (nmiss) 66 (0) 64 (2) Wilcoxon −0.332 0.740 M (Q1, Q3) 0.52 (0.22,2.00) 0.82 (0.22, 2.00) IOP N (nmiss) 66 (0) 66 (0) T-test −0.418 0.677 Mean ± SD 12.74 ± 3.06 12.96 ± 3.11 Choroidal detachment N (nmiss) 66 (0) 66 (0) Exact probability method 1.00 No 65 (98.48%) 64 (96.97%) Yes 1 (1.52%) 2 (3.03%) BCVA: best corrected visual acuity, LogMAR: Logarithm of the Minimum Angle of Resolution, IOP: intraocular pressure. Table 3.
The studied eye characteristics at baseline (FAS).
-
Observation item Experimental group Control group Statistical approach p value 1 d after surgery N (nmiss) 65 (1) 65 (1) Exact probability method 1.000 Yes 64 (98.46%) 65 (100.00%) Not applicable 1 (1.54%) 0 (0.00%) 14 d after surgery N (nmiss) 54 (12) 53 (13) Exact probability method 0.495 No 0 (0.00%) 1 (1.89%) Yes 54 (100.00%) 52(98.11%) 28 d after surgery N (nmiss) 51 (15) 56 (10) Exact probability method 0.620 No 1 (1.96%) 3 (5.36%) Yes 50 (98.04%) 53 (94.64%) 60 d after surgery N (nmiss) 55 (11) 56 (10) Exact probability method 1.000 No 1 (1.82%) 1 (1.79%) Yes 54 (98.18%) 55 (98.21%) Table 4.
The complete retinal reattachment rates after surgery (FAS).
-
Observation item Experimental group Control group Statistical approach Statistical magnitude p value 1 d after surgery N (nmiss) 50 (16) 49 (17) Wilcoxon 1.436 0.151 M (Q1, Q3) 2.00 (2.00,2.00)*** 2.00 (2.00,2.00)*** 7 d after surgery N (nmiss) 59 (7) 64 (2) Wilcoxon −1.144 0.253 M (Q1, Q3) 2.00 (0.96,2.00)*** 2.00 (2.00,2.00)*** 14 d after surgery N (nmiss) 54 (12) 52 (14) Wilcoxon −0.507 0.612 M (Q1, Q3) 0.70 (0.30,2.00) 0.82 (0.41,2.00) 28 d after surgery N (nmiss) 52 (14) 55 (11) Wilcoxon 0.144 0.885 M (Q1, Q3) 0.40 (0.22,0.70)* 0.40 (0.17,0.70)*** 60 d after surgery N (nmiss) 60 (6) 56 (10) Wilcoxon −0.069 0.945 M (Q1, Q3) 0.30 (0.10,0.52)*** 0.30 (0.10,0.52)*** */***: Postoperative visual acuity was statistically different from preoperative visual acuity. * p < 0.05, *** p < 0.001. Table 5.
BCVA at 1, 7, 14, 28, and 60 d after surgery (FAS).
-
IOP elevation Corneal edema Cataract Anterior chamber gas Experimental group 17 4 8 3 Control group 19 2 8 1 Table 6.
Ocular adverse events.
-
Observation item Experimental group Control group Statistical approach Statistical magnitude p value AEs N (nmiss) 66 (0) 66 (0) Chi-square test 2.460 0.117 No 36 (54.55%) 27 (40.91%) Yes 30 (45.45%) 39 (59.09%) Severity N (nmiss) 62 (0) 64 (0) Wilcoxon −0.537 0.591 Mild 46 (74.19%) 47 (73.44%) Moderate 15 (24.19%) 14 (21.88%) Severe 1 (1.61%) 3 (4.69%) Relationship to the device N (nmiss) 62 (0) 64 (0) Wilcoxon −0.537 0.591 Certainly relevant 9 (14.52%) 9 (14.06%) May be relevant 28 (45.16%) 23 (35.94%) May not be relevant 10 (16.13%) 18 (28.13%) Certainly not relevant 15 (24.19%) 14 (21.88%) Outcomes of AEs N (nmiss) 62 (0) 64 (0) Exact probability method 0.512 Persistence 10 (16.13%) 15 (23.44%) Deterioration 1 (1.61%) 1 (1.56%) Recovery/cure 49 (79.03%) 48 (75.00%) Recovered but had sequelae 2 (3.23%) 0 (0.00%) Withdrawal due to AEs N (nmiss) 66 (0) 66 (0) Exact probability method 0.440 Yes 5 (7.58%) 2 (3.03%) No 61 (92.42%) 64 (96.97%) AEs: adverse events. Table 7.
Occurrence of adverse events (SS).
Figures
(2)
Tables
(7)