-
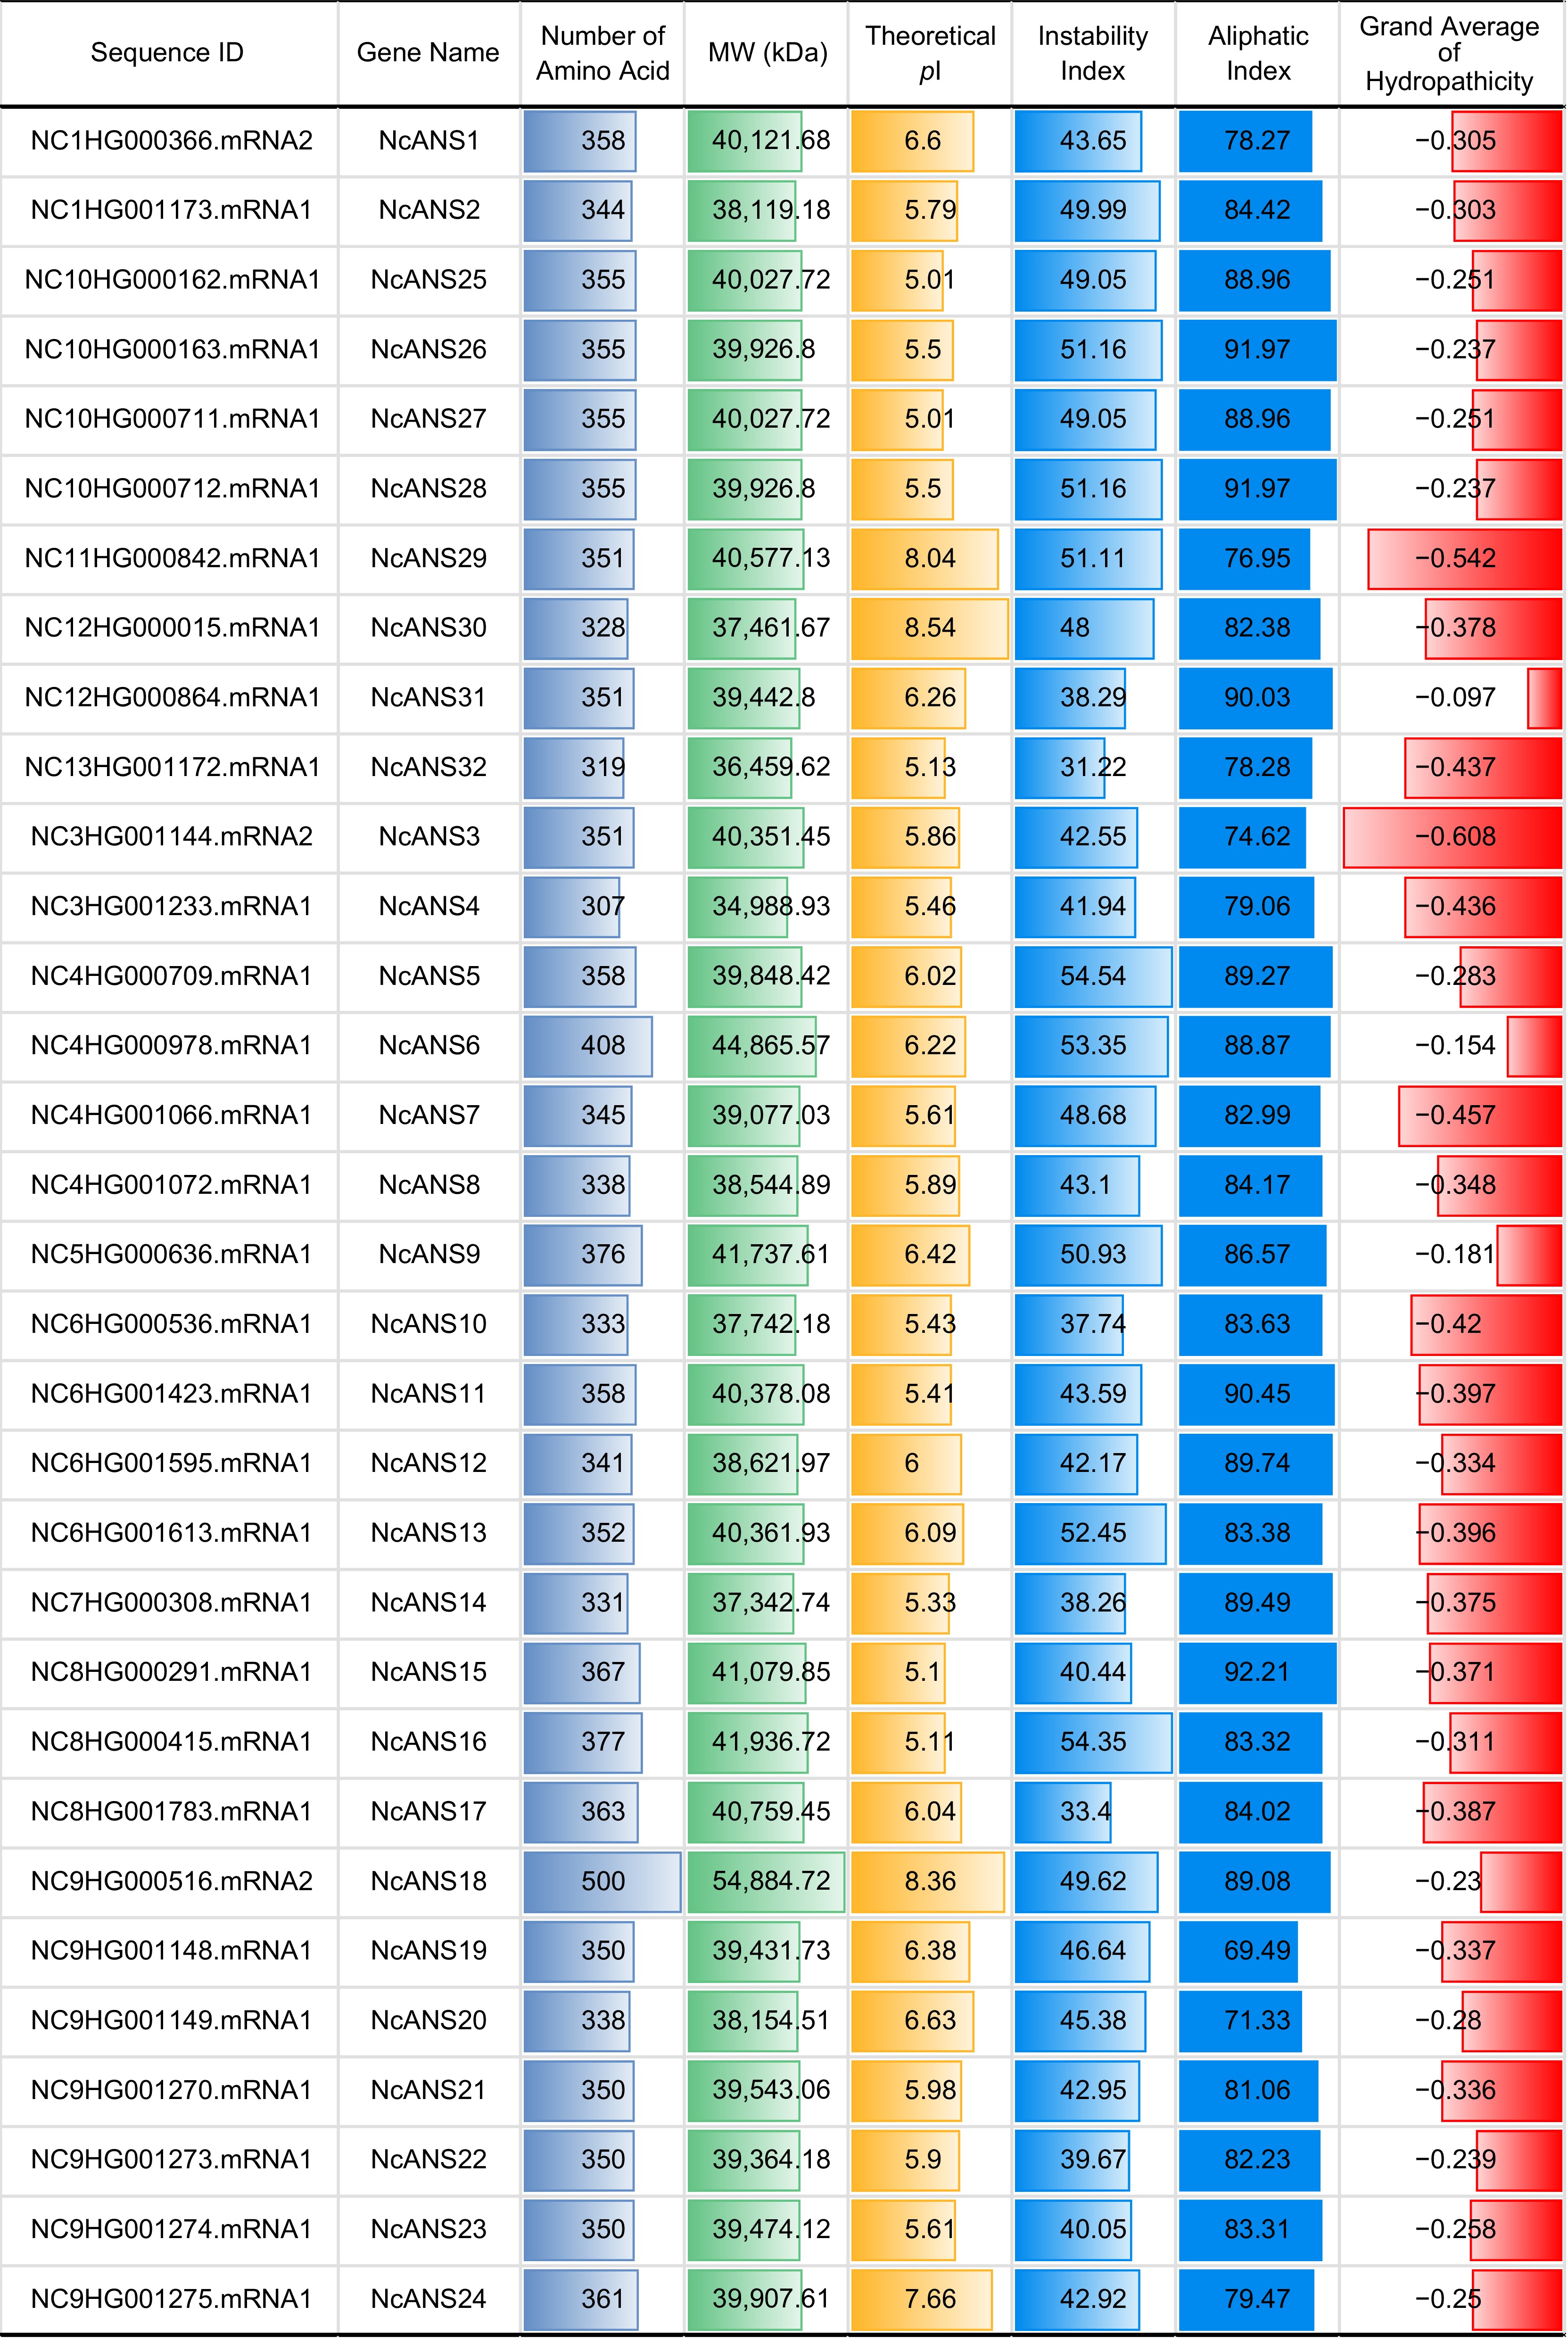
Figure 1.
Statistics of Nymphaea colorata ANS gene family members.
-
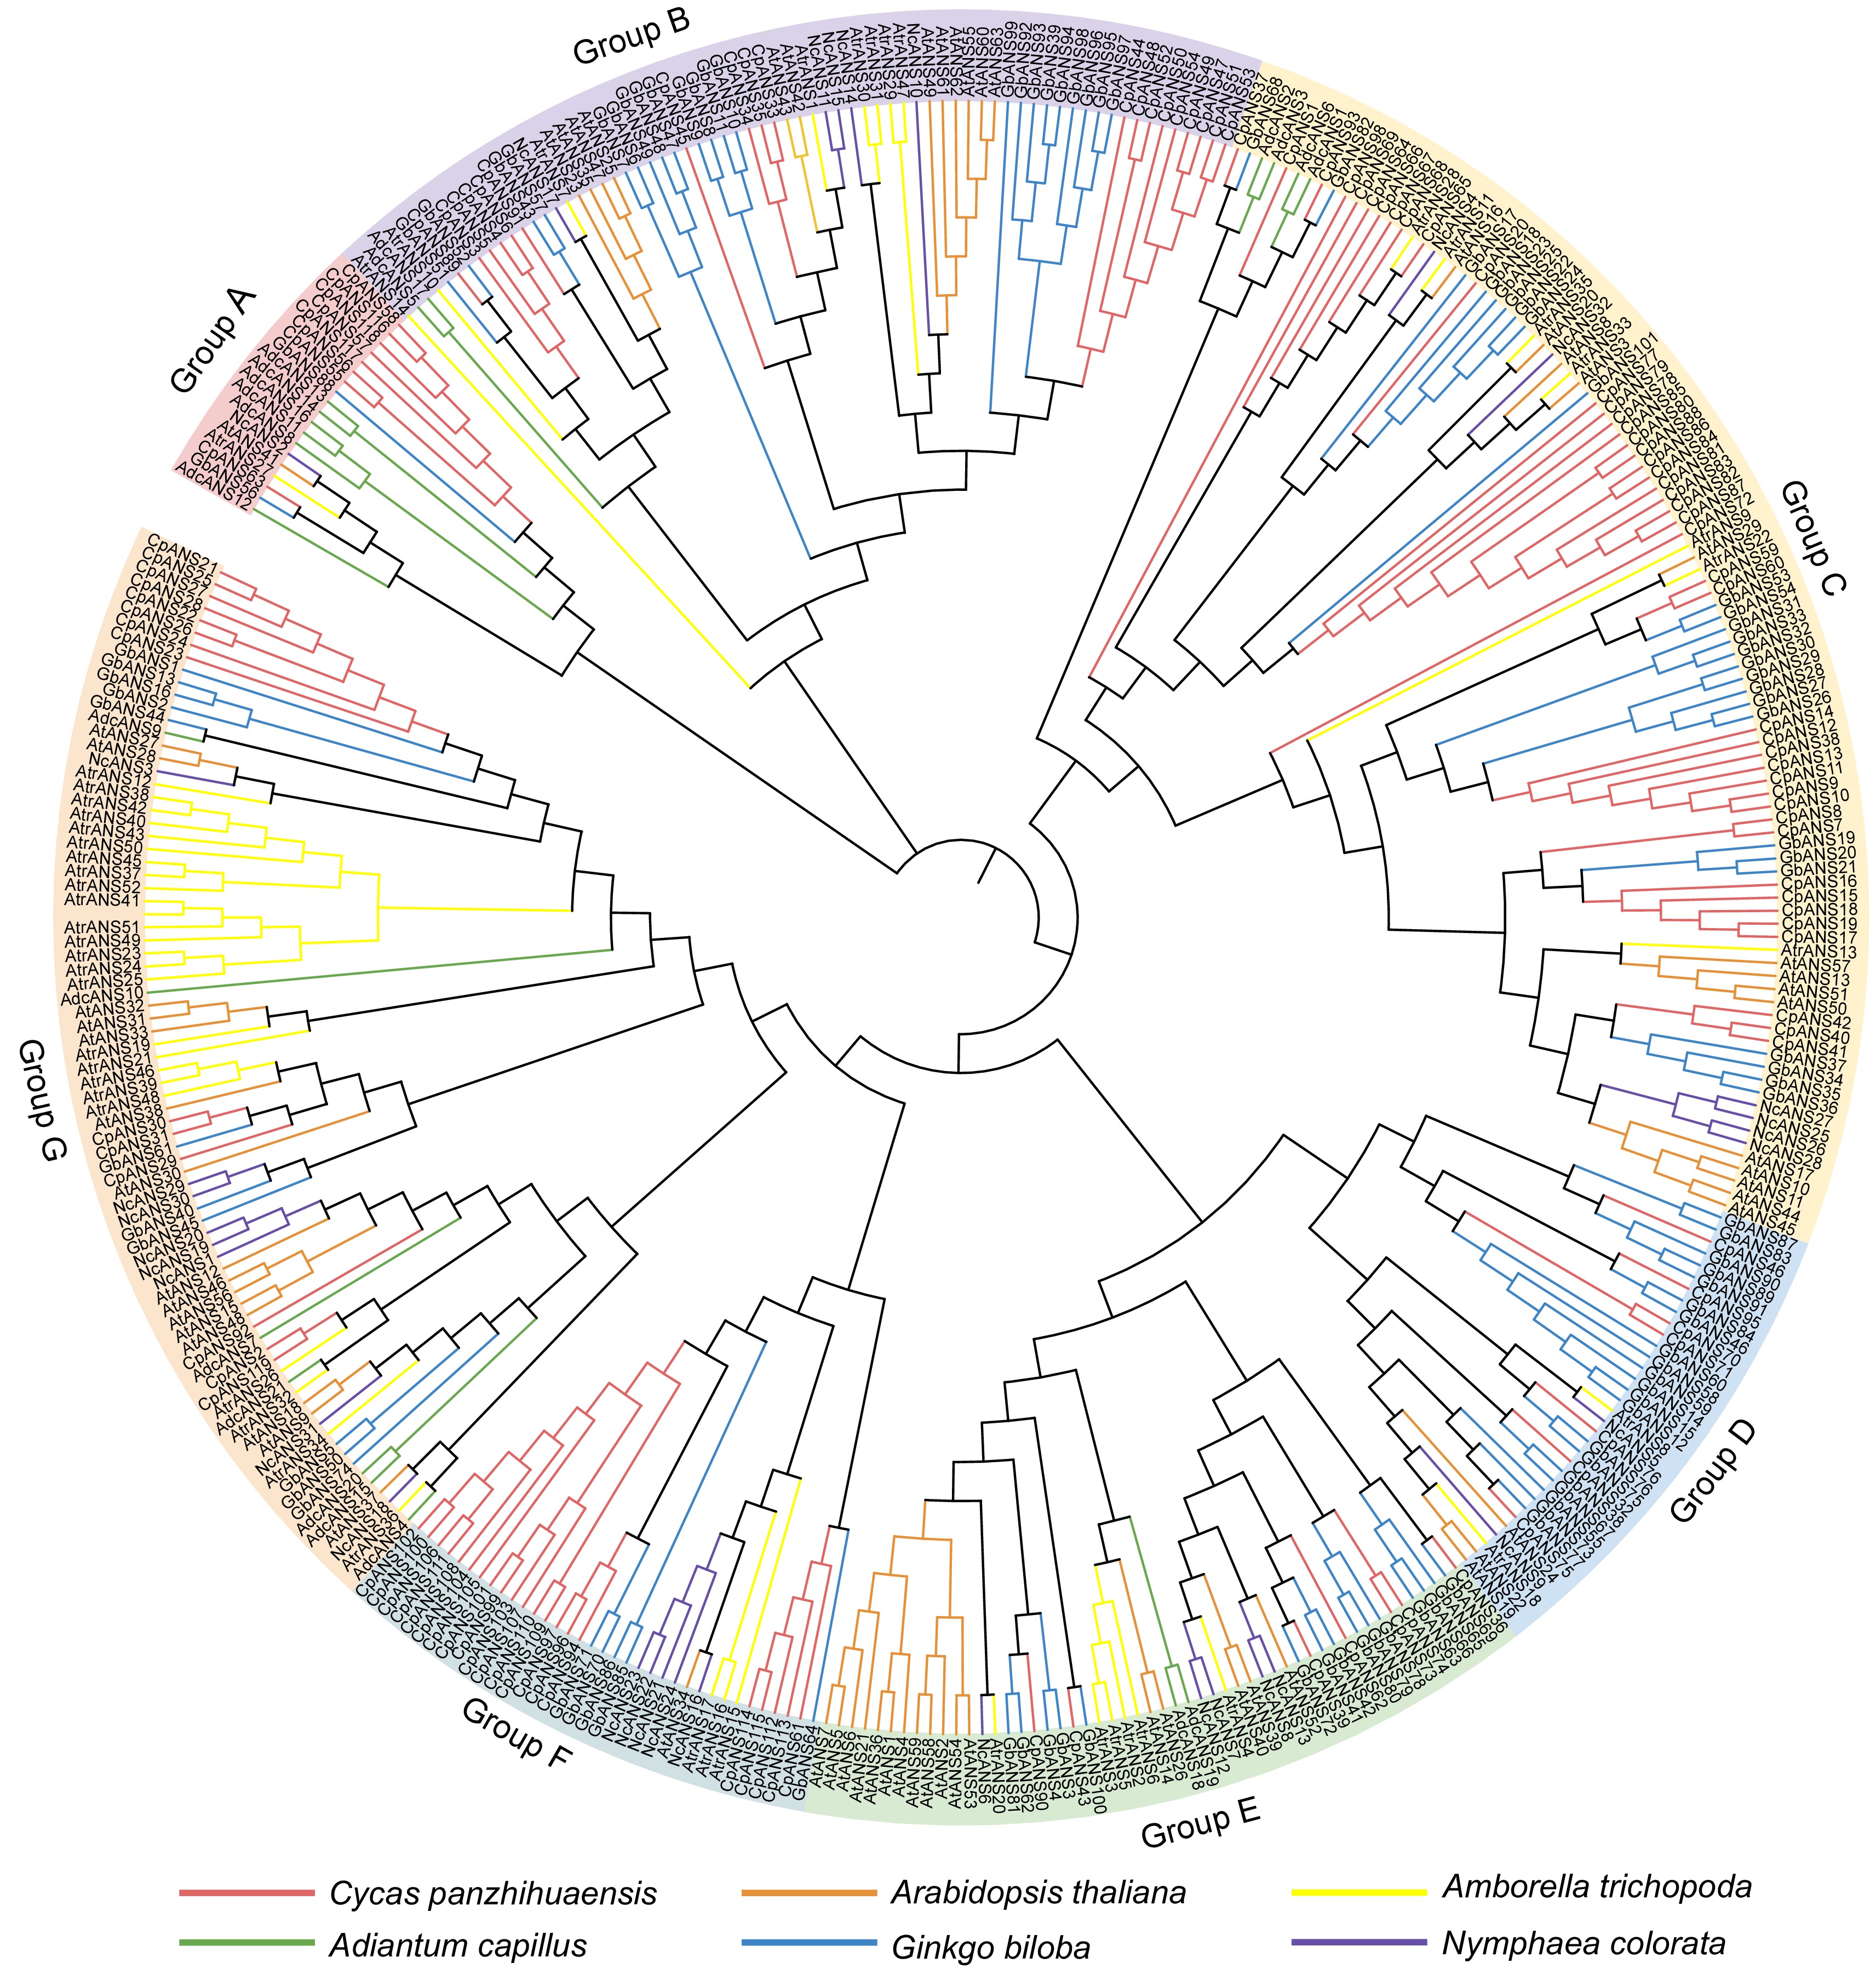
Figure 2.
Maximum-likelihood (ML) phylogenetic tree using 388 ANS proteins from six different plant species. The proteins included from Adiantum capillus, Amborella trichopoda, Arabidopsis thaliana, Cycas panzhihuaensis, Ginkgo biloba, and Nymphaea colorata. The branches of different colors represent different species. Green: A. capillus; Yellow: A. trichopoda; Red: C. panzhihuaensis; Blue: G. biloba; Orange: A. thaliana; Purple: N. colorata.
-
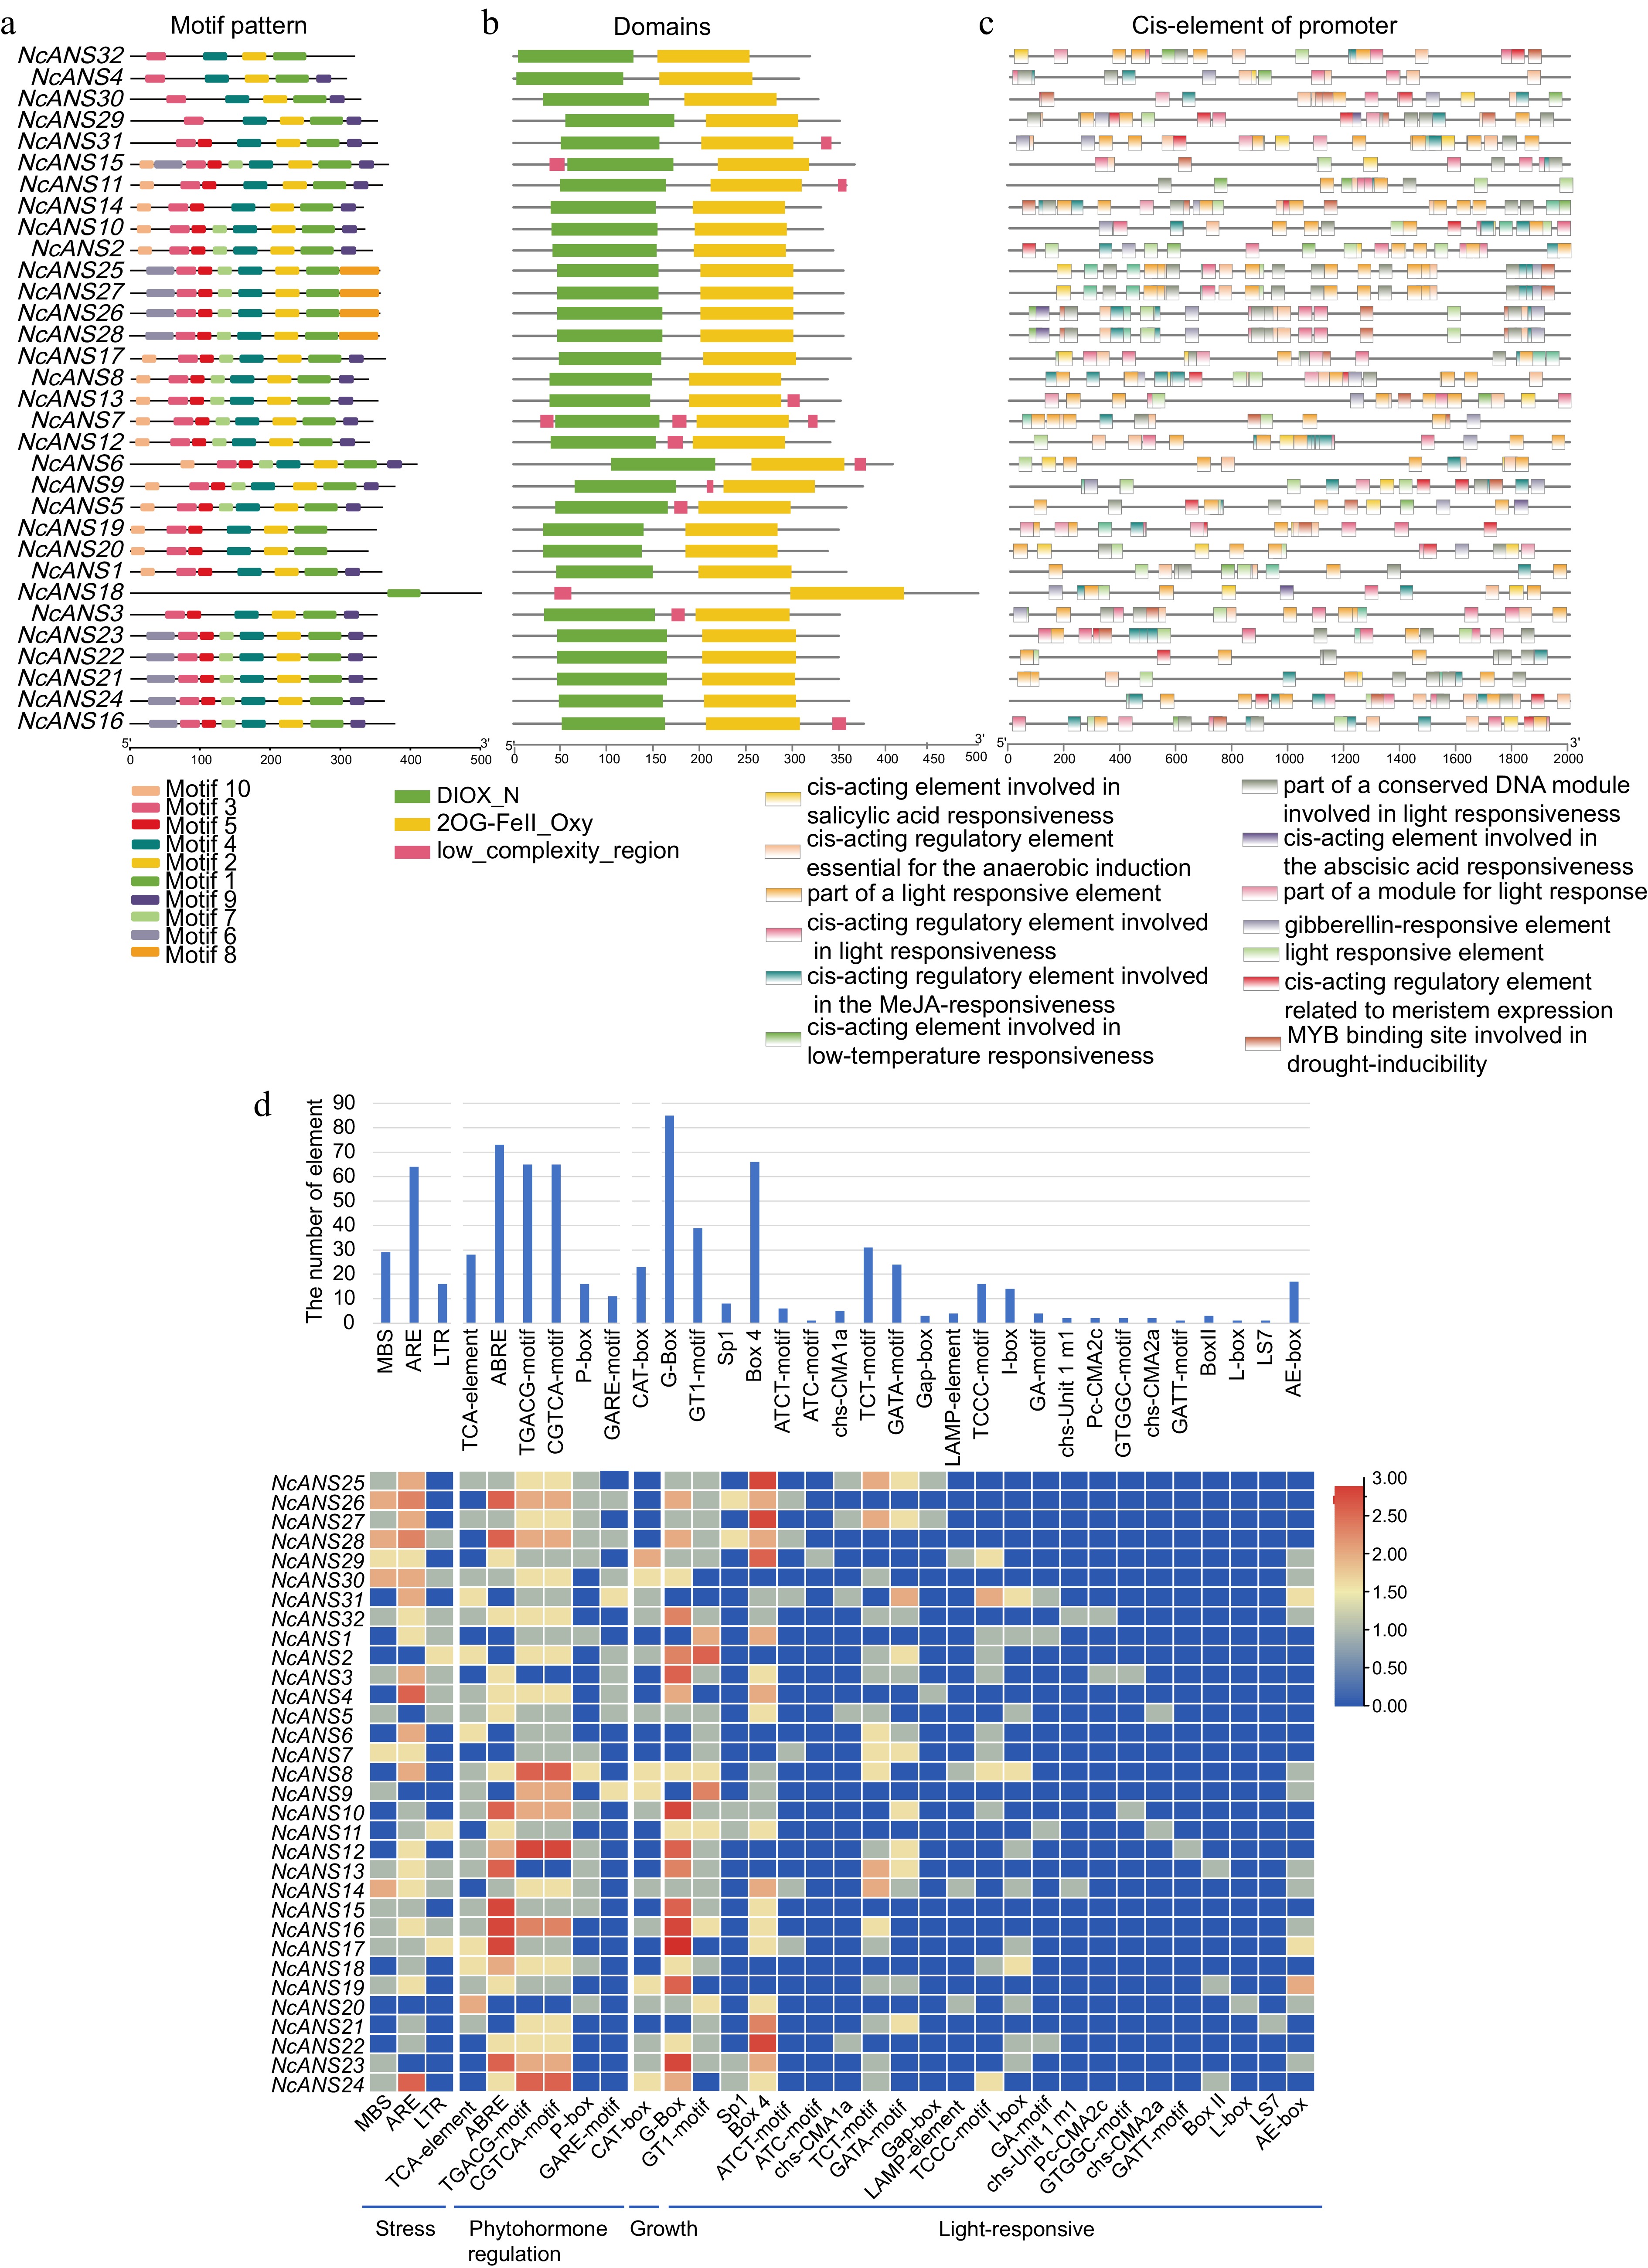
Figure 3.
Conserved motif, domain examination, and cis-regulatory element analysis of NcANS genes. (a) Motif analysis of the NcANS genes revealed that most the number and arrangement of motifs are similar within the same evolutionary branch. (b) Conserved domain analysis of the NcANS genes showed that, except for NcANS16, which contains only one 2OG-FE(II)-dependent oxygenase (2og-fe_oxy) domain, all other genes contain both 2og-fe_oxy and Diox conserved domains. (c) Cis-regulatory element analysis of the NcANS gene promoters revealed that all NcANS genes contain light-responsive elements, suggesting that they may play an important role in light-regulated anthocyanin metabolism. (d) The cis-elements were statistically classified into four categories: stress-responsive elements, hormone-responsive elements, growth-related elements, and light-responsive elements.
-
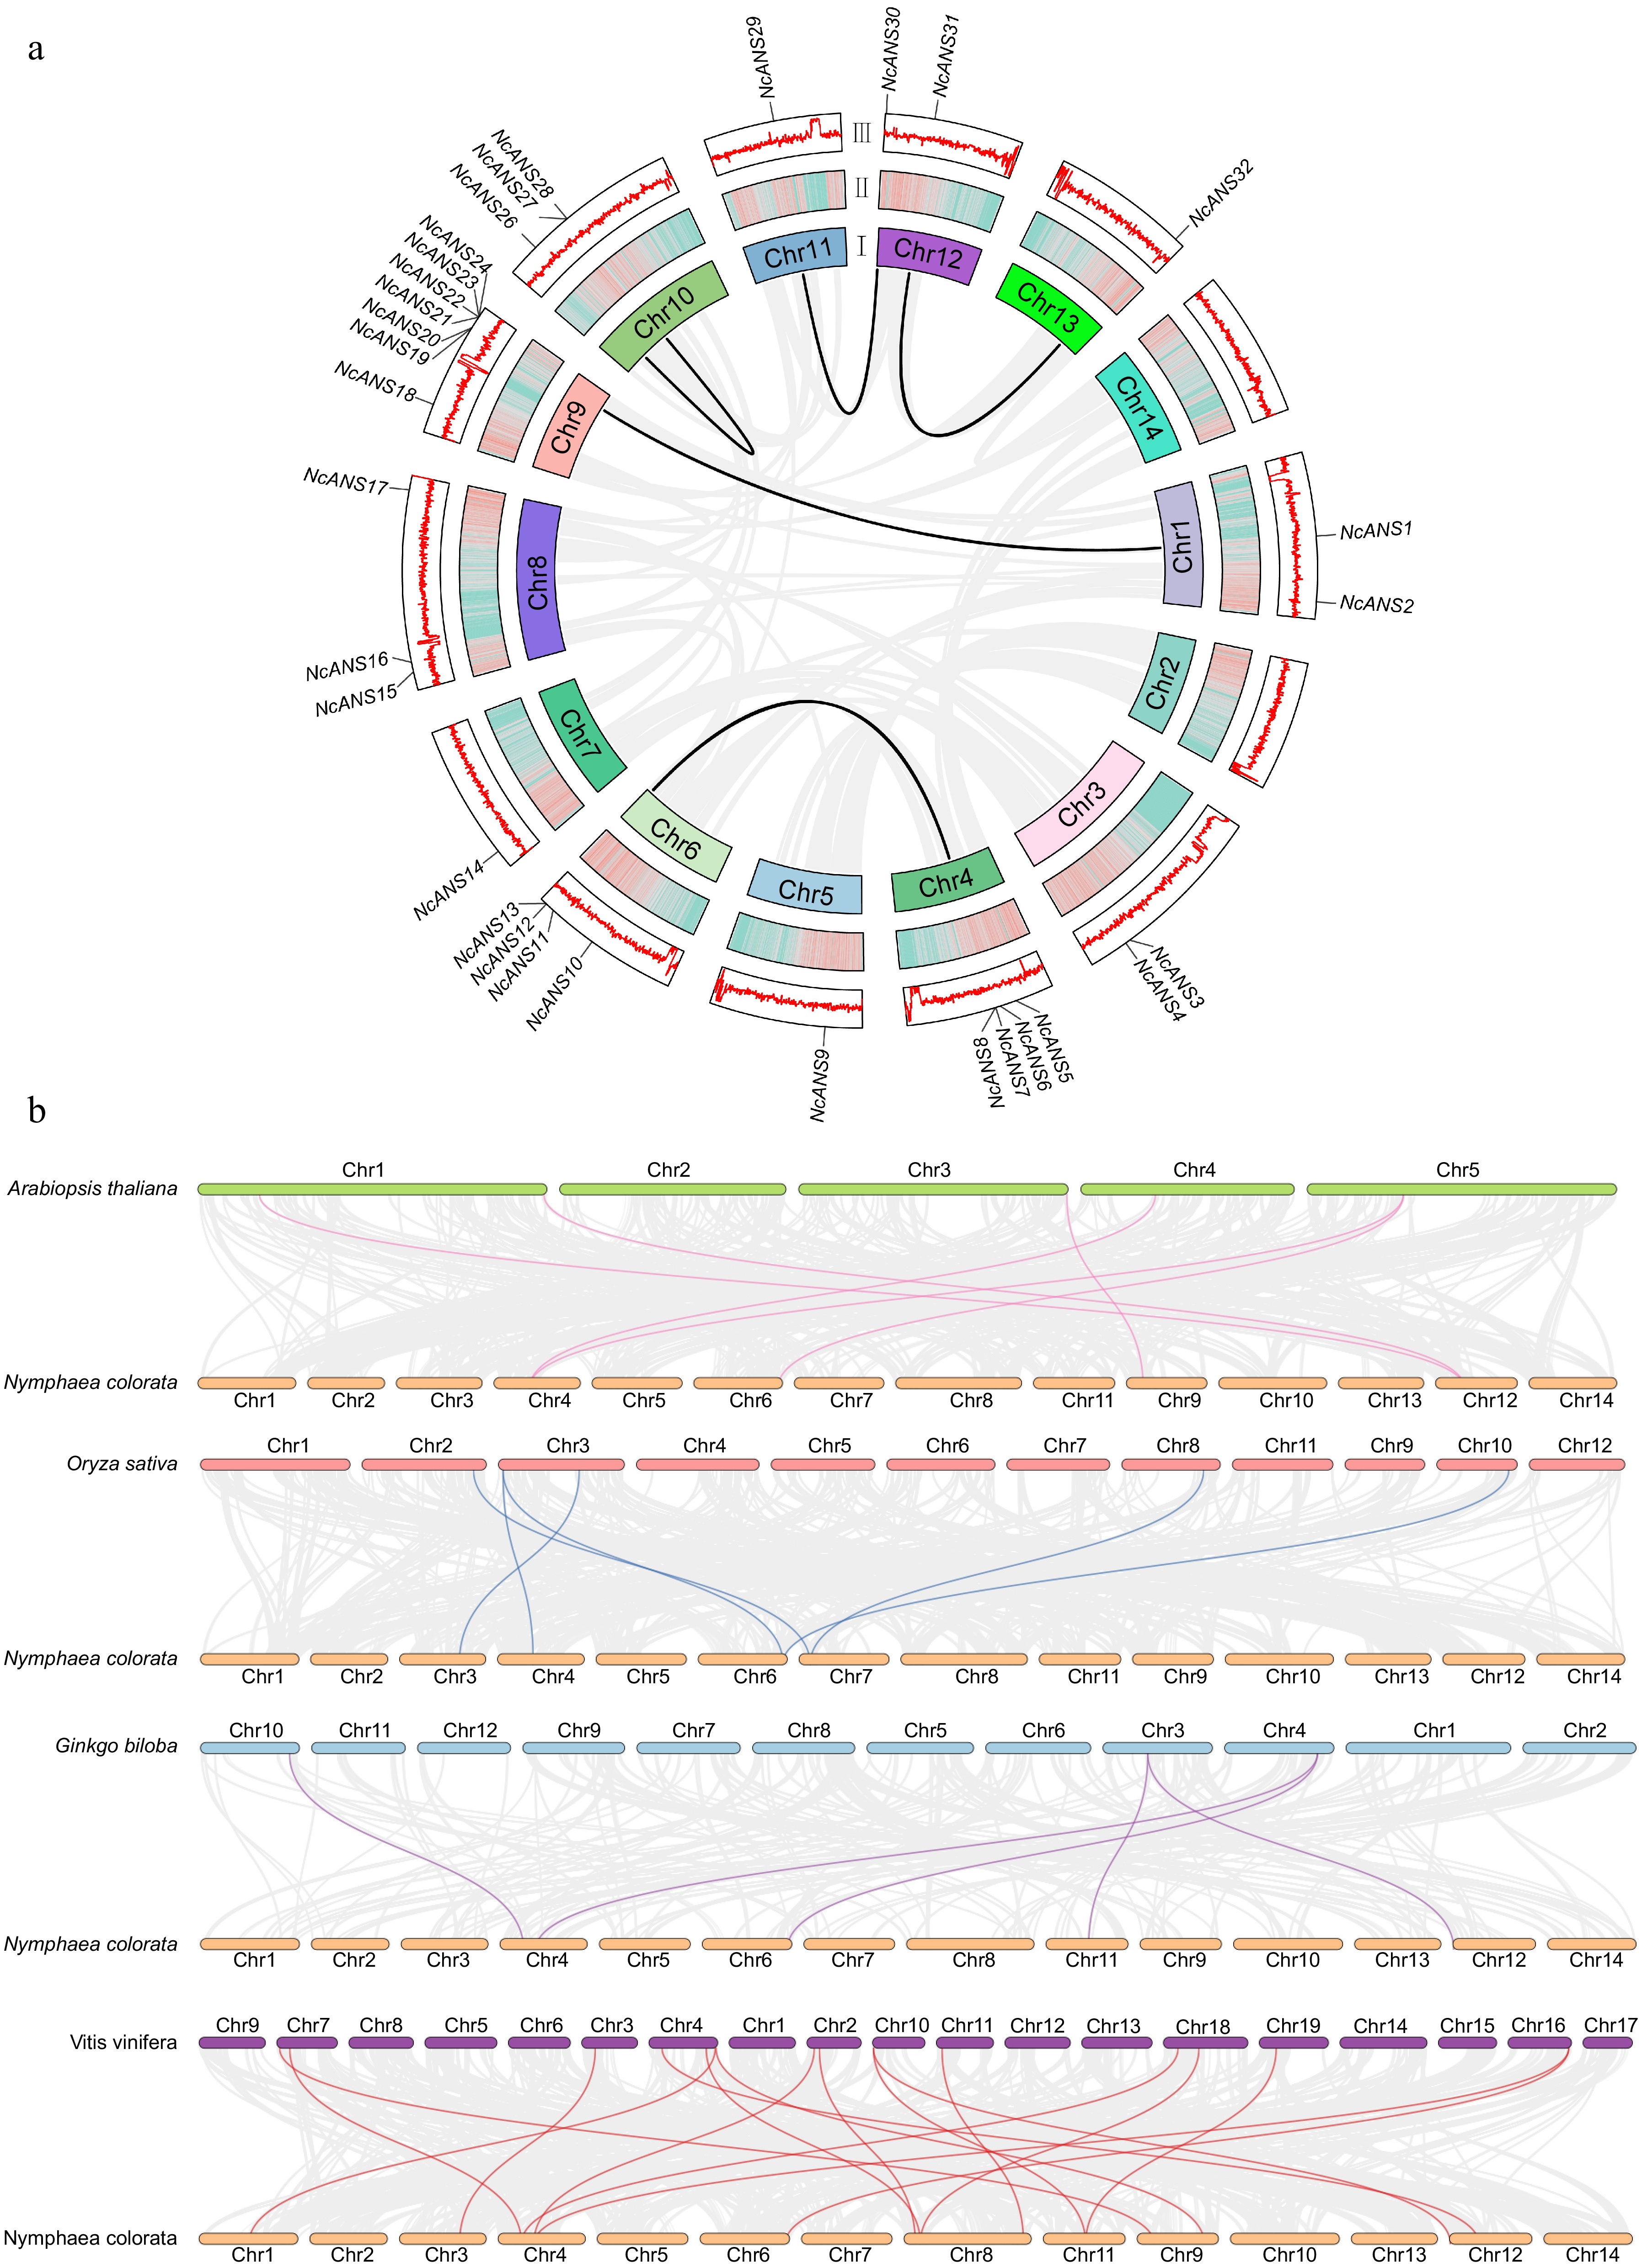
Figure 4.
Synteny analysis of the NcANS gene family. (a) Synteny analysis of NcANS genes. The gray lines represent all syntenic blocks across the N. colorata genome, while the black lines denote gene pairs between NcANS genes. The circular plot is divided into three layers: (I) Chromosome names; (II) Chromosome density; (III) Distribution of GC content across the chromosomes. (b) Synteny analysis of NcANS genes between N. colorata and four other representative plants. The gray lines indicate synteny between the N. colorata genome and the genomes of A. thaliana, O. sativa, G. biloba, and V. vinifera. The pink, blue, purple, and red lines represent syntenic gene pairs between NcANS genes and ANS genes from Arabidopsis, rice, Ginkgo, and grape, respectively.
-
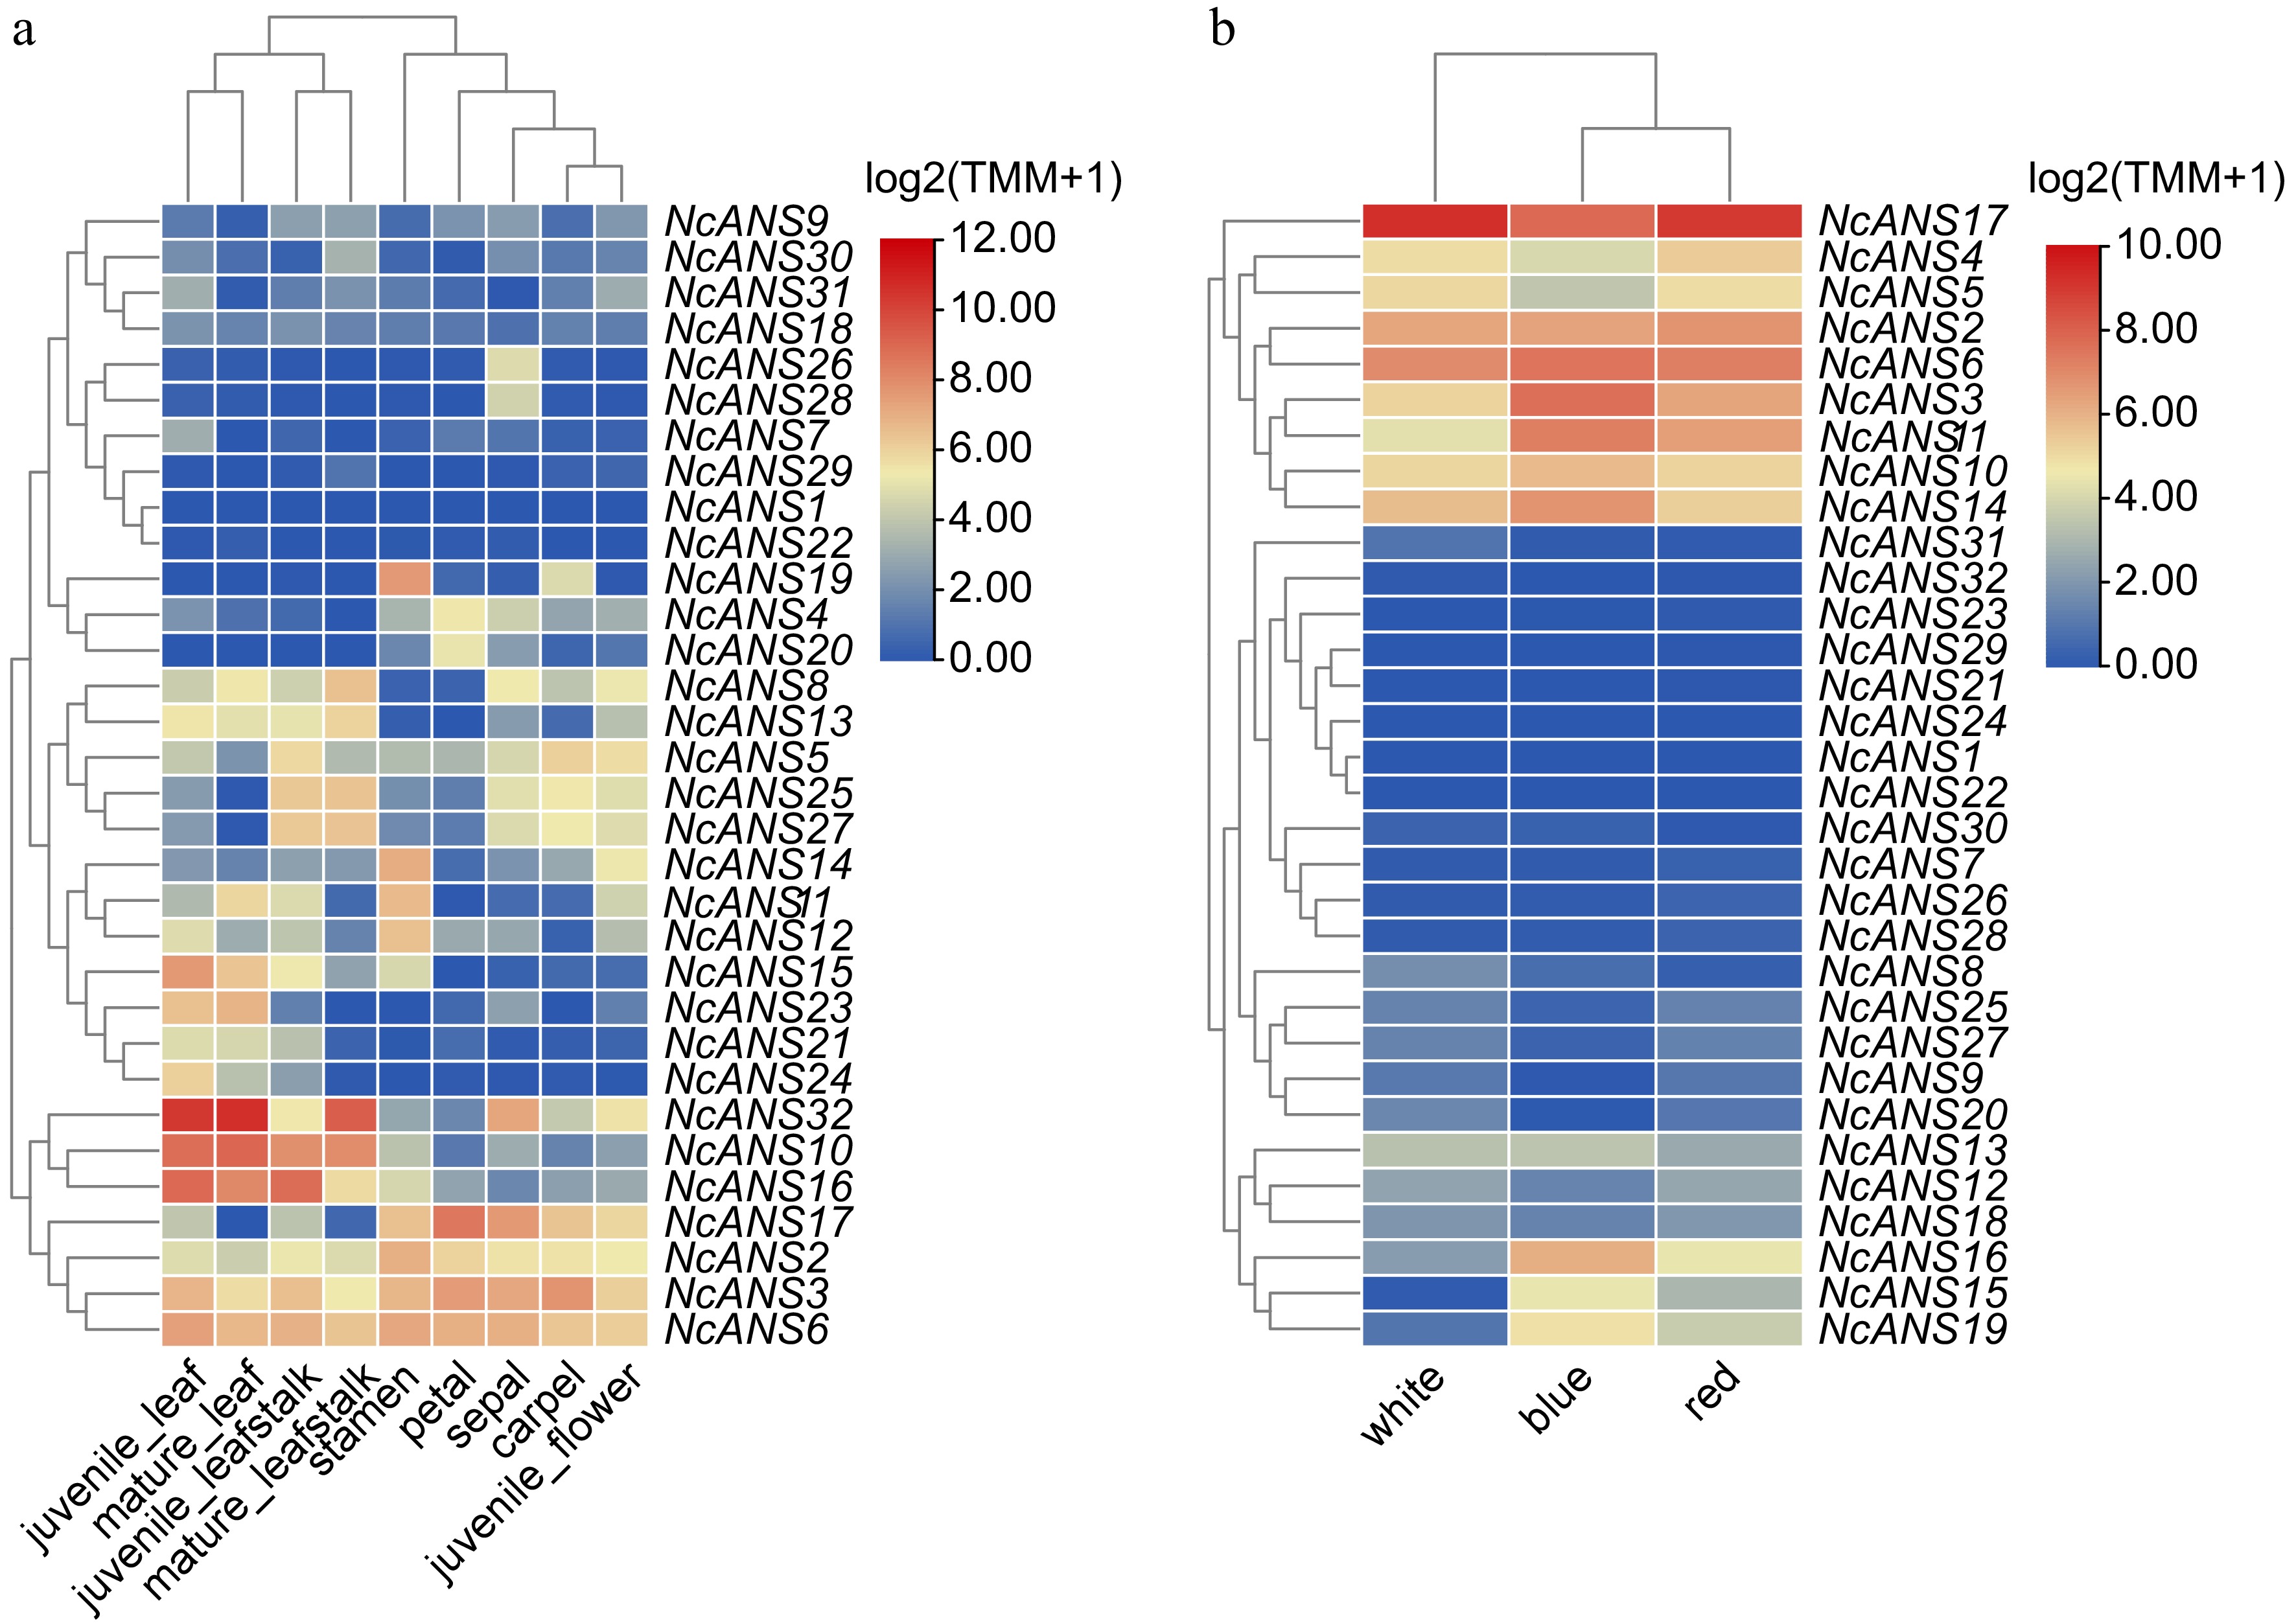
Figure 5.
Expression of NcANS genes in different tissues and flower colors of N. colorata.
-
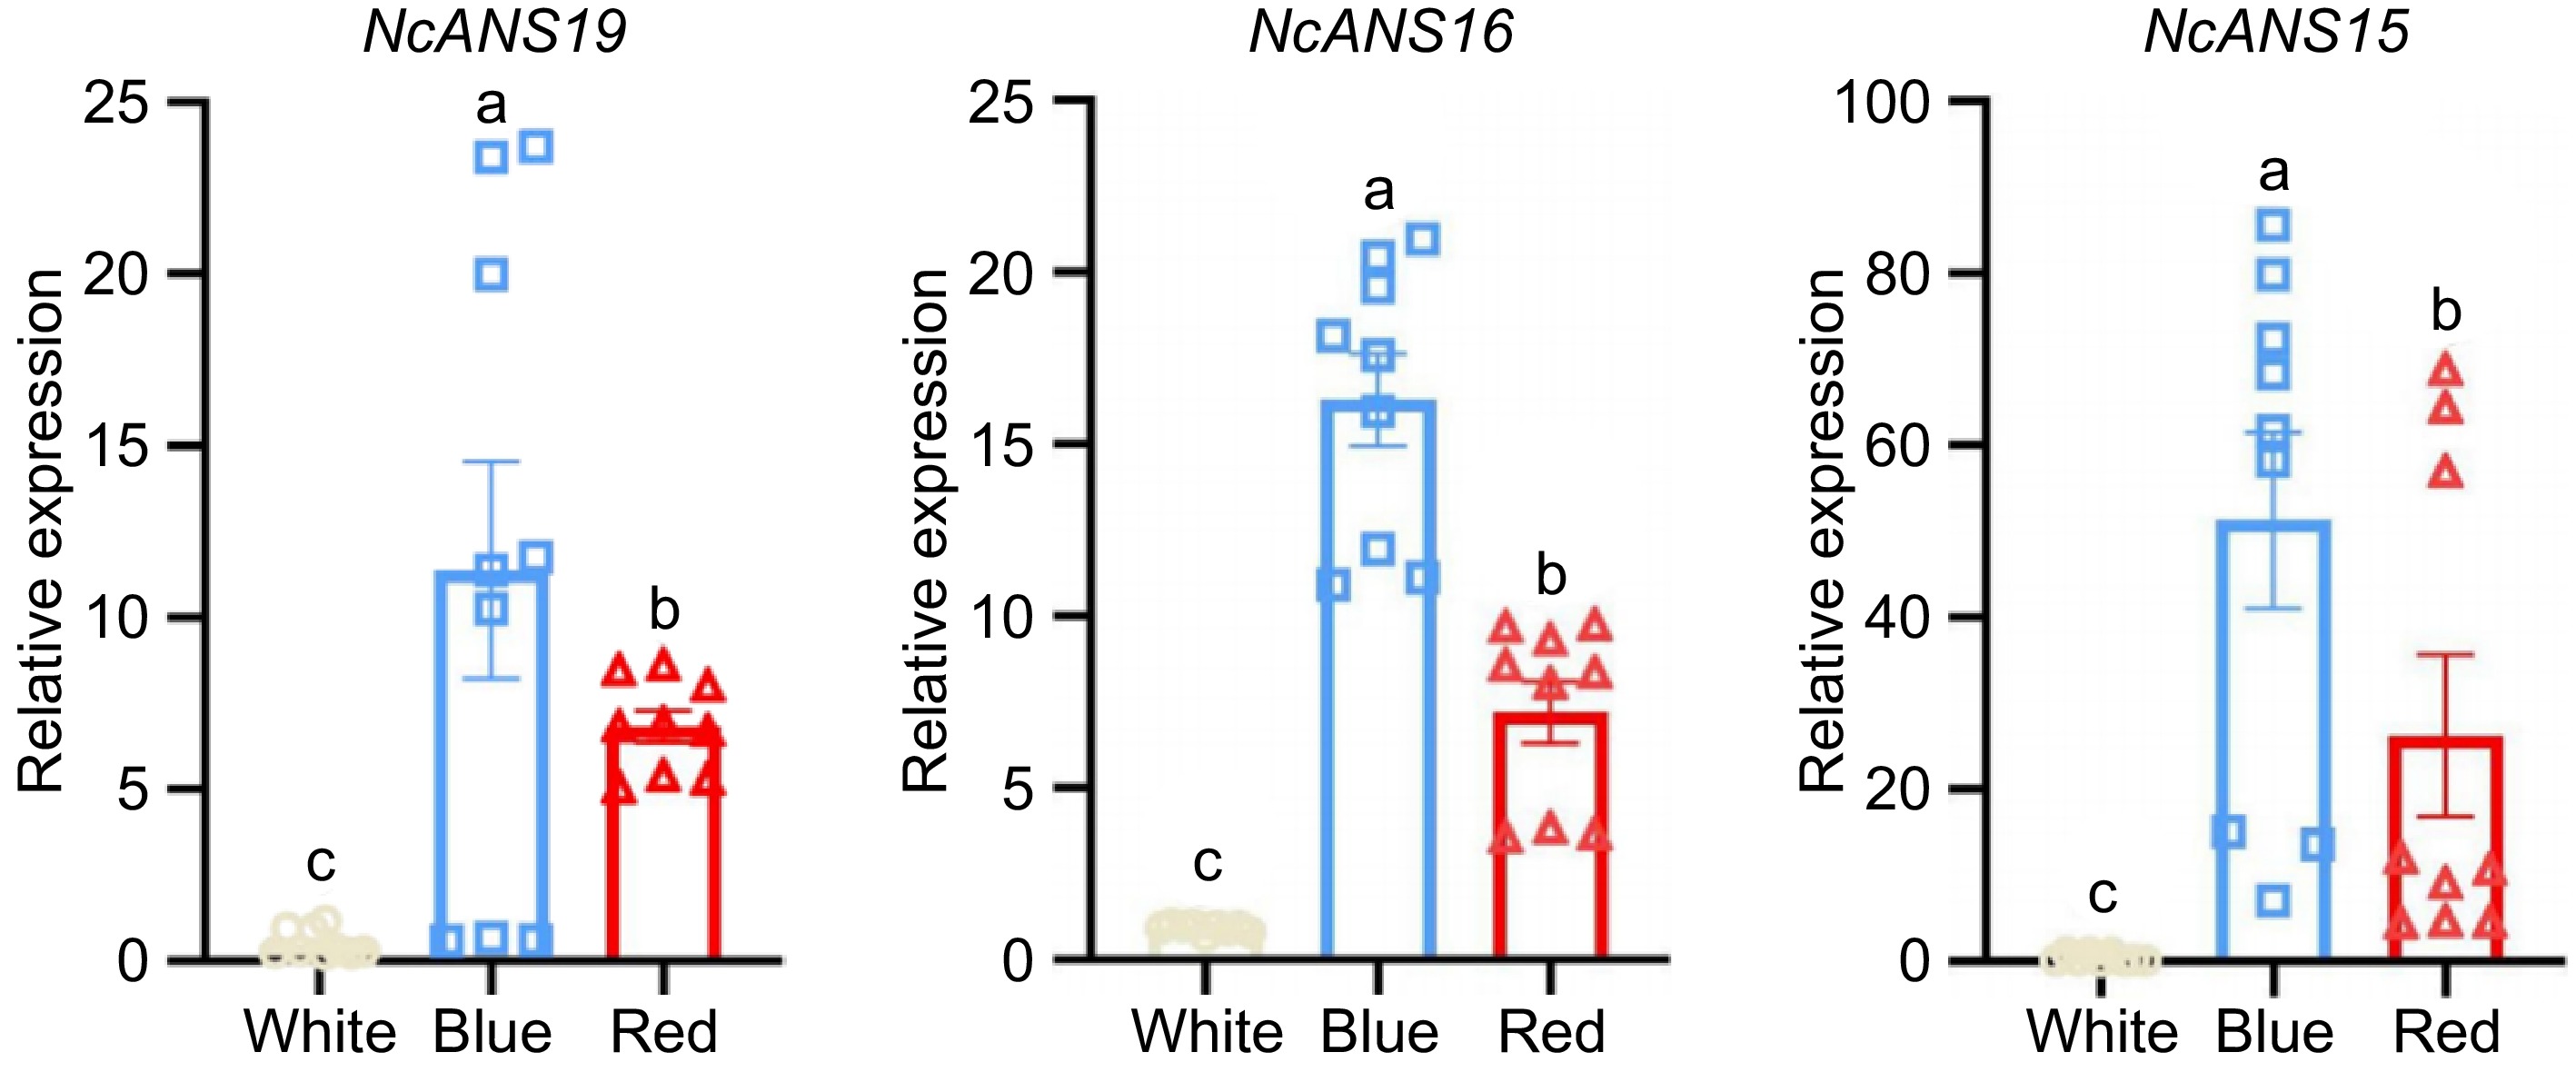
Figure 6.
Expression levels of the NcANS gene in different flower colors of N. colorata. Different lowercase letters indicate significant differences at the 0.05 level.
-
Seq_1 Seq_2 Ka Ks Ka_Ks NcANS1 NcANS19 0.21 0.88 0.24 NcANS25 NcANS27 0 0 / NcANS29 NcANS30 0.131 0.94 0.14 NcANS7 NcANS12 0.18 1.06 0.16 NcANS8 NcANS13 0.17 1.32 0.13 Table 1.
Selection pressure analysis of NcANS homologous gene pairs.
Figures
(6)
Tables
(1)