-
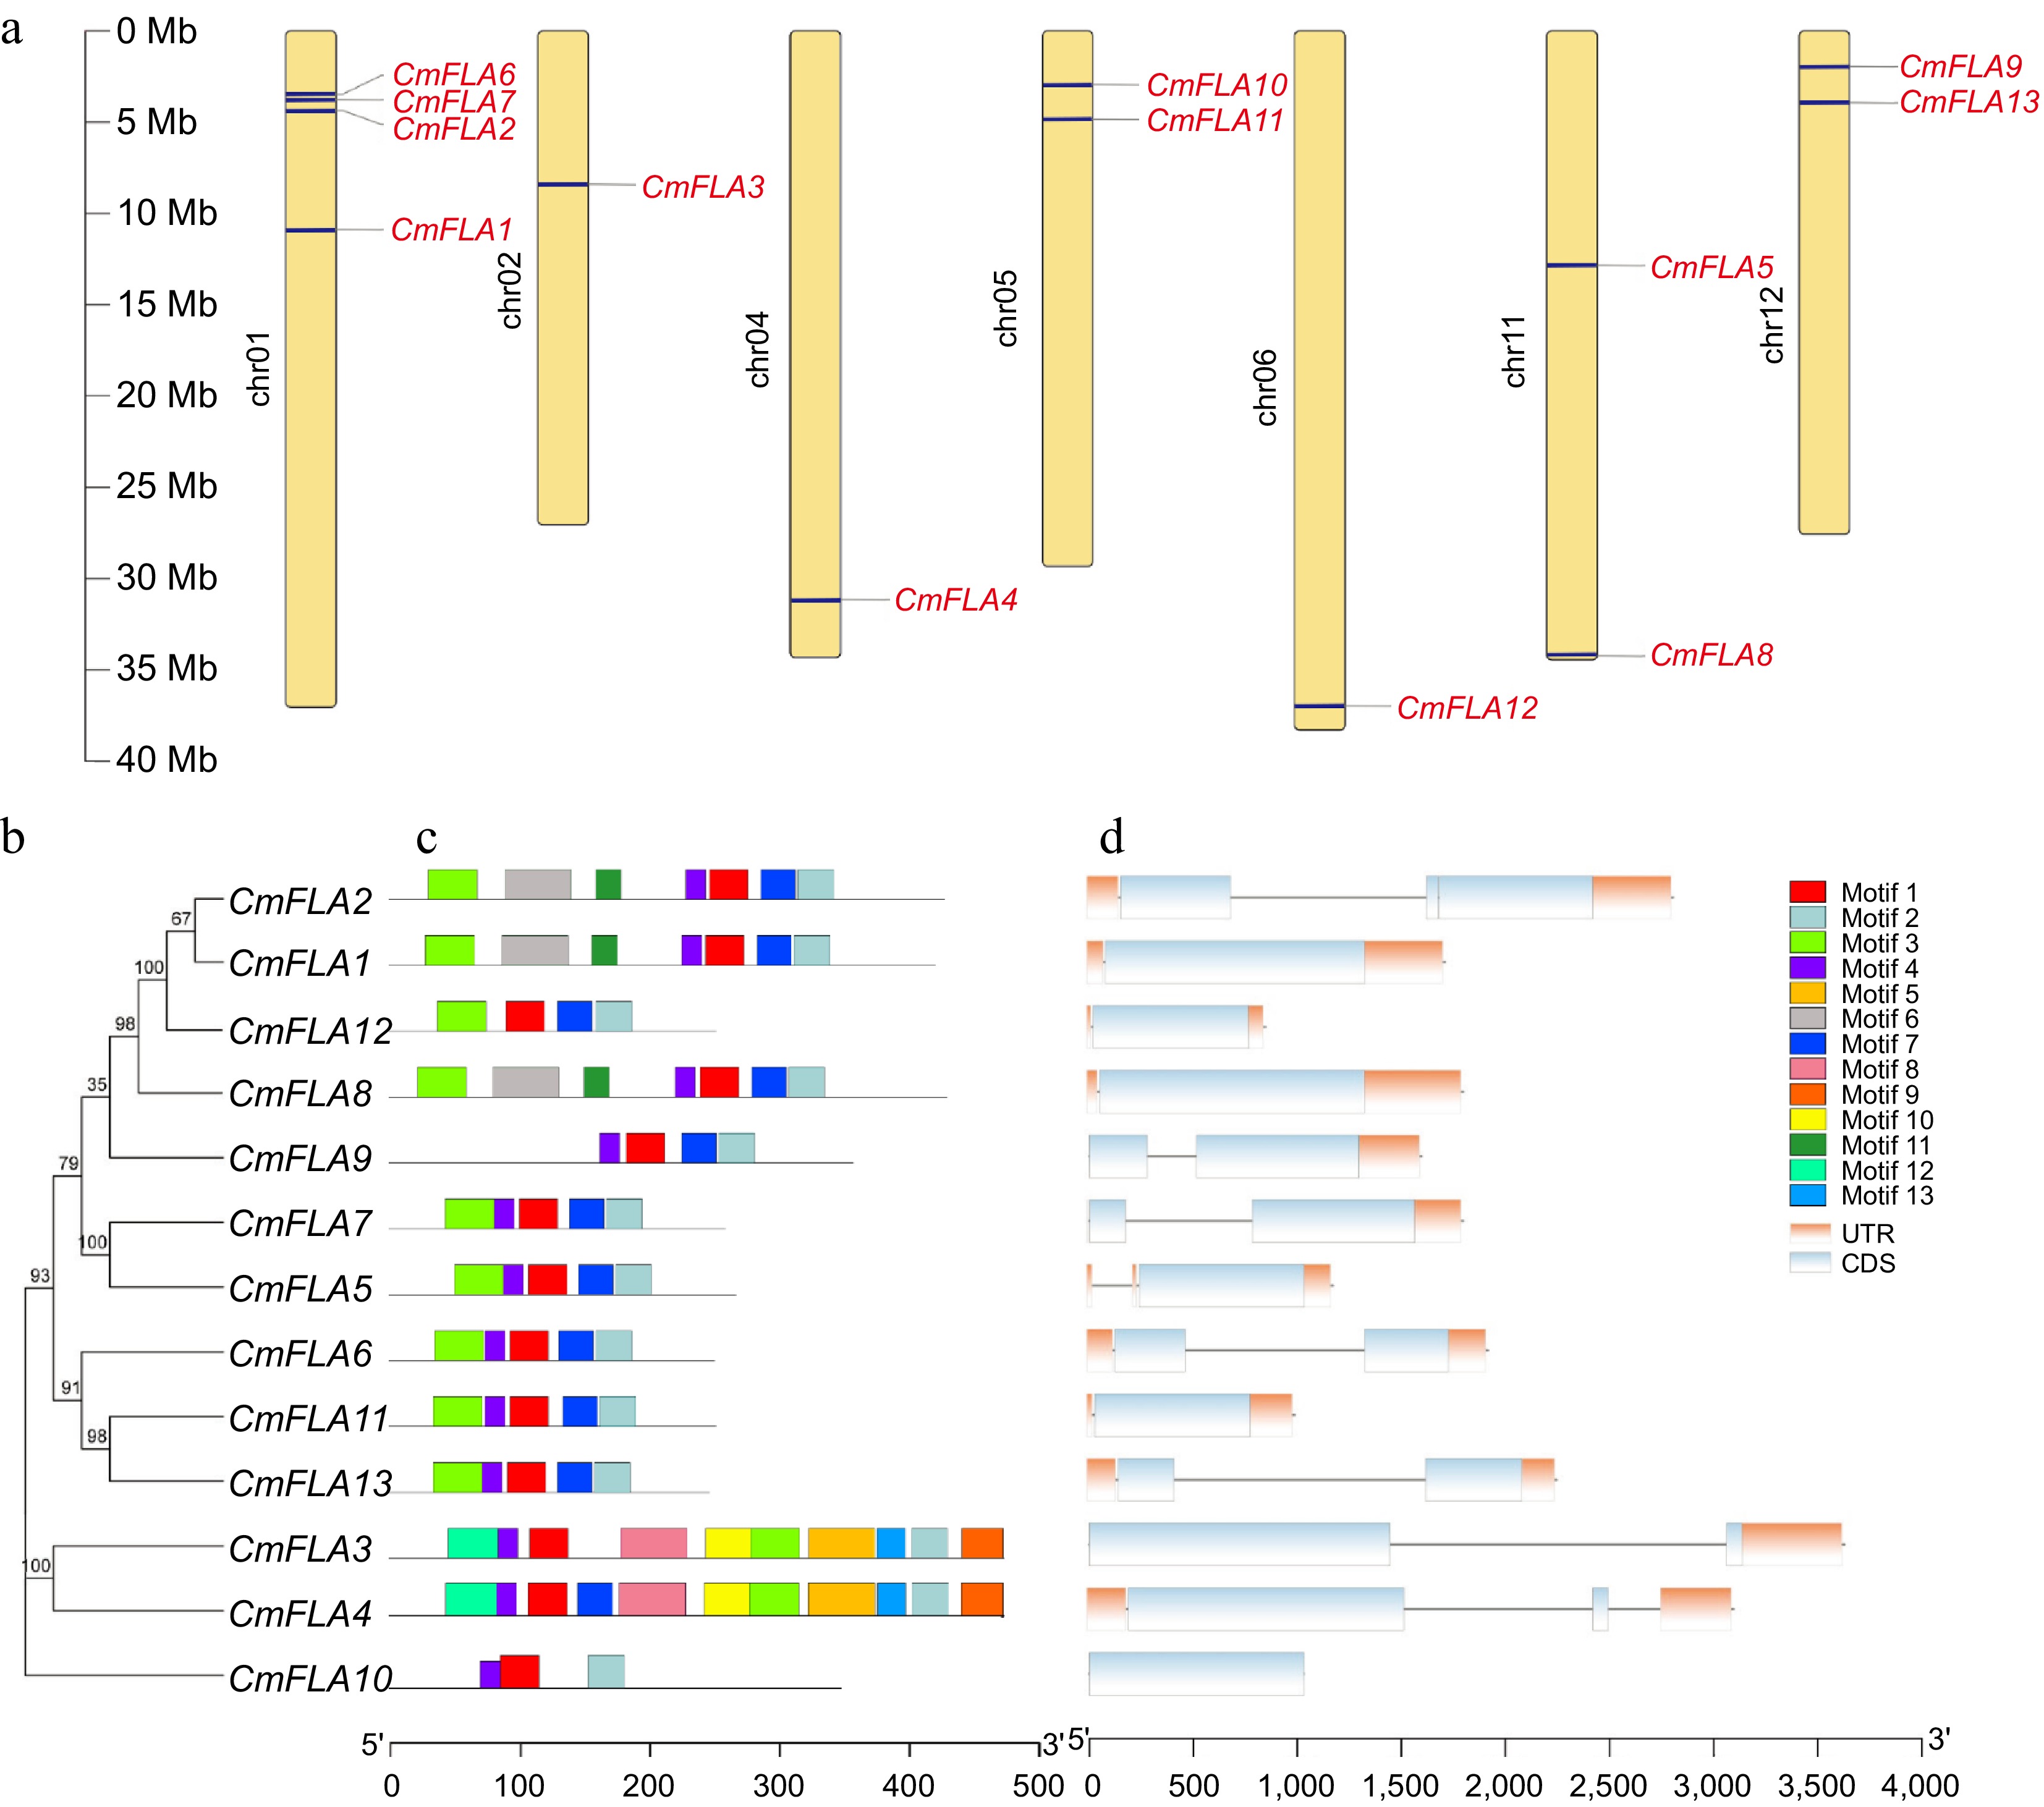
Figure 1.
Gene location, conserved motif, and gene structure analysis of CmFLAs. (a) Distribution of CmFLA genes on melon chromosomes. Thirteen genes were mapped to 7 out of 12 chromosomes. The dark blue lines represent the gene positions on the chromosome. The dark line in the left panel represents the chromosome scale. (b) The phylogenetic relationship among CmFLAs. (c) Conserved motif analysis of CmFLAs. Thirteen predicted motifs are represented by different colored boxes. The sequence information for each motif is provided in Supplementary Table S2. (d) Gene structure analysis of CmFLAs. Exons are denoted by light blue boxes, UTRs by orange boxes, and introns by gray lines.
-
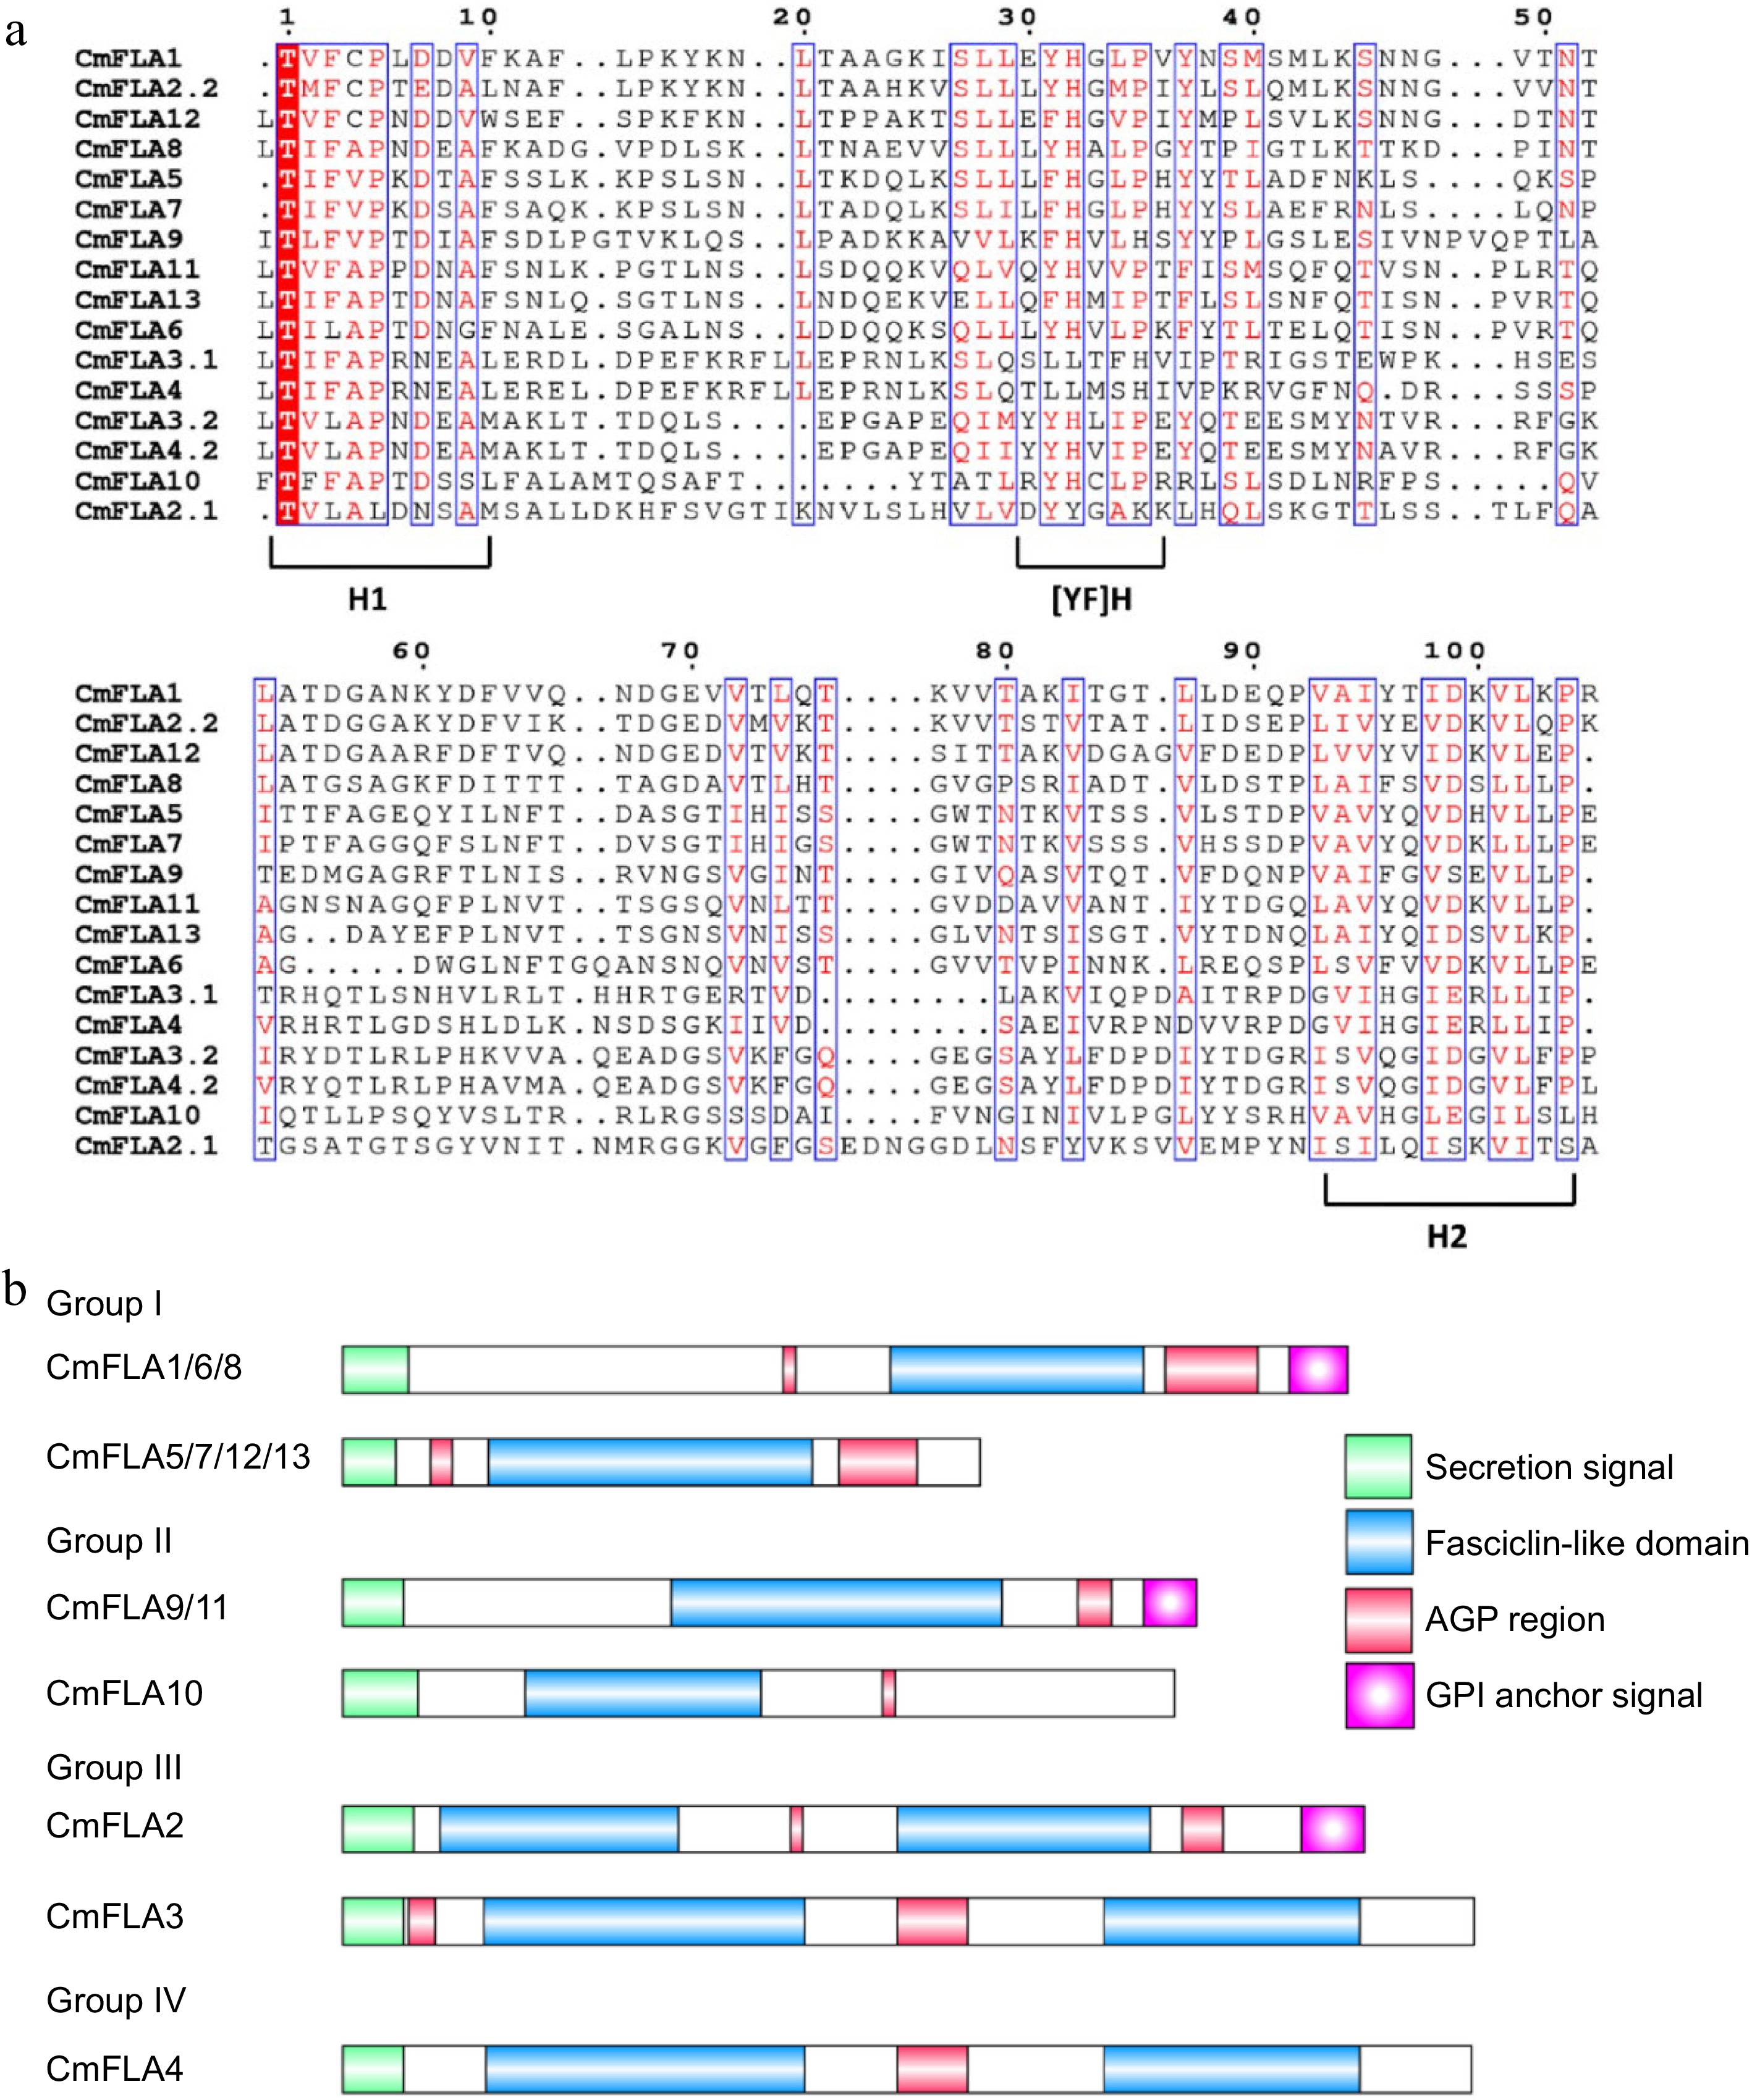
Figure 2.
Domain analysis of CmFLAs. (a) Multiple sequences alignment of the CmFLA FAS domains. Two FAS domains present in the protein. The domain closest to the N-terminus is indicated by .1, followed by .2. (b) Schematic representation of the CmFLAs deduced from DNA sequence. The FLAs are grouped into four (I–IV) based on the numbers of AGP-like regions and FAS domains. The indicated regions include the signal peptide (green), FAS-like domains (blue), AGP domain (red), and GPI-anchoring signal (purple box with a white point inside).
-
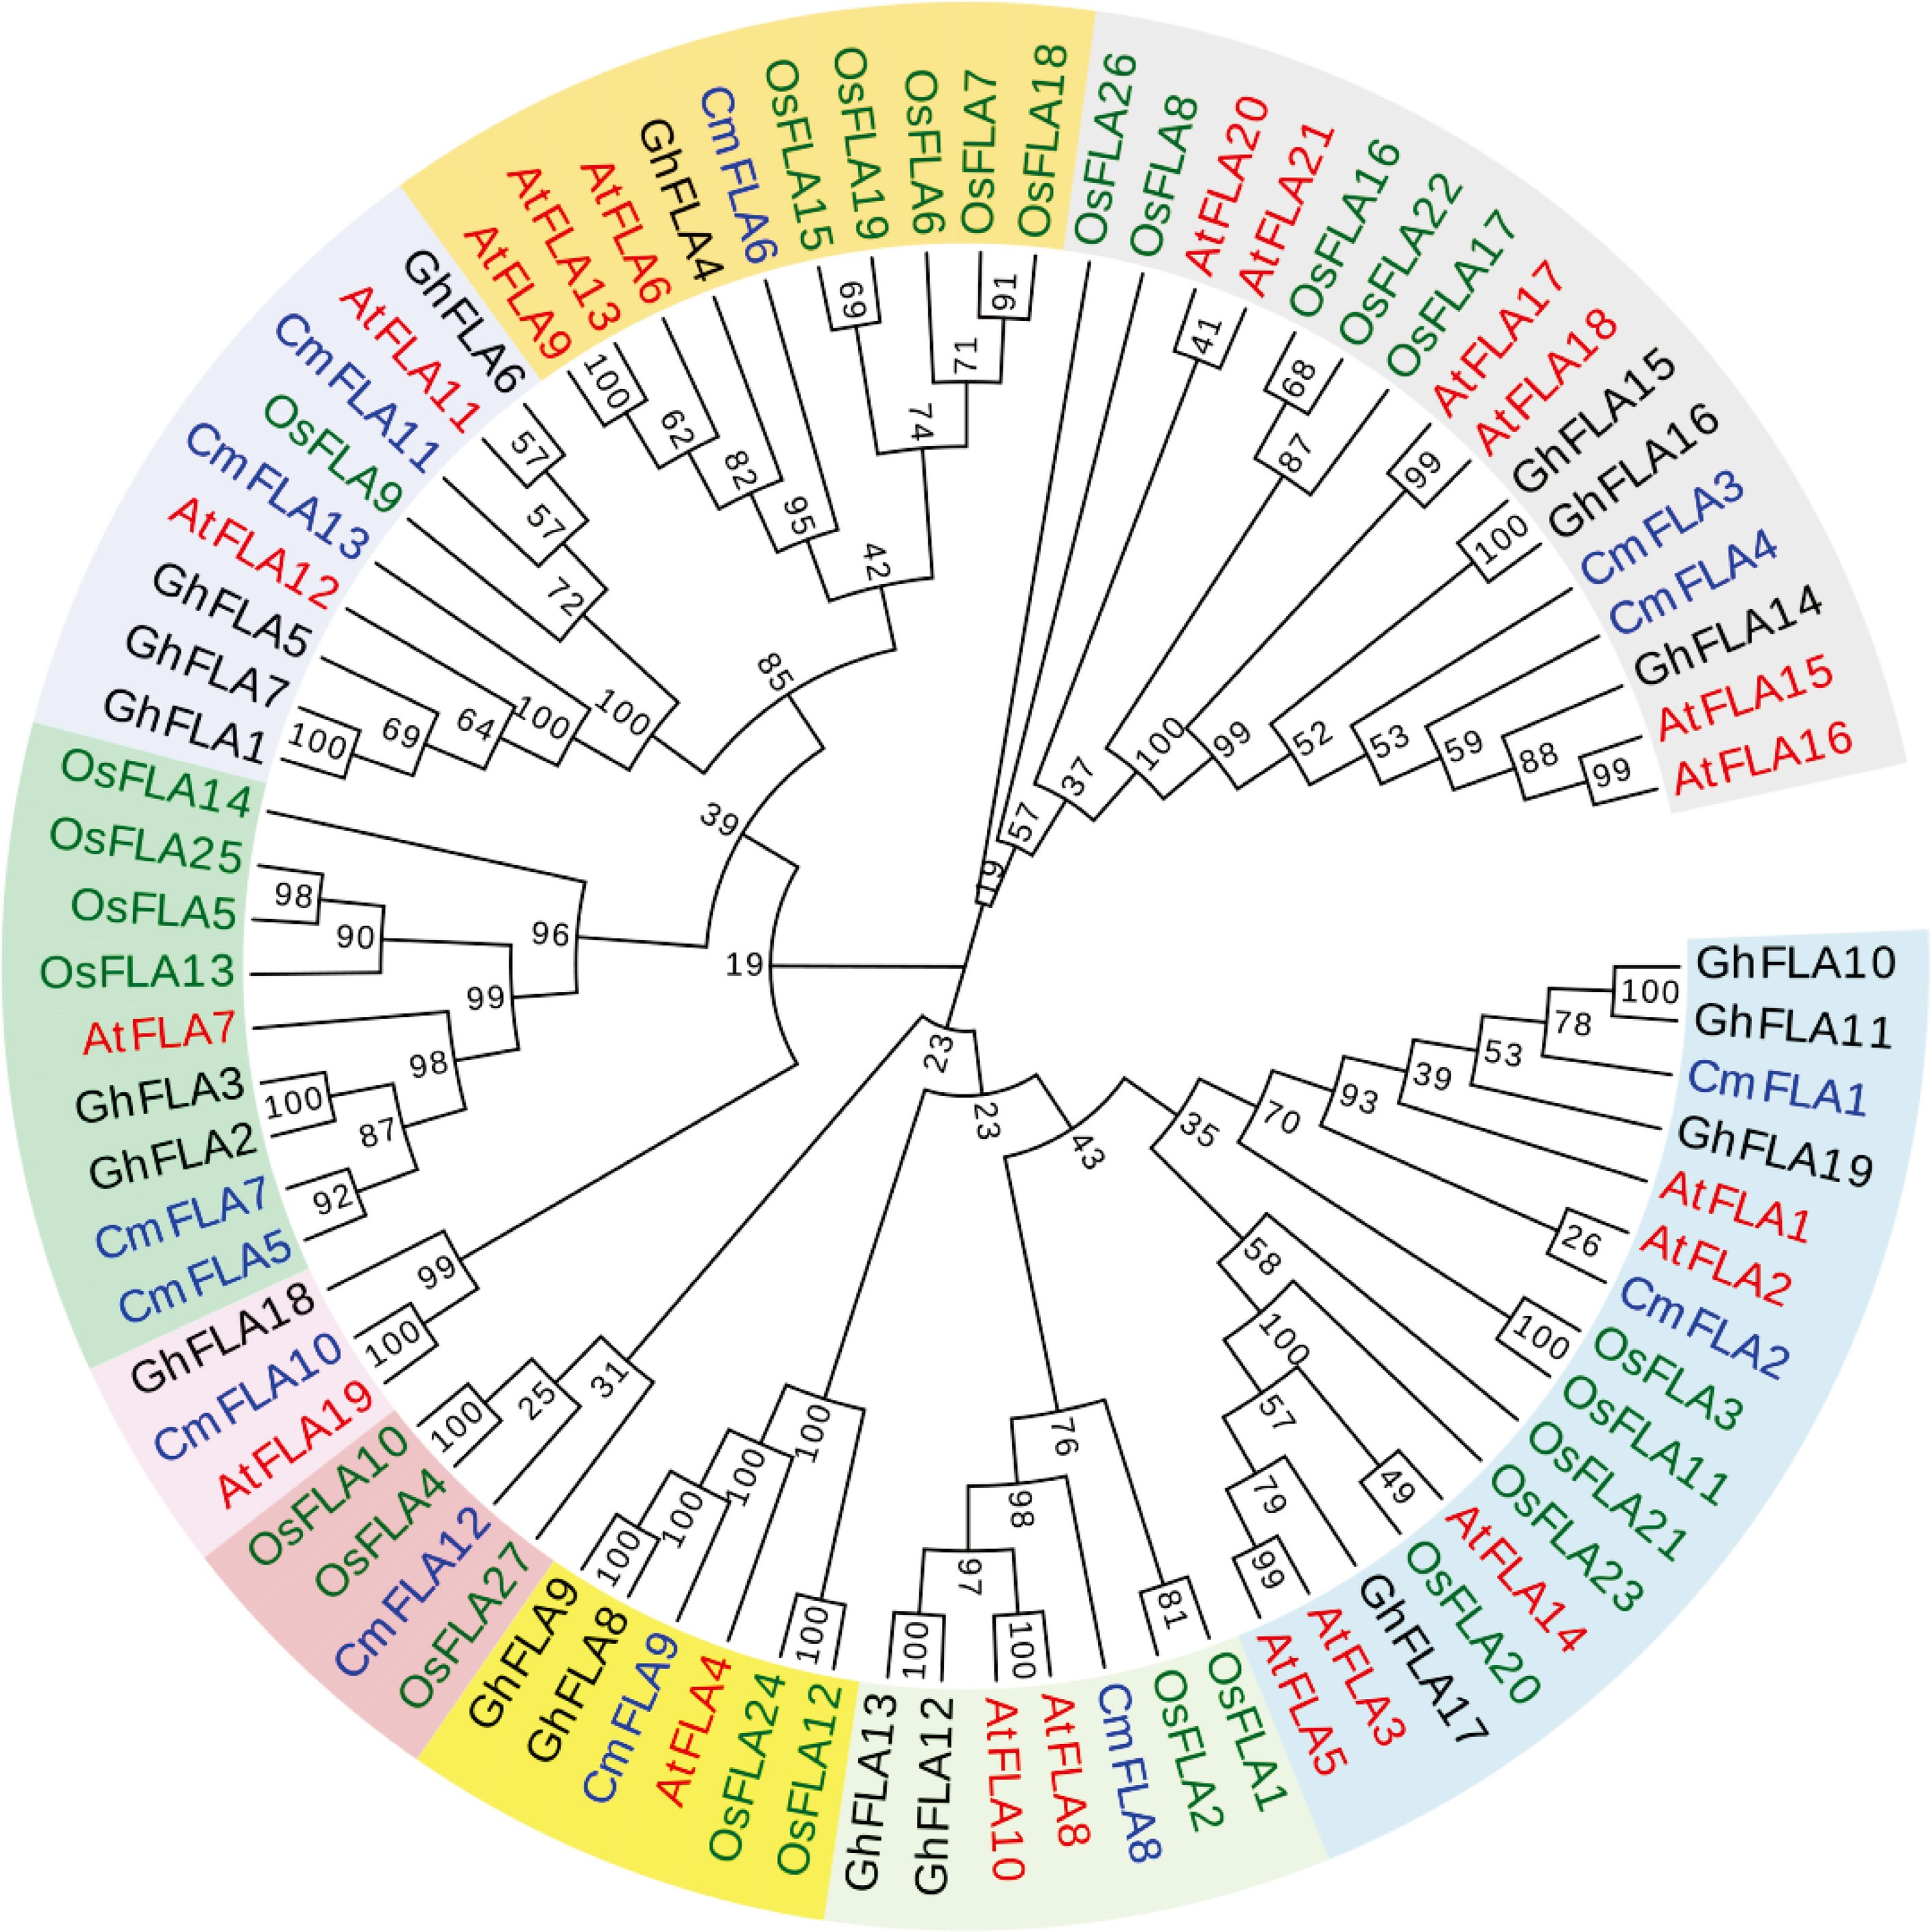
Figure 3.
Phylogenetic relationship of FLAs between melon and other species. Red color represents Arabidopsis thaliana (At); blue color represents Cucumis melon (Cm); green color represents Oryza sativa (Os); and black color represents Gossypium hirsutum (Gh). The phylogenetic tree was constructed using MEGA 7 software with the Neighbor-Joining method, employing a bootstrap value of 1,000 replicates. The GenBank accession numbers of the sequences were used for the analyses, as detailed in Supplementary Table S4.
-
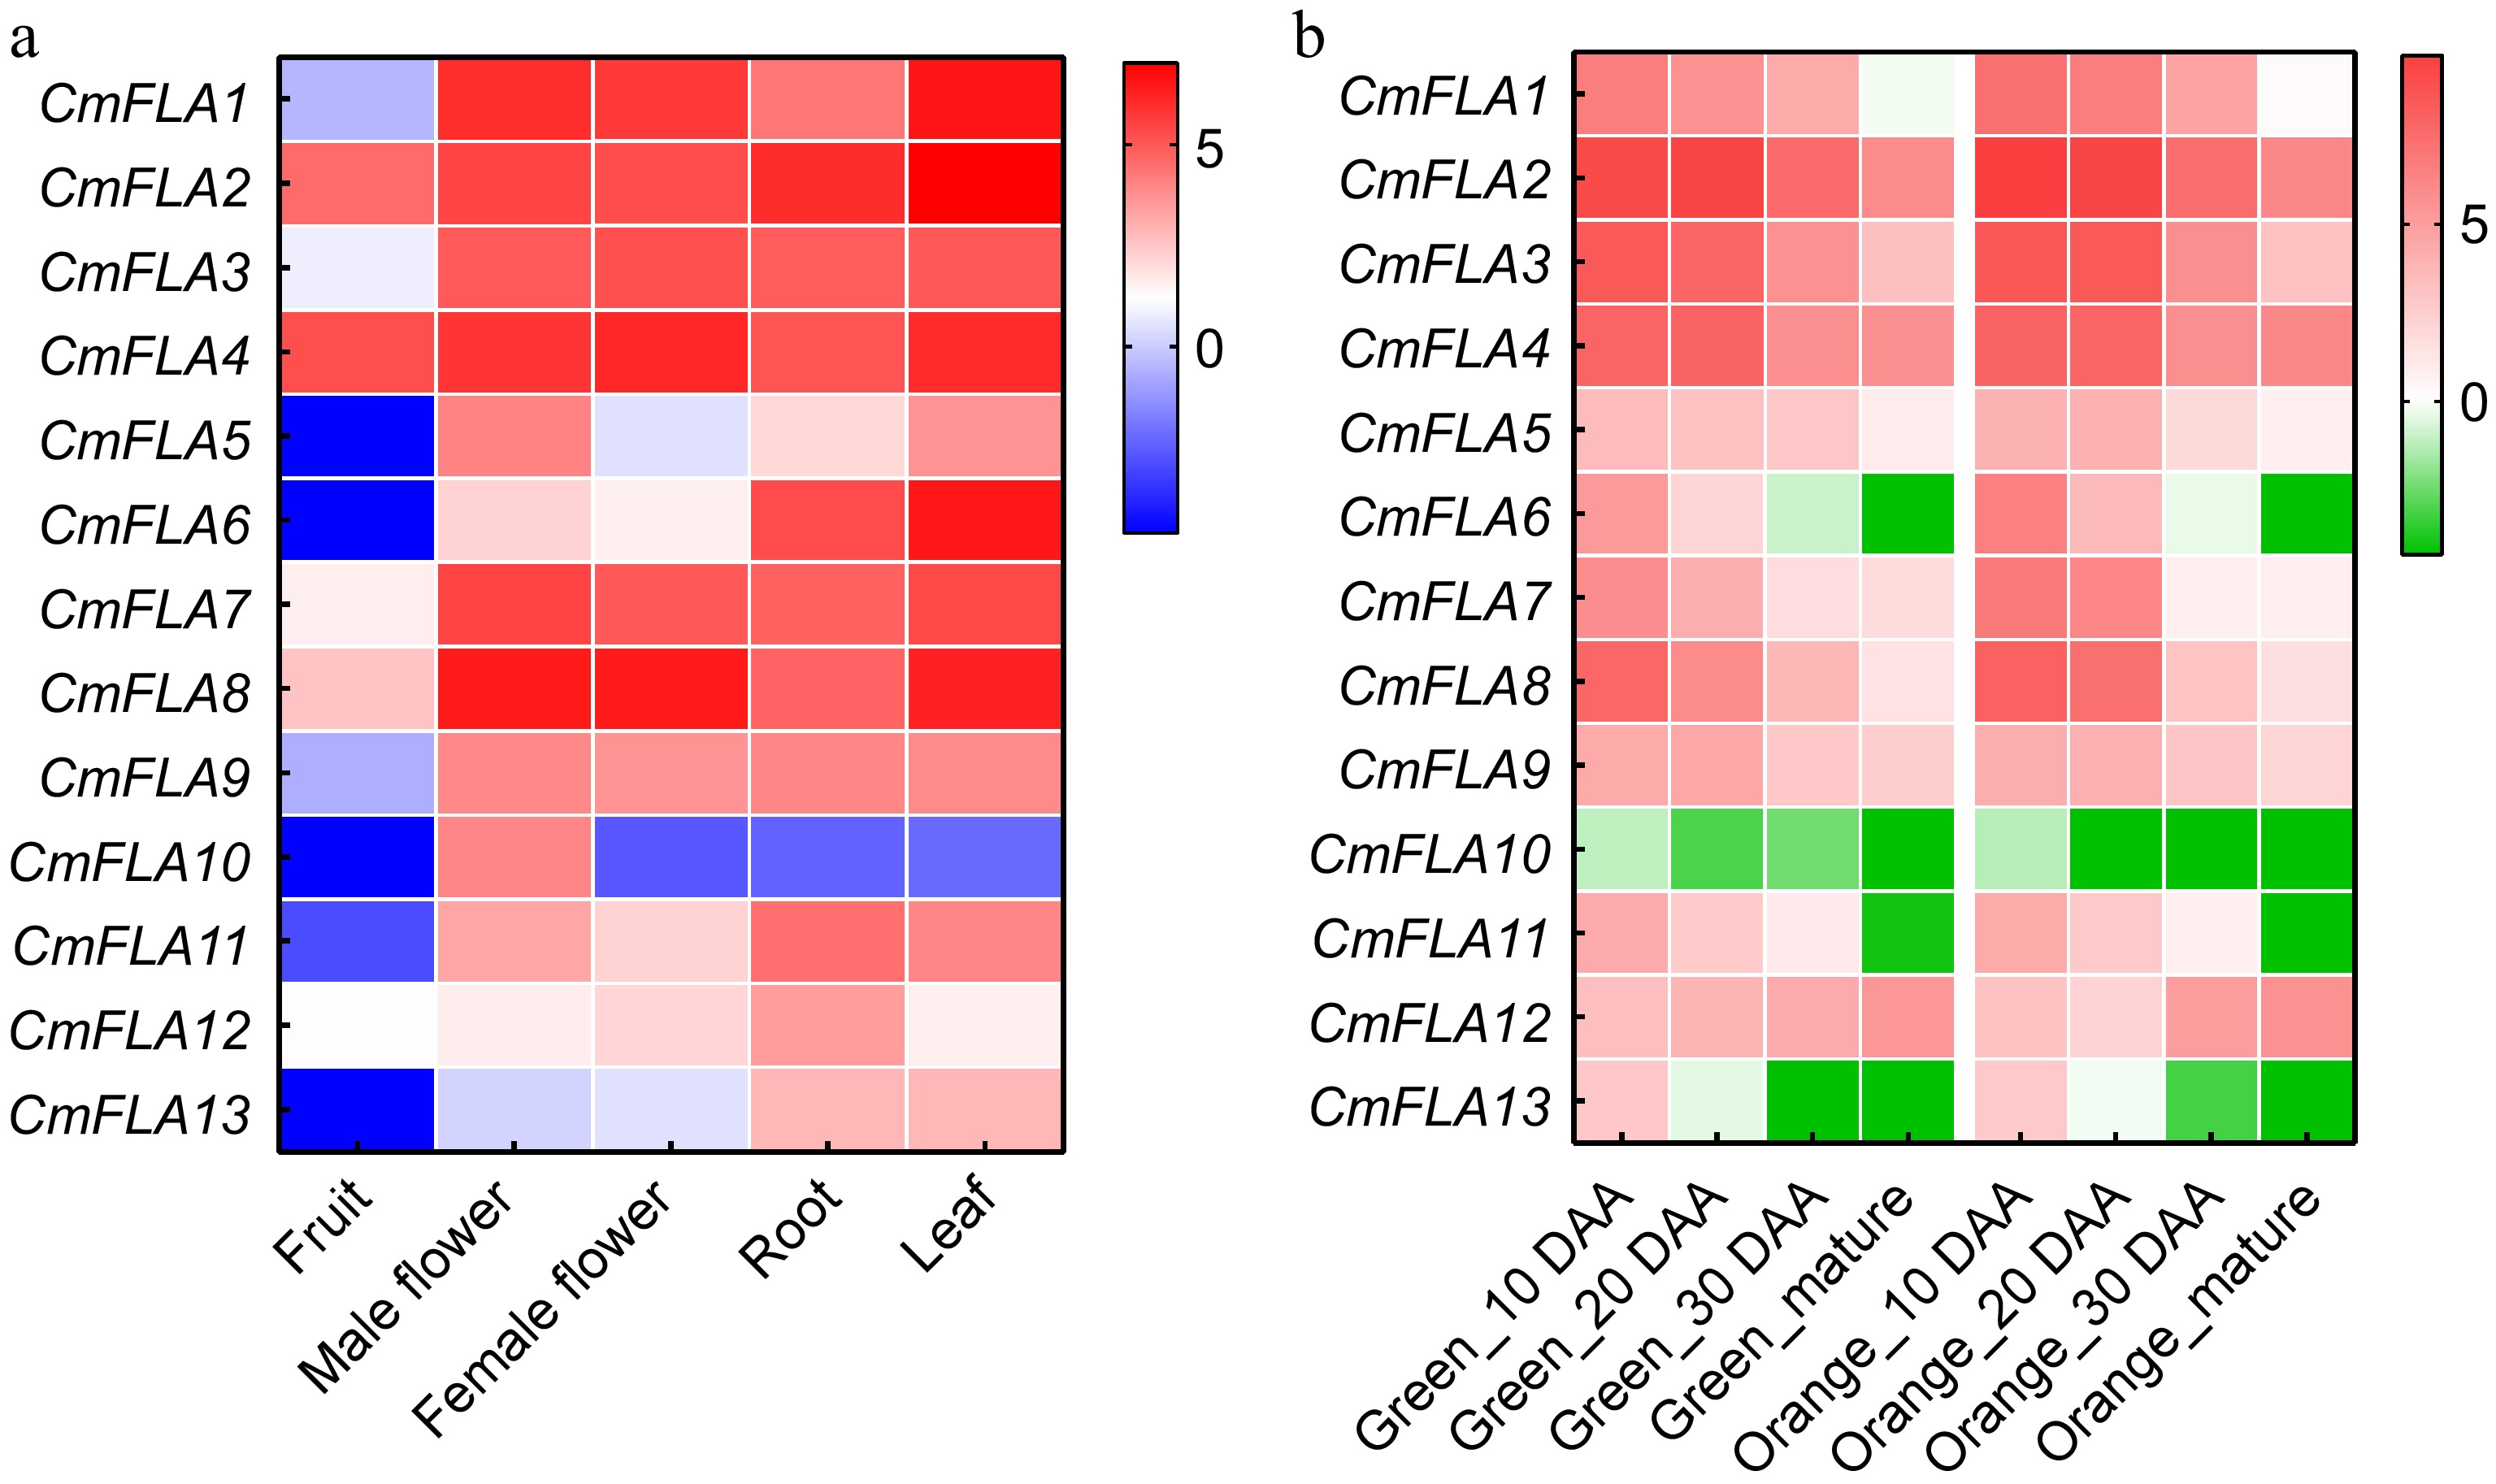
Figure 4.
Heatmaps show the expression analysis of CmFLA gene. (a) Expression profiles of CmFLA genes in different organs. Project: PRJNA383830. (b) Expression profiles of CmFLAs genes in fruit at different developmental stages. Expression was quantified on the indicated day after anthesis (DAA). Project: PRJNA286120. Scaled log2 expression values based on RNA-seq data are shown from blue to red, indicating low to high expression levels. The data were obtained from the Cucurbitgenomics database (
http://cucurbitgenomics.org/rnaseq/home ). -
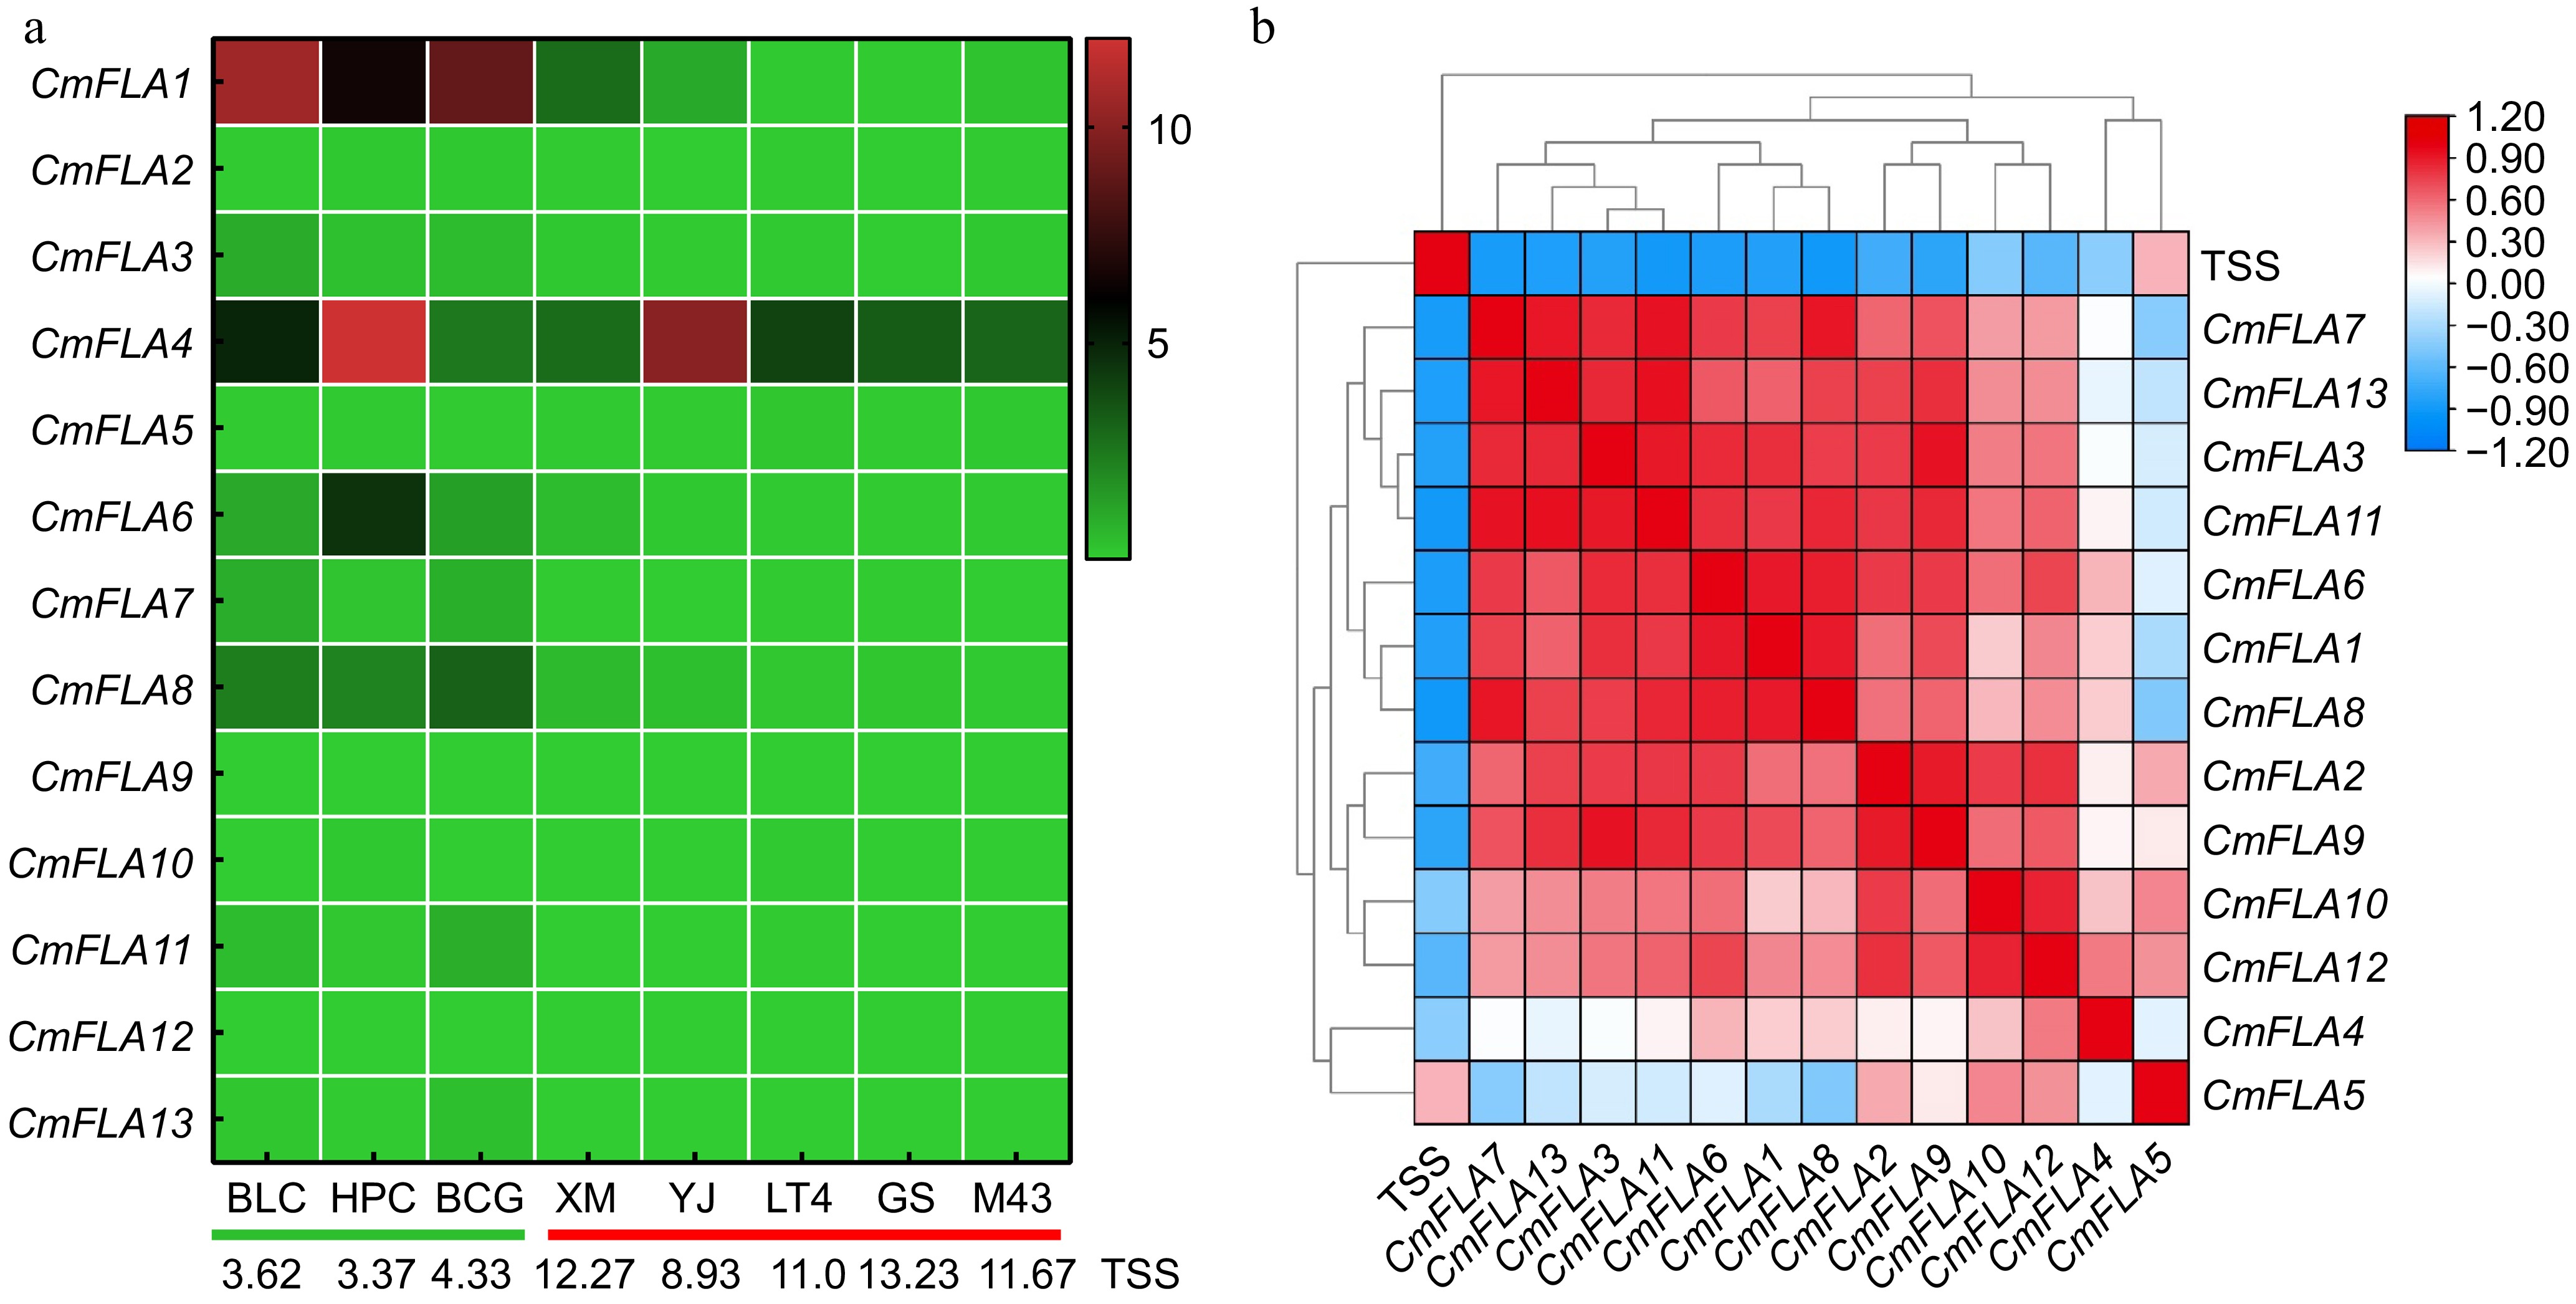
Figure 5.
Correlation analysis between total soluble solid contents (TSS) and gene expression of CmFLAs. (a) Heatmap of the CmFLA genes in melon fruit at 30 DAA from various cultivars obtained using qRT-PCR analysis. TUA (α-tubulin) was used as reference gene. Expression values based on qRT-PCR data are shown from green to red, indicating low to high expression. The values at the bottom of the figure indicate the TSS for each melon cultivars. The green line represents low TSS cultivars, and the red line represents high TSS cultivars. (b) TSS and gene expression correlation analysis in melon fruit at 30 DAA from various cultivars. Data are shown from blue to red, indicating low to high correlation.
-
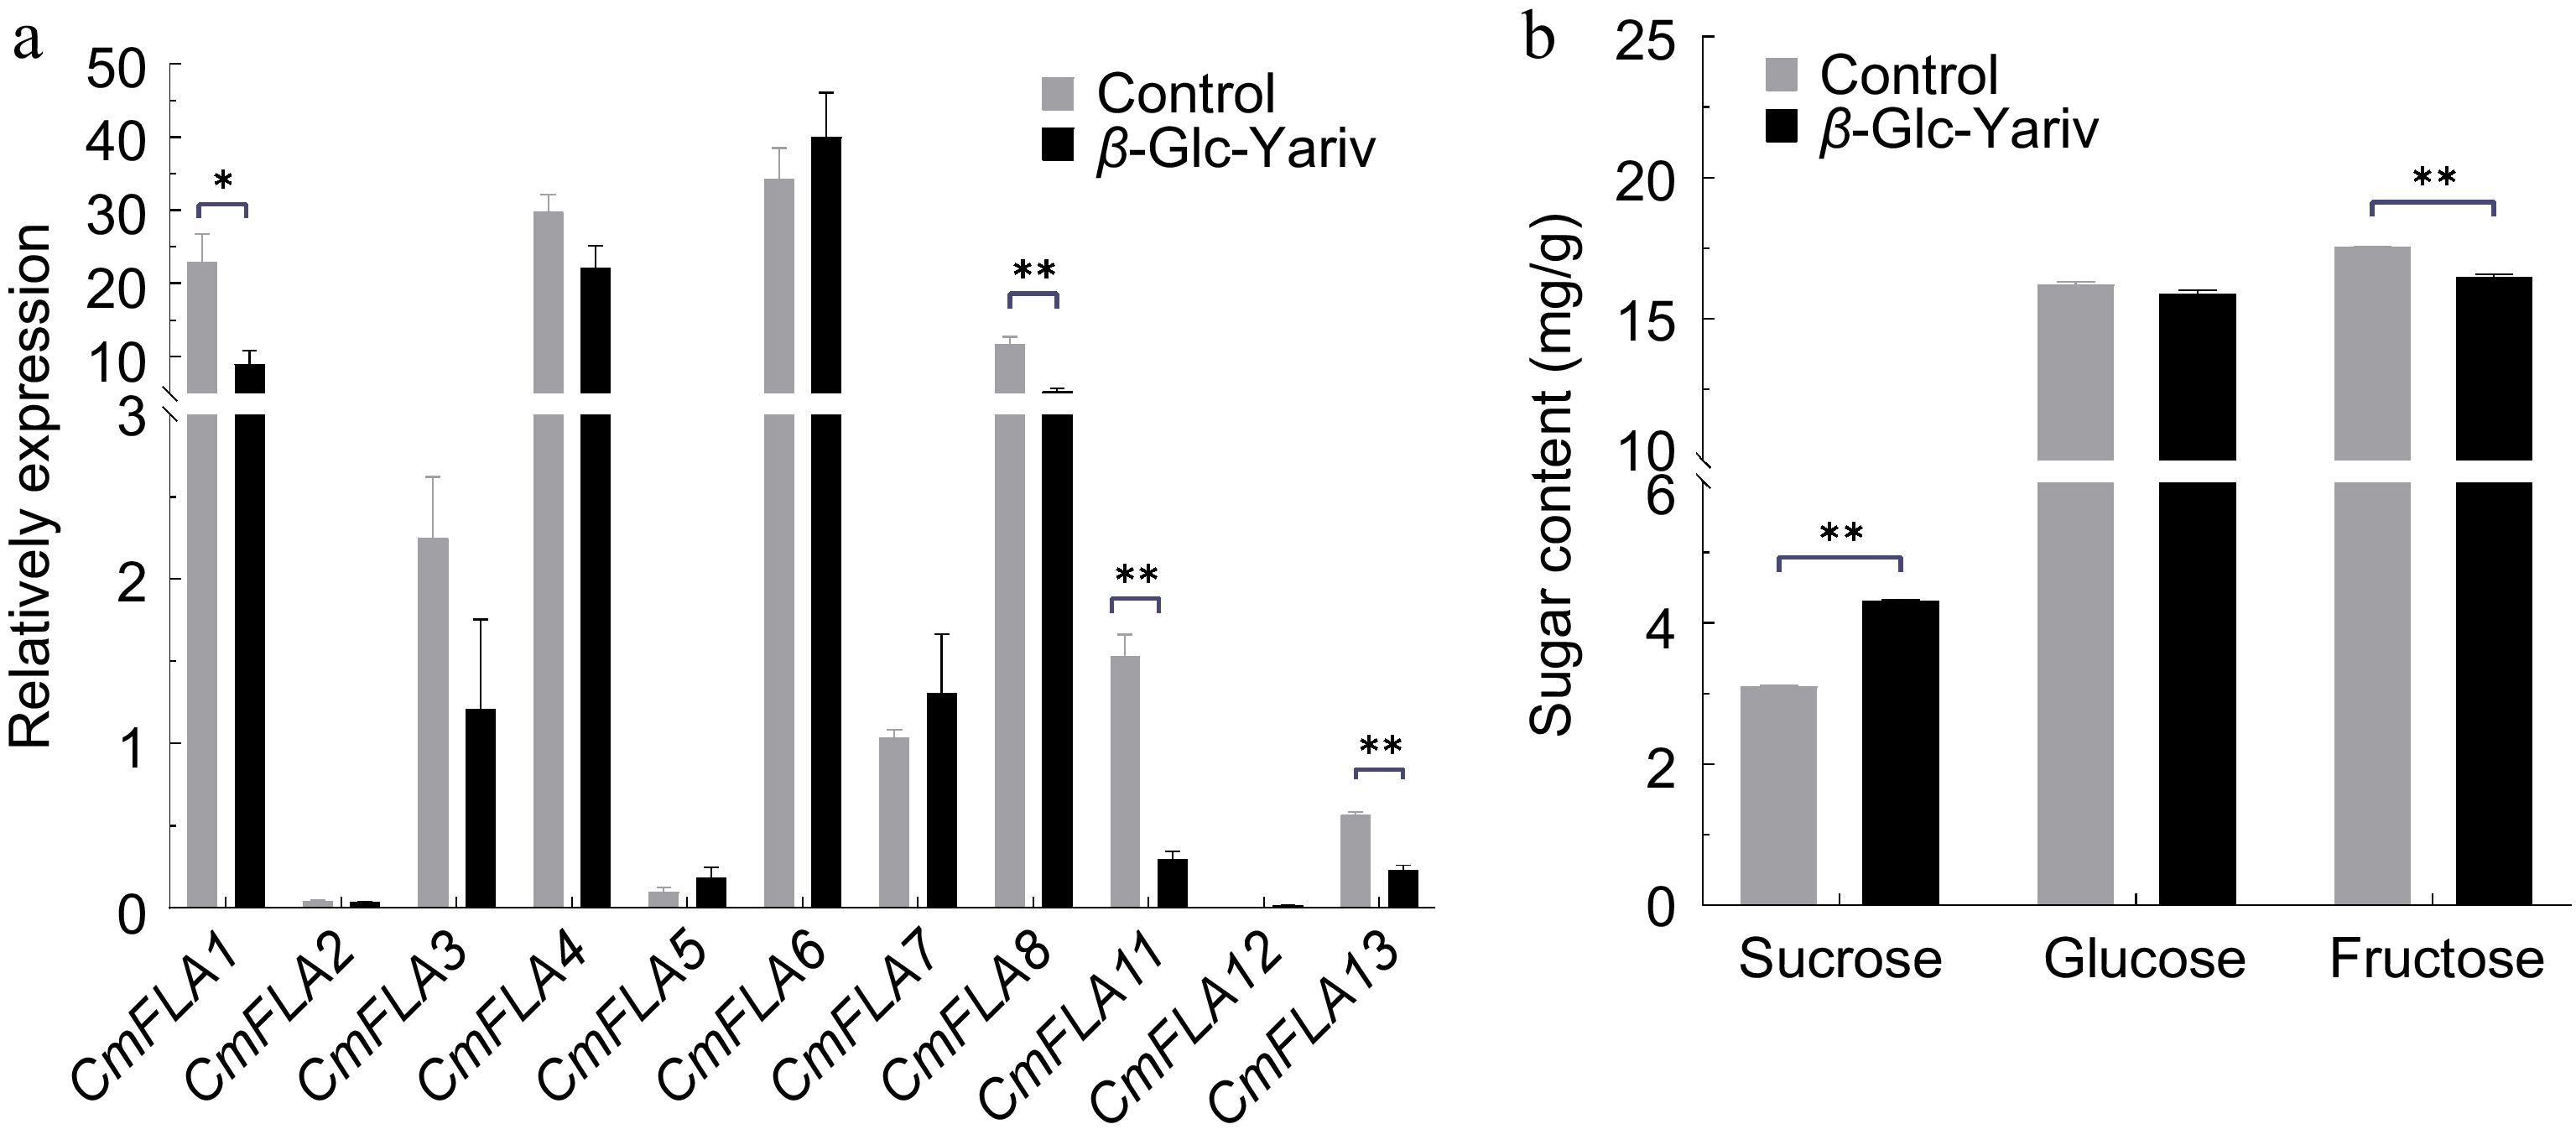
Figure 6.
Sugar content and gene expression of CmFLAs after β-Glc Yariv treatment in melon fruit. Melon fruits of the cv. 'BCG' at 20 DAA were sprayed with β-Glc Yariv solution. (a) Gene expression of CmFLAs after β-Glc Yariv treatment. TUA (α-tubulin) was used as reference gene. (b) Sugar content after β-Glc Yariv treatment. Water was used as the control. Data represent means of three biological replicates ± SE. Statistical significance was denoted as * p < 0.05, ** p < 0.01 by t-test.
-
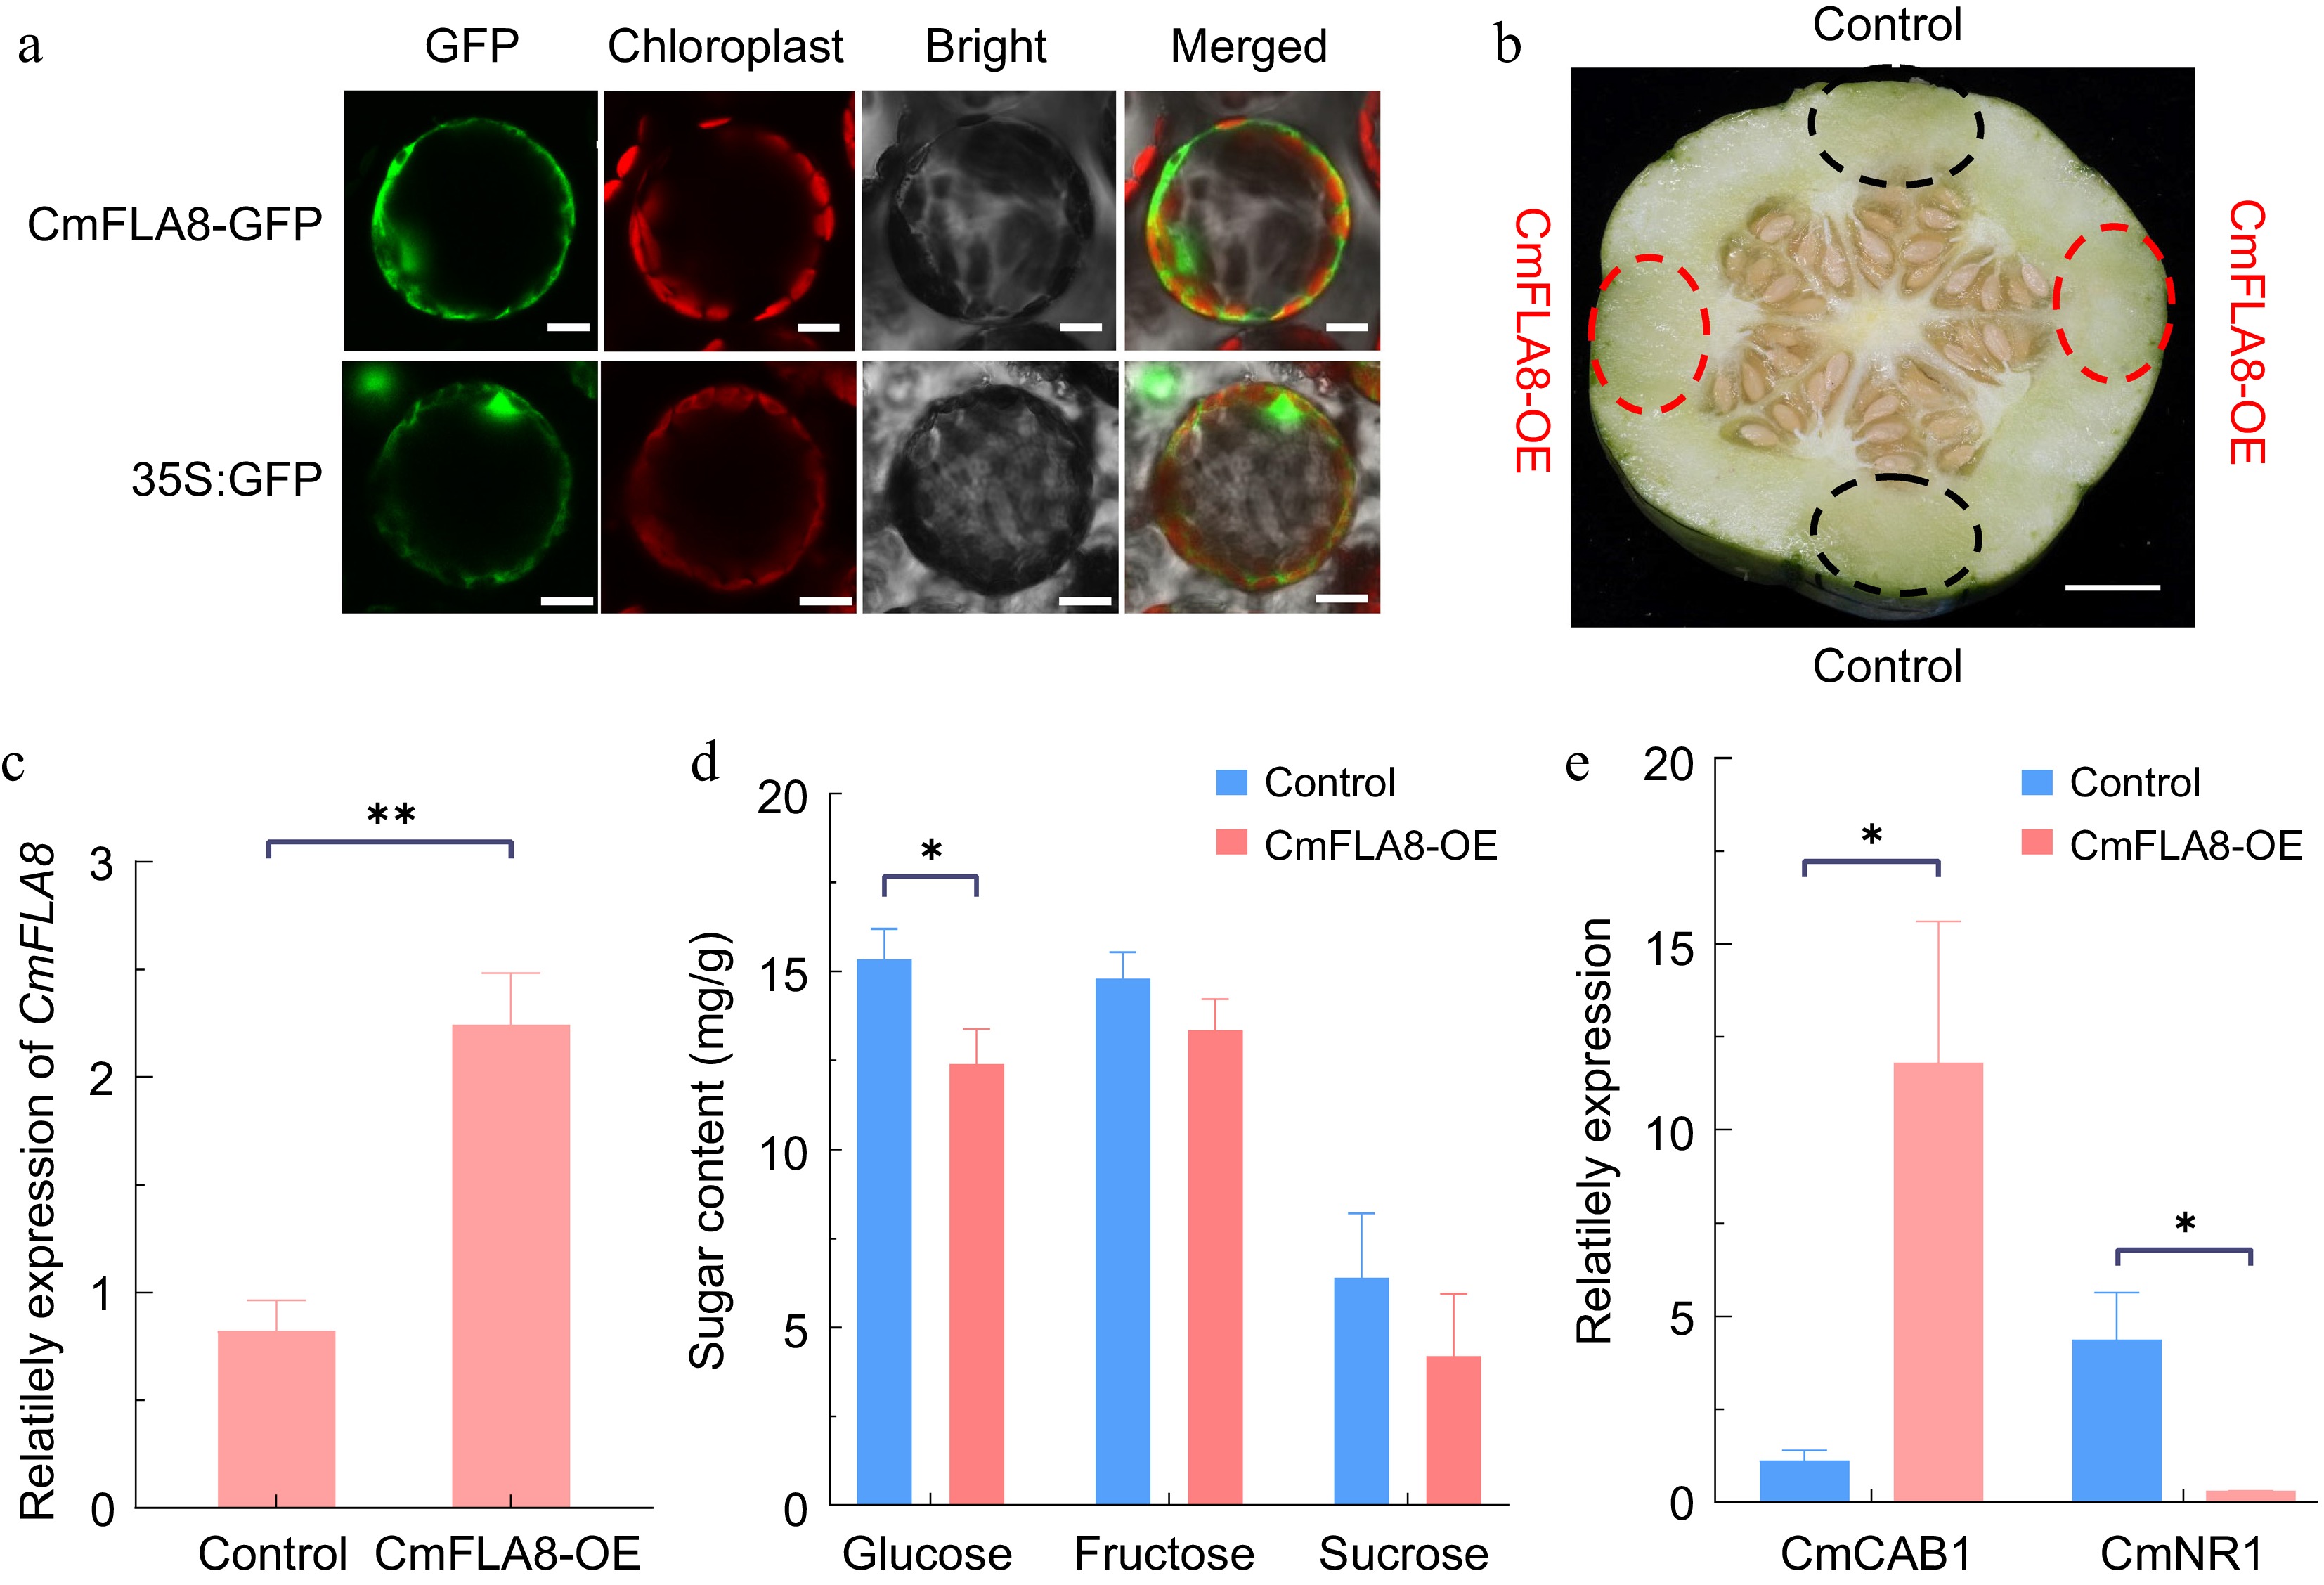
Figure 7.
Gene function verification of CmFLA8. (a) Subcellular localization of CmFLA8 in N. benthamiana protoplasts. Scale bars =10 μm. (b) Transient expression of CmFLA8-OE in melon fruit. CmFLA8-OE agrobacterium cells were injected into the melon tissue, with the pHELLSGATE8-HA vector used as a control. The dotted circles indicate the injection sites, scale bar = 1 cm. (c) Relative expression of CmFLA8 in CmFLA8-OE melon fruit. Reference gene: Tubulin. (d) Sugar concentrations in CmFLA8-OE melon fruit. (e) qRT-PCR analysis of CAB1 and NR1 expression in melon fruit. Reference gene: Tubulin. Empty vector, control fruit expressed the empty pHELLSGATE8-HA vector. Data represent means of four replicates ± SE. * p < 0.05 and ** p < 0.01 by t-test.
-
Protein name Gene ID Chromosome location Strand Size (aa) FASs AGPs GPI SP Possible cleavage site CmFLA1 MELO3C024938.2 Chr01: 10881922, 10883631 − 414 1 2 Y Y 28~29 CmFLA2 MELO3C024192.2 Chr01: 4351699, 4354505 + 421 2 2 Y Y 30~31 CmFLA3 MELO3C015093.2 Chr02: 8392291, 8395918 + 466 2 2 N Y 26~27 CmFLA4 MELO3C009567.2 Chr04: 31139948, 31143044 + 465 2 1 N Y 26~27 CmFLA5 MELO3C019361.2 Chr11: 12828056, 12829226 − 263 1 2 N Y 23~24 CmFLA6 MELO3C018862.2 Chr01: 3459779, 3461694 + 247 1 2 Y Y 18~19 CmFLA7 MELO3C018888.2 Chr01: 3762092, 3763889 − 255 1 2 N Y 23~24 CmFLA8 MELO3C022507.2 Chr11: 34215140, 34216937 − 423 1 2 Y Y 18~19 CmFLA9 MELO3C020643.2 Chr12: 1931250, 1932848 + 352 1 1 Y Y 26~27 CmFLA10 MELO3C014385.2 Chr05: 2950327, 2951358 + 343 1 1 N Y 32~33 CmFLA11 MELO3C014248.2 Chr05: 4832311, 4833298 − 248 1 1 N Y 23~24 CmFLA12 MELO3C014107.2 Chr06: 36961275, 36962122 + 248 1 2 N Y 18~19 CmFLA13 MELO3C005051.2 Chr12: 3927483, 3929729 + 243 1 2 N Y 22~23 SP: Signal Peptide; aa: amino acid. Table 1.
Putative FLA genes identified in the genome of Cucumis melo. L.
-
Protein name MW (kDa) pI GRAVY PAST Number of
N-glycosylationNumber of
O-glycosylationPredicated subcellular localization CmFLA1 44.15 5.88 0.013 32.6% 6 14 Chloroplast CmFLA2 45.02 5.45 −0.011 31.5% 5 14 Chloroplast CmFLA3 51.48 6.18 −0.312 29.4% 2 15 Vacuolar CmFLA4 51.13 6.03 −0.287 29.4% 2 20 Chloroplast CmFLA5 27.92 5.57 0.197 38.4% 3 16 Cytoplasmic CmFLA6 25.81 5.62 0.071 33.6% 4 5 Chloroplast CmFLA7 26.91 5.32 0.139 40.0% 4 14 Plasma membrane CmFLA8 43.32 5.63 0.218 43.4% 5 35 Plasma membrane CmFLA9 37.47 5.06 0.319 33.0% 5 11 Extracellular CmFLA10 37.41 5.83 −0.041 38.5% 2 25 Chloroplast CmFLA11 25.94 5.14 0.028 35.6% 4 16 Chloroplast CmFLA12 26.27 4.23 0.087 34.8% 1 15 Chloroplast CmFLA13 26.05 4.73 −0.040 33.0% 4 6 Extracellular Table 2.
Characteristics of FLA proteins in melon.
Figures
(7)
Tables
(2)