-
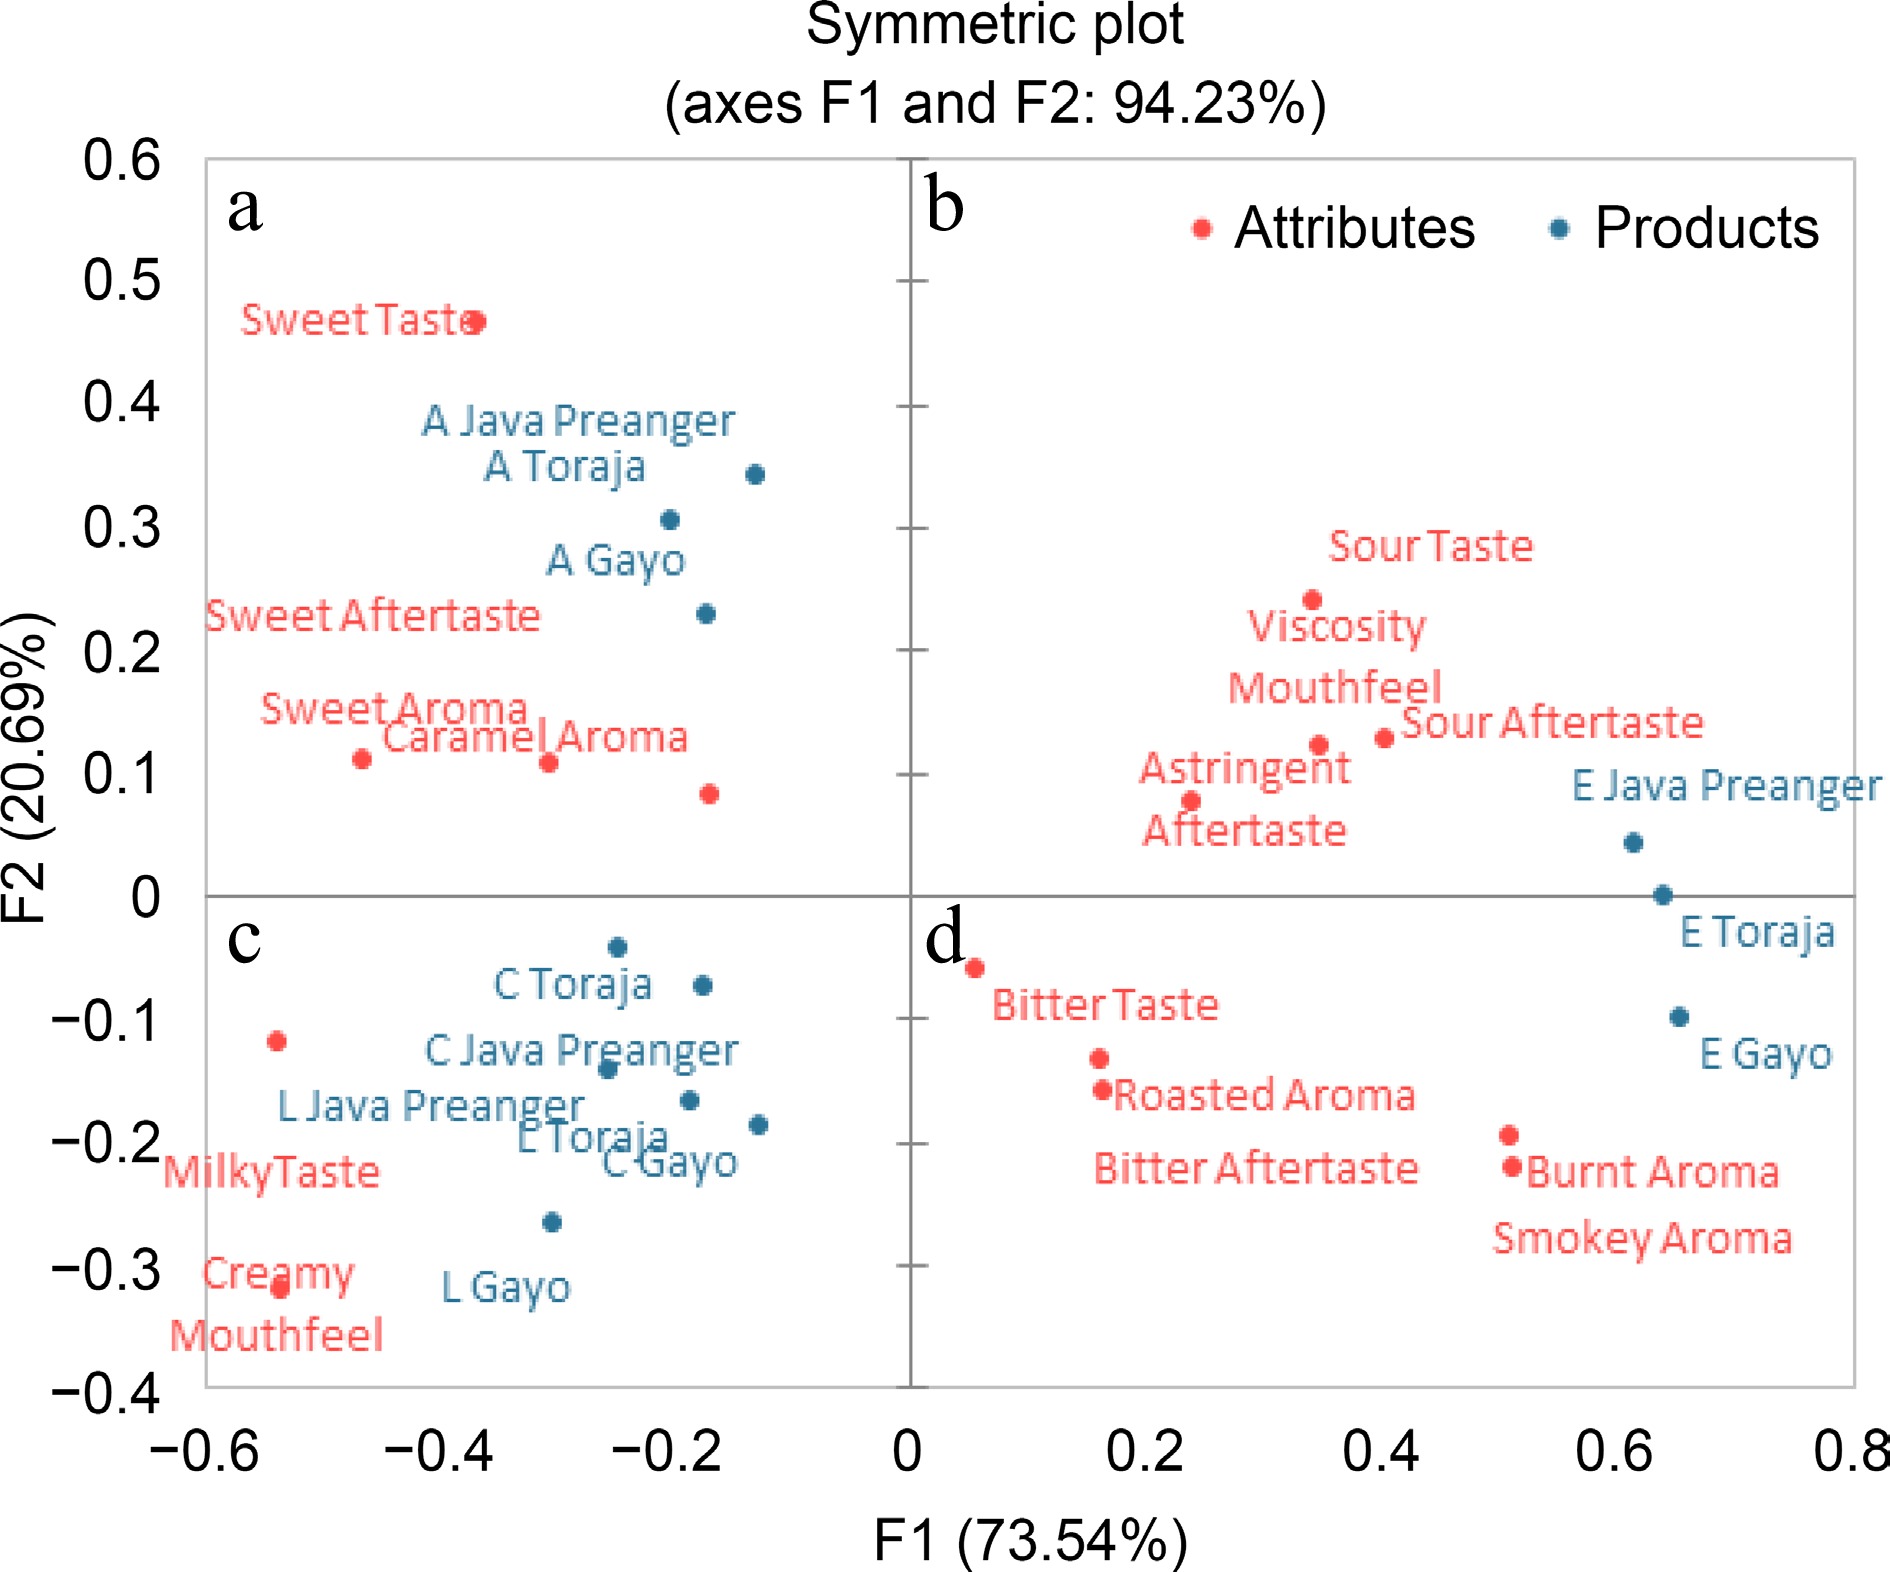
Figure 1.
PCA biplot of check-all-that-apply (CATA) of espresso-based Arabica coffee brews. This figure is a result of a CATA analysis involving 30 consumers. Coffee brews were prepared using three espresso-based brewing methods. (E) espresso, (C) cappuccino, (L) latte, and (A) palm sugar milk coffee.
-
Bean origins Brews Caffeoylquinic acid content (mg/100 mL) Alkaloids content (mg/100 mL) Antioxidant activity
(mg TEAC/100 mL)3-CQA 4-CQA 5-CQA 3.5-diCQA Trigonelline Theobromine Caffeine DPPH FRAP Java Preanger Espresso 107.2 ± 1.5a.C 135 ± 4.4a.C 313 ± 8.3a.C 8.2 ± 0.7a.C 284.1 ± 3.8a.B 57.7 ± 2.1b.C 393.3 ± 7.1a.D 909.5 ± 77.1c.D 2273.1 ± 123.5c.D Java Preanger Palm sugar milk coffee 12.3 ± 1a.B 14.9 ± 1.5a.B 35.1 ± 2.1a.AB 2 ± 0.1a.B 57.2 ± 1a.A 9.8 ± 0.1b.B 103.3 ± 4.5a.C 150.4 ± 14.89c.A 712.8 ± 58.1c.B Java Preanger Cappuccino 9 ± 0.5a.B 12 ± 0.6a.B 27.2 ± 1.2a.B 1.6 ± 0.1a.B 43.5 ± 4.4a.A 7 ± 0.7b.B 78.4 ± 3.5a.B 730.8 ± 66.2c.C 661.5 ± 43.4c.C Java Preanger Latte 5.1 ± 0.3a.A 5.9 ± 0.4a.A 14.7 ± 0.3a.A 1 ± 0.1a.A 26.3 ± 1.5a.A 2.3 ± 0.4b.A 43.2 ± 1.7a.A 578.9 ± 53.7c.B 390.2 ± 26.8c.A Gayo Espresso 103.5 ± 1.4a.C 128.9 ± 1.9a.C 283.3 ± 3.4a.C 12.6 ± 0.5a.C 311.3 ± 7.7b.B 14.5 ± 0.8a.C 489.3 ± 5b.D 607.2 ± 55.4b.D 2155.4 ± 103.7b.D Gayo Palm sugar milk coffee 8.7 ± 0.5a.B 10.5 ± 0.6a.B 24.2 ± 2.1a.AB 1.7 ± 0.1a.B 68.6 ± 4.9b.A 0.3 ± 0a.B 105 ± 4.2b.C 96.2 ± 8.8b.A 616.4 ± 21.6b.B Gayo Cappuccino 11.8 ± 1a.B 14.8 ± 0.9a.B 33.9 ± 2.6a.B 2.1 ± 0a.B 47.1 ± 1.3b.A 5.6 ± 0.4a.B 75.2 ± 2.3b.B 411.8 ± 38.4b.C 590.3 ± 55.7b.C Gayo Latte 2.9 ± 0.2a.A 3.2 ± 0.2a.A 28.8 ± 0.7a.A 0.8 ± 0a.A 26.1 ± 1.7b.A 2.2 ± 0.1a.A 45.7 ± 2.6b.A 557.7 ± 47.7b.B 394.2 ± 22.4b.A Toraja Espresso 121.2 ± 3.8a.C 143.3 ± 3.9a.C 293.8 ± 7.1a.C 6.5 ± 0a.C 290.4 ± 1.6a.B 7.7 ± 0.8a.C 434.7 ± 9.2a.D 508.3 ± 49.5a.D 2019.7 ± 201.1a.D Toraja Palm sugar milk coffee 8.9 ± 0.7a.B 11.4 ± 0.5a.B 26.9 ± 2.4a.AB 1.6 ± 0.1a.B 69.6 ± 3.9a.A 10.1 ± 0.6a.B 102.2 ± 5.2a.C 122.3 ± 9.3a.A 452.6 ± 4a.B Toraja Cappuccino 9.2 ± 0.6a.B 11.3 ± 0.3a.B 25.6 ± 0.6a.B 1.6 ± 0a.B 52.1 ± 2.3a.A 8.2 ± 0.1a.B 77.7 ± 6.3a.B 437.3 ± 168.5a.C 590 ± 39.7a.C Toraja Latte 2.8 ± 0.1a.A 3.8 ± 0.1a.A 10.4 ± 0.1a.A 0.8 ± 0a.A 27.3 ± 2.5a.A 3.2 ± 0.2a.A 40 ± 2.6a.A 102.5 ± 9a.B 394.3 ± 29.3a.A The values for caffeoylquinic acids and alkaloids were expressed as the average and standard deviation based on three data points. The values for antioxidant activities were expressed as the average and standard deviation based on four data points. Small case letters (a−c) represent the significant effect of bean origin on observed parameters (p < 0.05). Capital letters (A−D) represent the significant effect of brewing methods on observed parameters (p < 0.05). Table 1.
Bioactive compounds and antioxidant activity of espresso-based Arabica coffee brews.
-
Bioactive components Correlation coefficient value DPPH FRAP CQAs 0.543 0.991 Alkaloids 0.482 0.989 Correlation coefficient values (+1 or −1) indicate strong correlations. Correlation coefficient values (0) indicate weak correlations. Table 2.
Correlation between caffeoylquinic acids and alkaloids with antioxidant activity of coffee brews.
-
Bean Brews Sugar (g/100 mL) Fat (g/100 mL) Gayo Espresso n.d. 0.60 ± 0.03A Gayo Palm sugar milk coffee 7.43±0.18C 2.40 ± 0.28.B Gayo Cappuccino 2.04±0.11B 2.62 ± 0.34B Gayo Latte 2.24±0.10B 2.71 ± 0.09.B The values for sugar and fat content were expressed as the average and standard deviation based on three data points. Capital letters (A–C) indicate significant (p < 0.05) differences with different brewing methods. n.d. = not detected. Table 3.
Sugar and fat contents in espresso-based coffee brews.
-
Nutritional components Correlation coefficient value DPPH FRAP Sugars −0.957 −0.558 Fat content −0.433 −0.997 Correlation coefficient values (1 or −1) indicate strong correlations. Correlation coefficient values (0) indicate weak correlations. Table 4.
Correlation between sugar and fat contents with antioxidant activity of coffee brews.
Figures
(1)
Tables
(4)