-
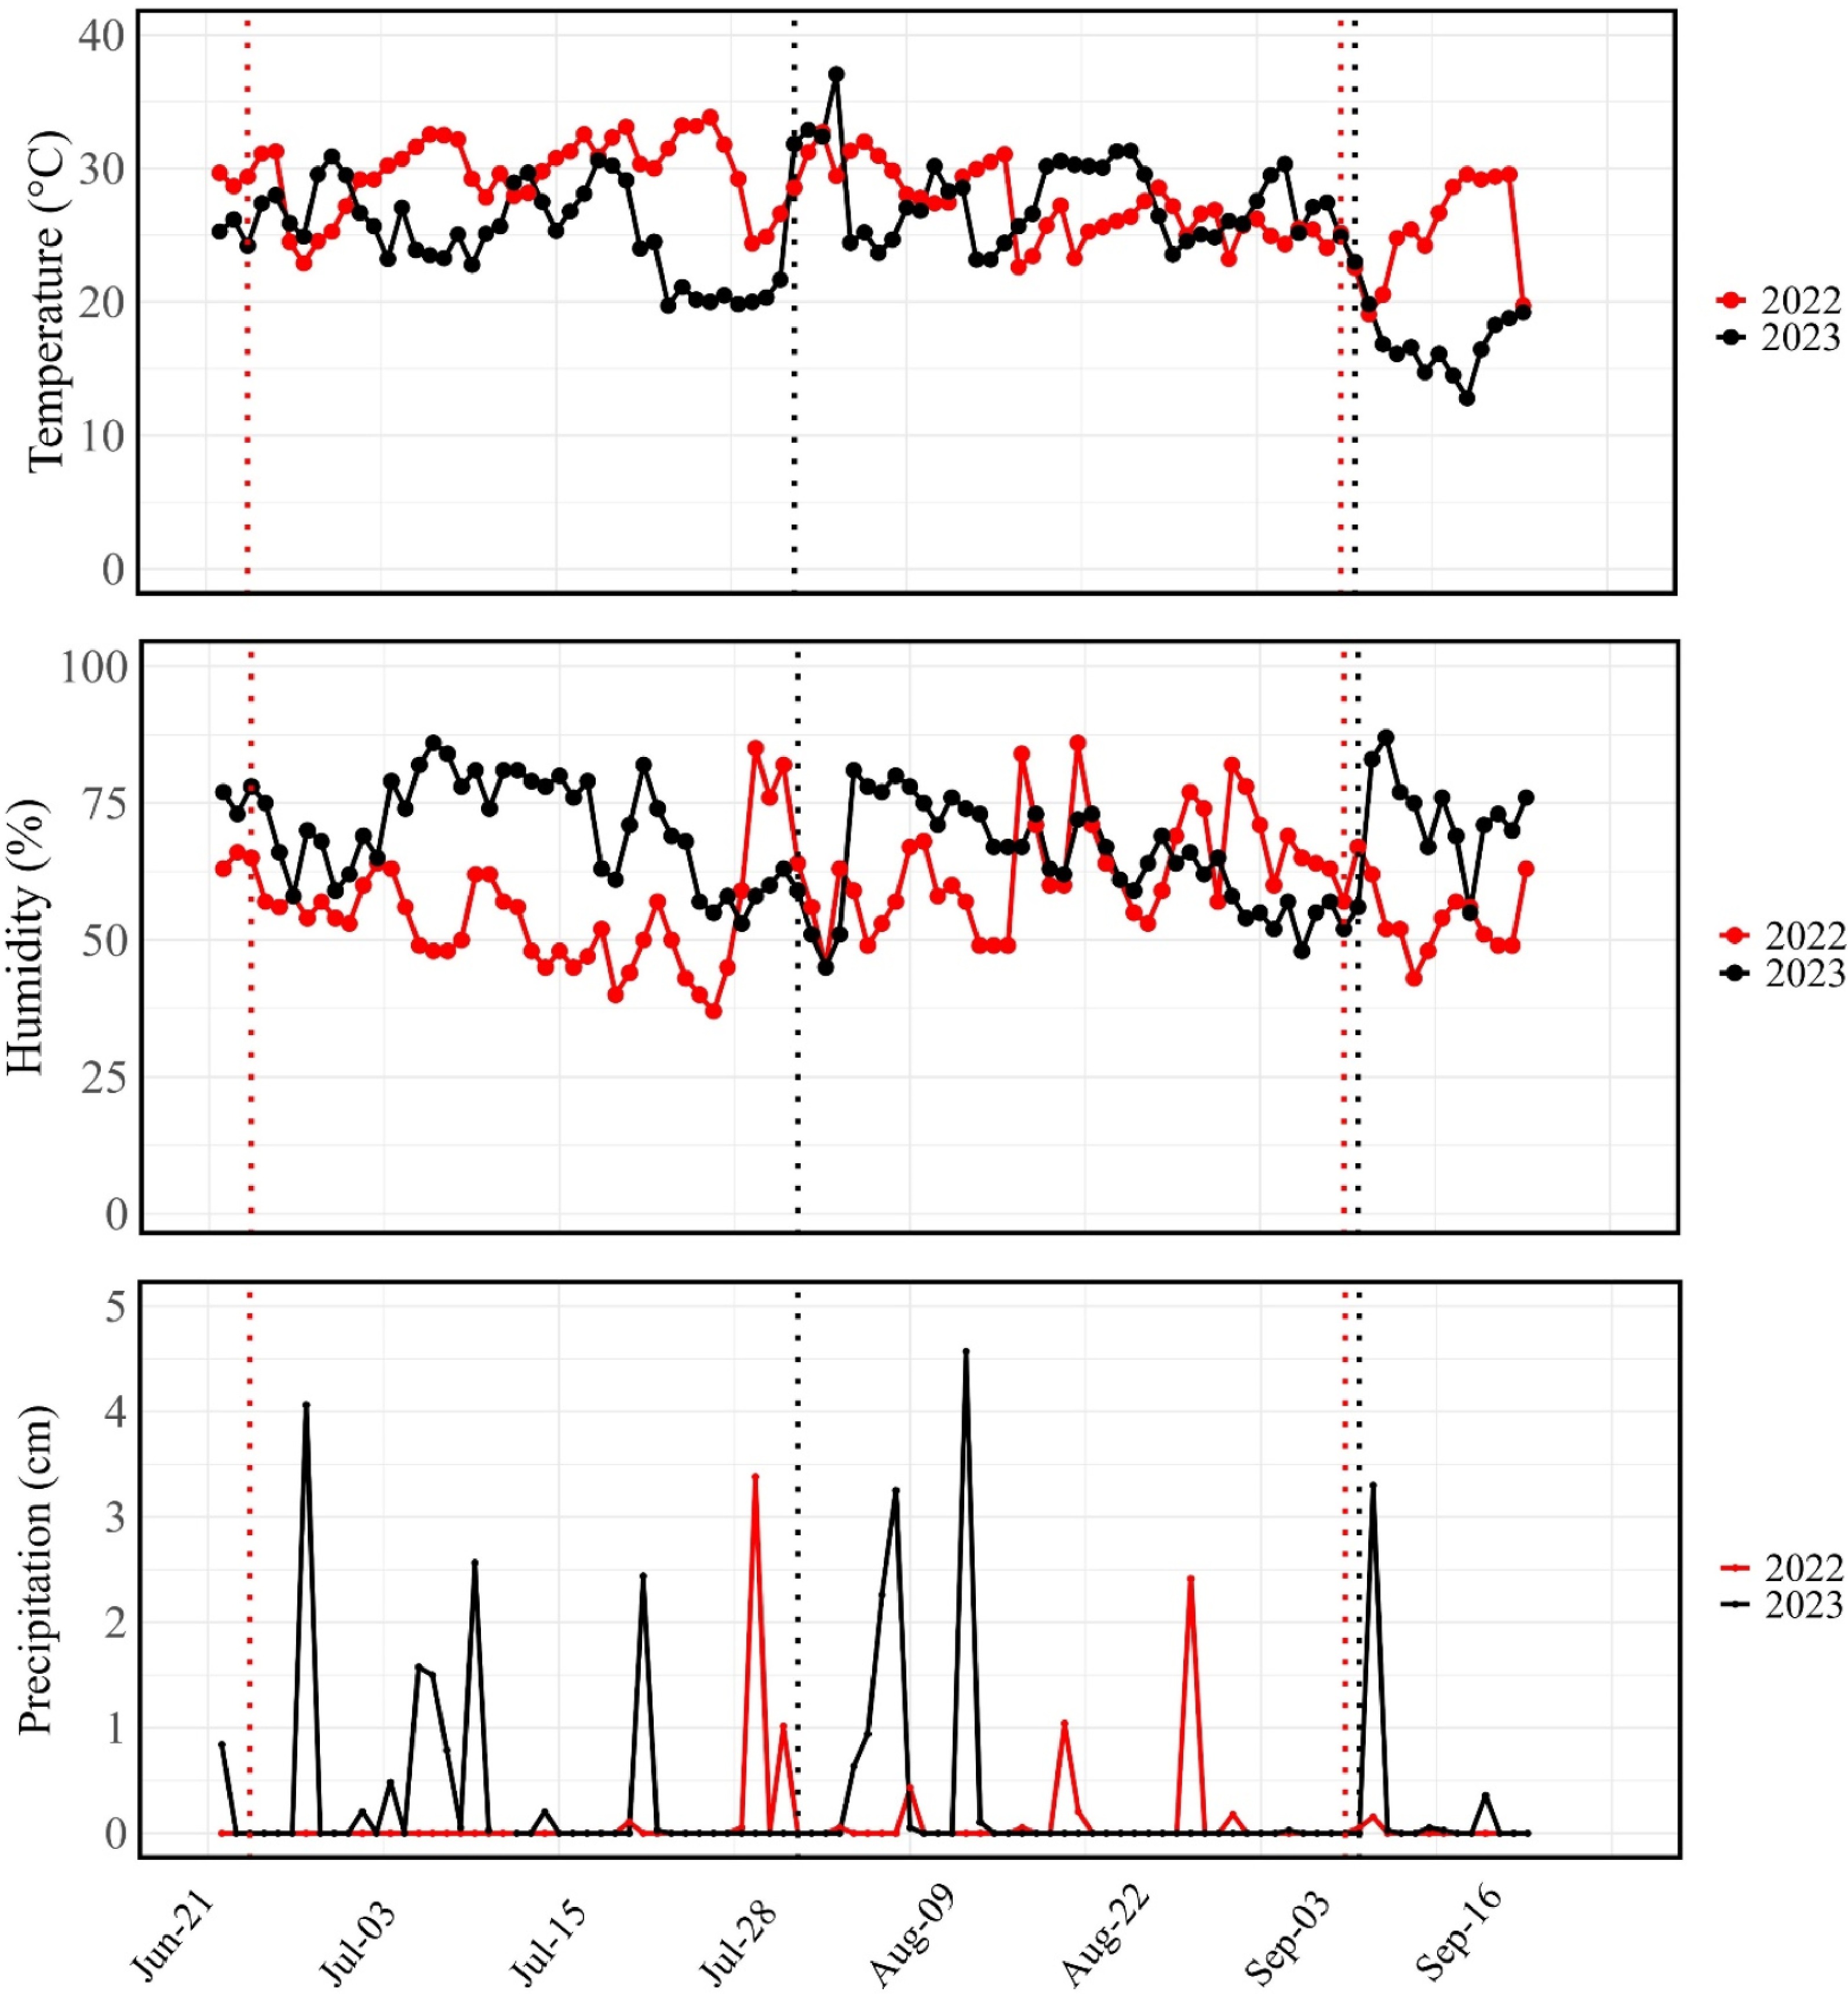
Figure 1.
Daily mean temperature, humidity, and precipitation during summer season (June 20 to September 20) in 2022 and 2023. Vertical lines represent the first and final day of data collection in 2022 (red) and 2023 (black). Data was retrieved from the Oklahoma Mesonet (
www.mesonet.org ). -
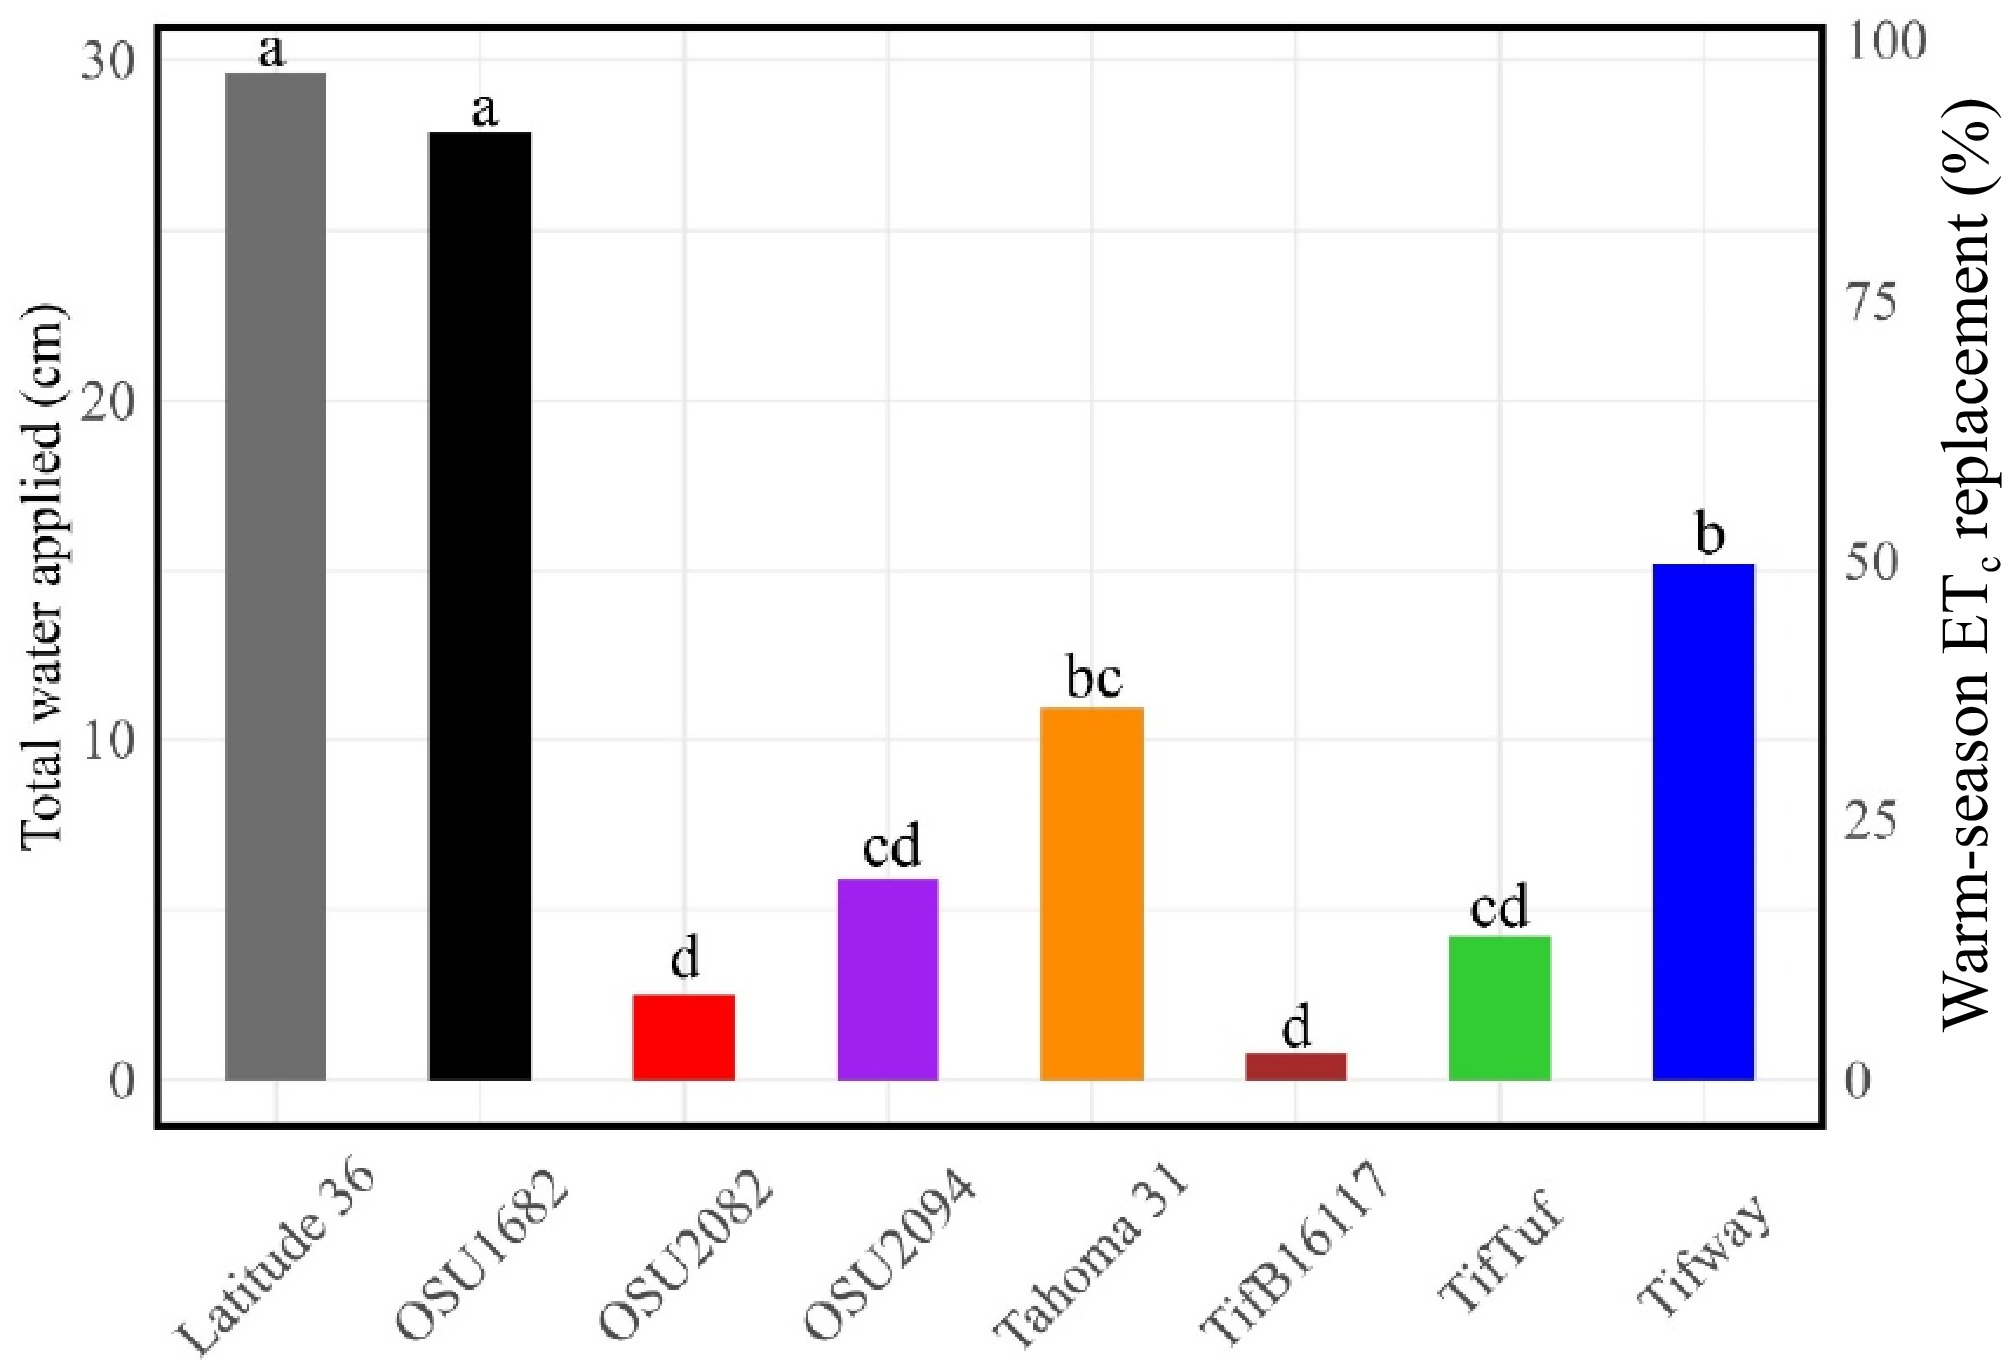
Figure 2.
Total water application amounts and corresponding percentages of warm-season evapotranspiration (ETc) replacement for different bermudagrass genotypes over a 78-d period (June 23 to September 9) in 2022. Vertical bars labeled with the same letter indicate no significant difference, as determined by Fisher's protected LSD test, p = 0.05.
-
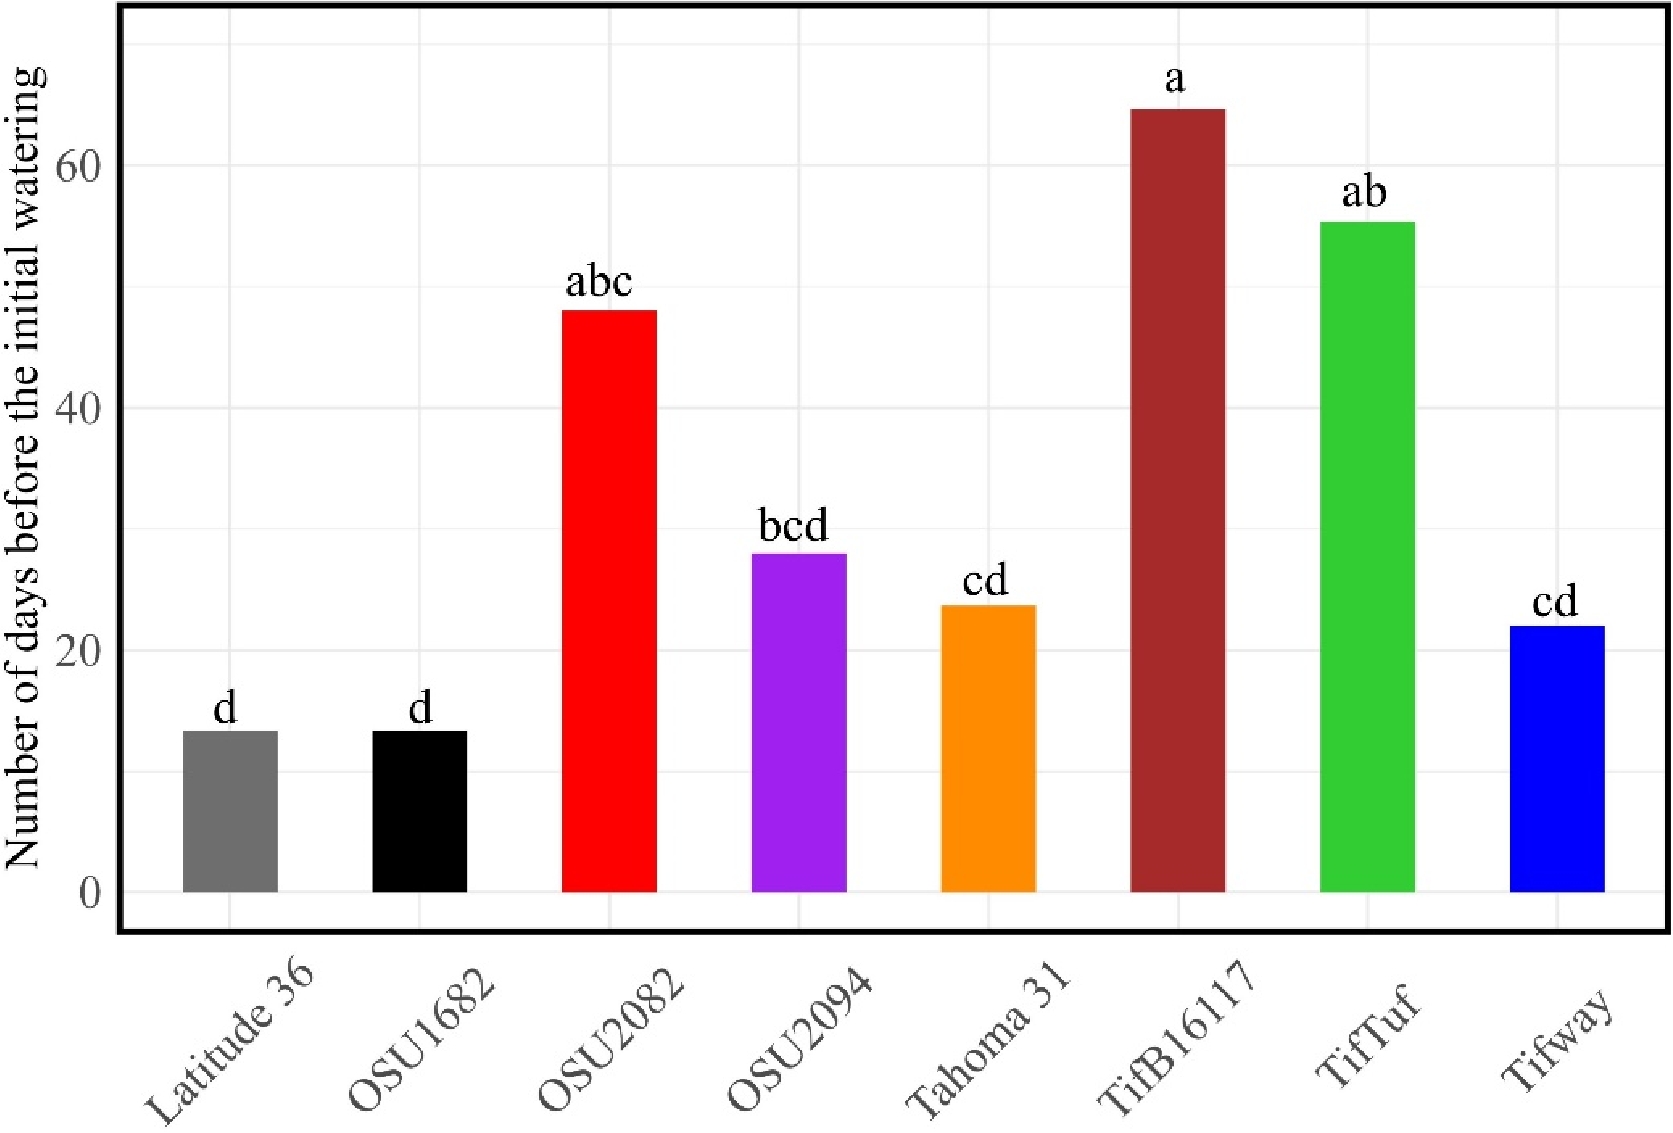
Figure 3.
Number of days under drought before the initial watering event over a 78-d period (June 23 to September 9) in 2022. Vertical bars with same letter are not significantly different, according to Fisher's protected LSD, p = 0.05.
-
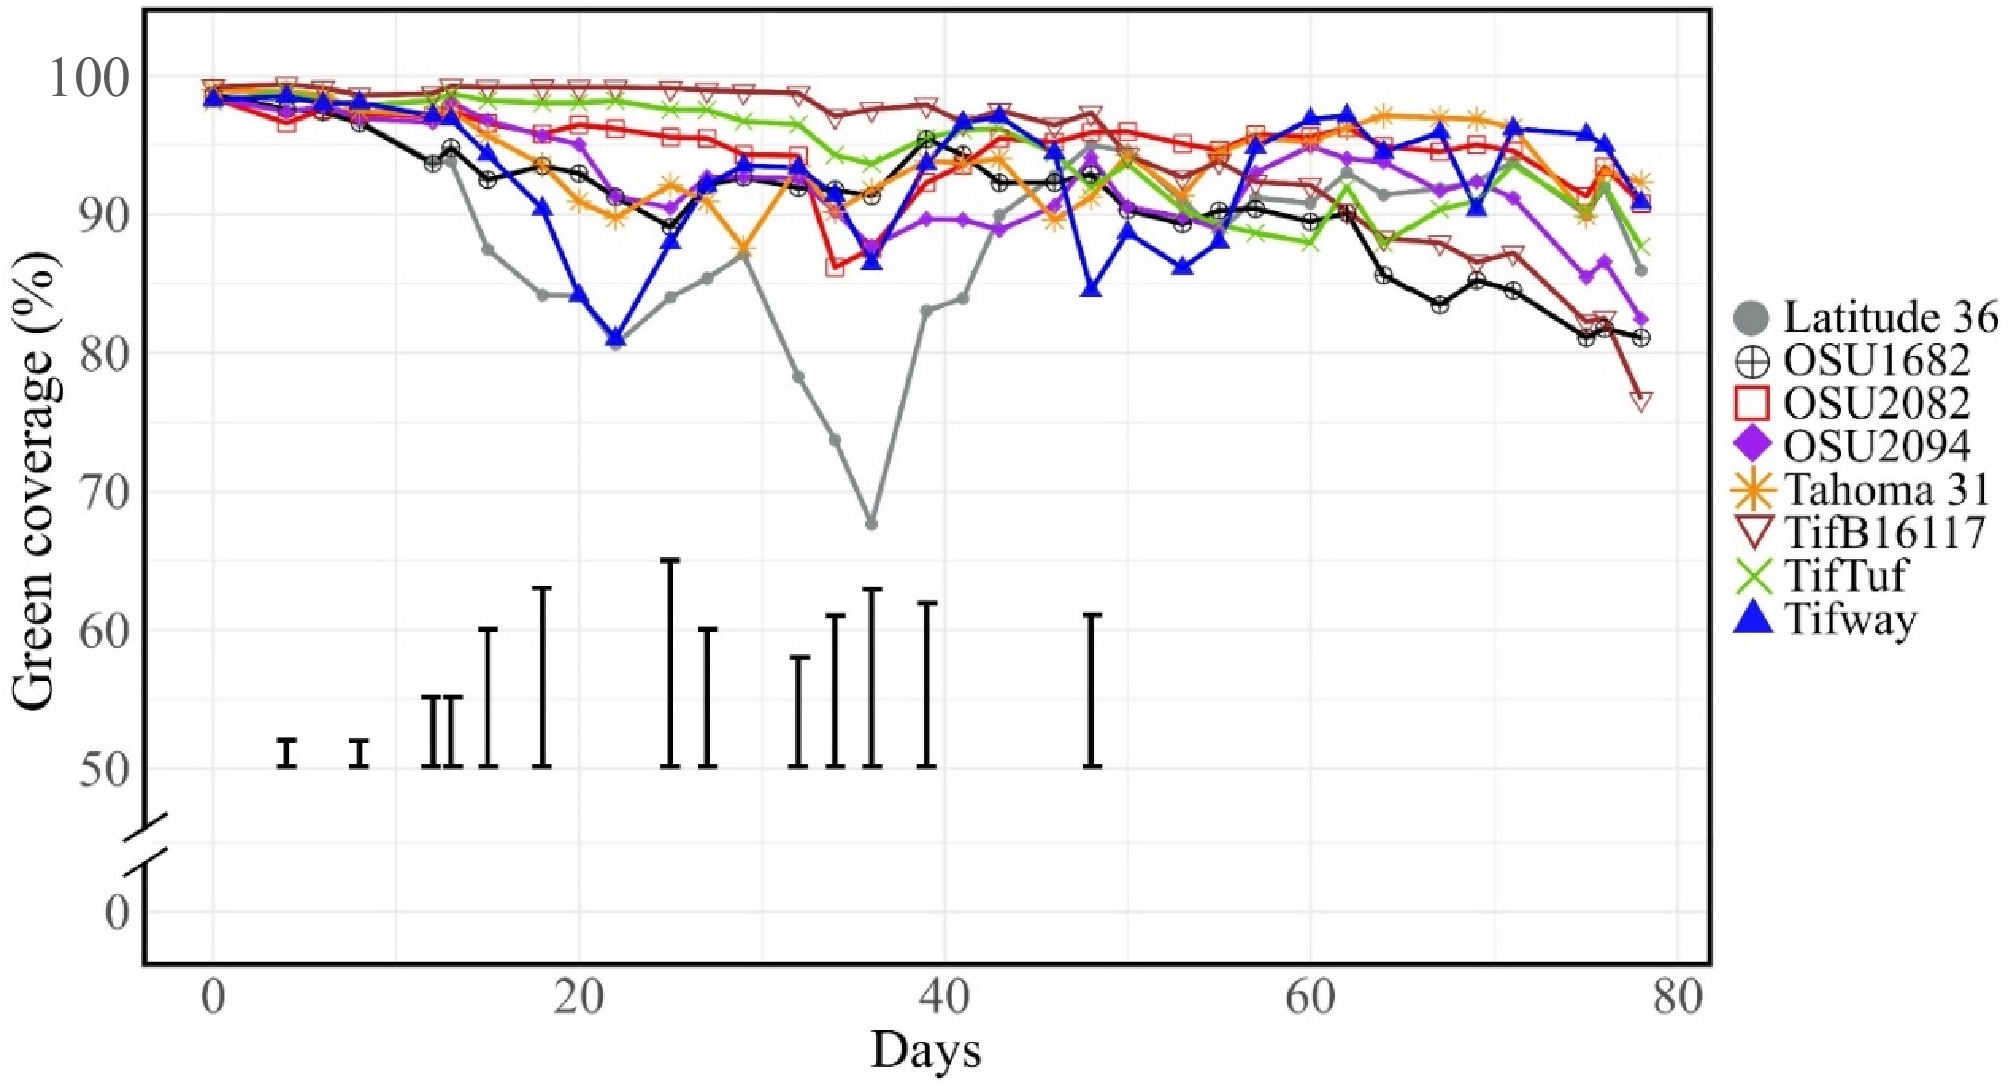
Figure 4.
Percent green cover of bermudagrass genotypes under chronic drought conditions. The experiment was conducted for 78 d between June 23, 2022 to September 9, 2022. The length of the bars represents the least significant difference (LSD) test between genotypes, p = 0.05.
-
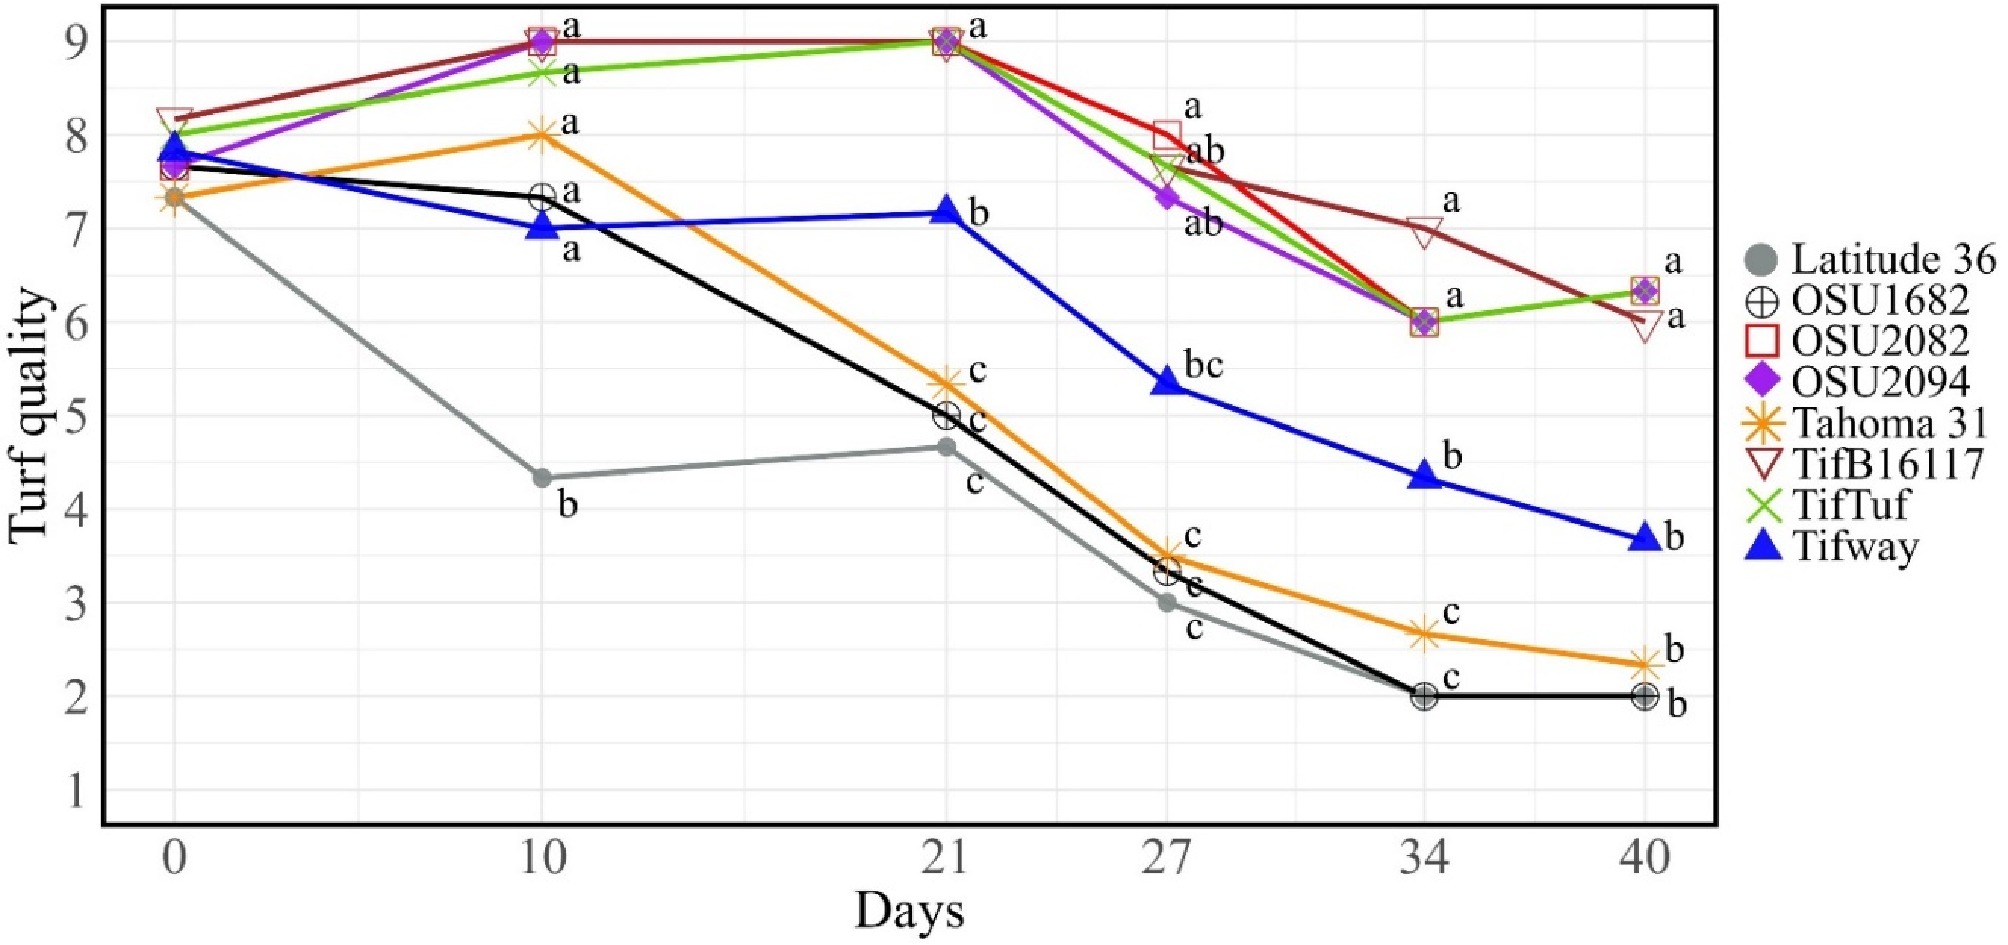
Figure 5.
Visual turf quality of different bermudagrass genotypes during a 40-d acute drought in 2023. Turf quality was rated based on a 1 to 9 scale, where 9 represents the best quality and 1 the worst quality. Points with same letter are not significantly different, according to Fisher's protected LSD, p = 0.05.
Figures
(5)
Tables
(0)