-
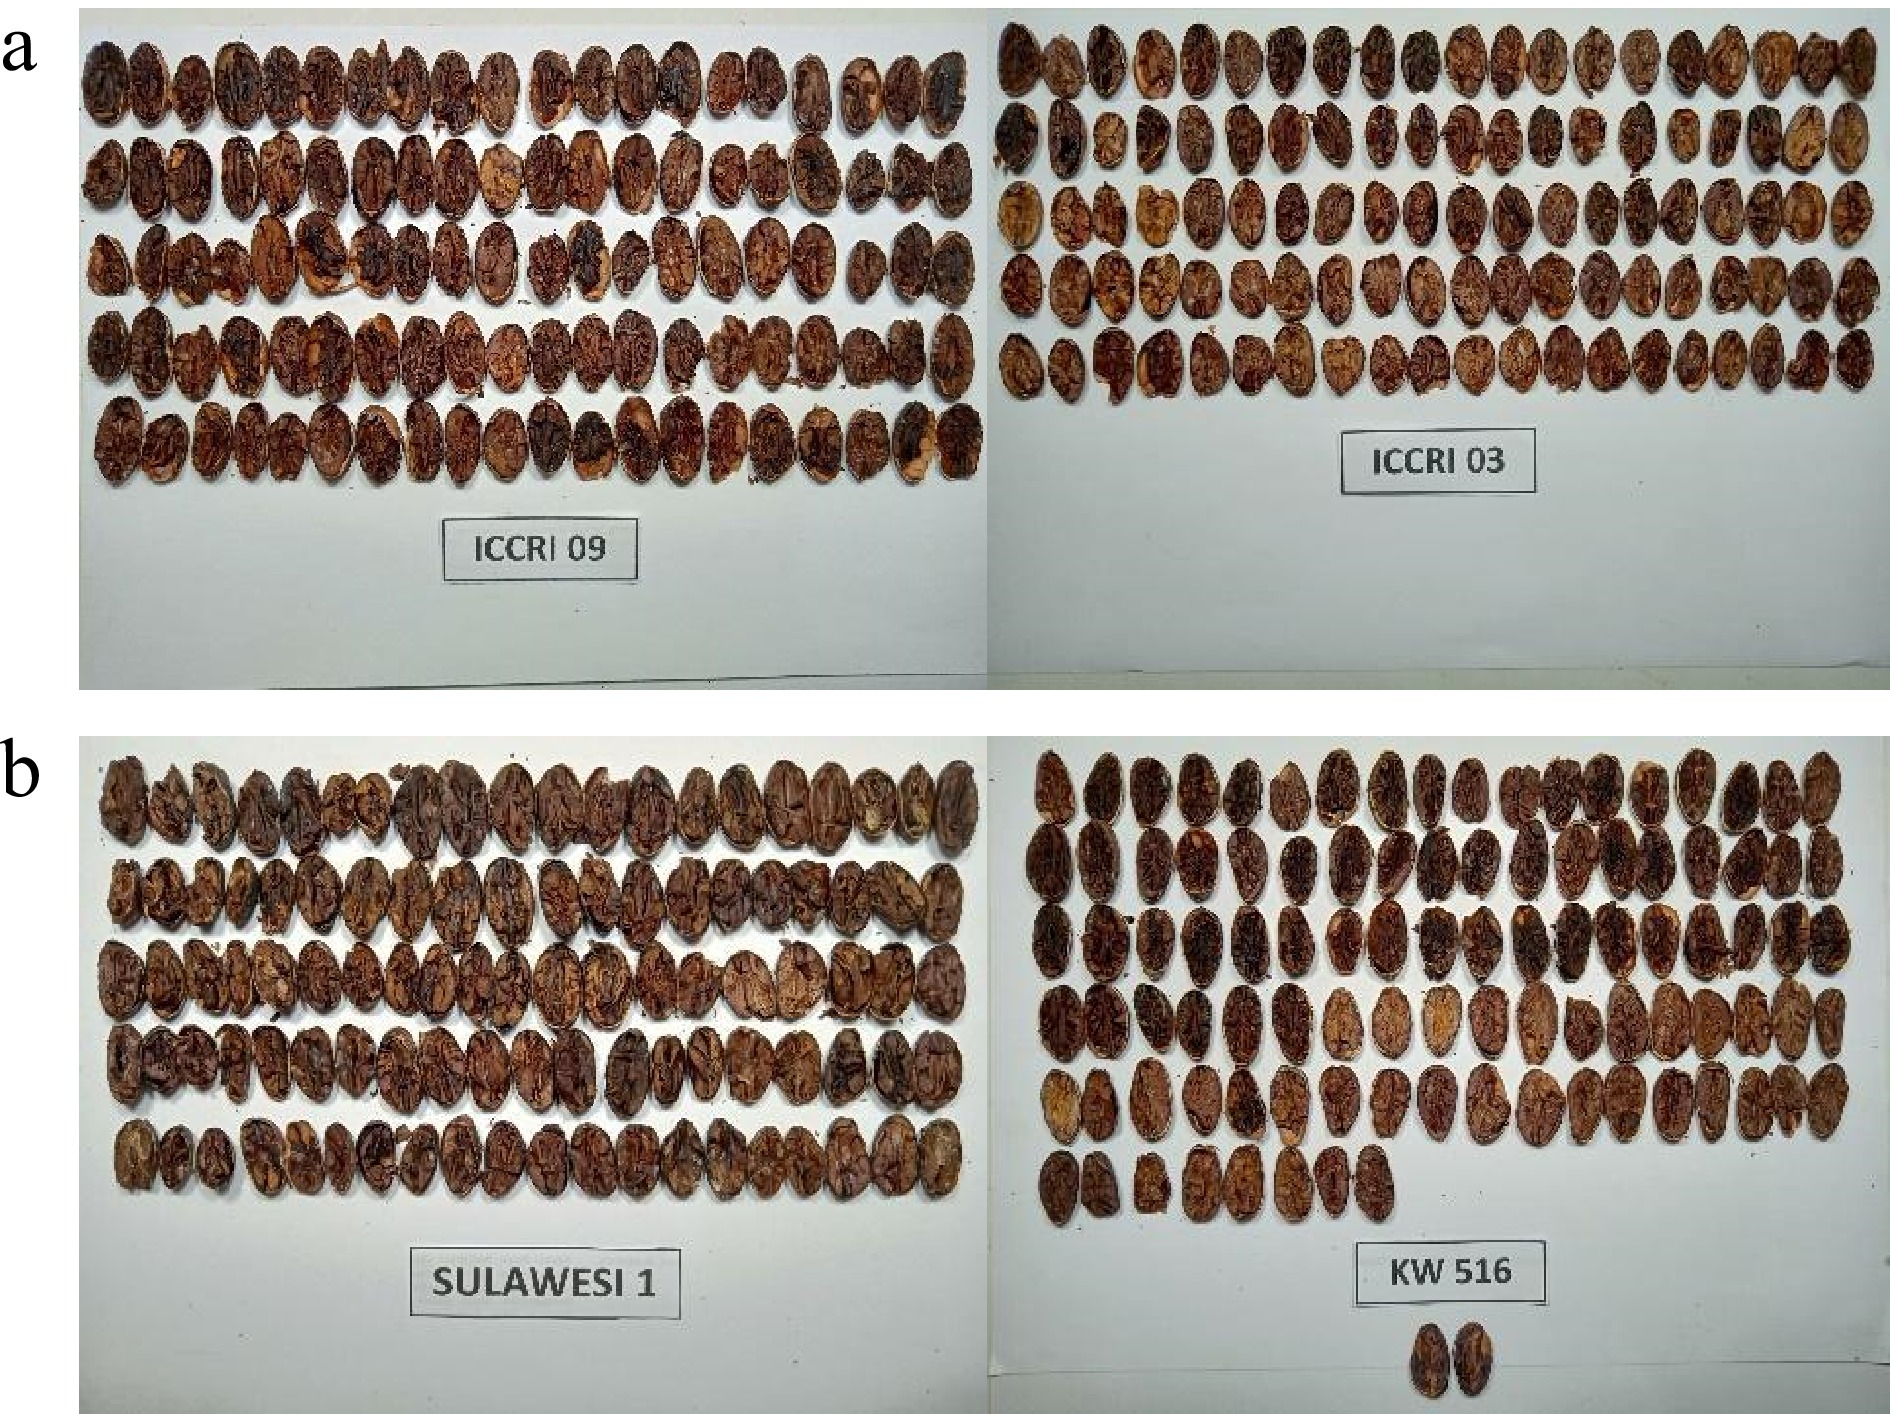
Figure 1.
A cut test analysis for (a) ICCRI 09, and ICCRI 03 as aromatic groups, and (b) Sulawesi 1 and KW 516 as non-aromatic.
-
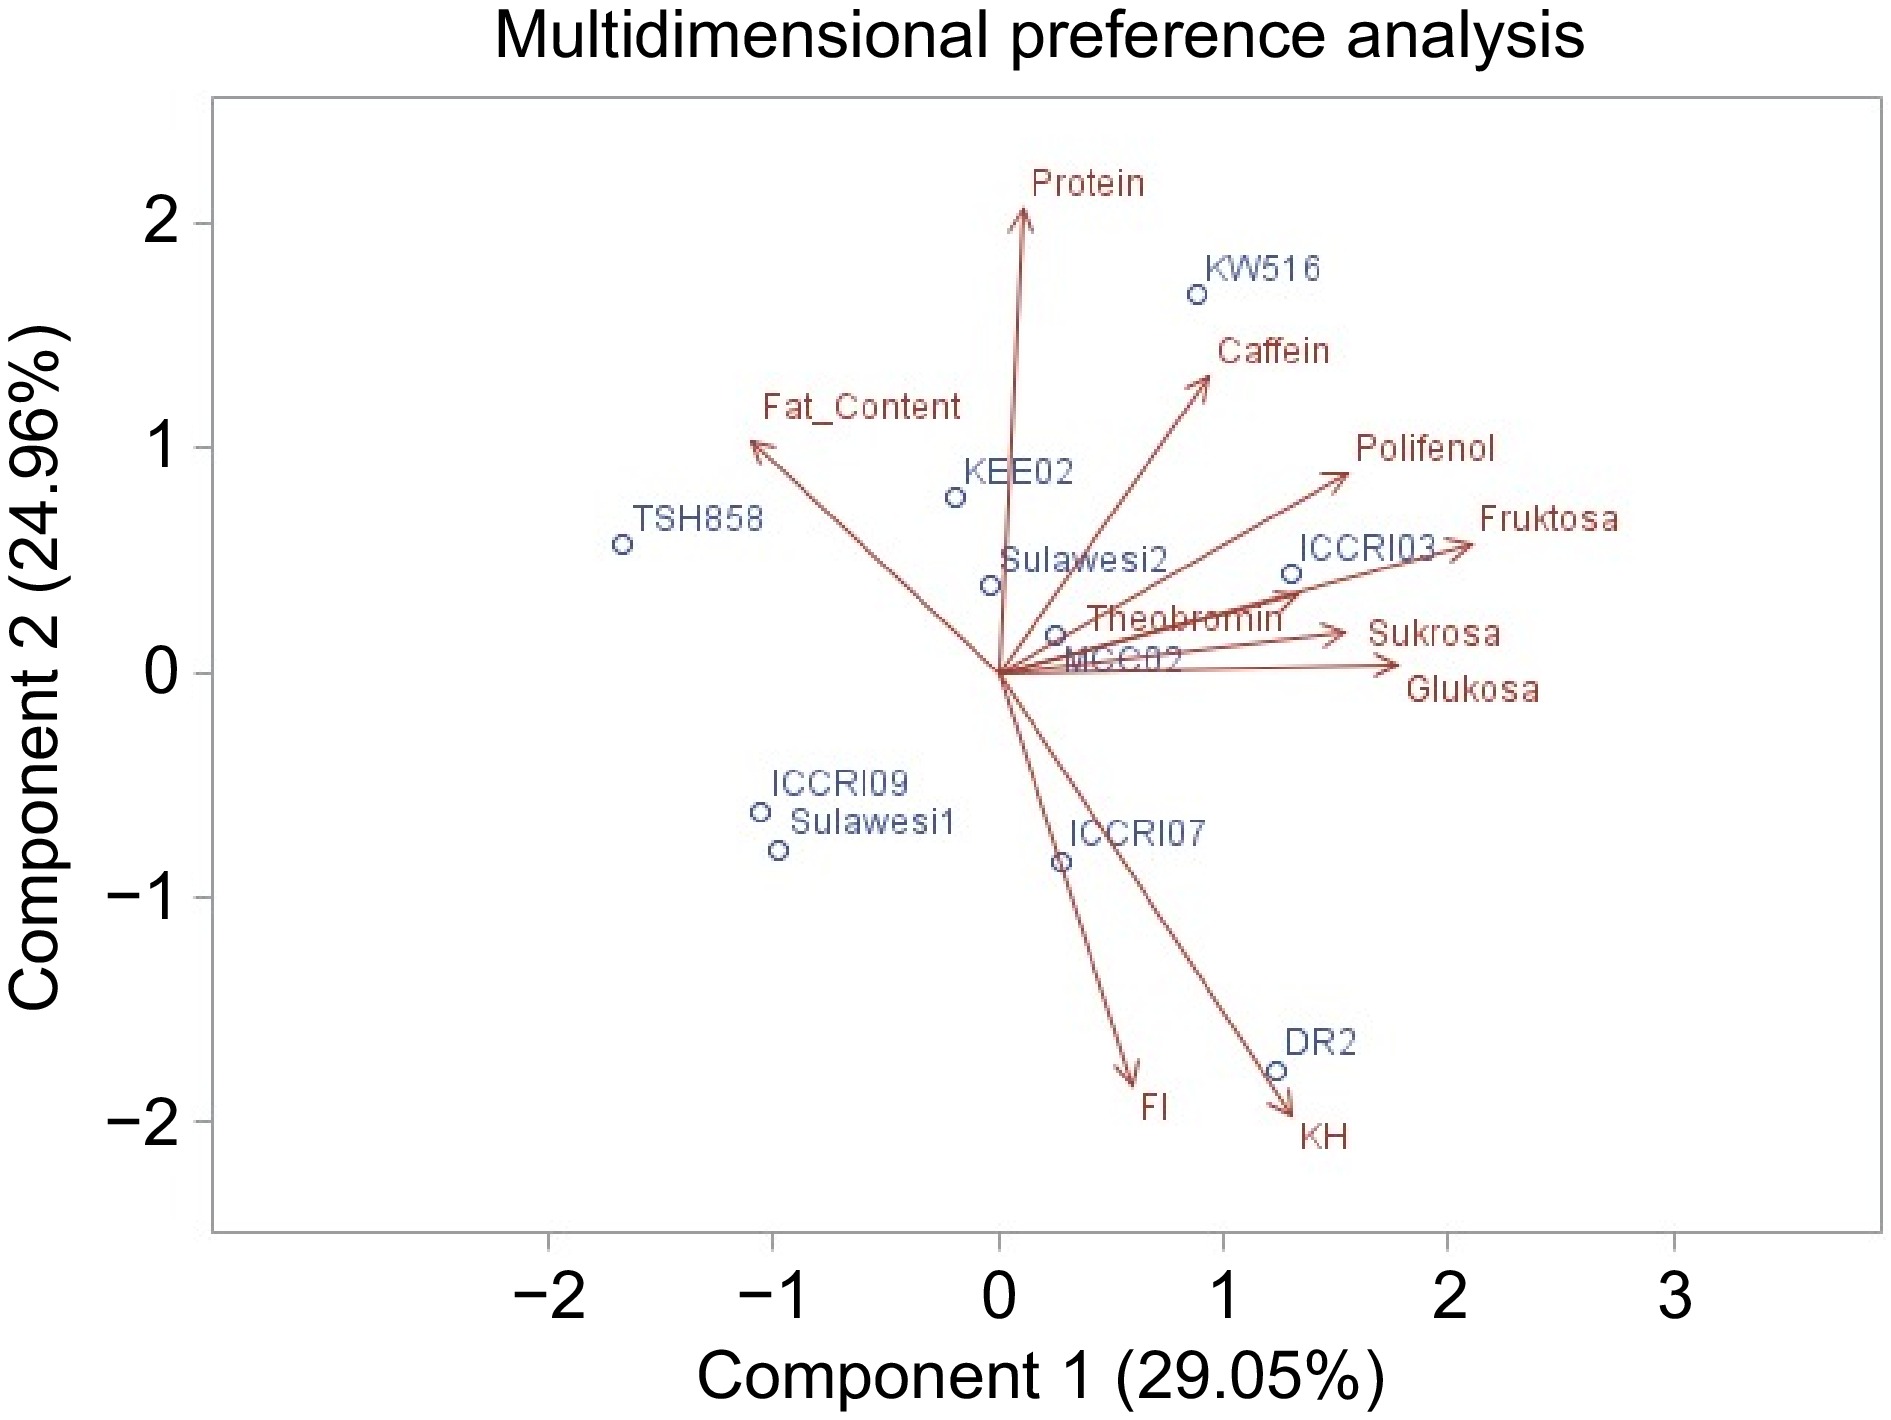
Figure 2.
PCA analysis of non-volatile compounds on aromatic and non-aromatic cocoa genotypes.
-
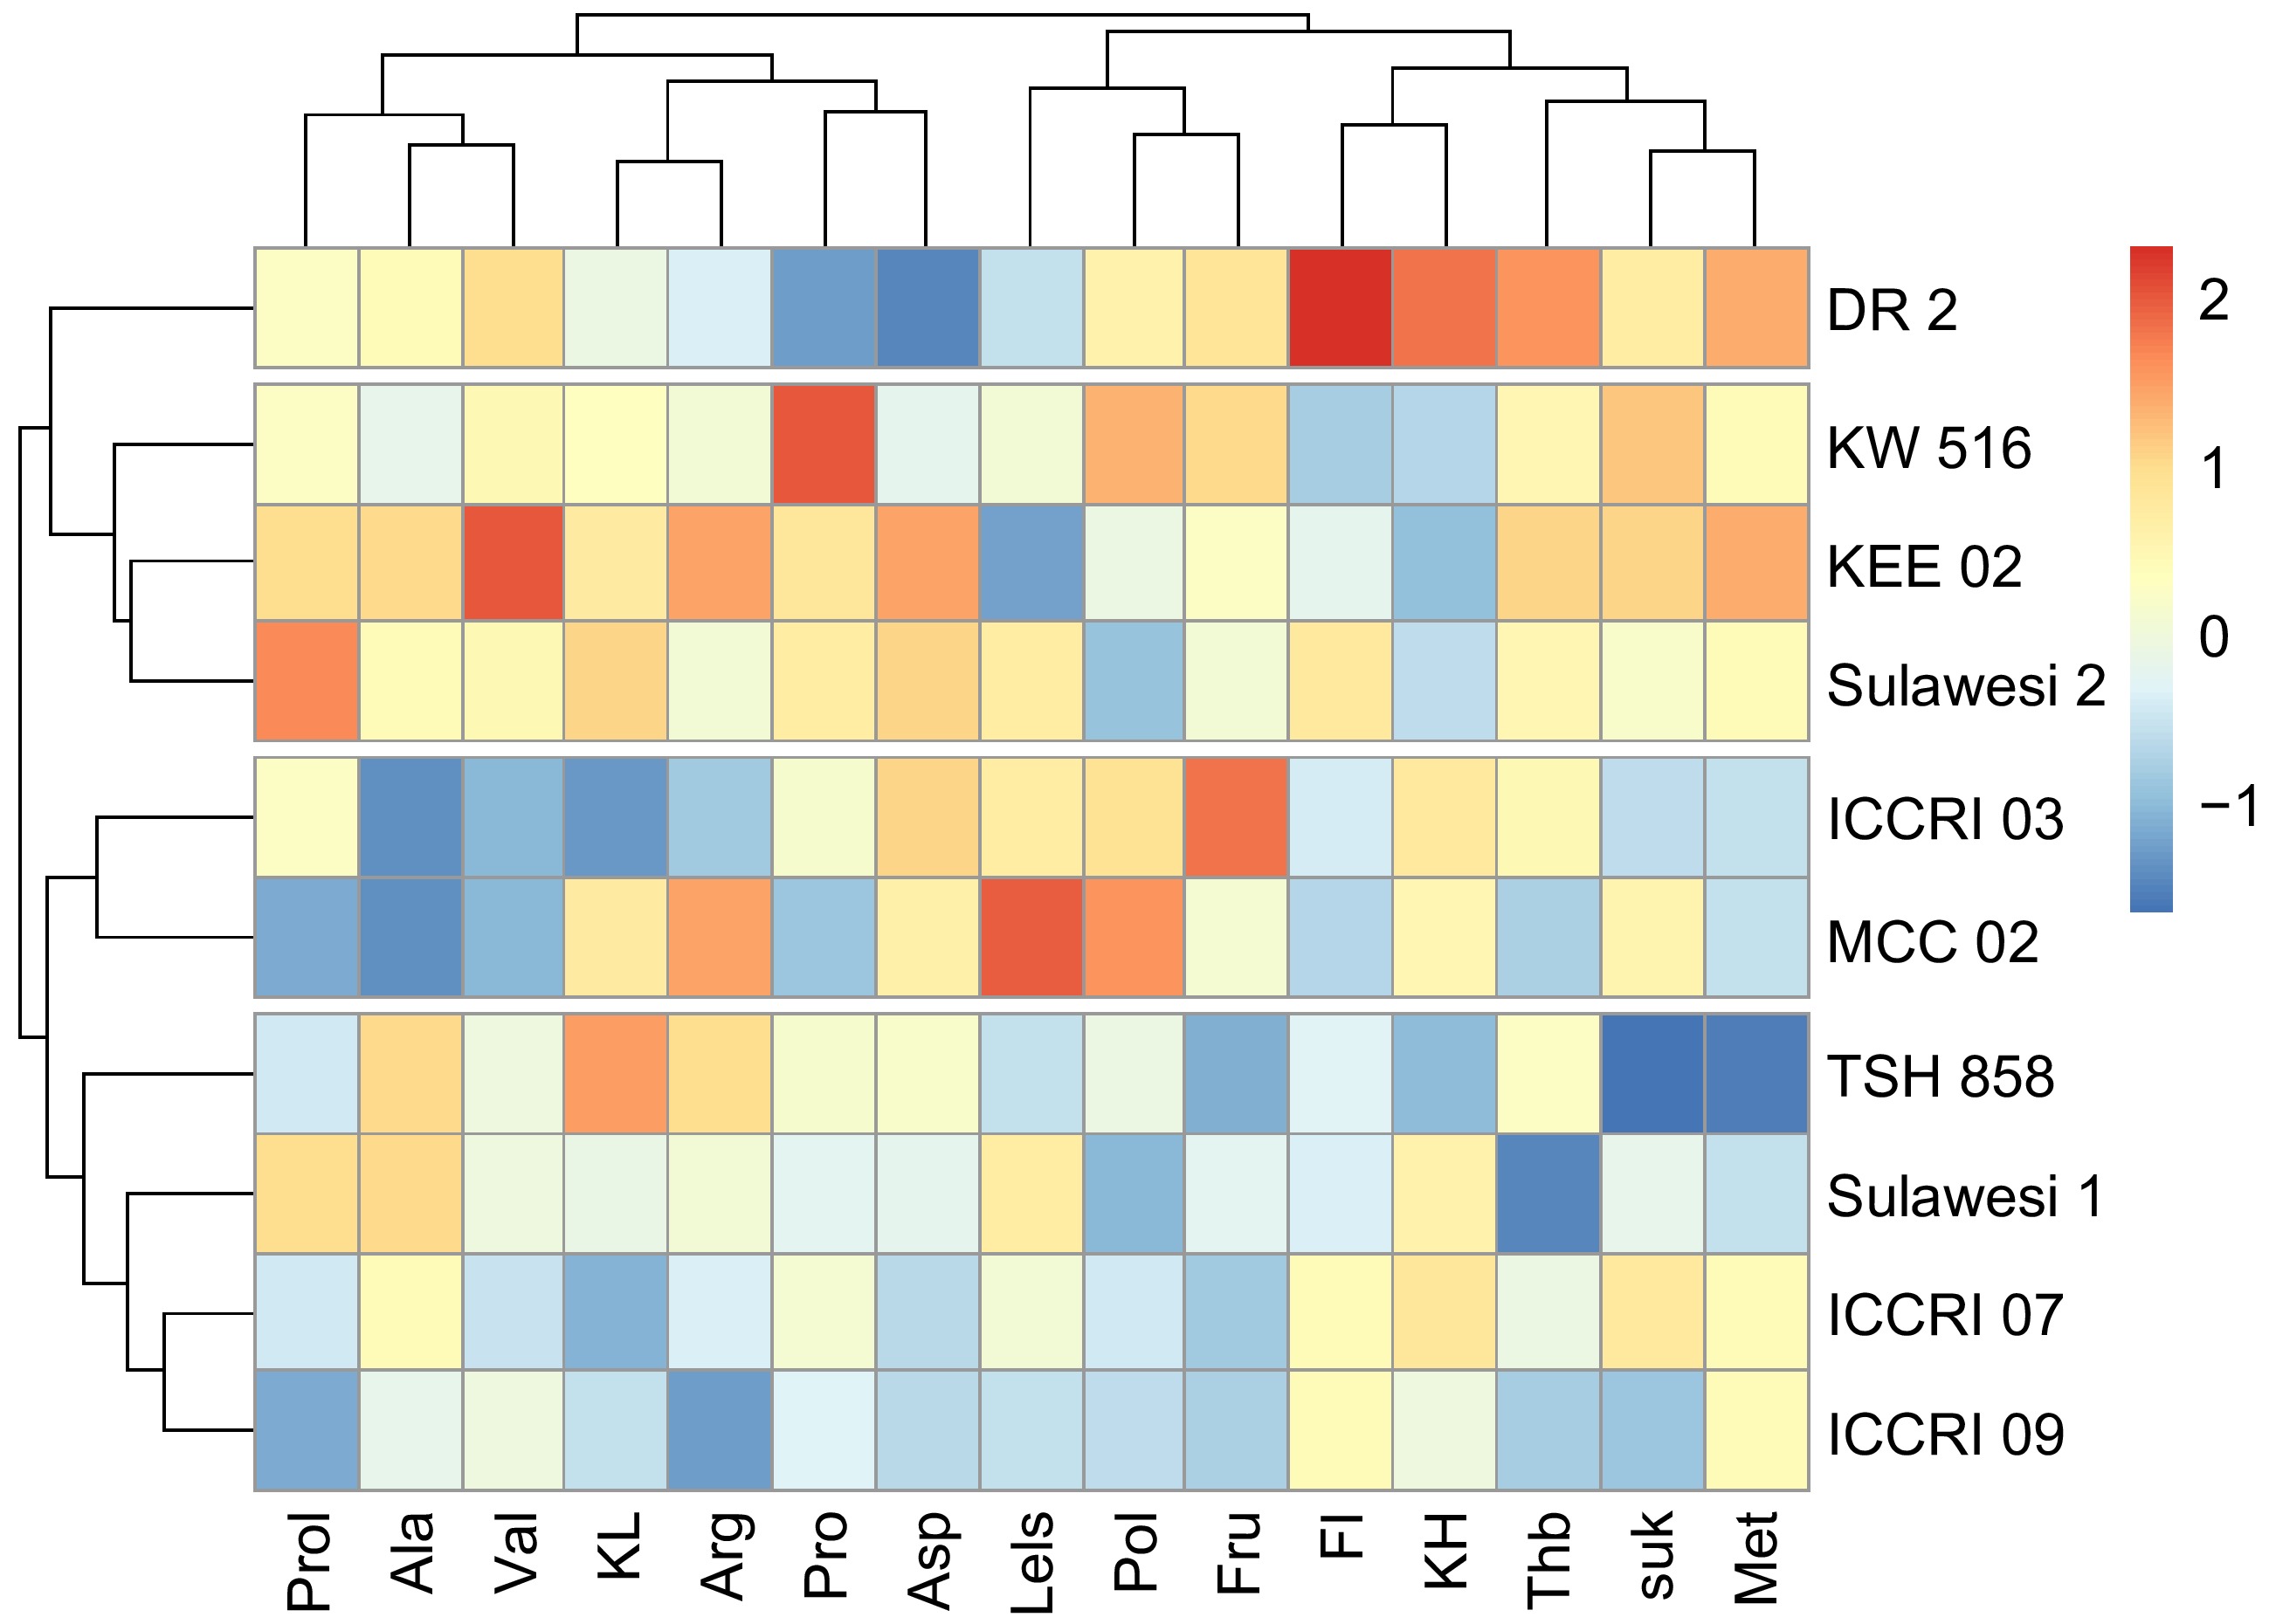
Figure 3.
Non-volatile compounds and amino acids of 10 cocoa clones based on hierarchical clustering analysis. Prol: proline (%), Ala: alanine (%), Val: valine (%), KL: fat content, Arg: arginine (%), Pro: protein, Asp: aspartic acid (%), LeIs: leucine-isoleucine (%), Pol: polyphenols, Fru: fructose, FI: Fermentation index, KH: Carbohydrate, Thb: theobromine, Suk: sucrose, Met: methionine (%).
-
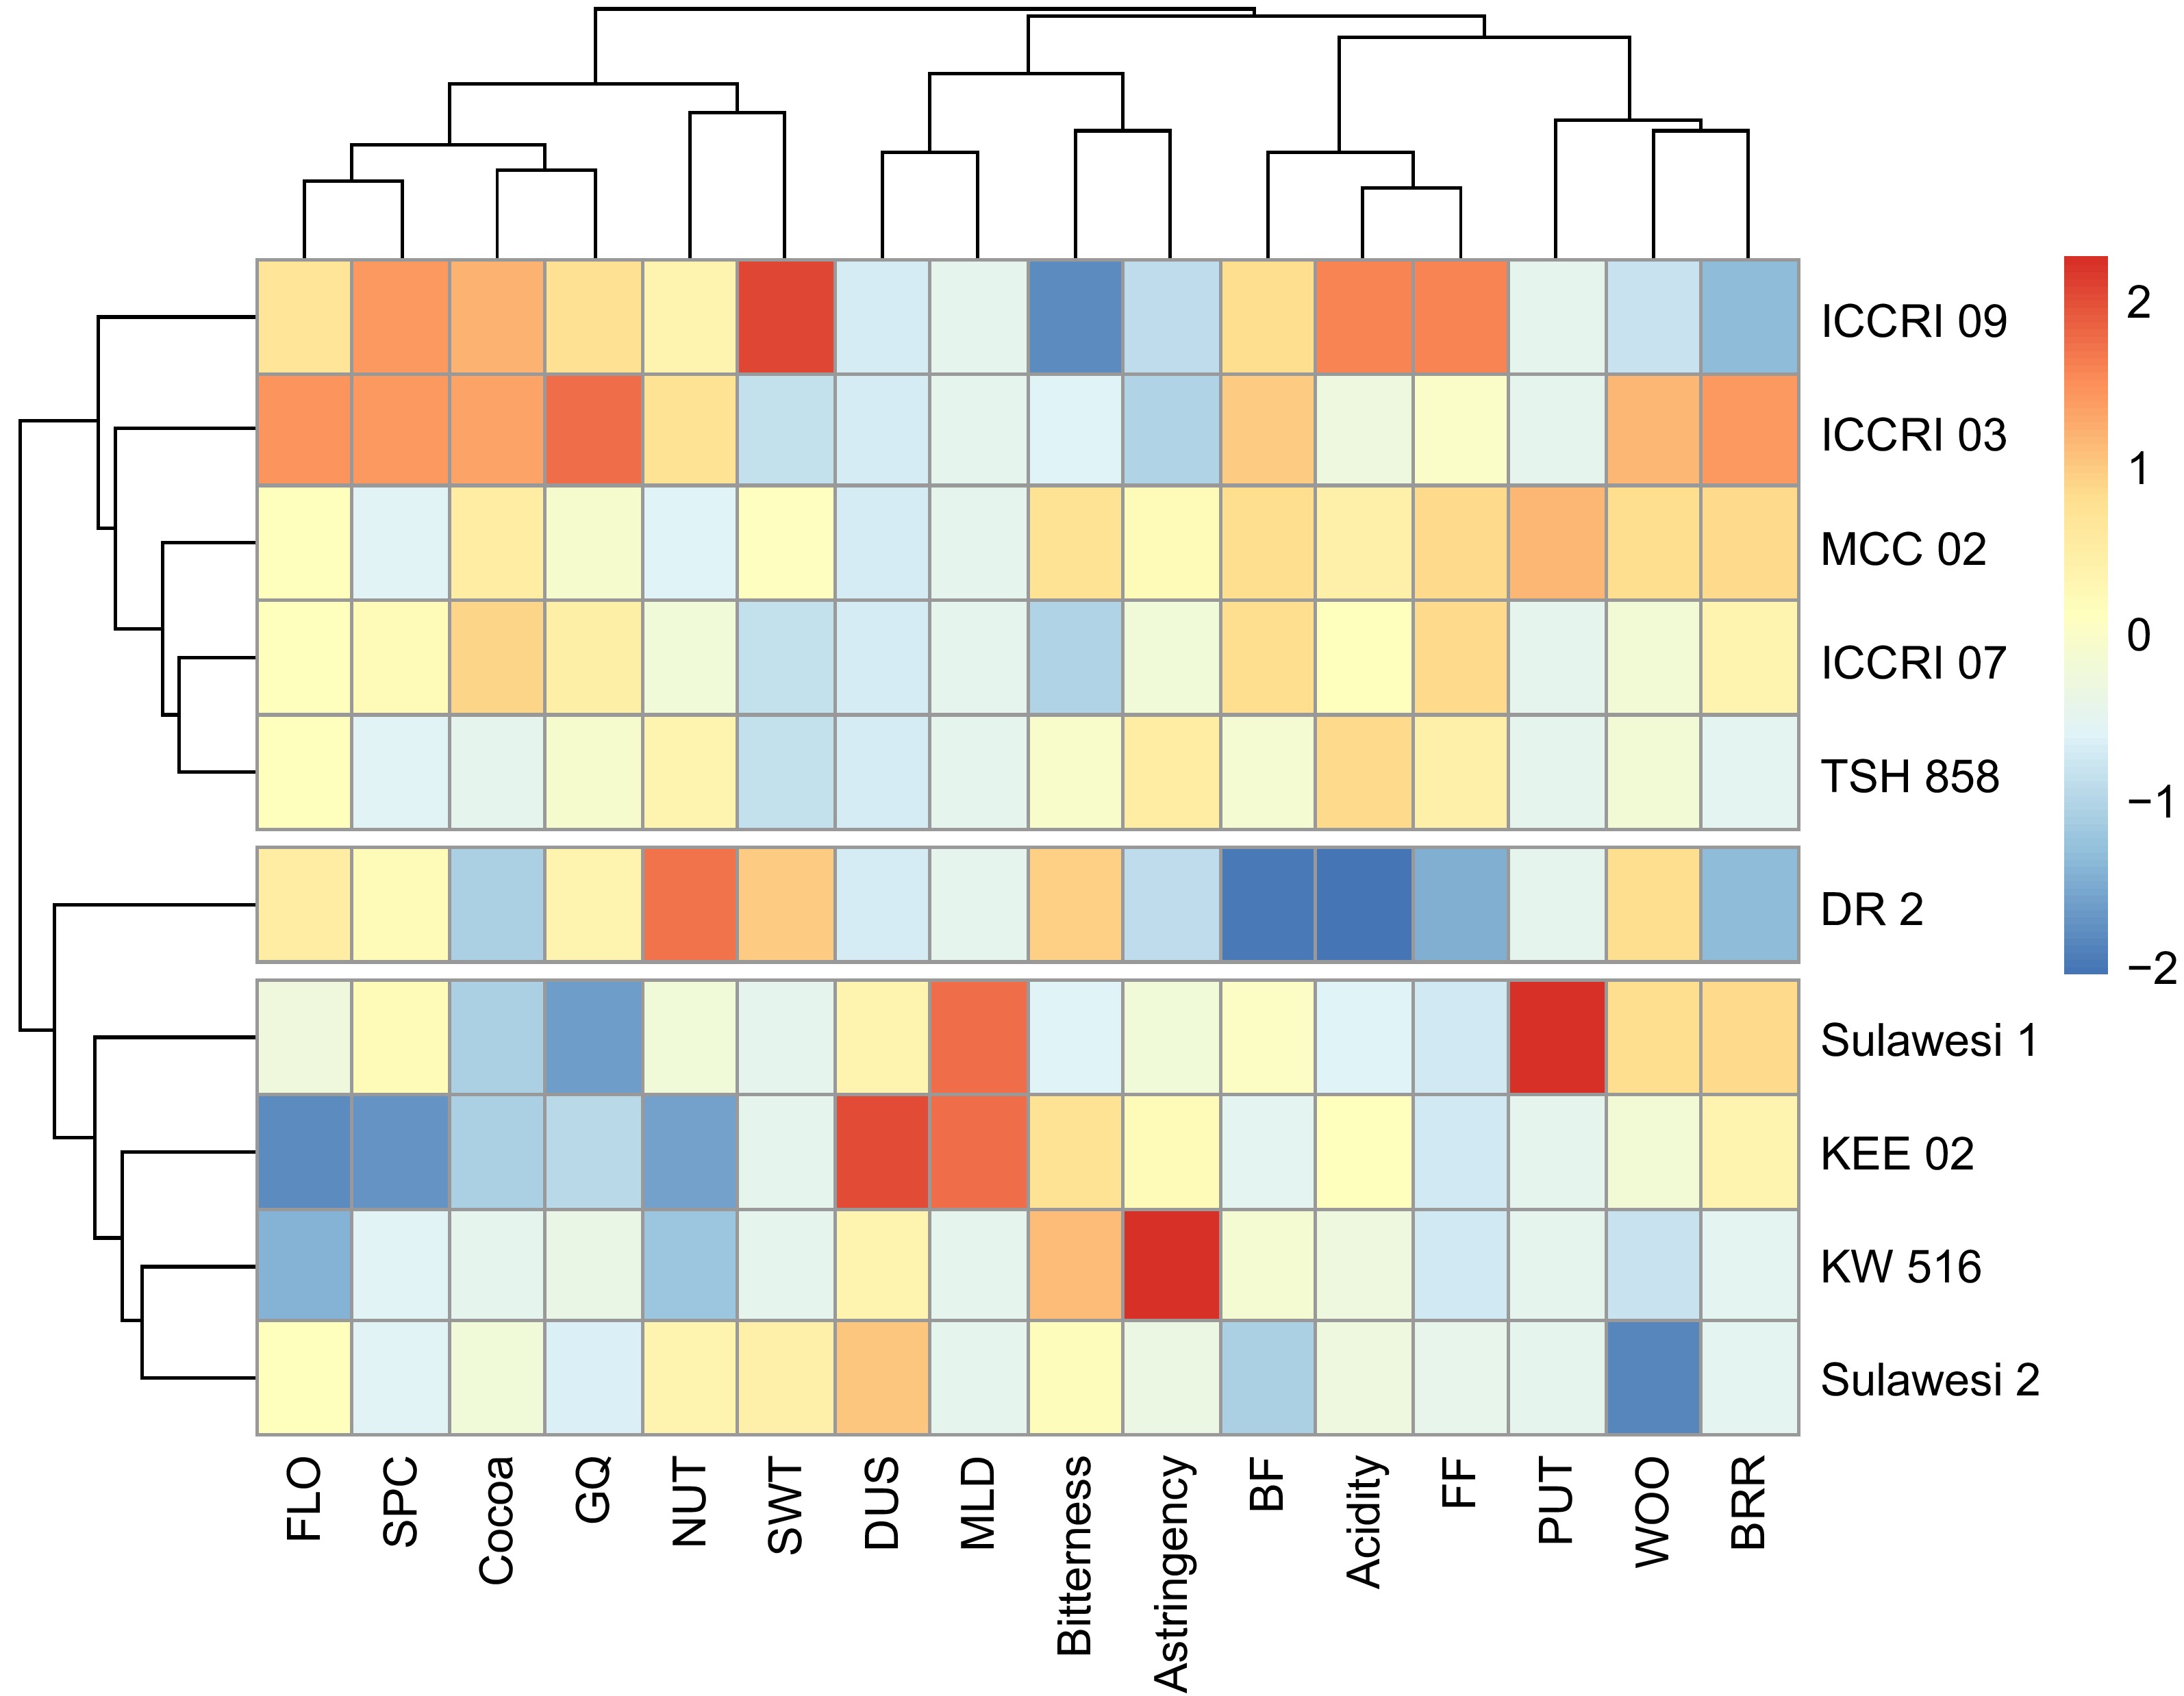
Figure 4.
Sensory compounds taste and aroma attributes of 10 cocoa clones based on hierarchical clustering analysis. FLO: Floral, SPC: Spicy, GQ: Global Quality, NUT: Nutty, SWT: Sweet, DUS: Dirty/Dusty, MLD: Moldy, BF: Browned Fruit, FF: Fresh Fruit, PUT: Putrid/Over Fermented, WOO: Woody, BRR: Browned/Roast.
-
Genotype Description Flavor DR 2 Triniario, white beans, selection result from
the Criollo half-sib populationAromatic ICCRI 03 Trinitario, purple beans, selection result from the Trinitario population (DR 2 × Sca 6) Aromatic ICCRI 09 Trinitario, purple beans, selection result
from the Trinitario population
(TSH 858 × Sulawesi 1)Aromatic MCC 02 Trinitario, purple beans, exploration result in the Sulawesi region Aroamtic TSH 858 Trinitario, purple beans, introduction clone Aromatic ICCRI 07 Trinitario, purple beans, exploration result in North Sumatra Aromatic Sulawesi 1 Triniatrio, purple beans, exploration result in the Sulawesi region Non-aromatic Sulawesi 2 Trinitario, purple beans, exploration result in the Sulawesi region Non-aromatic KEE 02 Forastero, purple beans, introduction clone from PNG Non-aromatic KW 516 Forastero, purple beans, exploration result in North Sumatra Non-aromatic Table 1.
Ten cocoa genotypes with different genetic backgrounds[1].
-
Characters Mean ± SD F-value Aromatic Non-aromatic Non-volatile compounds Fermentation index (%) 1.27 ± 0.10 1.12 ± 0.07 * Polyphenol (%) 5.66 ± 0.24 5.17 ± 0.34 * Fat content (%) 52.25 ± 1.31 55.00 ± 0.90 * Carbohydrate (%) 22.08 ± 1.08 18.43 ± 0.93 * Caffein (%) 0.32 ± 0.02 0.30 ± 0.01 * Protein (%) 13.39 ± 0.16 14.51 ± 0.29 * Glucose (%) 1.04 ± 0.03 1.07 ± 0.03 * Fructose (%) 1.50 ± 0.04 1.53 ± 0.03 * Sucrose (%) 2.64 ± 0.04 2.74 ± 0.04 * Theobromine (%) 1.37 ± 0.05 1.38 ± 0.07 ns Amino acid compounds Aspartic acid (%) 0.2307 ± 0.0062 0.2488 ± 0.0066 ** Valine (%) 0.1341 ± 0.0041 0.1550 ± 0.0049 ** Leucine-isoleucine (%) 0.1503 ± 0.0049 0.1495 ± 0.0054 ** Alanine (%) 0.2182 ± 0.0046 0.2331 ± 0.0041 ** Lysine (%) 0.0353 ± 0.0024 0.0445 ± 0.0020 ns Methionine (%) 0.0950 ± 0.0028 0.0998 ± 0.0036 ** Proline (%) 0.1427 ± 0.0023 0.1598 ± 0.0034 * Lysine (%) 0.0353 ± 0.0024 0.0445 ± 0.0020 ns Glutamic acid (%) 0.2648 ± 0.0280 0.2729 ± 0.0077 ns Threonine (%) 0.0864 ± 0.0046 0.0954 ± 0.0068 ns ** significantly different at α = 1%, * significantly different at α = 5%, ns is not significantly different at α = 5%. Table 2.
The contrast test of non-volatile compounds between aromatic and non-aromatic clone groups.
-
Flavor attribute Average of flavors score Aromatic Non-aromatic Taste Cocoa 6.42 ± 0.71 5.63 ± 0.3 Acidity 2.25 ± 0.85 2.00 ± 0.20 Bitterness 3.75 ± 0.52 4.09 ± 0.37 Astringency 3.48 ± 0.46 4.06 ± 0.81 Aroma Fresh fruit 2.54 ± 0.73 1.81 ± 0.13 Browned fruit 2.19 ± 0.62 1.84 ± 0.28 Floral 1.98 ± 0.30 1.28 ± 0.48 Woody 2.10 ± 0.23 1.88 ± 0.32 Spicy 1.00 ± 0.22 0.75 ± 0.20 Nutty 2.29 ± 0.43 1.88 ± 0.43 Sweet 0.77 ± 0.67 0.63 ± 0.25 Browned/roasted 5.44 ± 0.42 5.47 ± 0.26 Dirty/dusty 0.00 ± 0.00 0.44 ± 0.24 Meaty/animal 0.00 ± 0.00 0.00 ± 0.00 Smoky (drying smoke) 0.00 ± 0.00 0.00 ± 0.00 Mouldy 0.00 ± 0.00 0.25 ± 0.29 Table 3.
Flavors attribute of aromatic and non-aromatic group of Indonesia cocoa genotypes[1].
-
FI Pol FC Ch Thb Pro Fru Suc Taste Cocoa −0.17 0.14 −0.59* 0.19 −0.31 −0.12 0.00 −0.29 Acidity −0.52 −0.16 0.12 −0.57* −0.50 0.17 −0.58* −0.48 Bitterness 0.00 0.58* 0.56* −0.13 0.57* 0.21 0.45 0.57* Astringency −0.56* 0.37 0.47 −0.58* 0.05 0.71* 0.00 0.35 Aroma Fresh fruit −0.07 −0.02 −0.13 −0.05 −0.64* −0.23 −0.55 −0.46 Browned fruit −0.49 0.16 −0.60 0.26 −0.69* −0.15 −0.08 −0.33 Floral 0.30 0.09 −0.44 0.52 −0.13 −0.51 0.03 −0.59 Woody −0.27 0.36 −0.37 0.57* −0.12 −0.45 0.33 −0.14 Spicy 0.17 −0.18 −0.83 0.69 −0.41 −0.48 −0.01 −0.46 Nutty 0.50 −0.10 −0.24 0.46 0.10 −0.43 0.01 −0.60 Sweet 0.43 −0.16 0.14 0.09 0.07 −0.43 0.09 0.02 Browned roasted −0.59 0.15 −0.25 0.17 −0.32 0.14 0.22 0.01 Dusty −0.02 −0.36 0.34 −0.48 0.33 0.66* 0.21 0.44 Putrid −0.42 −0.08 0.05 0.18 −0.62 −0.42 −0.10 −0.10 Moldy −0.09 −0.44 0.00 −0.17 −0.09 0.17 0.00 0.17 Global quality 0.13 0.32 −0.57 0.46 −0.09 −0.35 0.05 −0.32 FI: Fermentation index, Pol: polyphenol, FC: Fat Content, Ch: Carbohydrate, Thb: theobromine, Pro: protein, Fru: fructose, Suc: sucrose, * significantly different at α = 5%, sample size (n) on all characters = 10 sample. Table 4.
Pearson correlation of flavor (taste and aroma) profiles and non-volatile compounds of cocoa bean paste.
Figures
(4)
Tables
(4)