-
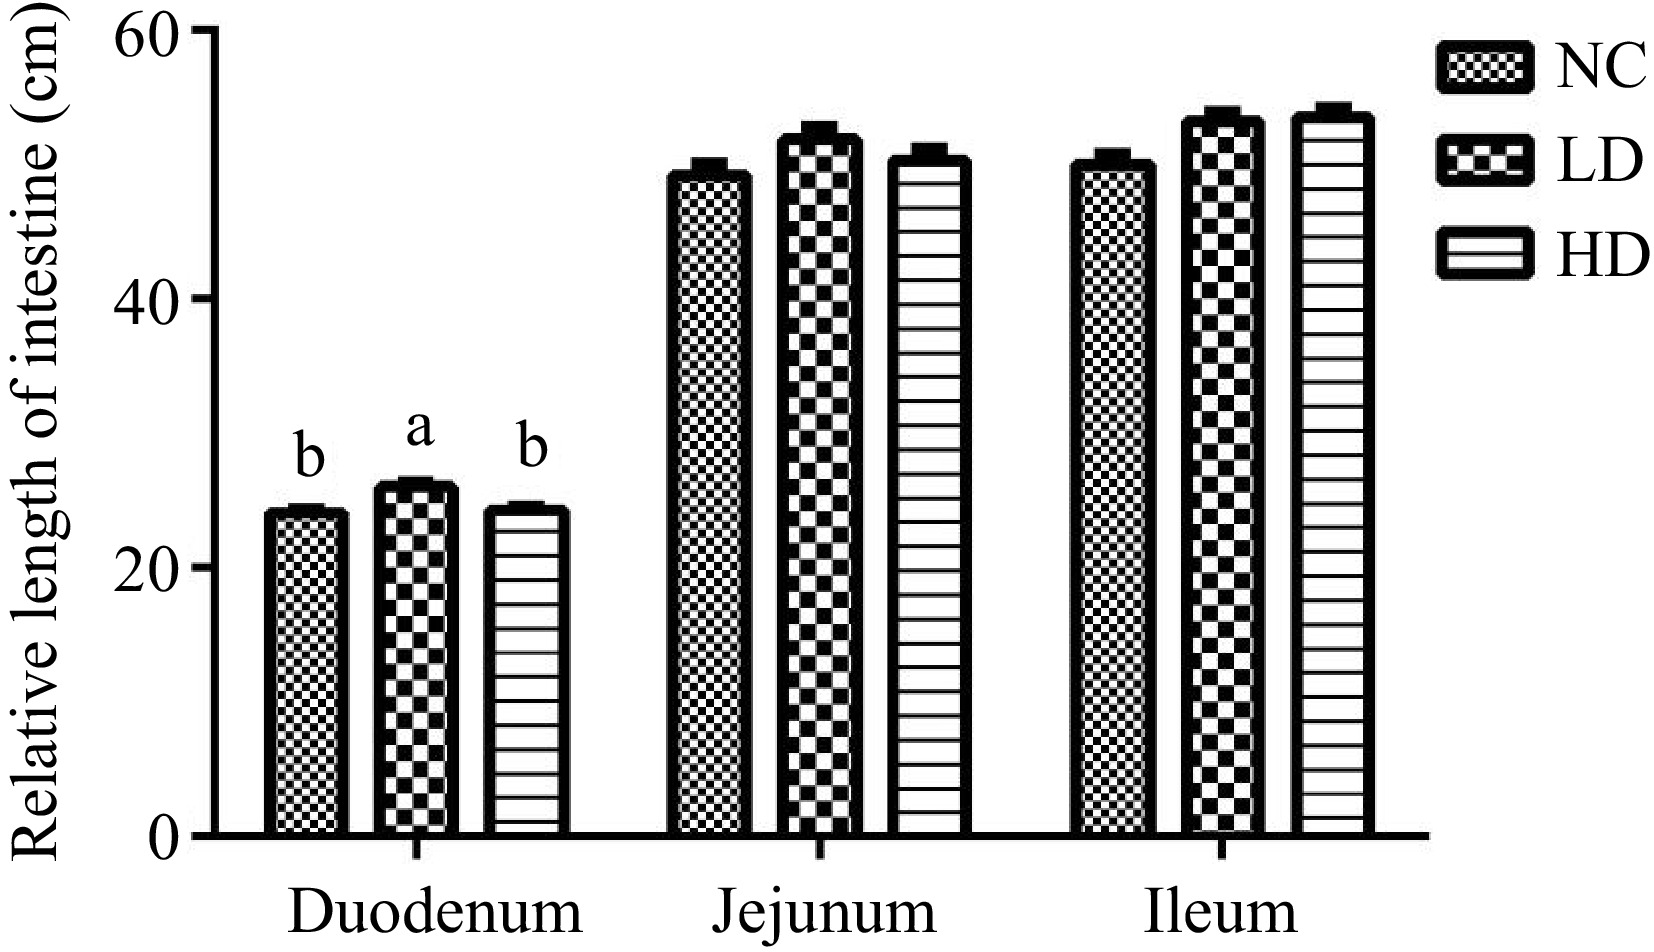
Figure 1.
Effects of dietary acidifiers on intestinal length of broilers at 21 d (cm). NC group: basal diet; LD group, basal diet with 330 g/t acidifiers; HD group, basal diet with 660 g/t acidifiers. Lower case letters a & b above columns indicate that values with different superscripts were significantly different (p < 0.05). Data were expressed as mean ± SE (n = 8).
-
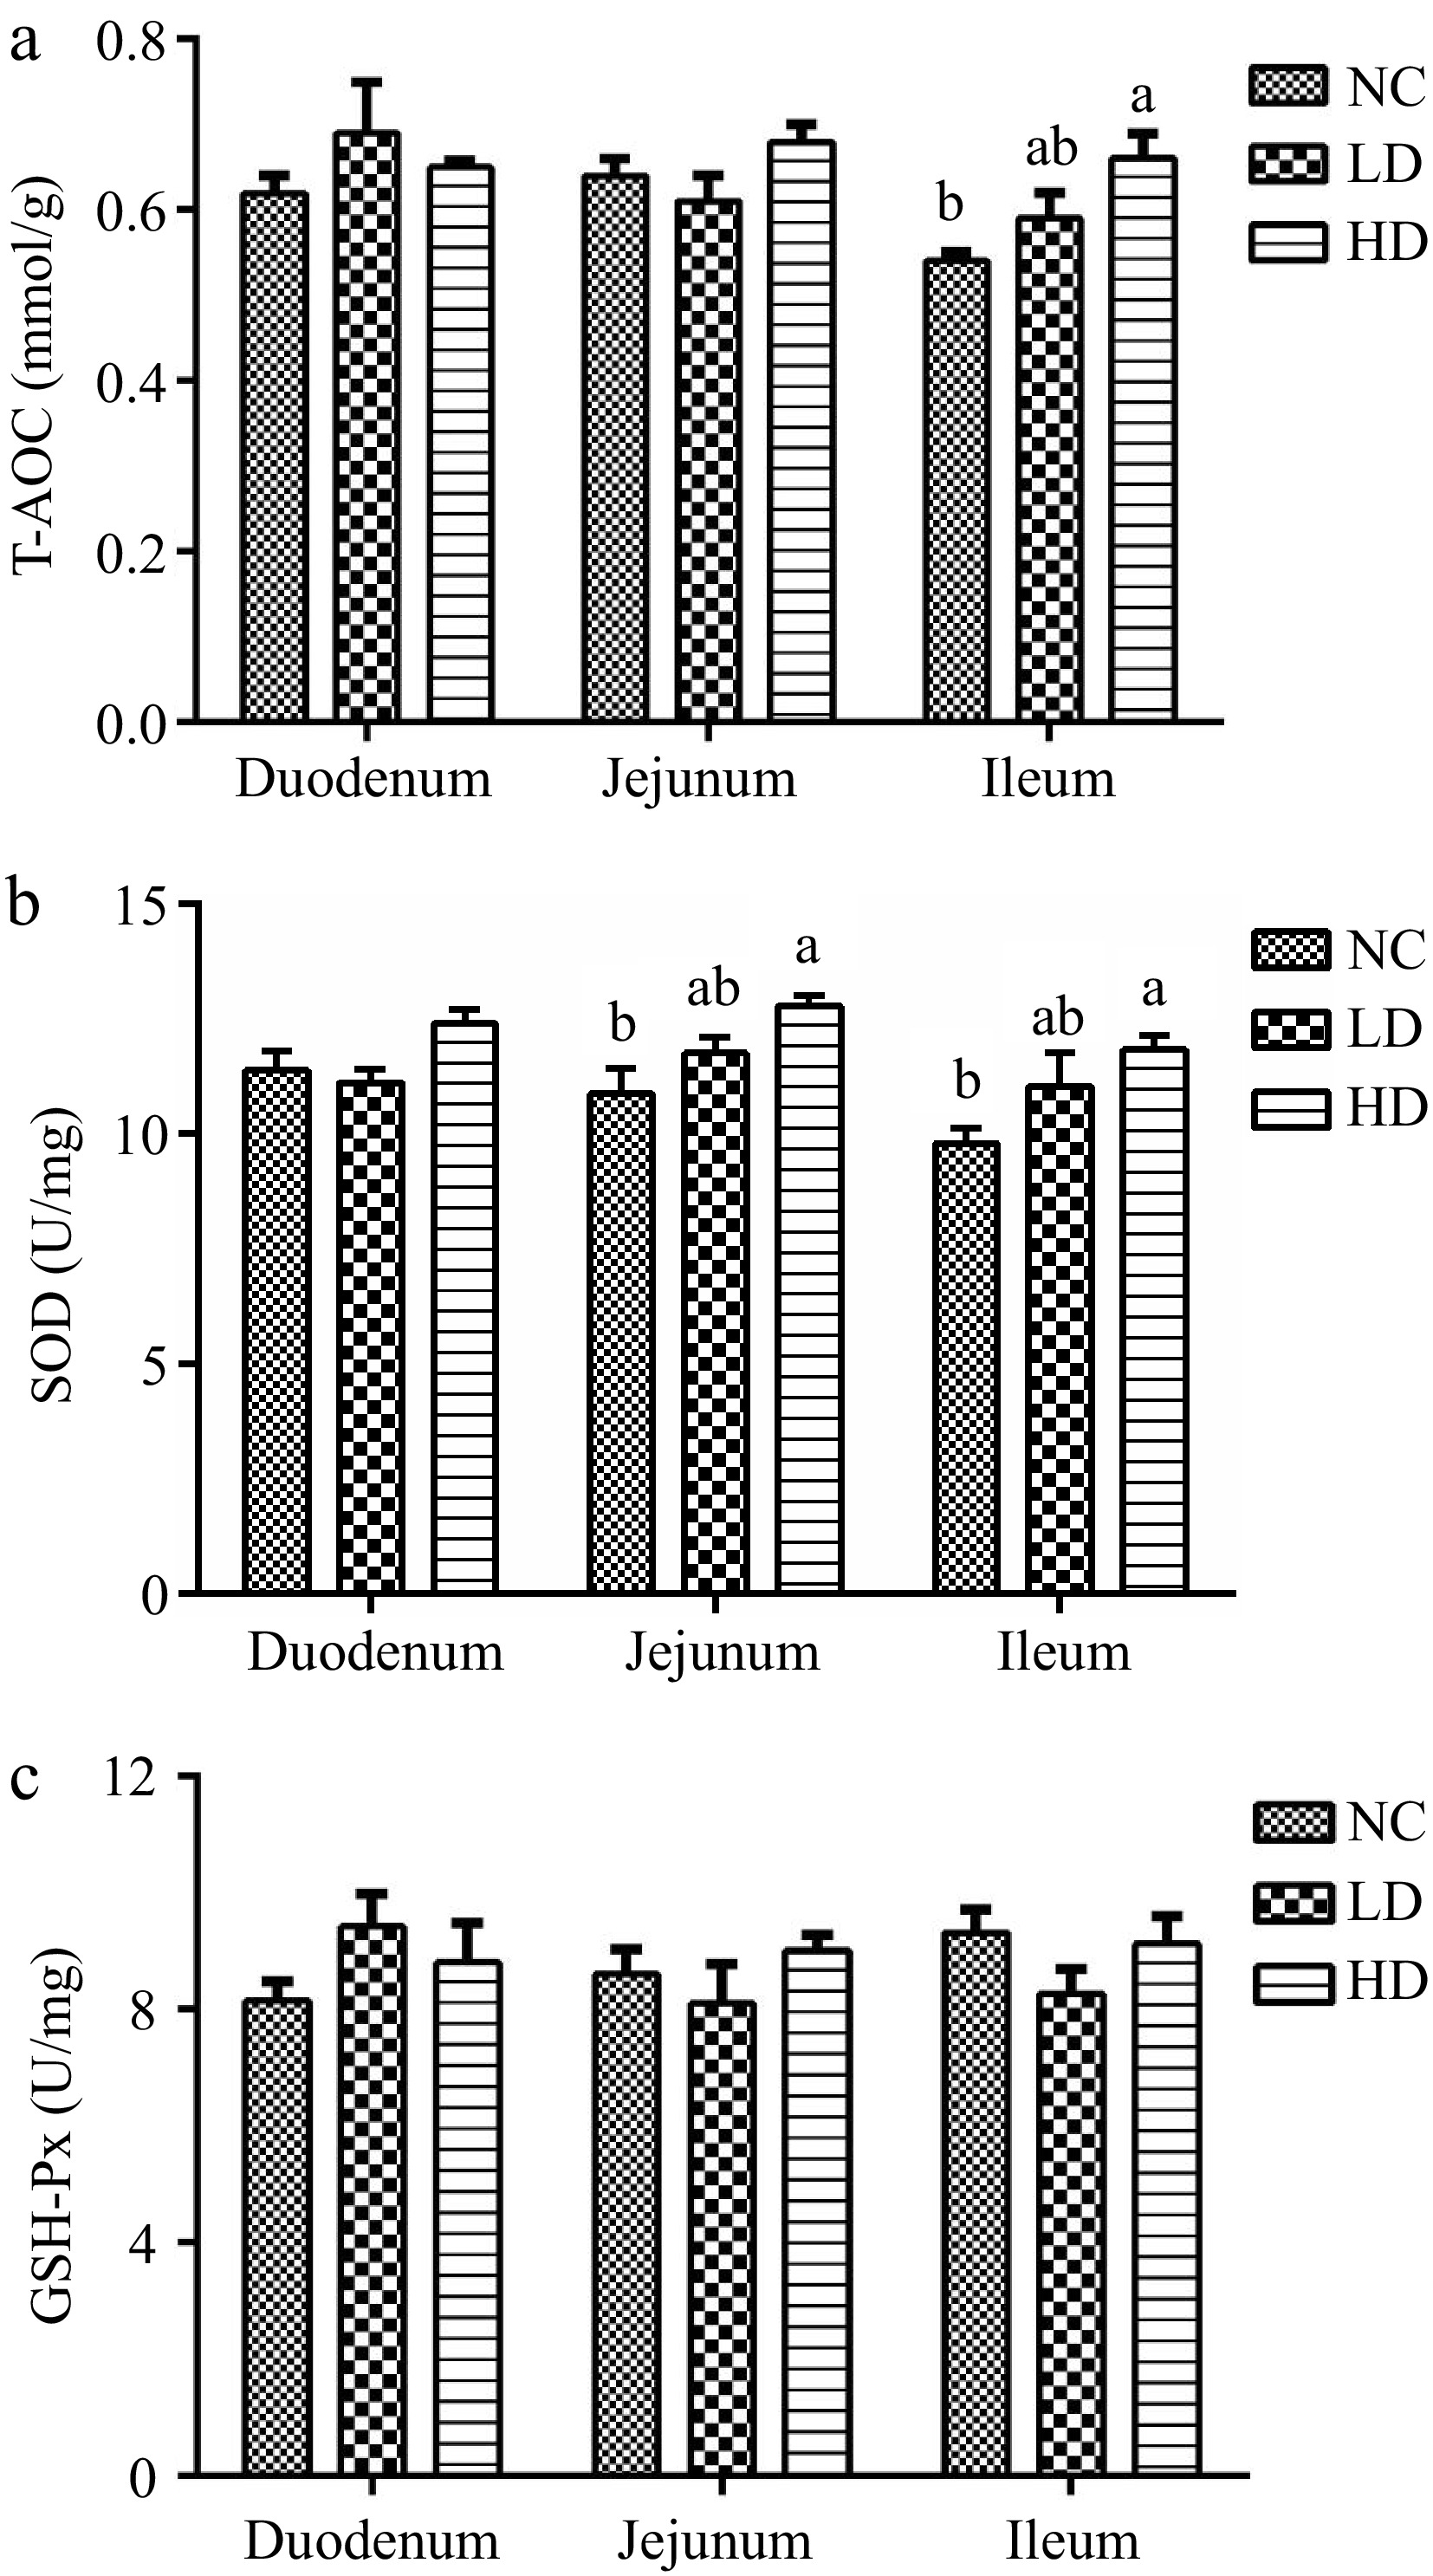
Figure 2.
Effects of dietary acidifiers on (a) T-AOC, (b) SOD, and (c) GSH-Px values of intestinal mucosa for broilers at 21 d. T-AOC: total antioxidant capacity. SOD: superoxide dismutase. GSH-Px: glutathione peroxidase. NC group: basal diet; LD group, basal diet with 330 g/t acidifiers; HD group, basal diet with 660 g/t acidifiers. Lower case letters a, b above the columns indicate that values with different superscripts were significantly different (p < 0.05). Data were expressed as mean ± SE (n = 8).
-
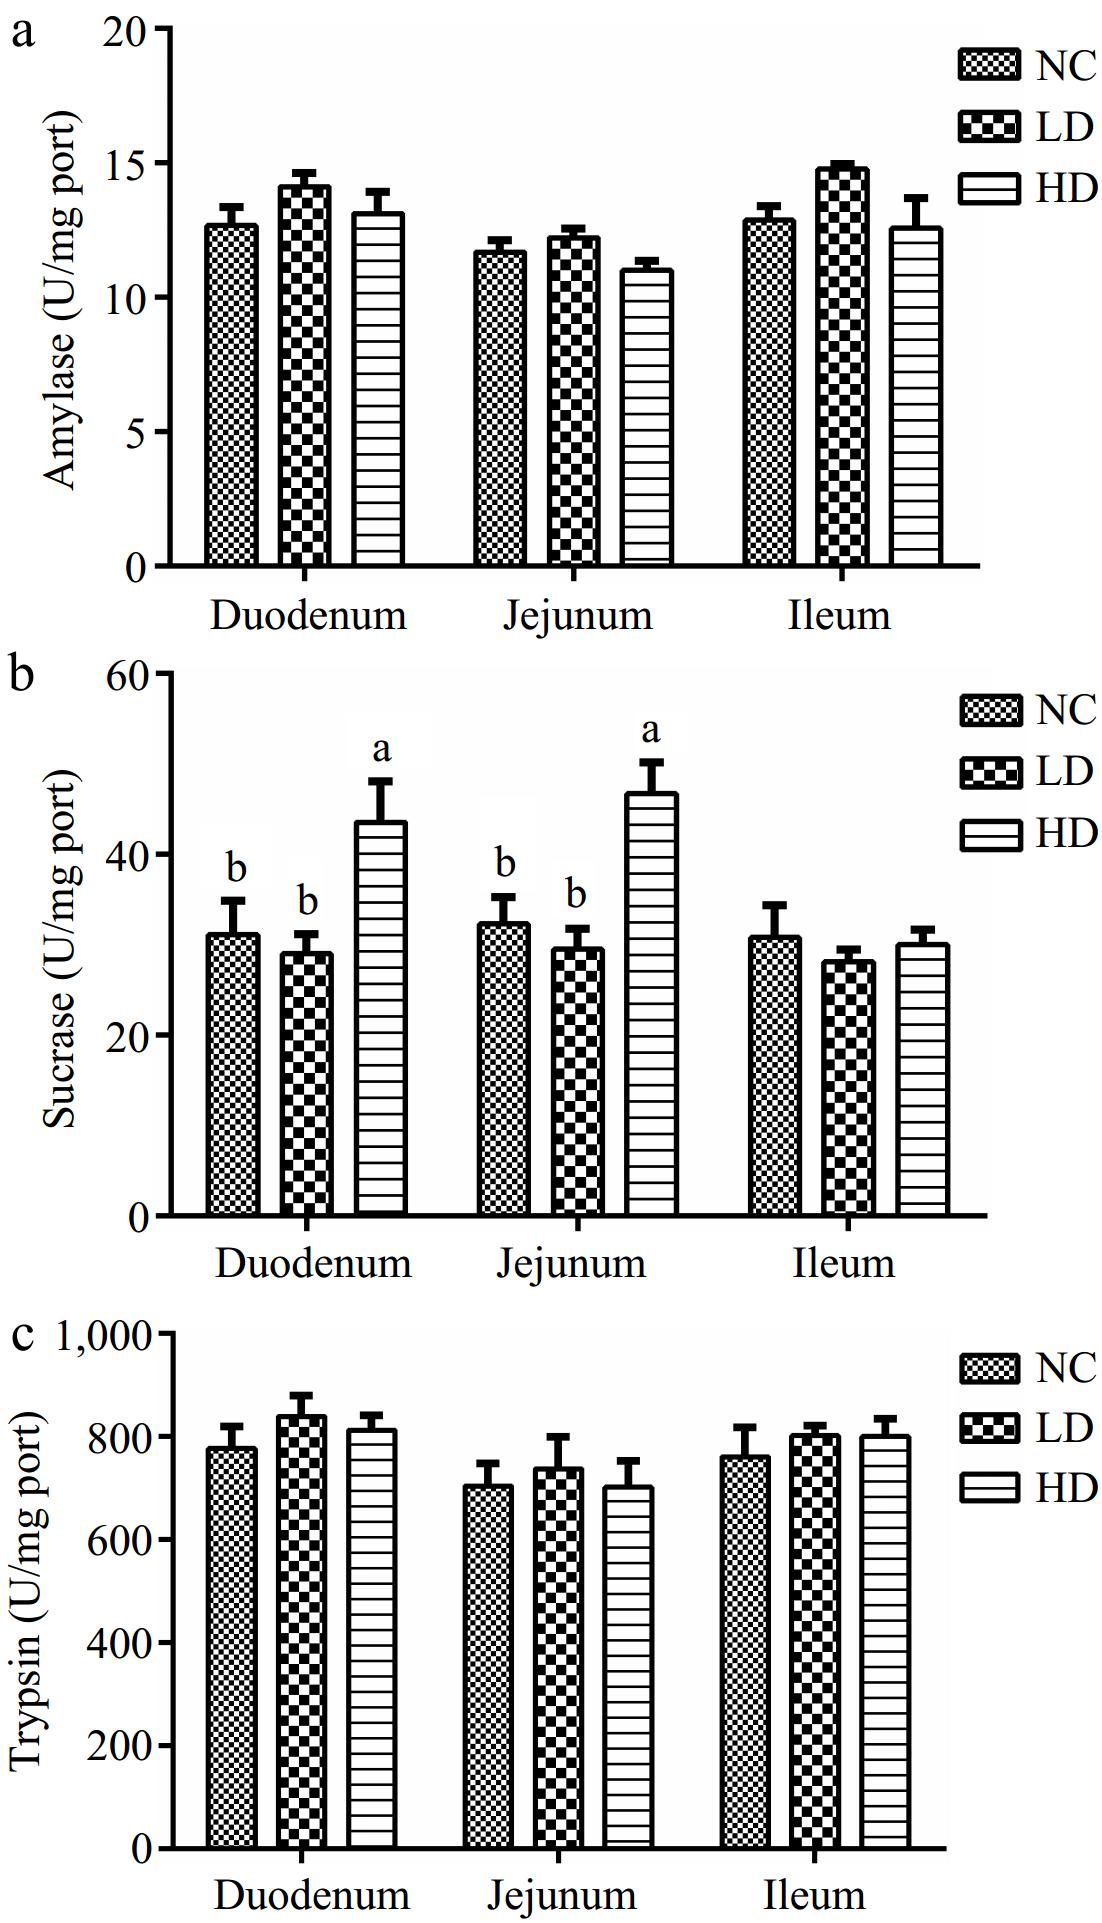
Figure 3.
Effects of dietary acidifiers on (a) amylase, (b) sucrase, and (c) trypsin activities of digestive enzymes in intestinal mucosa for broilers at 21 d. NC group: basal diet; LD group, basal diet with 330 g/t acidifiers; HD group, basal diet with 660 g/t acidifiers. a, b indicate that values with different superscripts were significantly different (p < 0.05). Data were expressed as mean ± SE (n = 8).
-
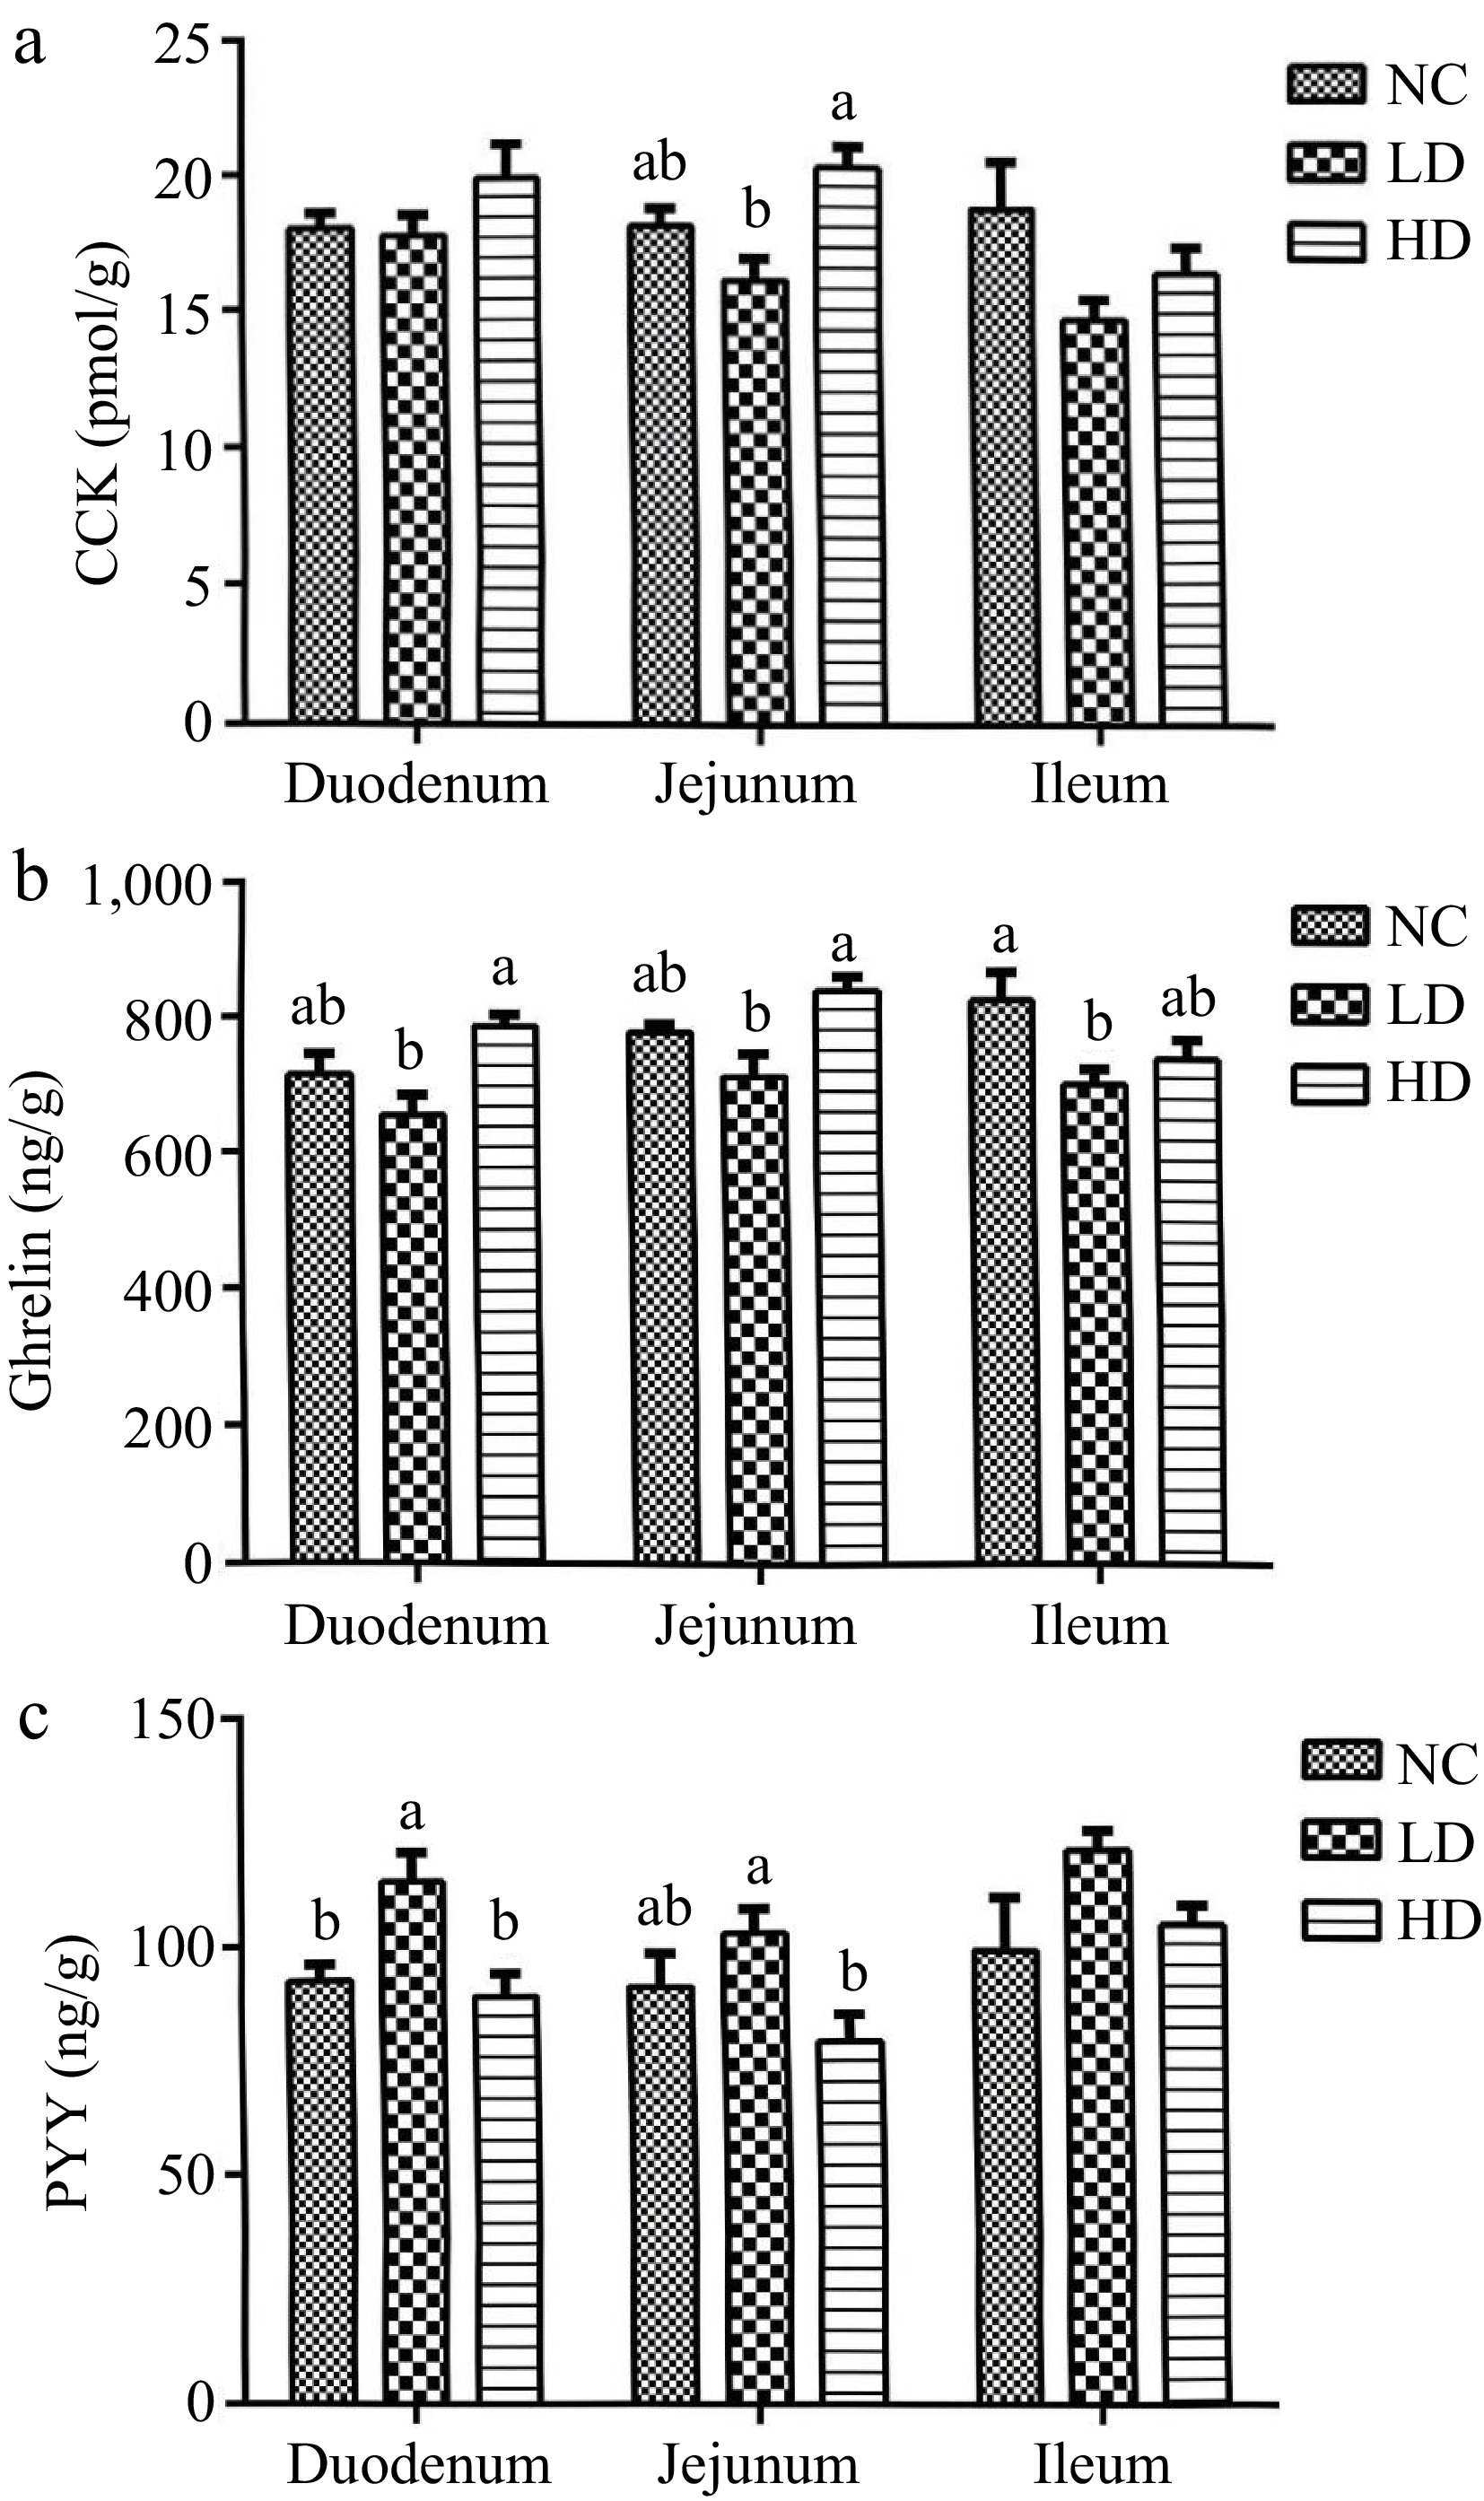
Figure 4.
Effects of dietary acidifiers on (a) CCK, (b) ghrelin, and (c) PYY levels of intestinal mucosa for broilers at 21 d. CCK: cholecystokinin. PYY: Peptide YY. NC group: basal diet; LD group, basal diet with 330 g/t acidifiers; HD group, basal diet with 660 g/t acidifiers. a, b indicates that values with different superscripts were significantly different (p < 0.05). Data were expressed as mean ± SE (n = 8).
-
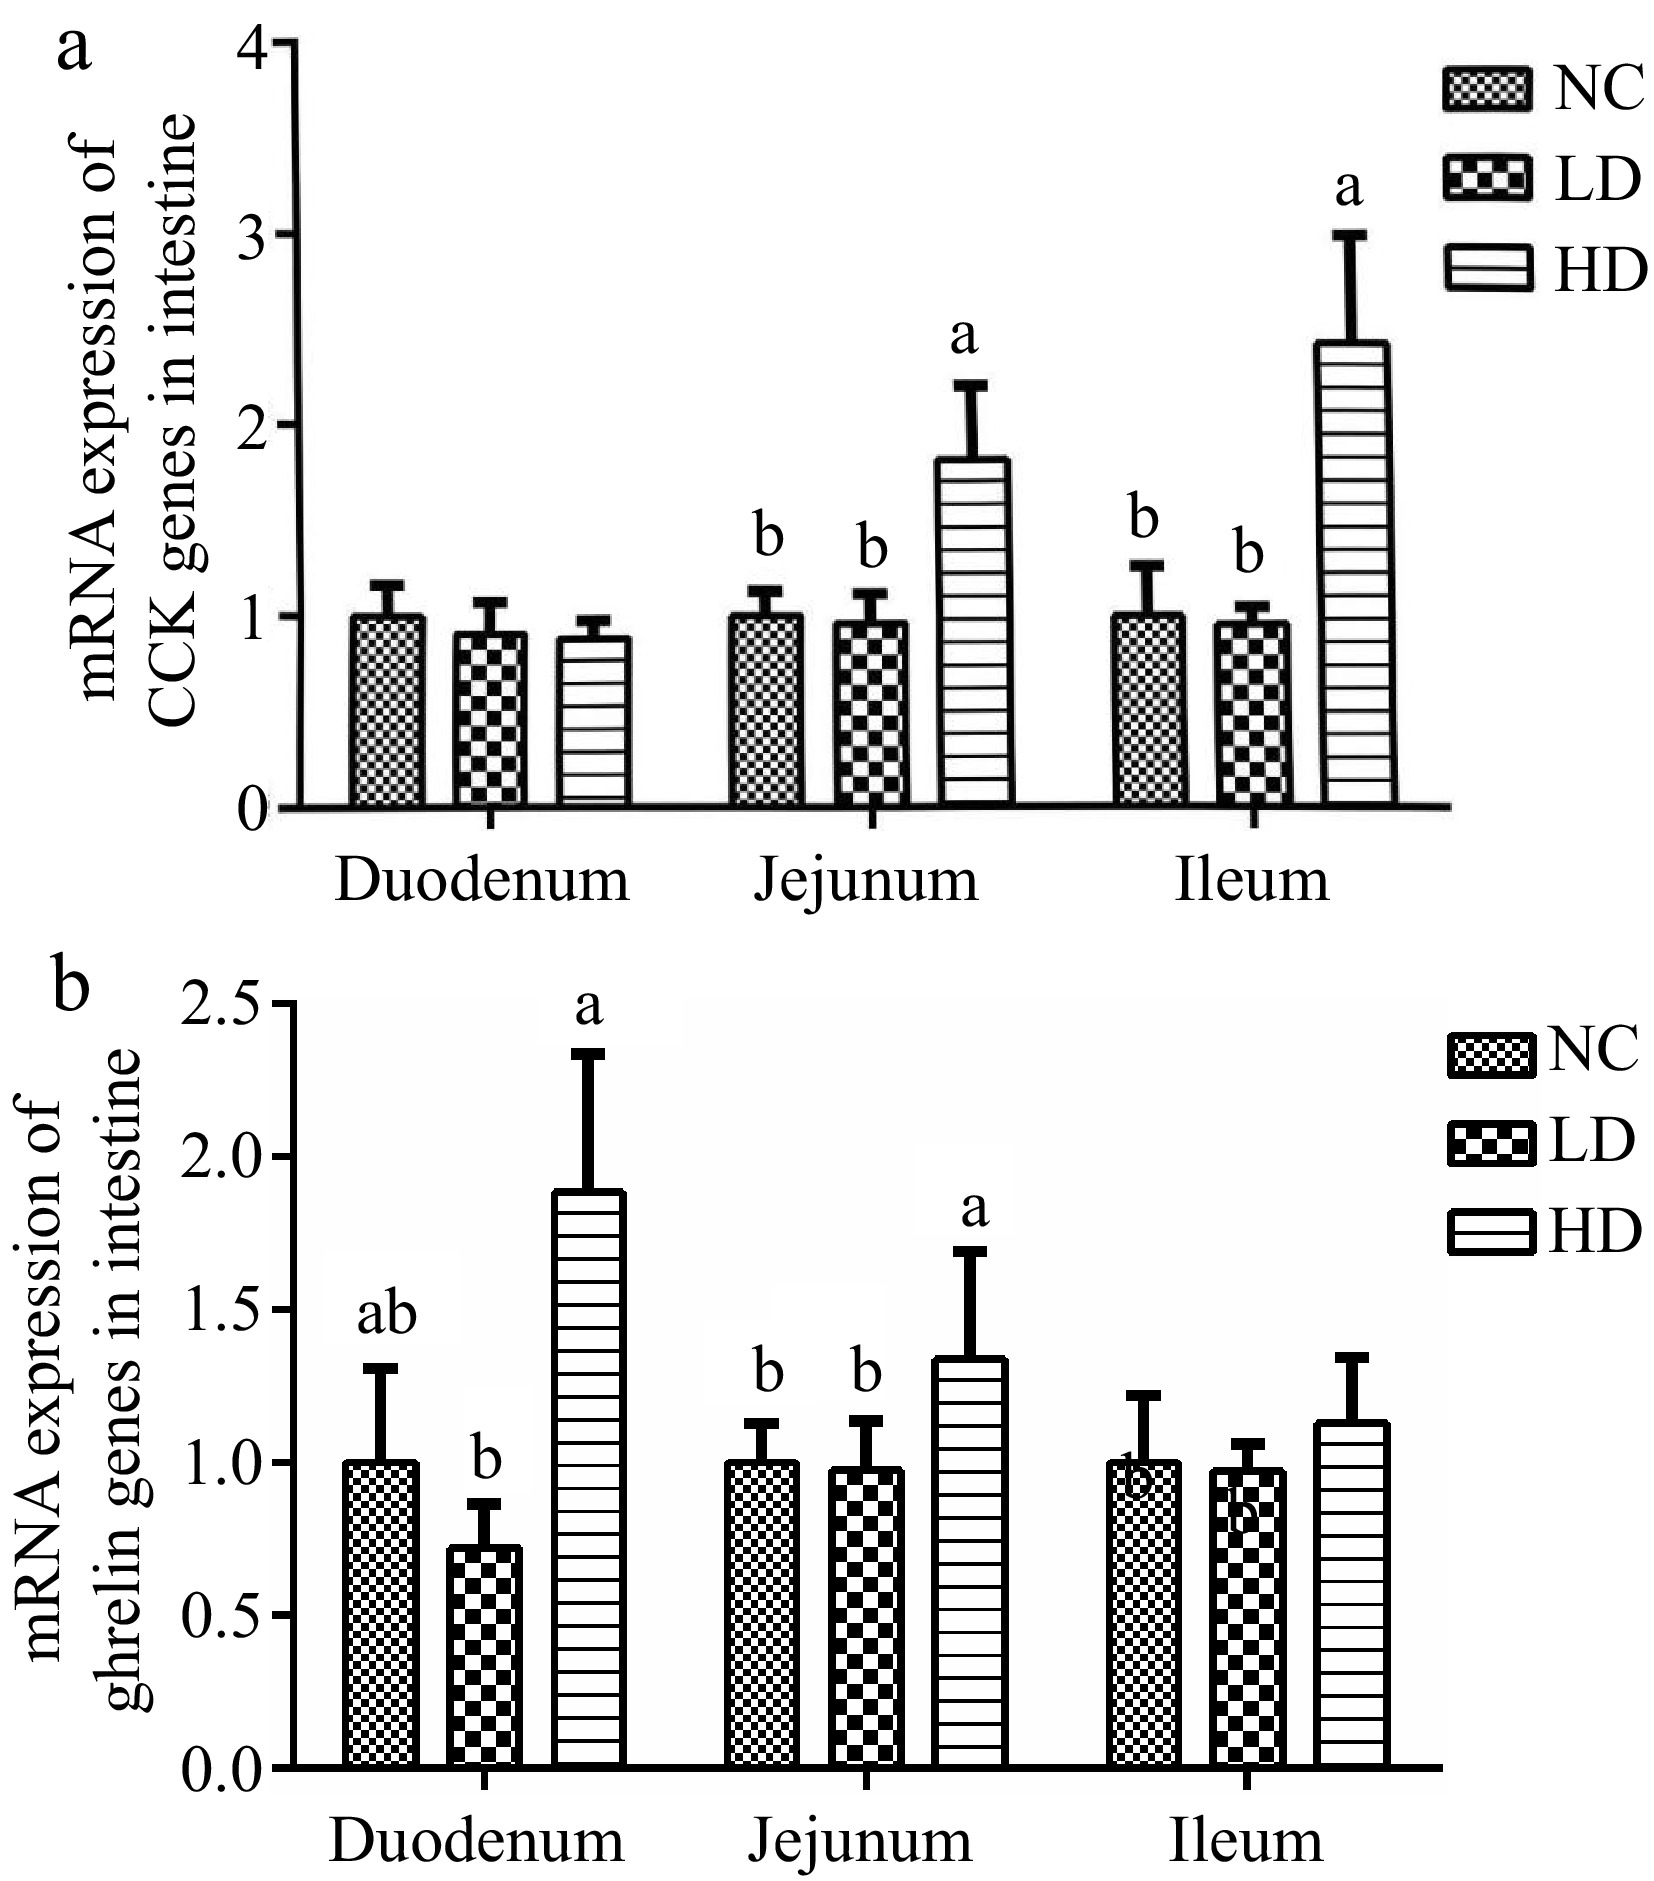
Figure 5.
Effects of dietary acidifiers on the mRNA expression of (a) CCK, and (b) ghrelin in the intestinal mucosa of broilers at 21 d. CCK: cholecystokinin. NC group: basal diet; LD group, basal diet with 330 g/t acidifiers; HD group, basal diet with 660 g/t acidifiers. a, b indicates that values with different superscripts were significantly different (p < 0.05). Data were expressed as mean ± SE (n = 8).
-
Items Starter stage
(1 to 21 d)Grower stage
(22 to 42 d)Ingredient Corn, % 55.24 59.37 Soybean meal, % 36.92 31.90 Soybean oil, % 3.50 5.00 Limestone, % 1.12 1.23 Dicalcium phosphate, % 2.10 1.50 ʟ-Lysine HCl, % 0.22 0.11 ᴅʟ-Methionine, % 0.28 0.27 Salt, % 0.30 0.30 Vitamin premix1, % 0.03 0.03 Mineral premix2, % 0.20 0.20 70% Choline chloride, % 0.09 0.09 Nutrient level Metabolisable energy (MJ/kg) 12.34 12.97 Crude protein 21.00 19.00 Calcium 1.00 0.90 Total phosphorus 0.67 0.56 Non-phytate phosphorus 0.45 0.35 Lysine 1.20 1.00 Methionine 0.52 0.46 Methionine + cystine 0.85 0.80 1 Vitamin premix provided per kilogram of diet: vitamin A, 12,000 IU; vitamin D3, 2,500 IU; vitamin E, 11 mg; menadione, 1.3 mg; thiamine, 2.21 mg; riboflavin, 7.8 mg; nicotinamide, 40 mg; calcium pantothenate, 16.5 mg; pyidoxine·HCl, 4 mg; biotin, 0.04 mg; folic acid, 1.2 mg; vitamin B12, 15 μg. 2 Mineral premix provided per kilogram of diet: iron, 80 mg; copper, 8 mg; manganese, 110 mg; zinc, 65 mg; iodine, 1.1 mg; selenium, 0.3 mg. Table 1.
Ingredient composition and calculated nutrient levels of the basal diet
-
Genes1 GeneBank
accession no.Primer sequences (5' to 3' direction) Product size (bp) GAPDH NM_204305.1 F: GAGGGTAGTGAAGGCTGCTG 113 R: CATCAAAGGTGGAGGAATGG Ghrelin NM_001001131.1 F: AACTGCTCTGGCTGGCTCT 137 R: CTCCCTCTGTTTCATCTGTAT CCK NM_001001741 F: CAGCAGAGCCTGACAGAACC 121 R: AGAGAACCTCCCAGTGGAACC 1. GADPH = glyceraldehyde-3-phosphate dehydrogenase; CCK = cholecystokinin. Table 2.
Sequences used for real-time PCR primers.
-
Items NC LD HD SEM p-value ADFI (g/d) 61.79 61.63 68.10 1.33 0.06 ADG (g/d) 34.26 34.42 34.88 0.26 0.36 F/G 1.84 1.74 1.88 0.04 0.22 NC group: basal diet; LD group, basal diet with 330 g/t acidifiers; HD group, basal diet with 660 g/t acidifiers; SEM: Standard Error of the Mean; ADFI = average daily feed intake; ADG = average daily gain; F/G = feed/gain. Table 3.
Effects of dietary acidifiers on growth performance of broilers at 21 d of age.
-
Item NC LD HD SEM p-value Duodenum 7.16 6.63 6.64 0.13 0.12 Jejunum 6.18 6.54 6.66 0.07 0.39 Ileum 6.41 6.65 6.71 0.05 0.06 Caecum 7.08 6.80 7.28 0.08 0.14 NC group: basal diet; LD group, basal diet with 330 g/t acidifiers; HD group, basal diet with 660 g/t acidifiers; SEM: Standard Error of the Mean. Table 4.
Effects of dietary acidifiers on pH value of digestive tract of broilers at 21 d of age.
-
Item NC LD HD SEM p-value Duodenum VH (μm) 935.09b 993.07a 944.44b 8.05 <0.01 CD (μm) 29.16a 27.17b 25.03c 0.56 0.02 VH/CD 33.35c 37.81b 40.45a 0.82 <0.01 Ileum VH (μm) 620.95 614.71 650.46 7.87 0.11 CD (μm) 29.21 28.26 26.82 0.47 0.14 VH/CD 21.54b 22.48ab 24.80a 0.47 0.01 Jejunum VH (μm) 863.22 901.45 917.96 10.24 0.08 CD (μm) 28.11 26.95 26.42 0.43 0.26 VH/CD 31.94c 34.40b 36.36a 0.64 0.03 VH: Villus height; CD: Crypt depth; NC group: basal diet; LD group, basal diet with 330 g/t acidifiers; HD group, basal diet with 660 g/t acidifiers. Lower case letters a, b & c indicate that values with different superscripts were significantly different (p < 0.05). SEM: Standard Error of the Mean. Table 5.
Effects of dietary acidifiers on intestinal morphology of broilers at 21 d of age.
Figures
(5)
Tables
(5)