-
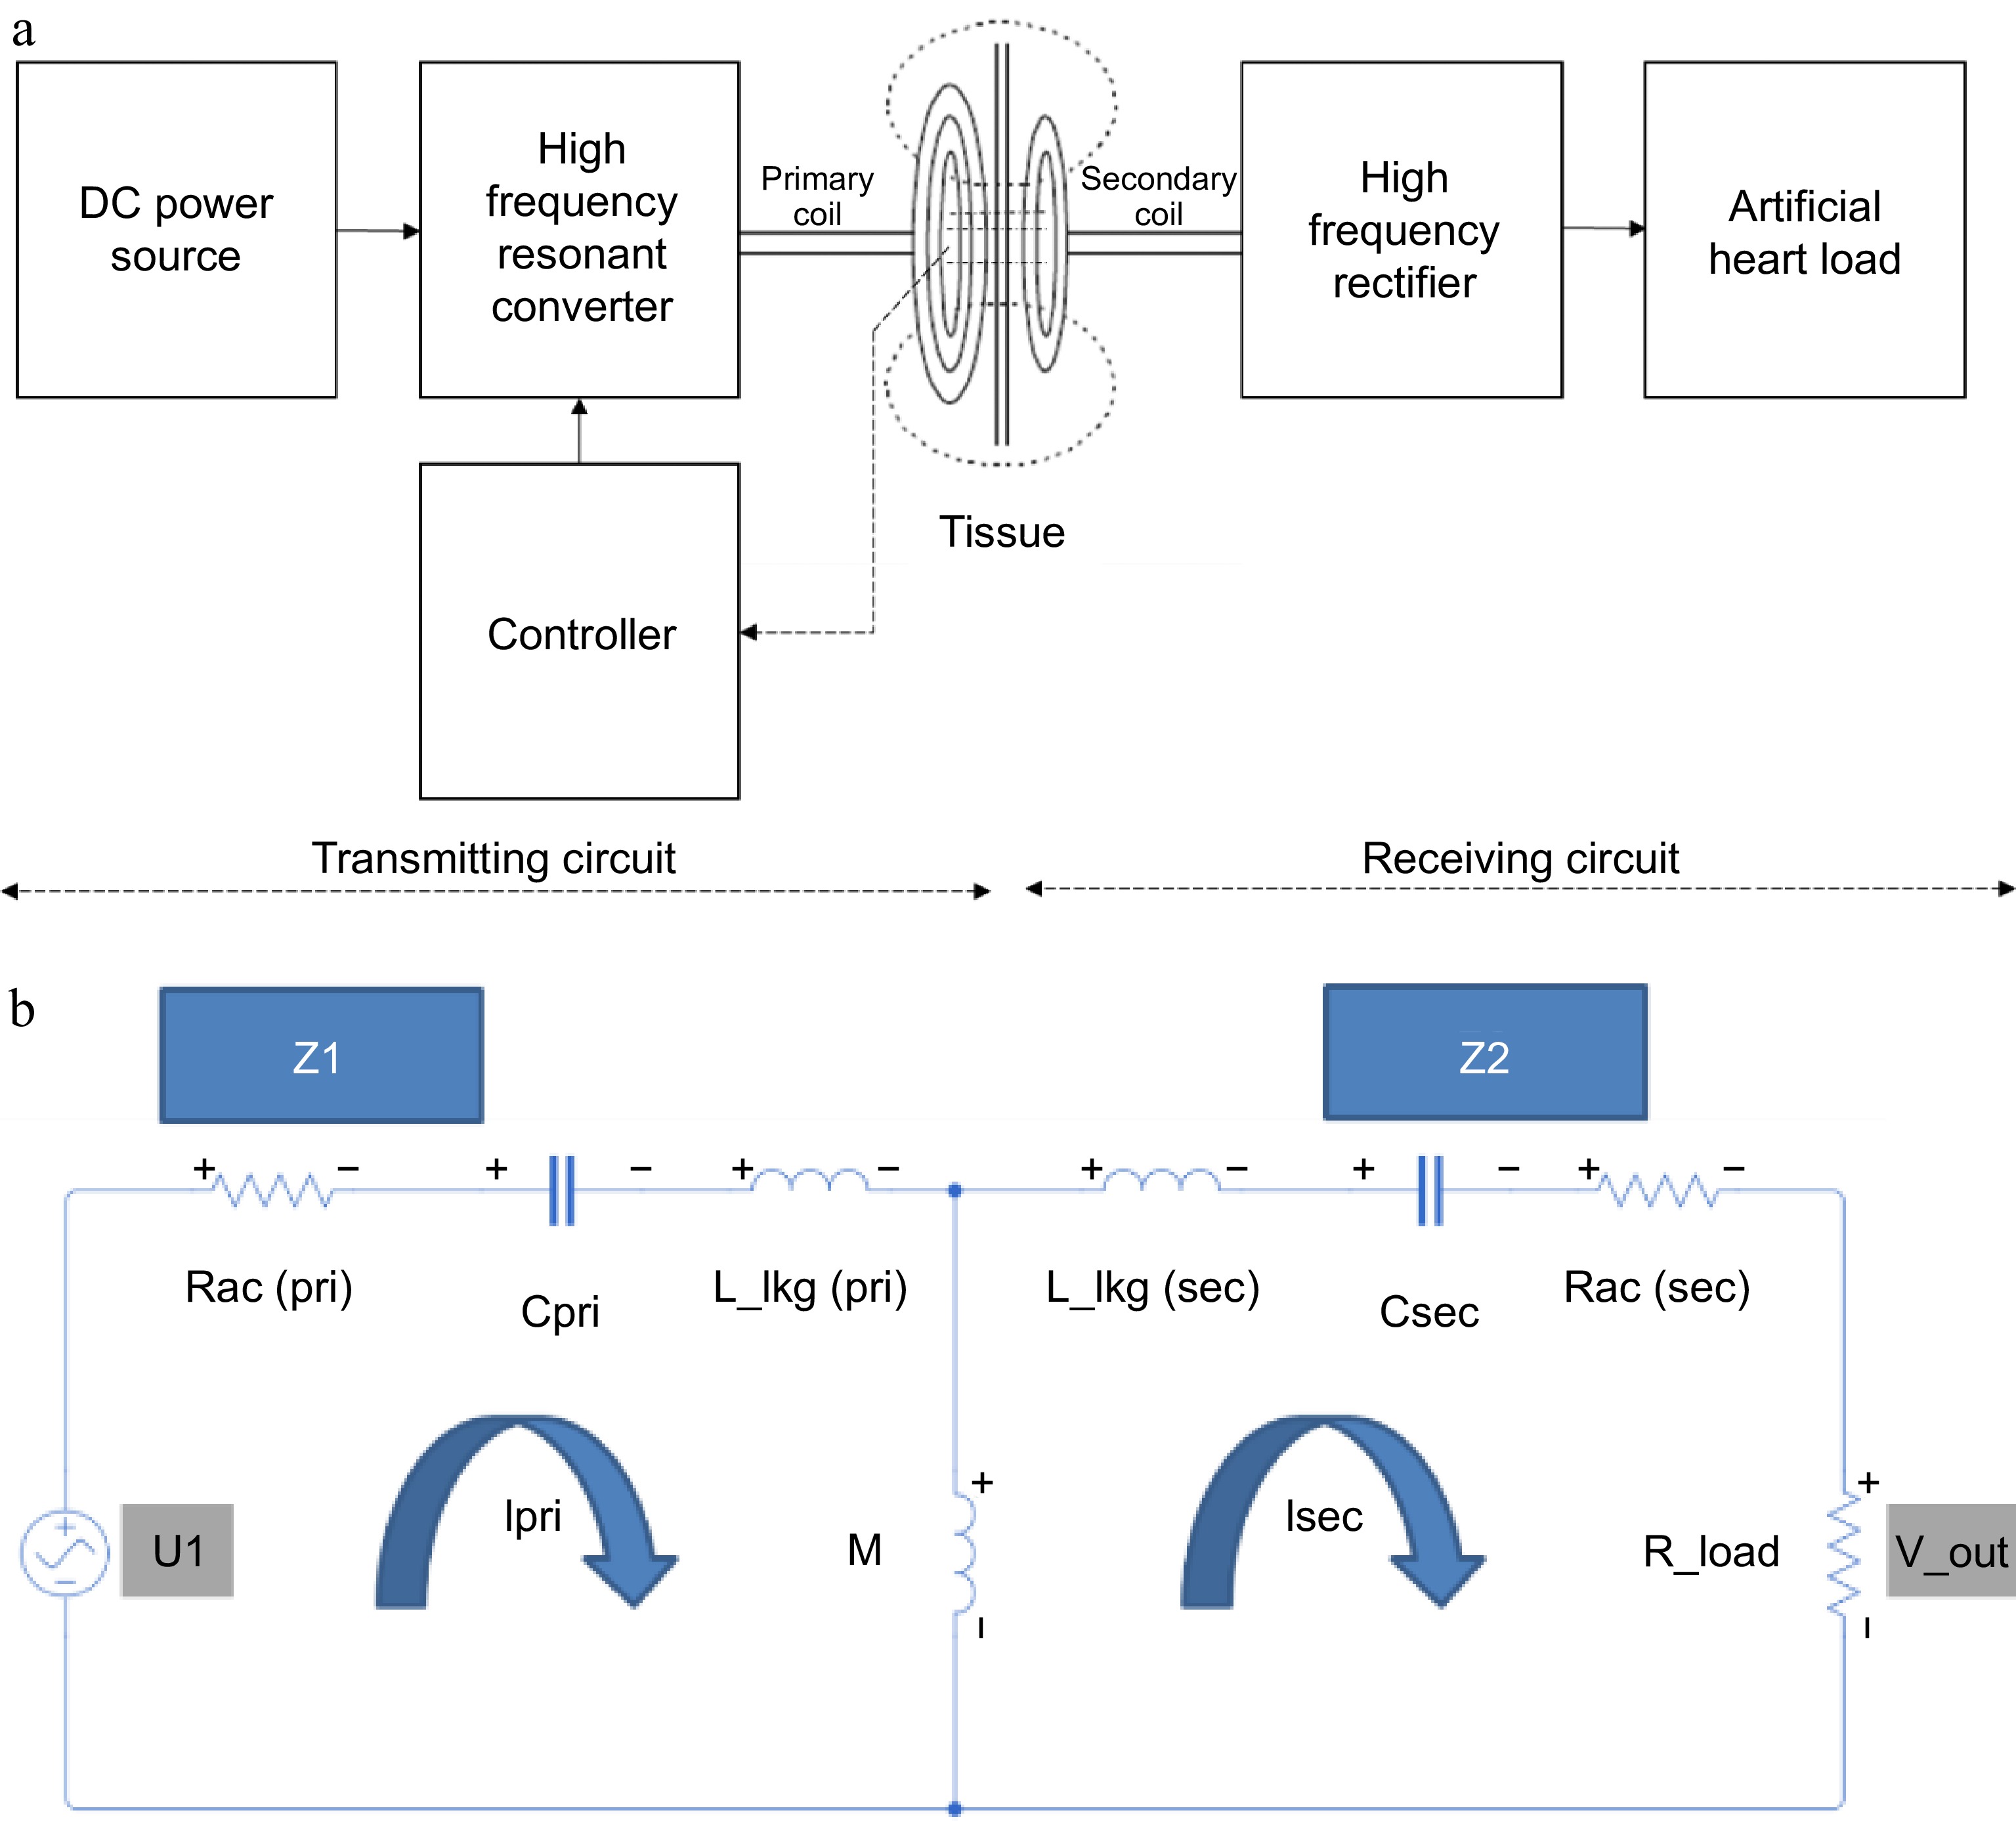
Figure 1.
(a) TETS architecture. (b) Lumped parameter model.
-
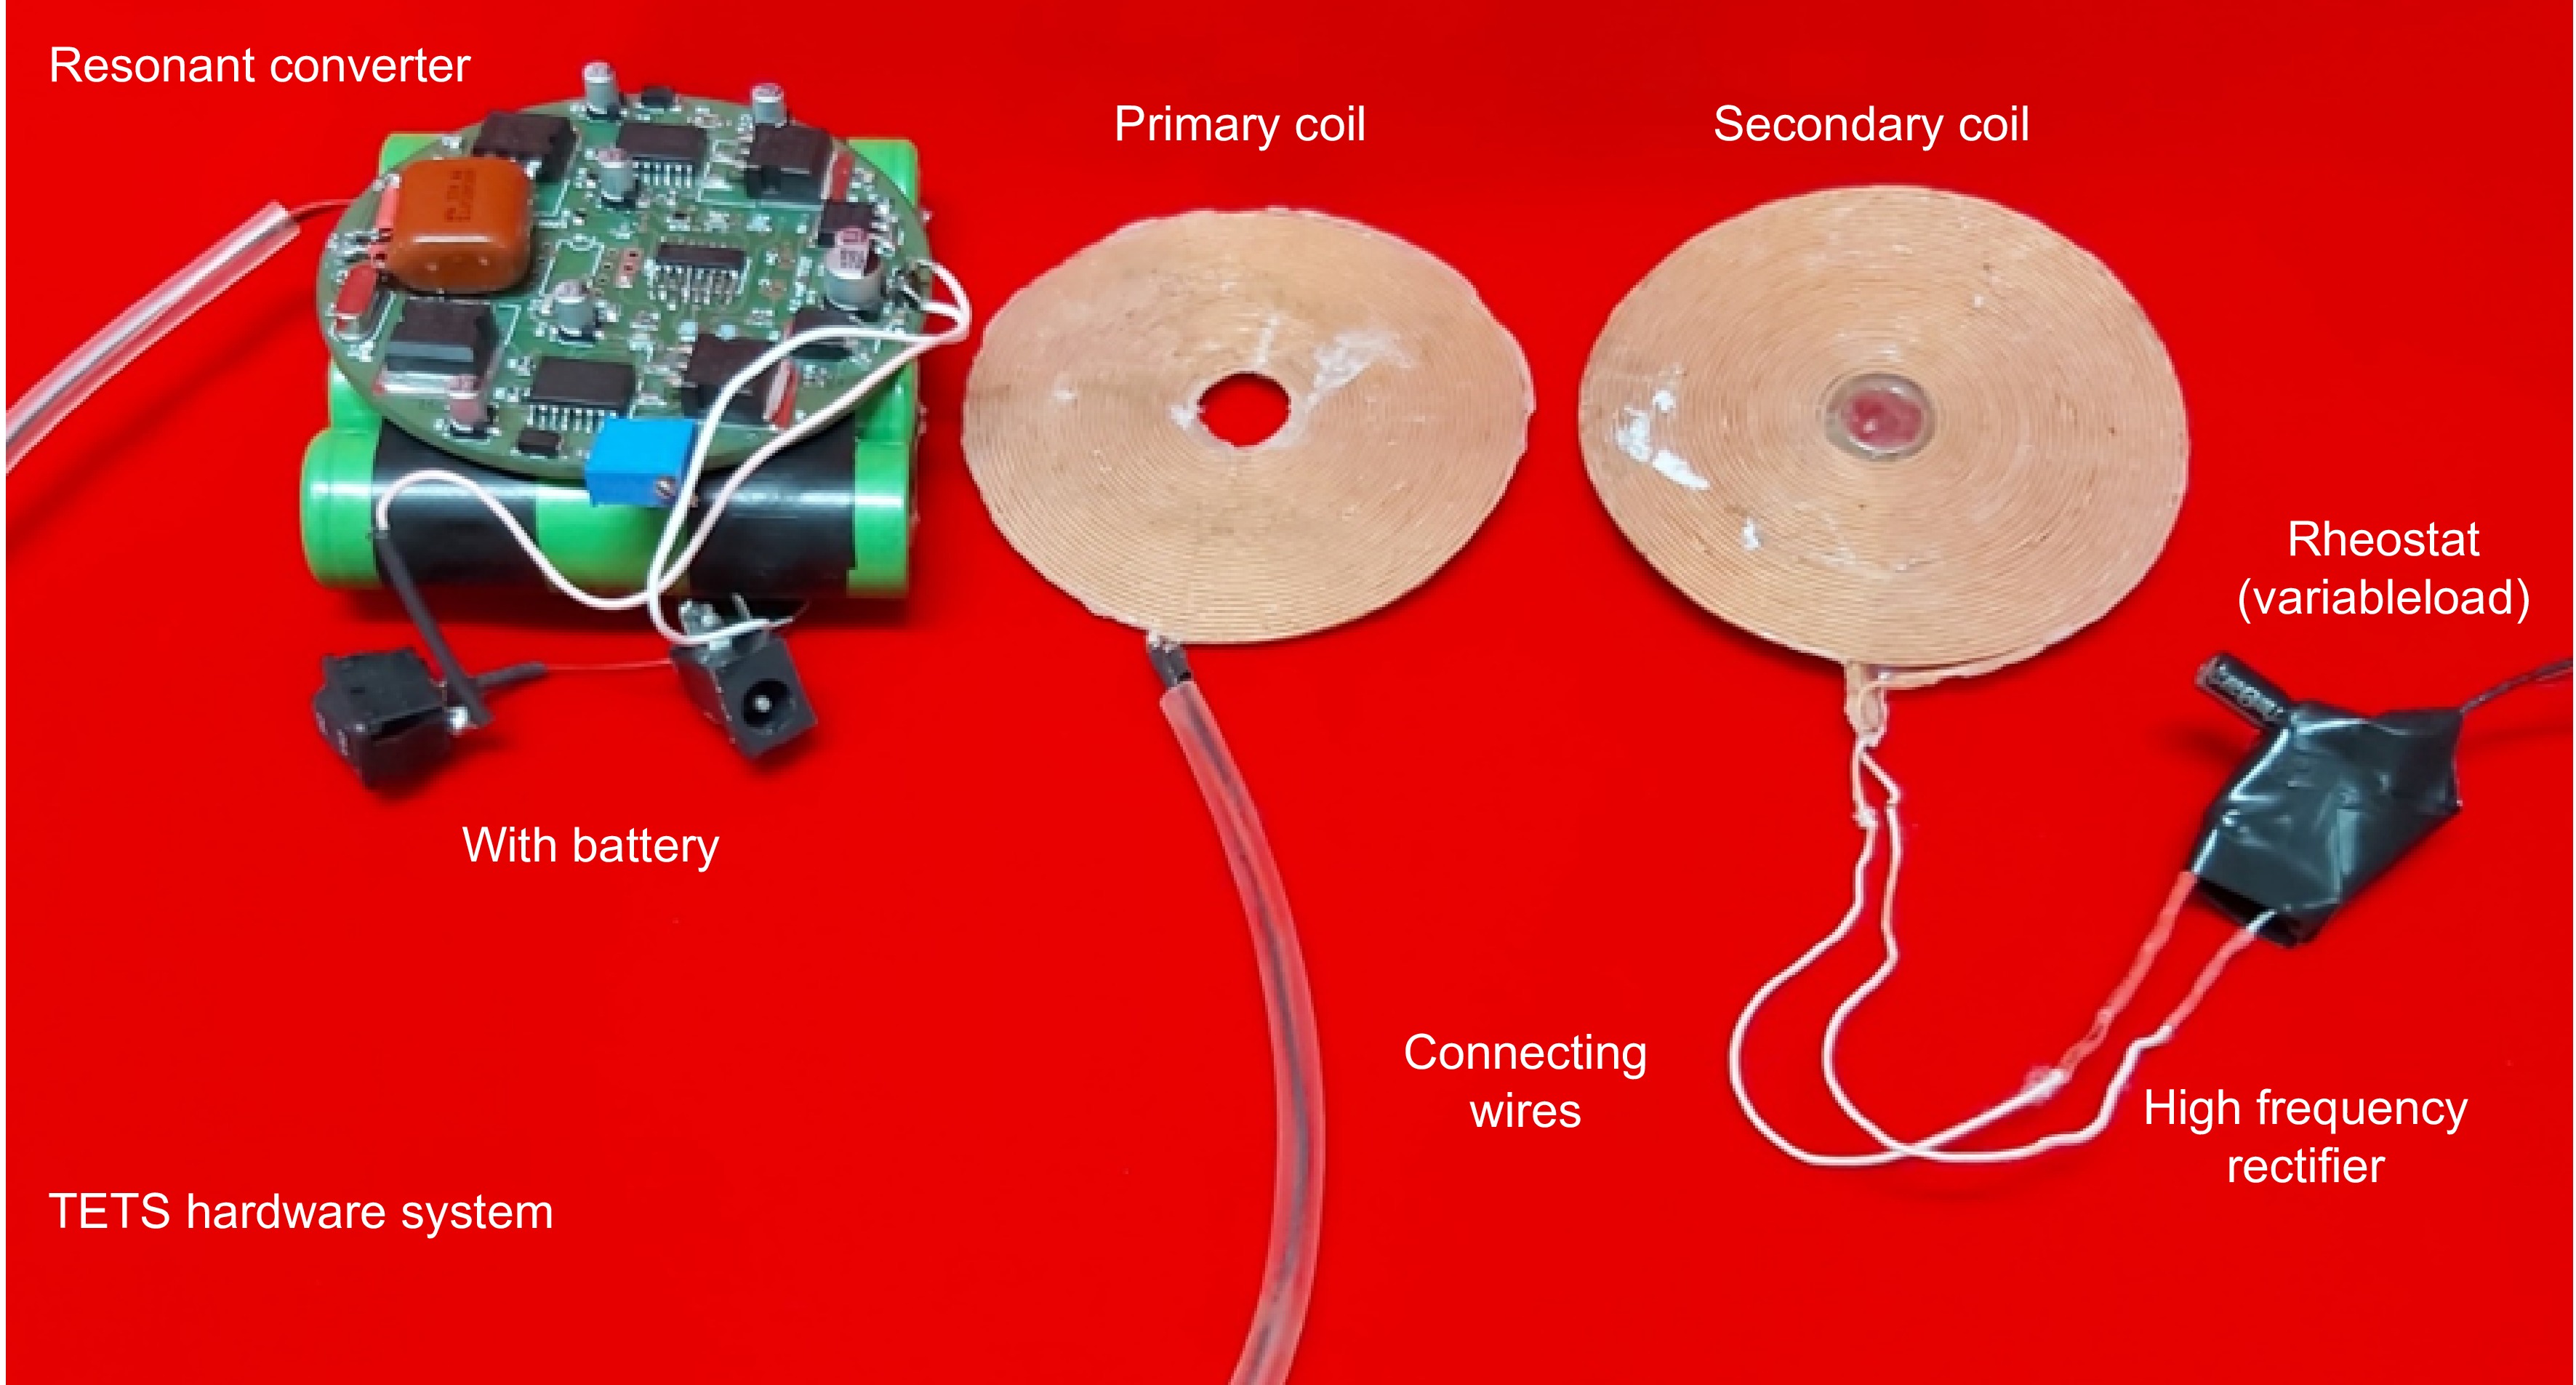
Figure 2.
TETS hardware.
-
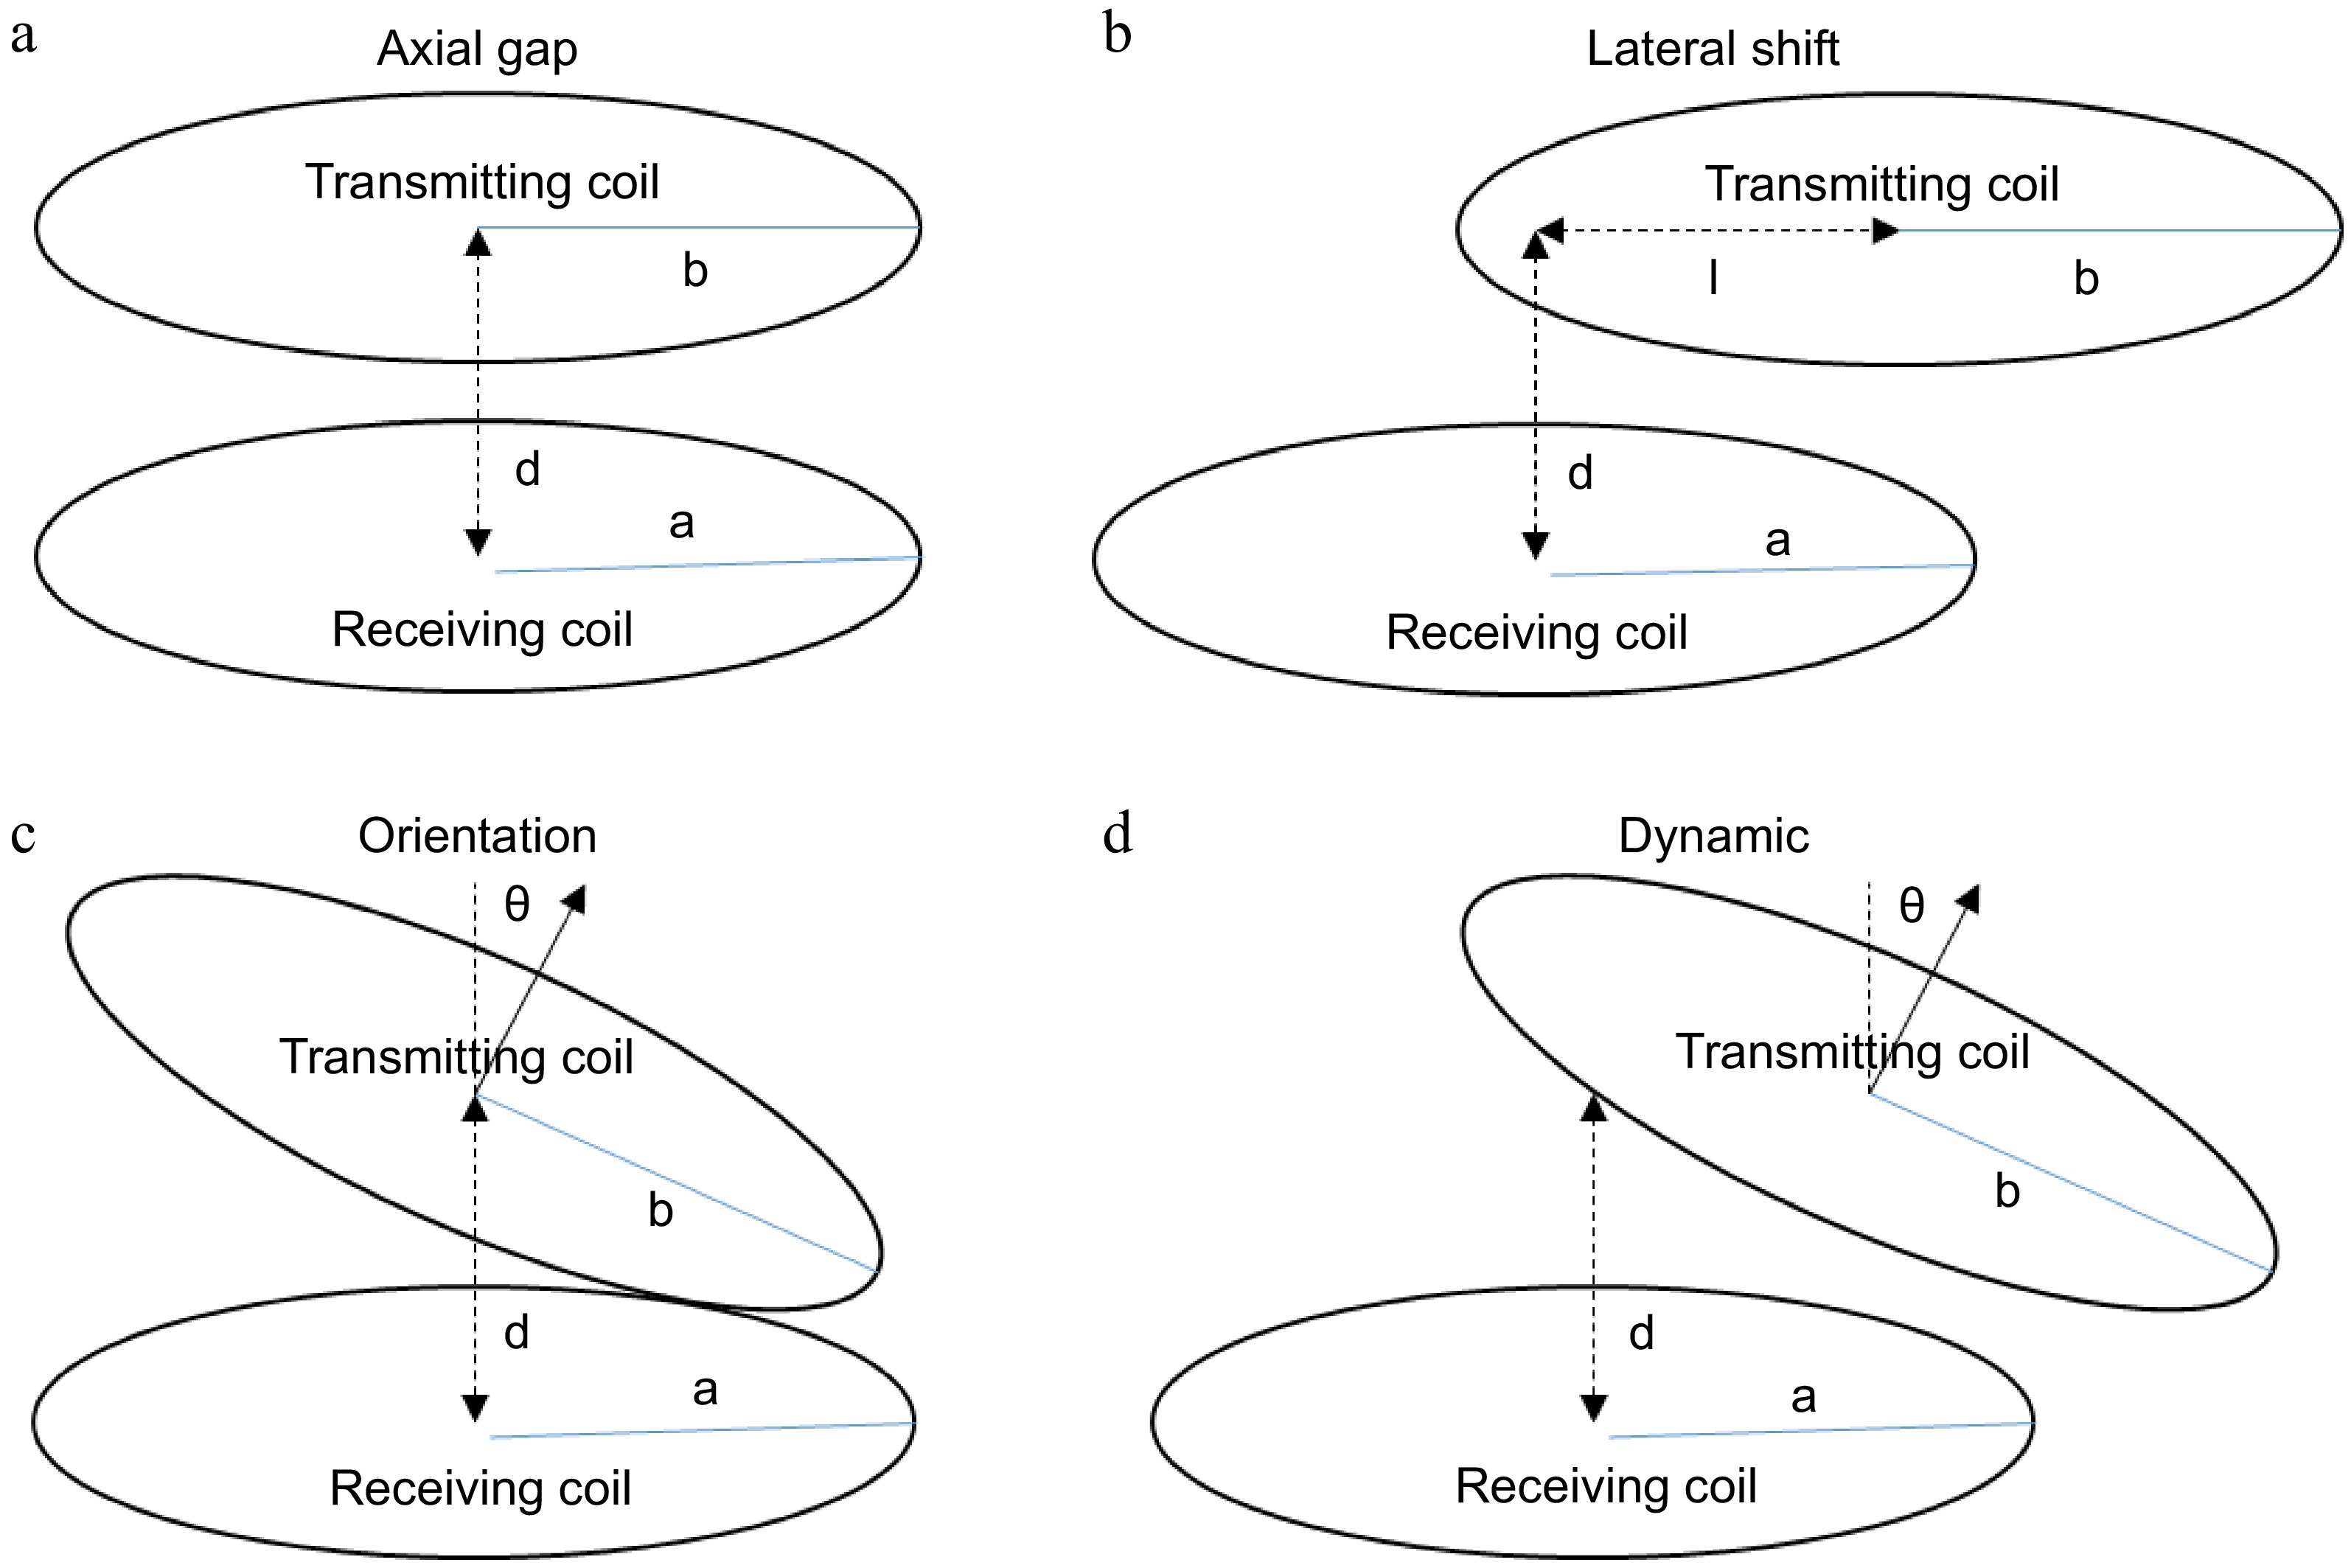
Figure 3.
TETS dynamic operating situations. (a) Varying skin thickness; (b) Replacement; (c) Posture variations; (d) Respiration and movements.
-
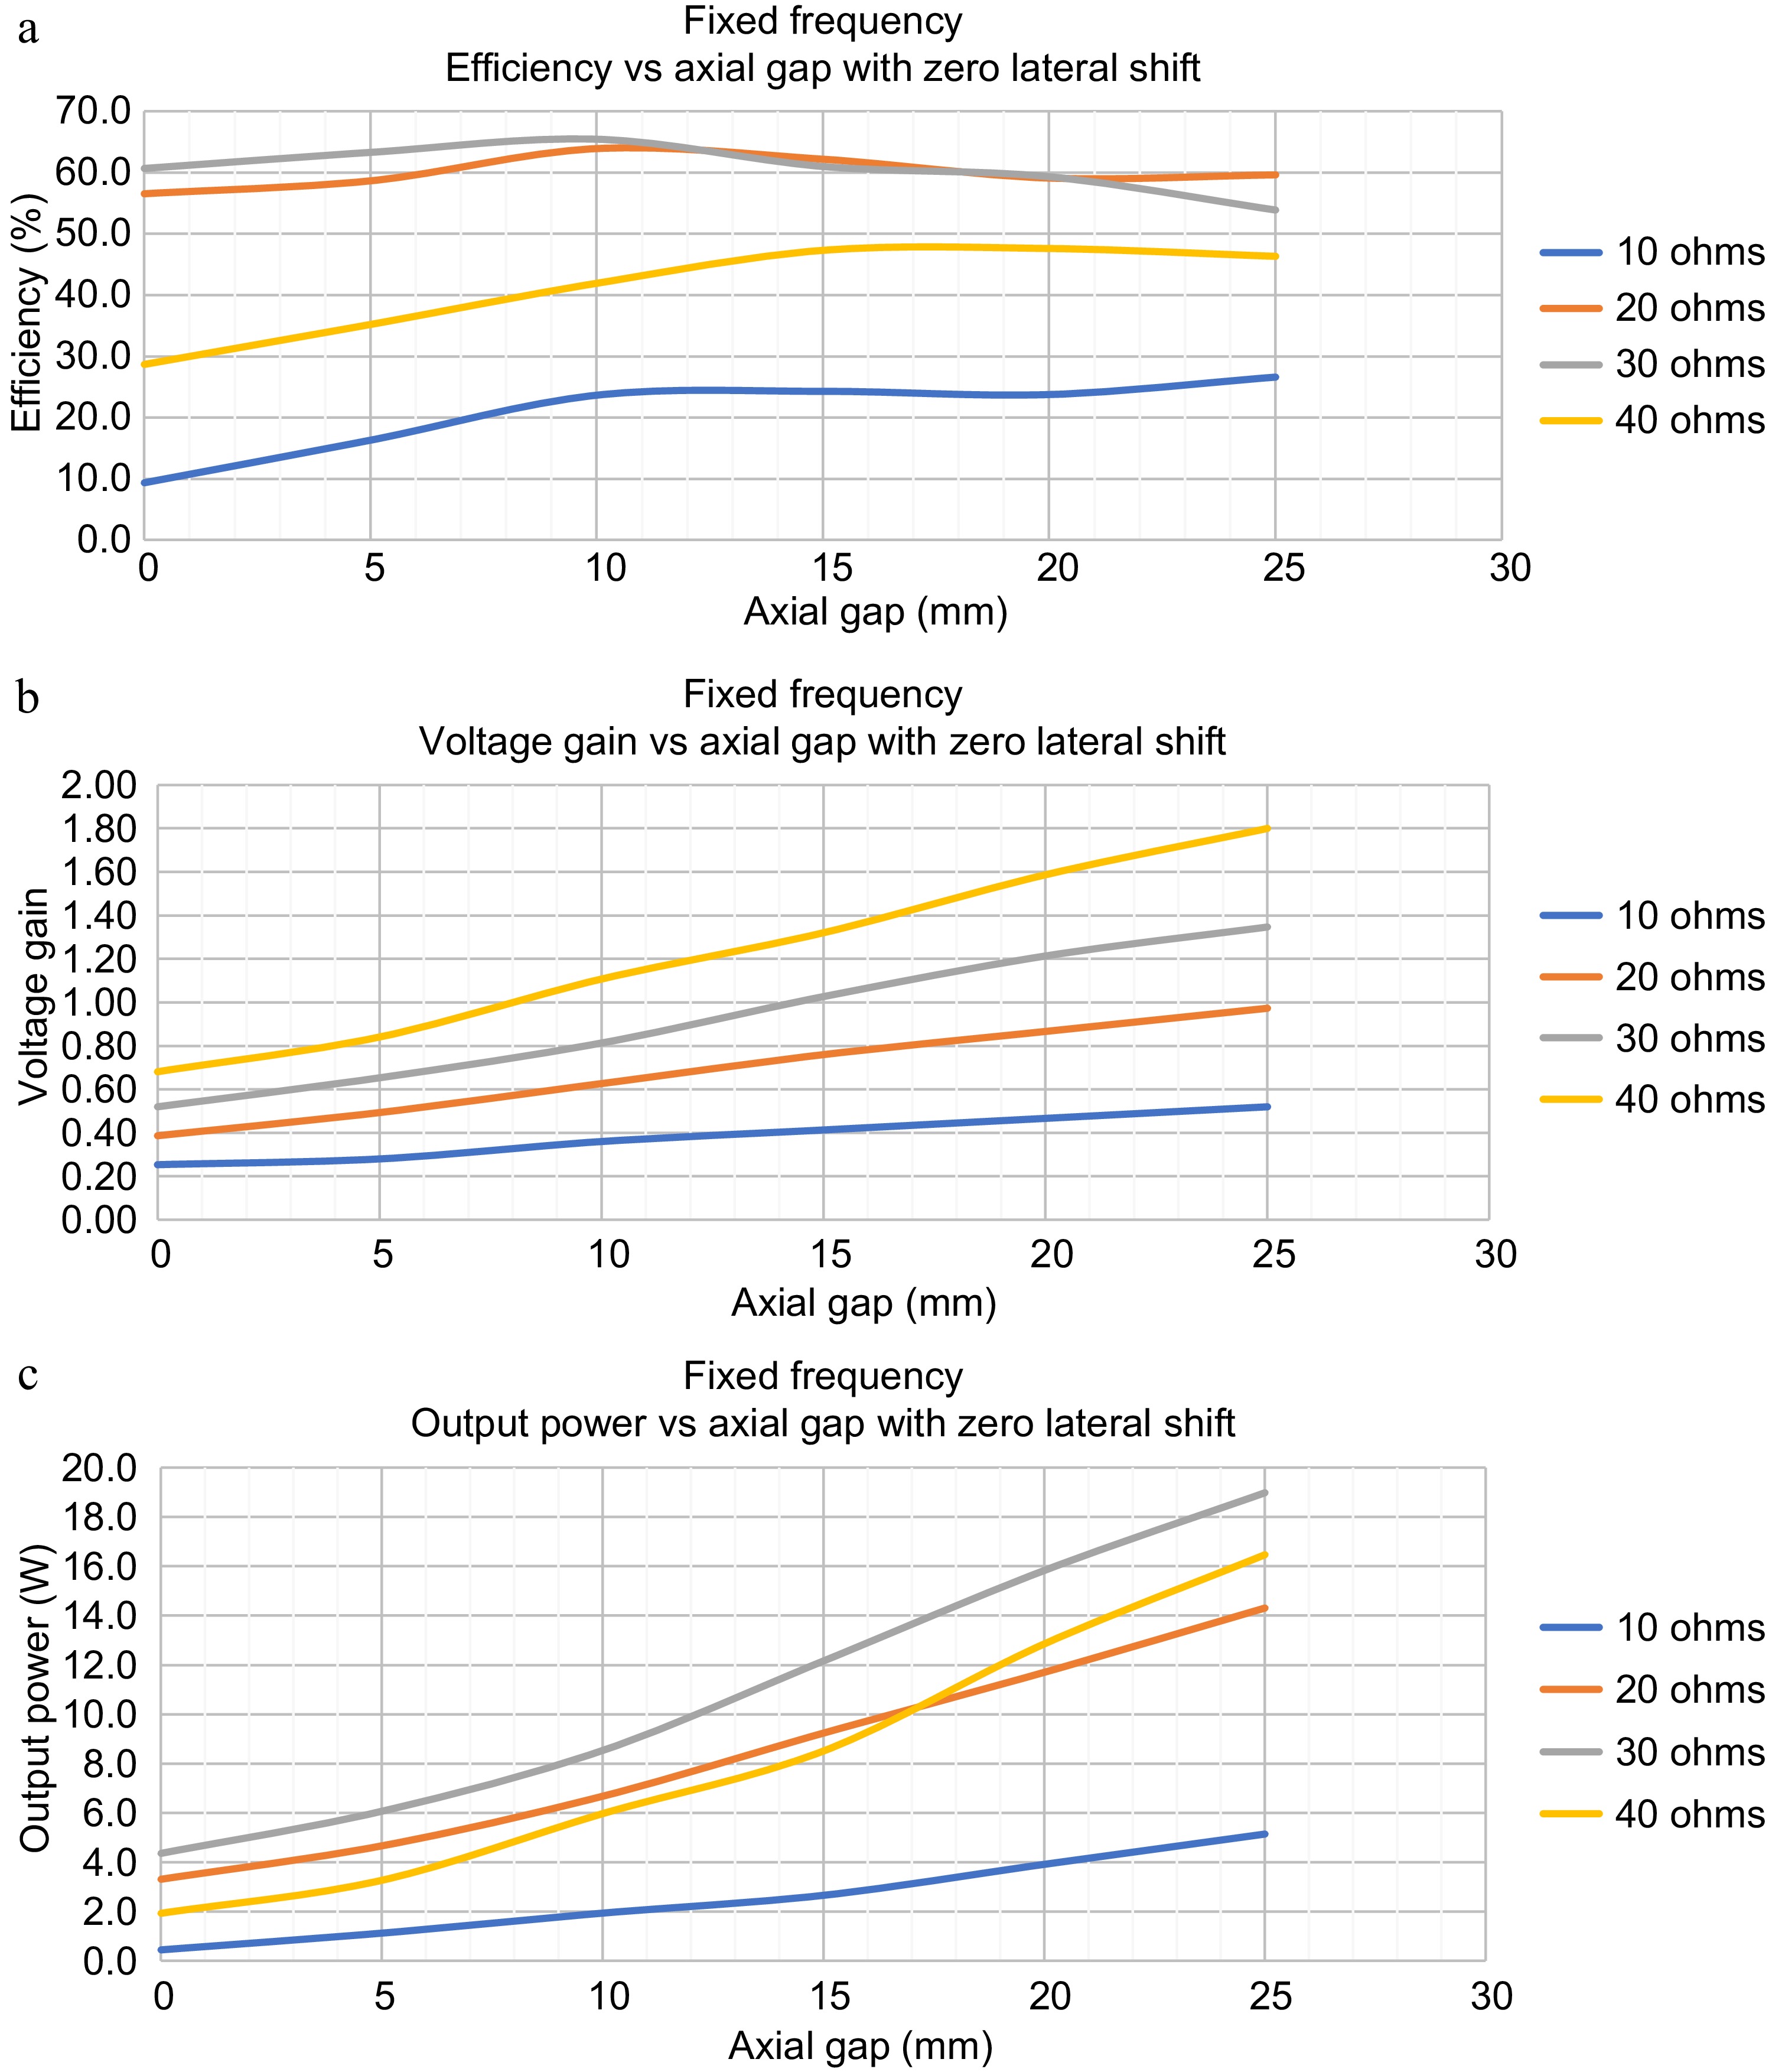
Figure 4.
Dynamic Response of TETS without any control for axial gap variations and load variations. (a) Efficiency vs axial gap for zero lateral shift. (b) Voltage gain vs axial gap for zero lateral shift. (c) Output power vs axial gap for zero lateral shift.
-
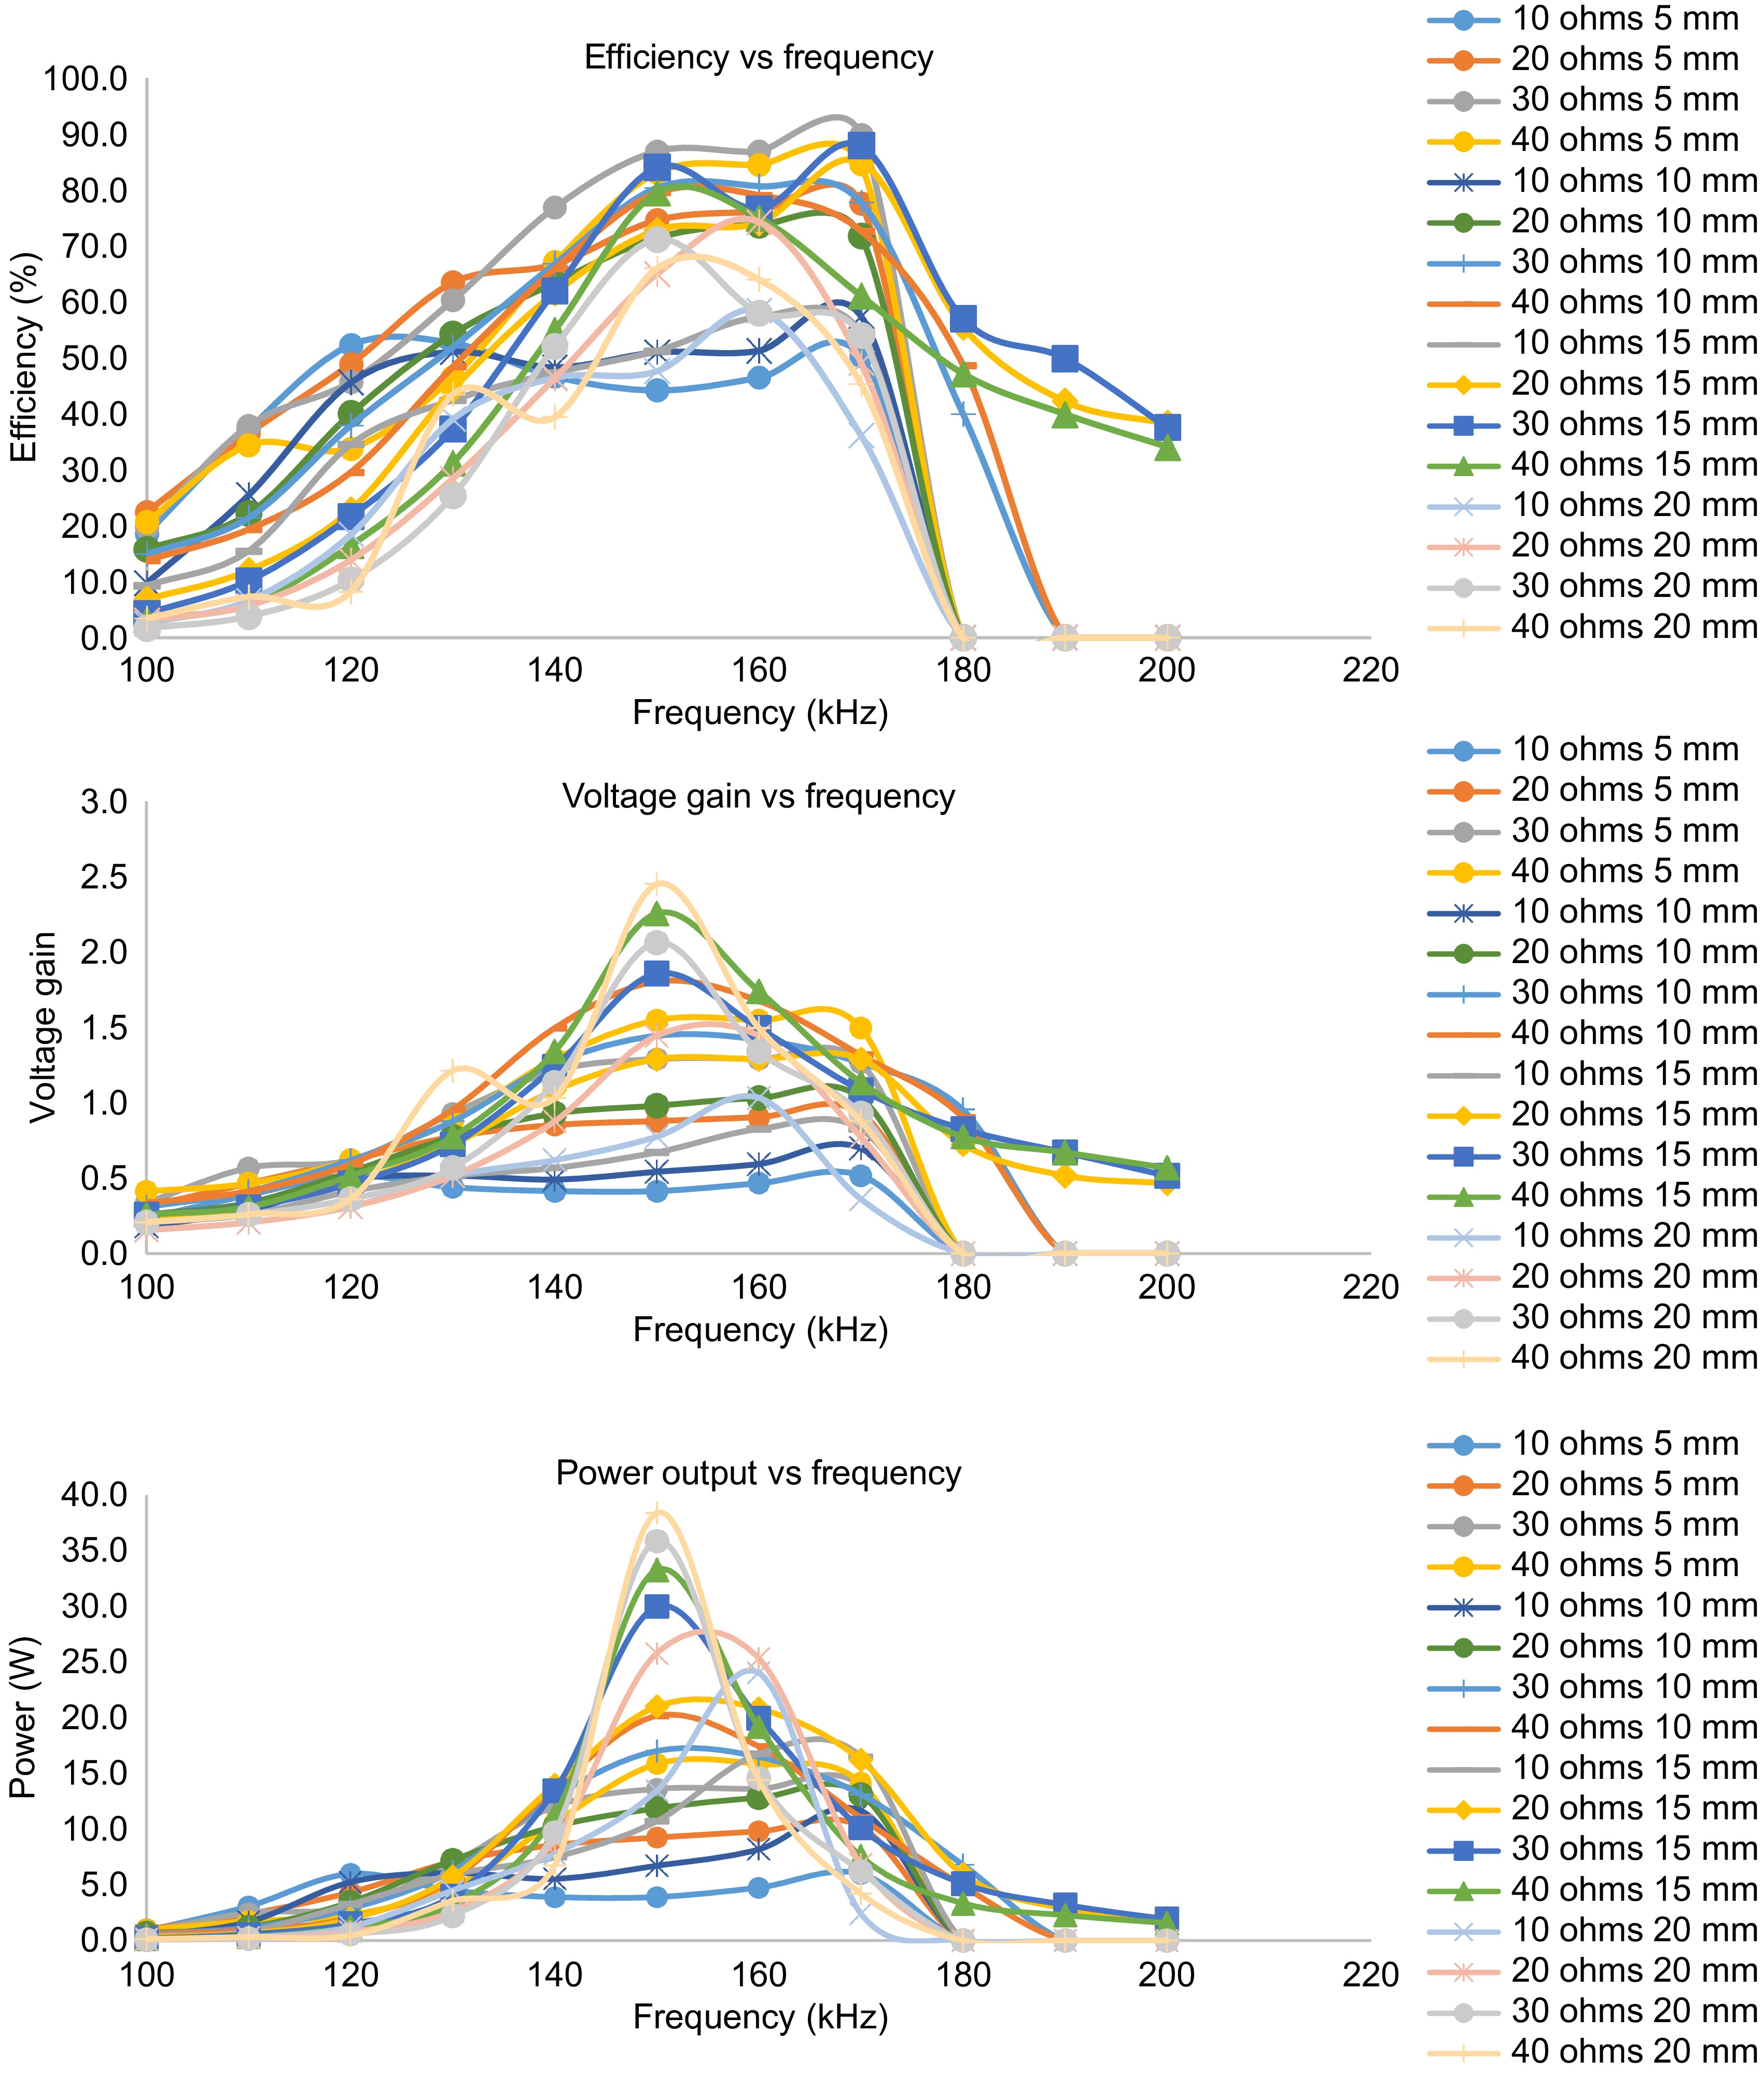
Figure 5.
Frequency response of TETS for axial gap variations and load variations.
-
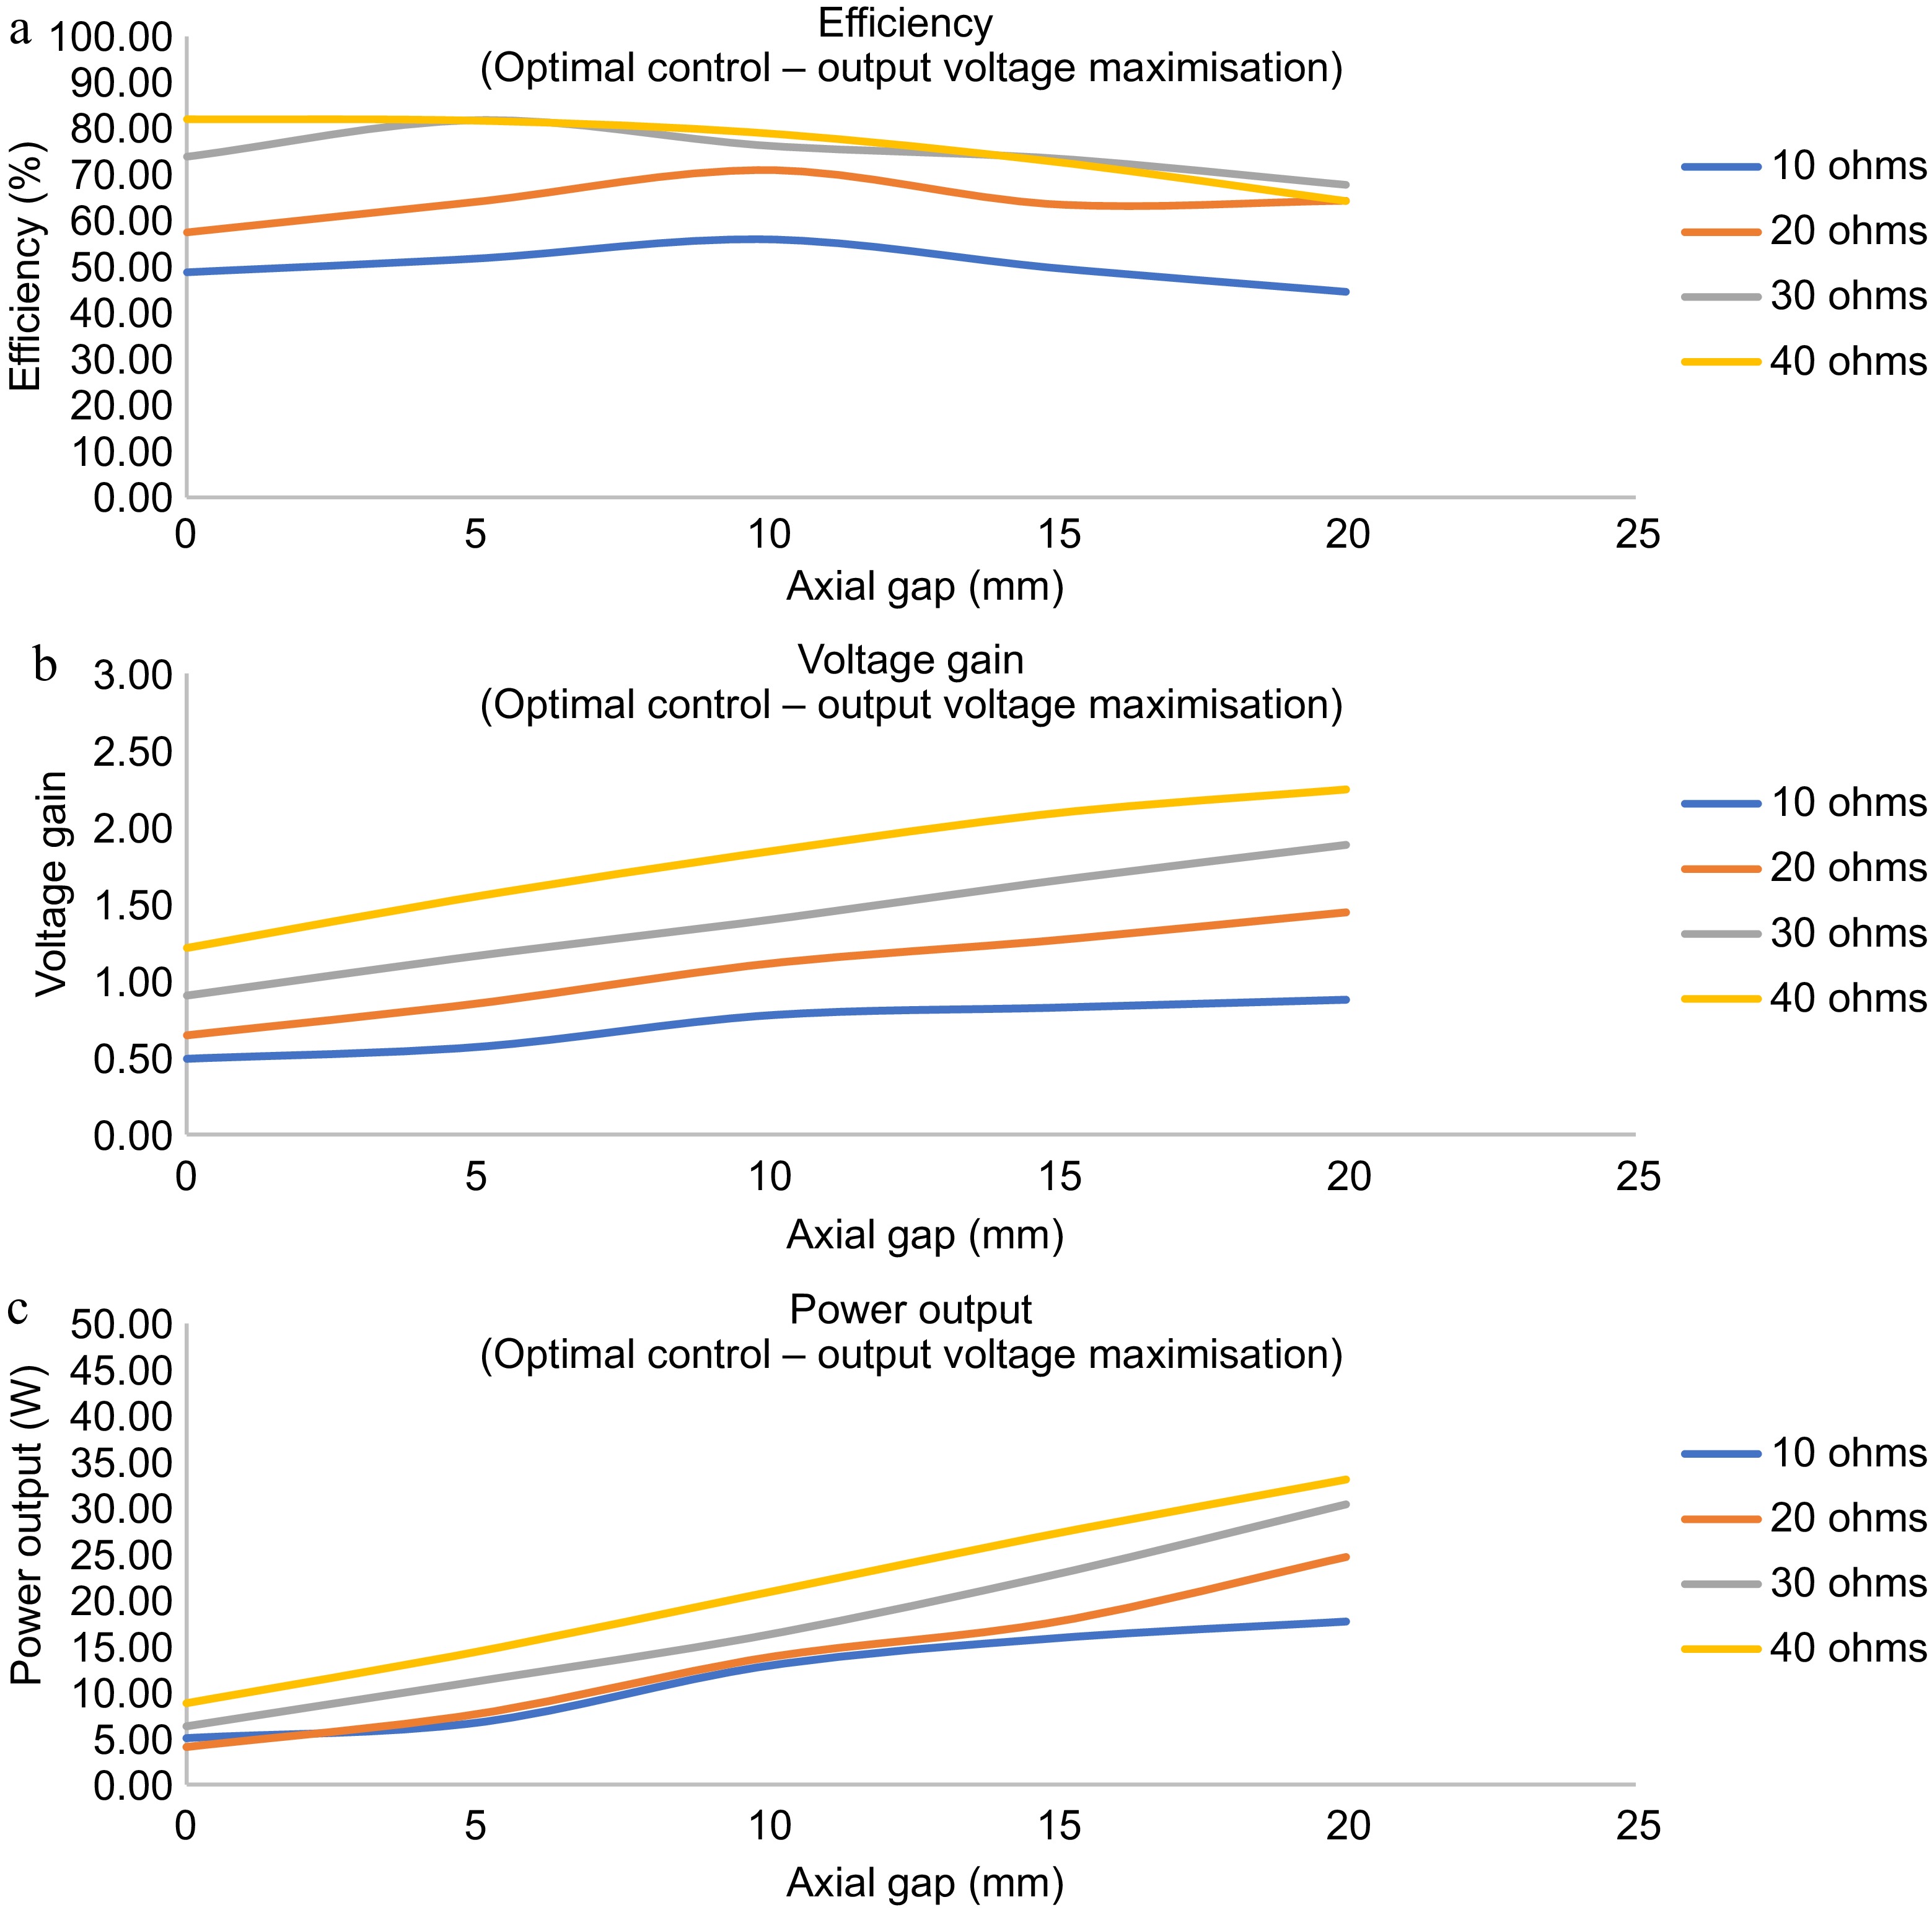
Figure 6.
Dynamic response of the TETS with for maximum power transfer with output voltage maximization. (a) Efficiency vs axial gap for zero lateral shift. (b) Voltage gain vs axial gap for zero lateral shift. (c) Output power vs axial gap for zero lateral shift.
-
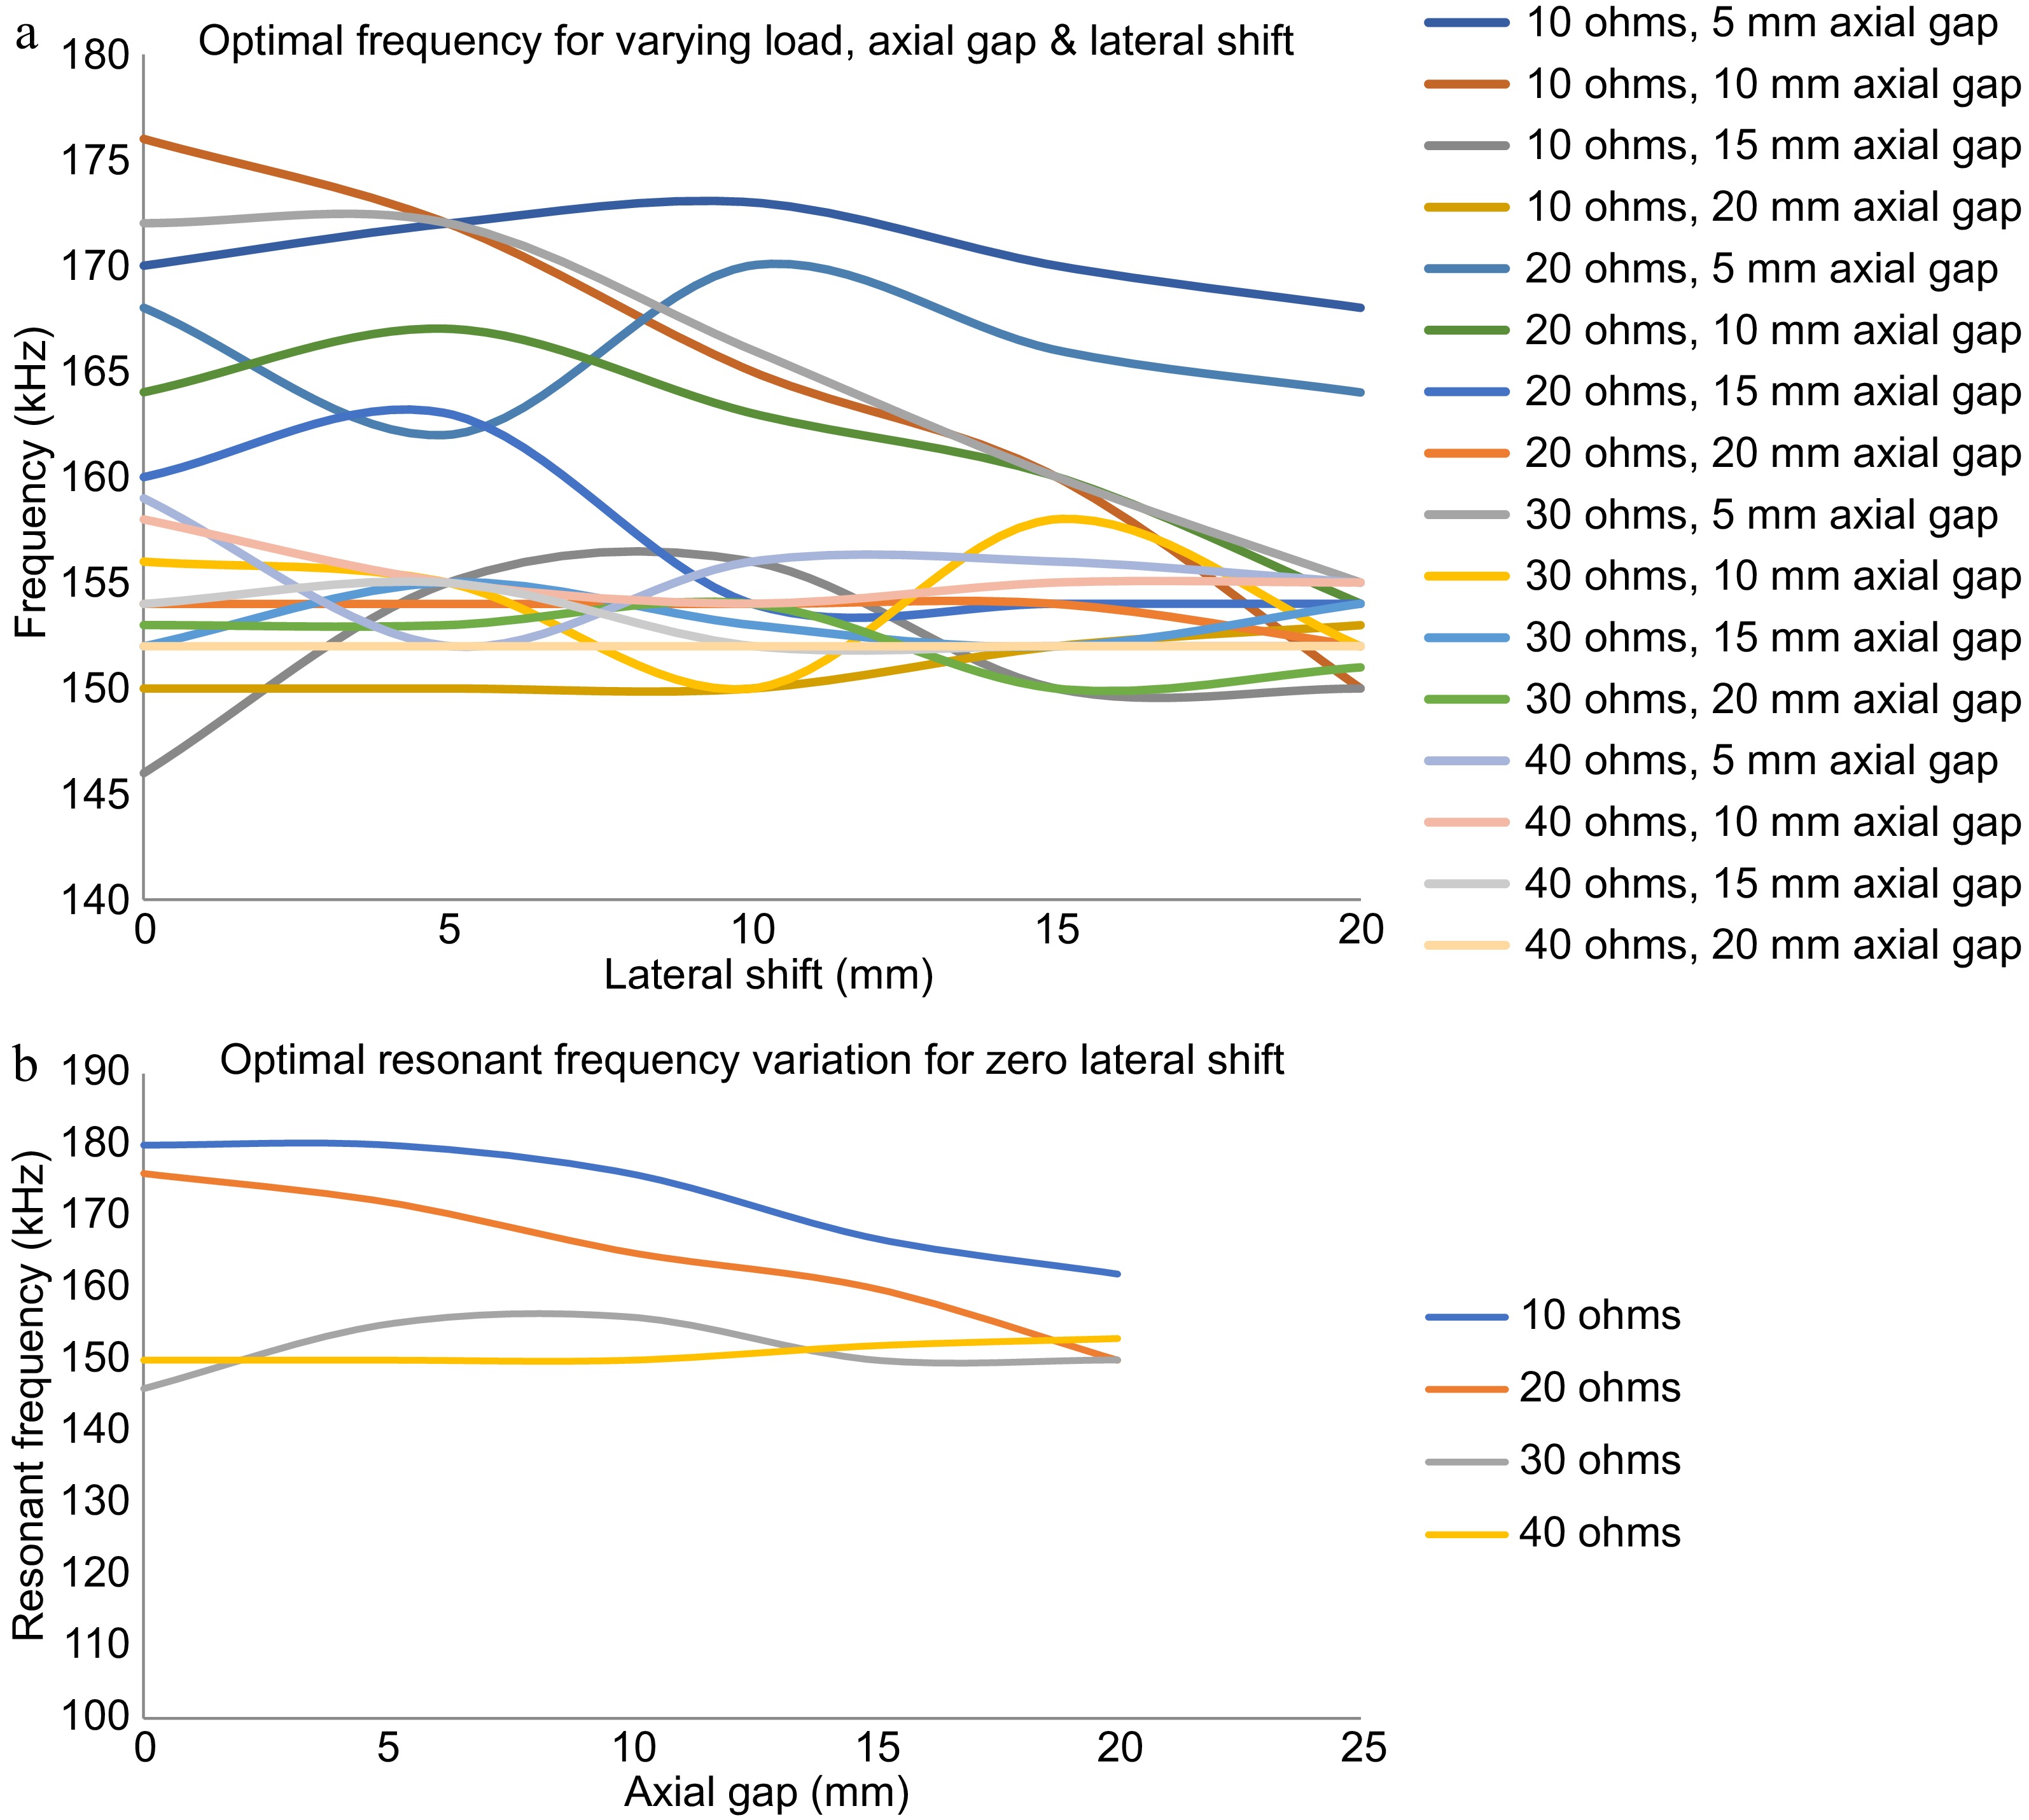
Figure 7.
Optimum frequency for the operation of the TETS at its maximum power transfer condition. (a) Optimum frequency for varying load, axial gap, and lateral shift. (b) Optimum frequency for varying load, axial gap with zero lateral shift.
-
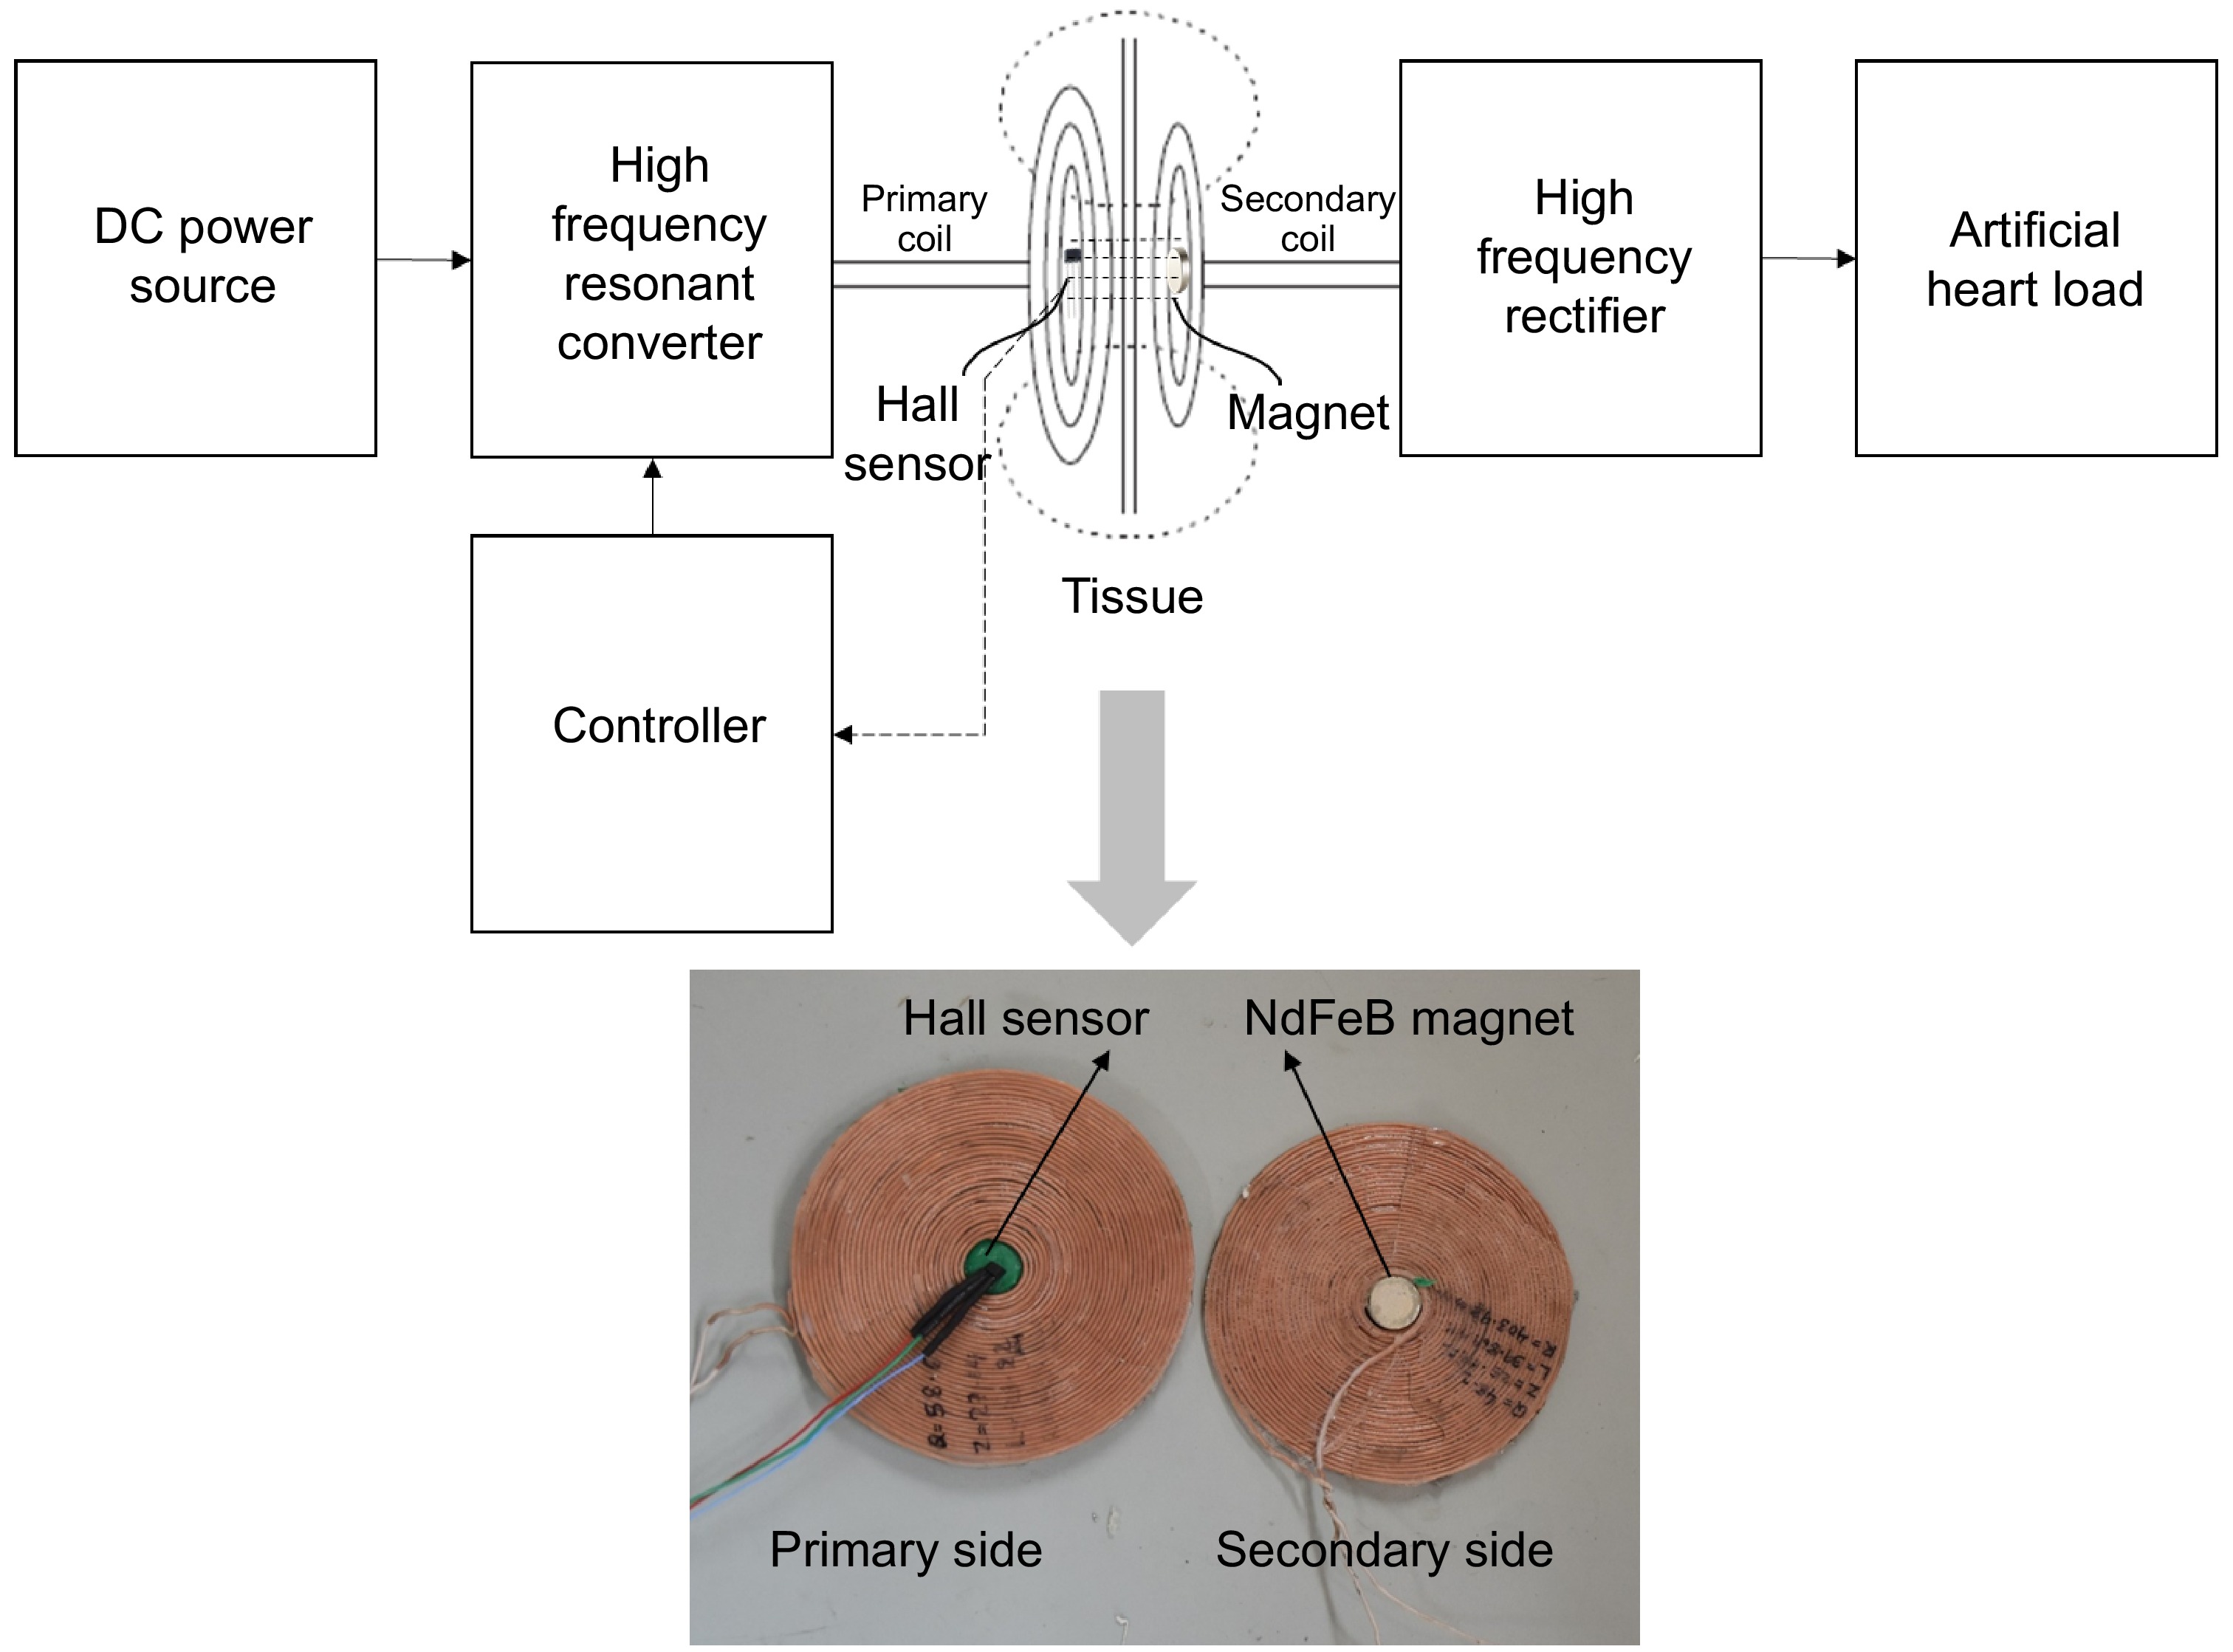
Figure 8.
Magnetic position feedback scheme.
-
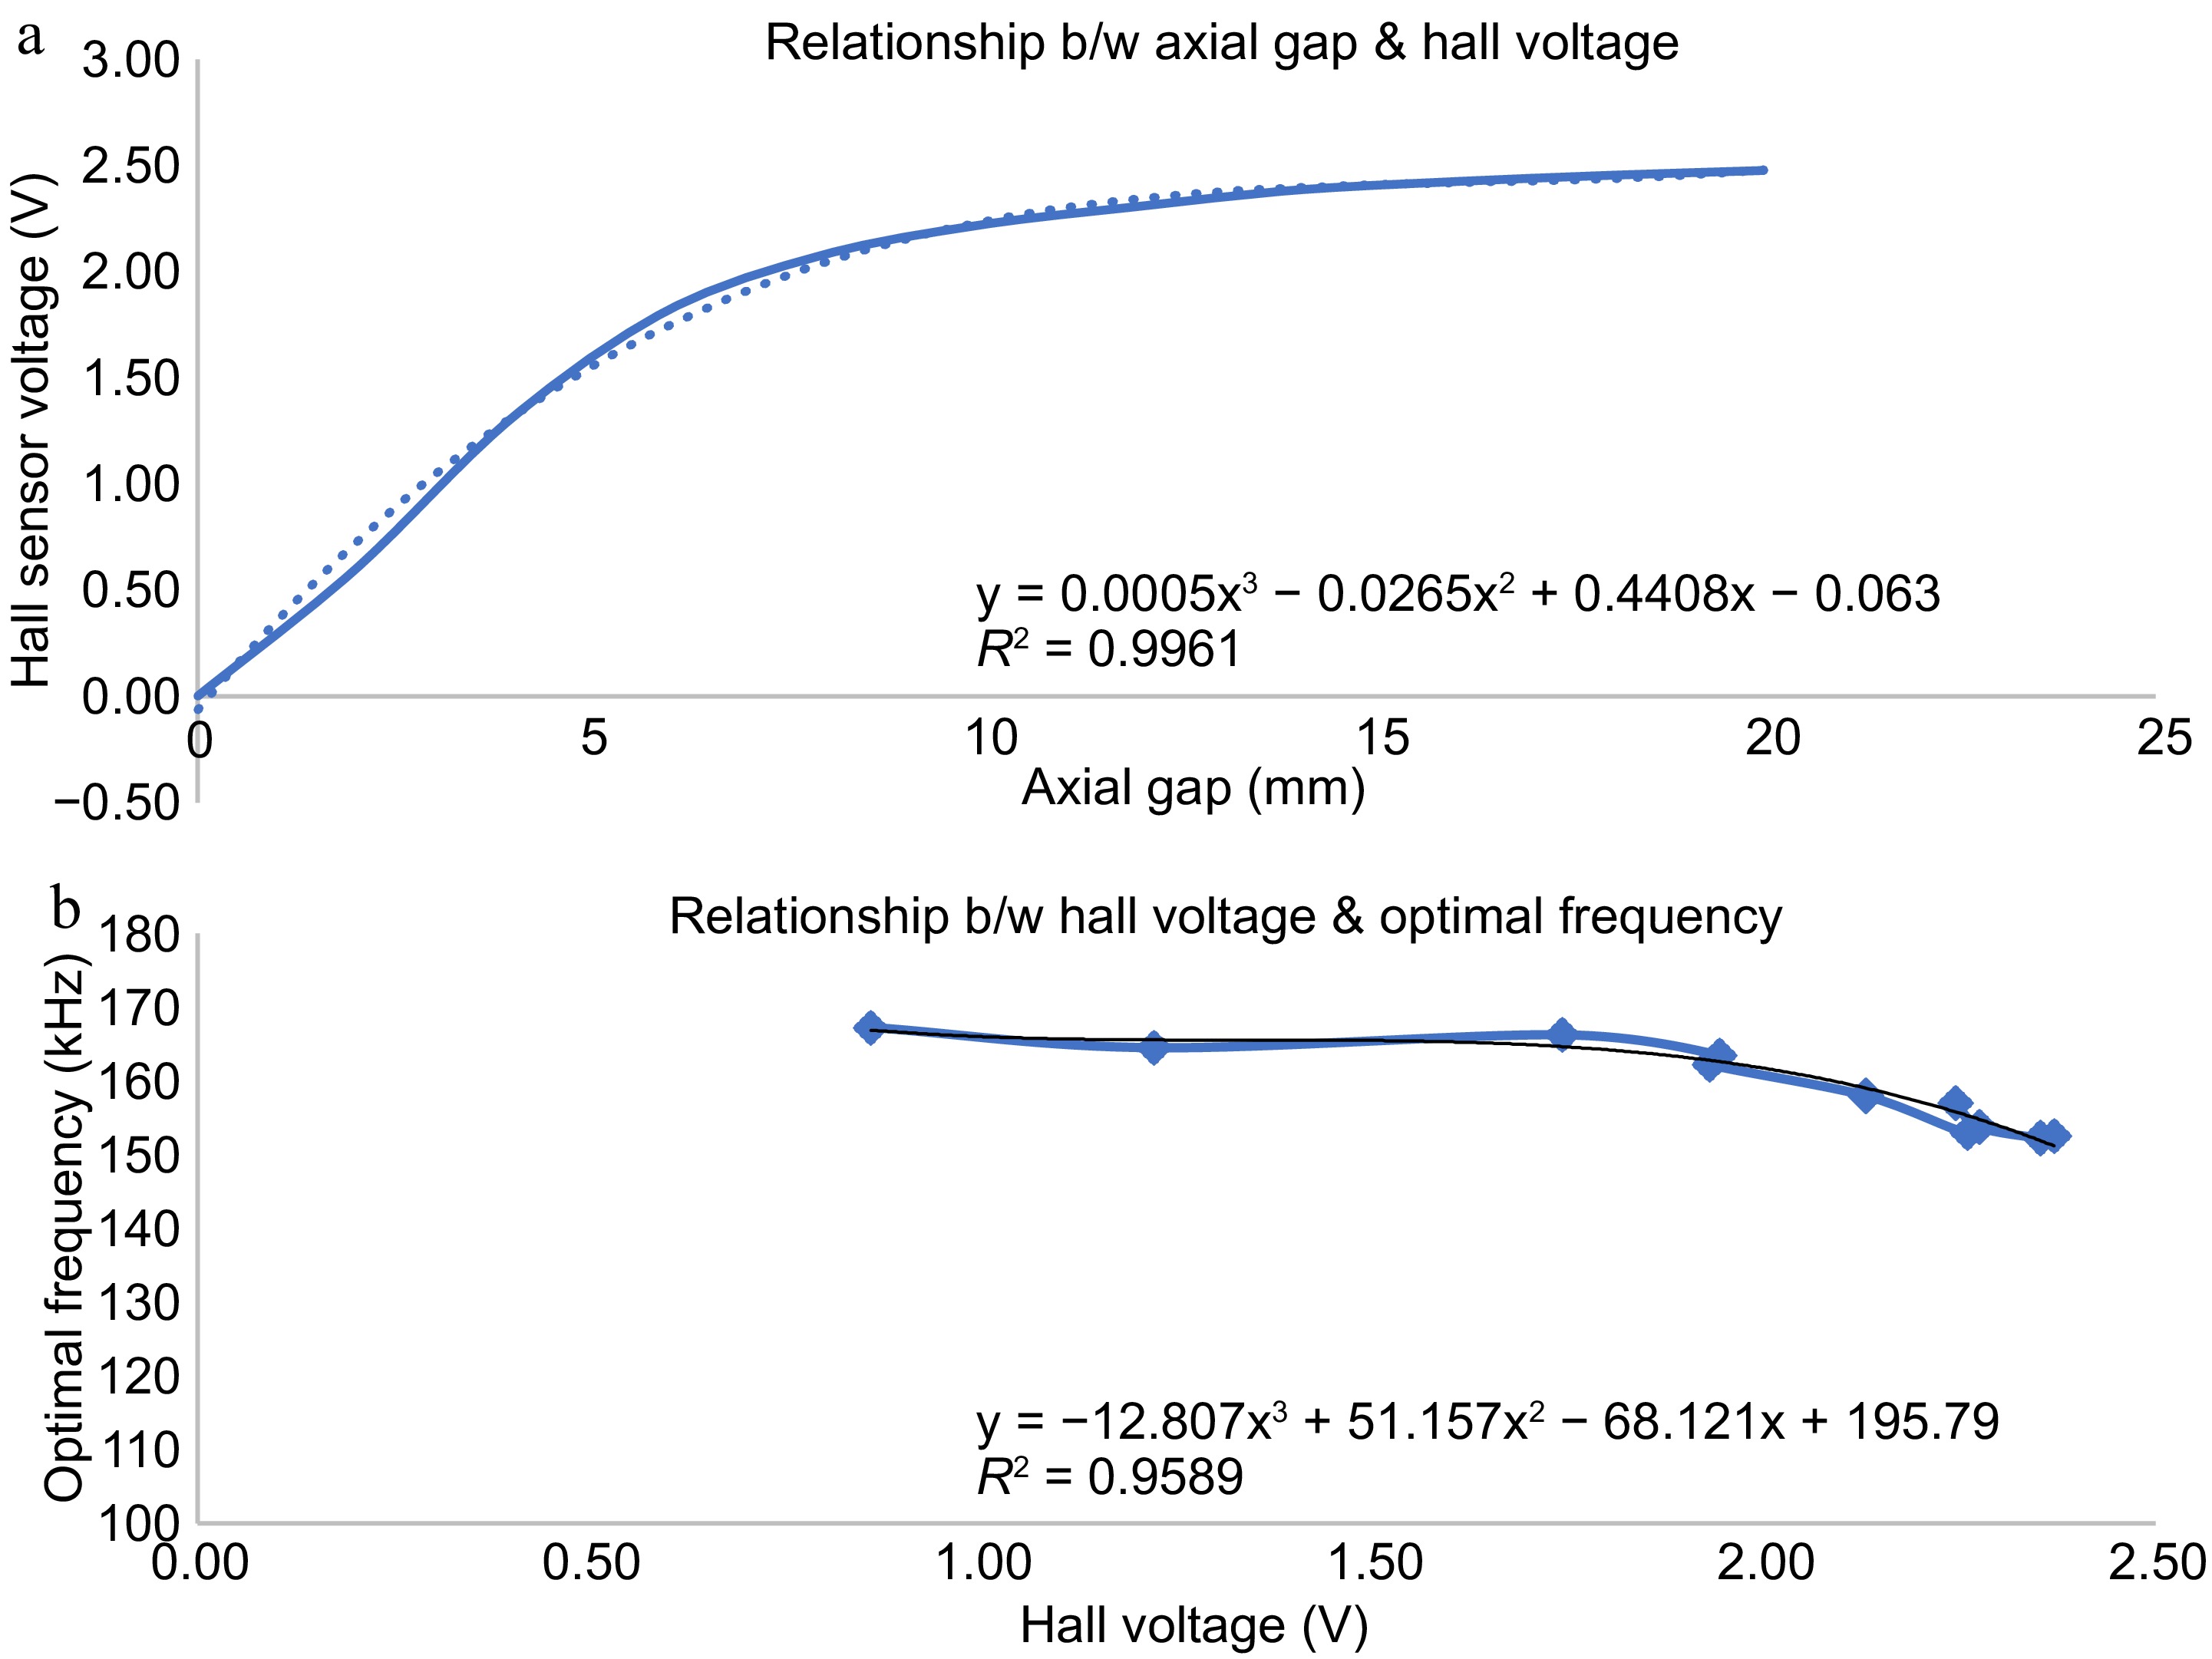
Figure 9.
Variation of hall sensor voltage with distance from implanted coil. (a) Hall sensor output vs axial gap. (b) Optimal frequency vs hall sensor voltage.
-
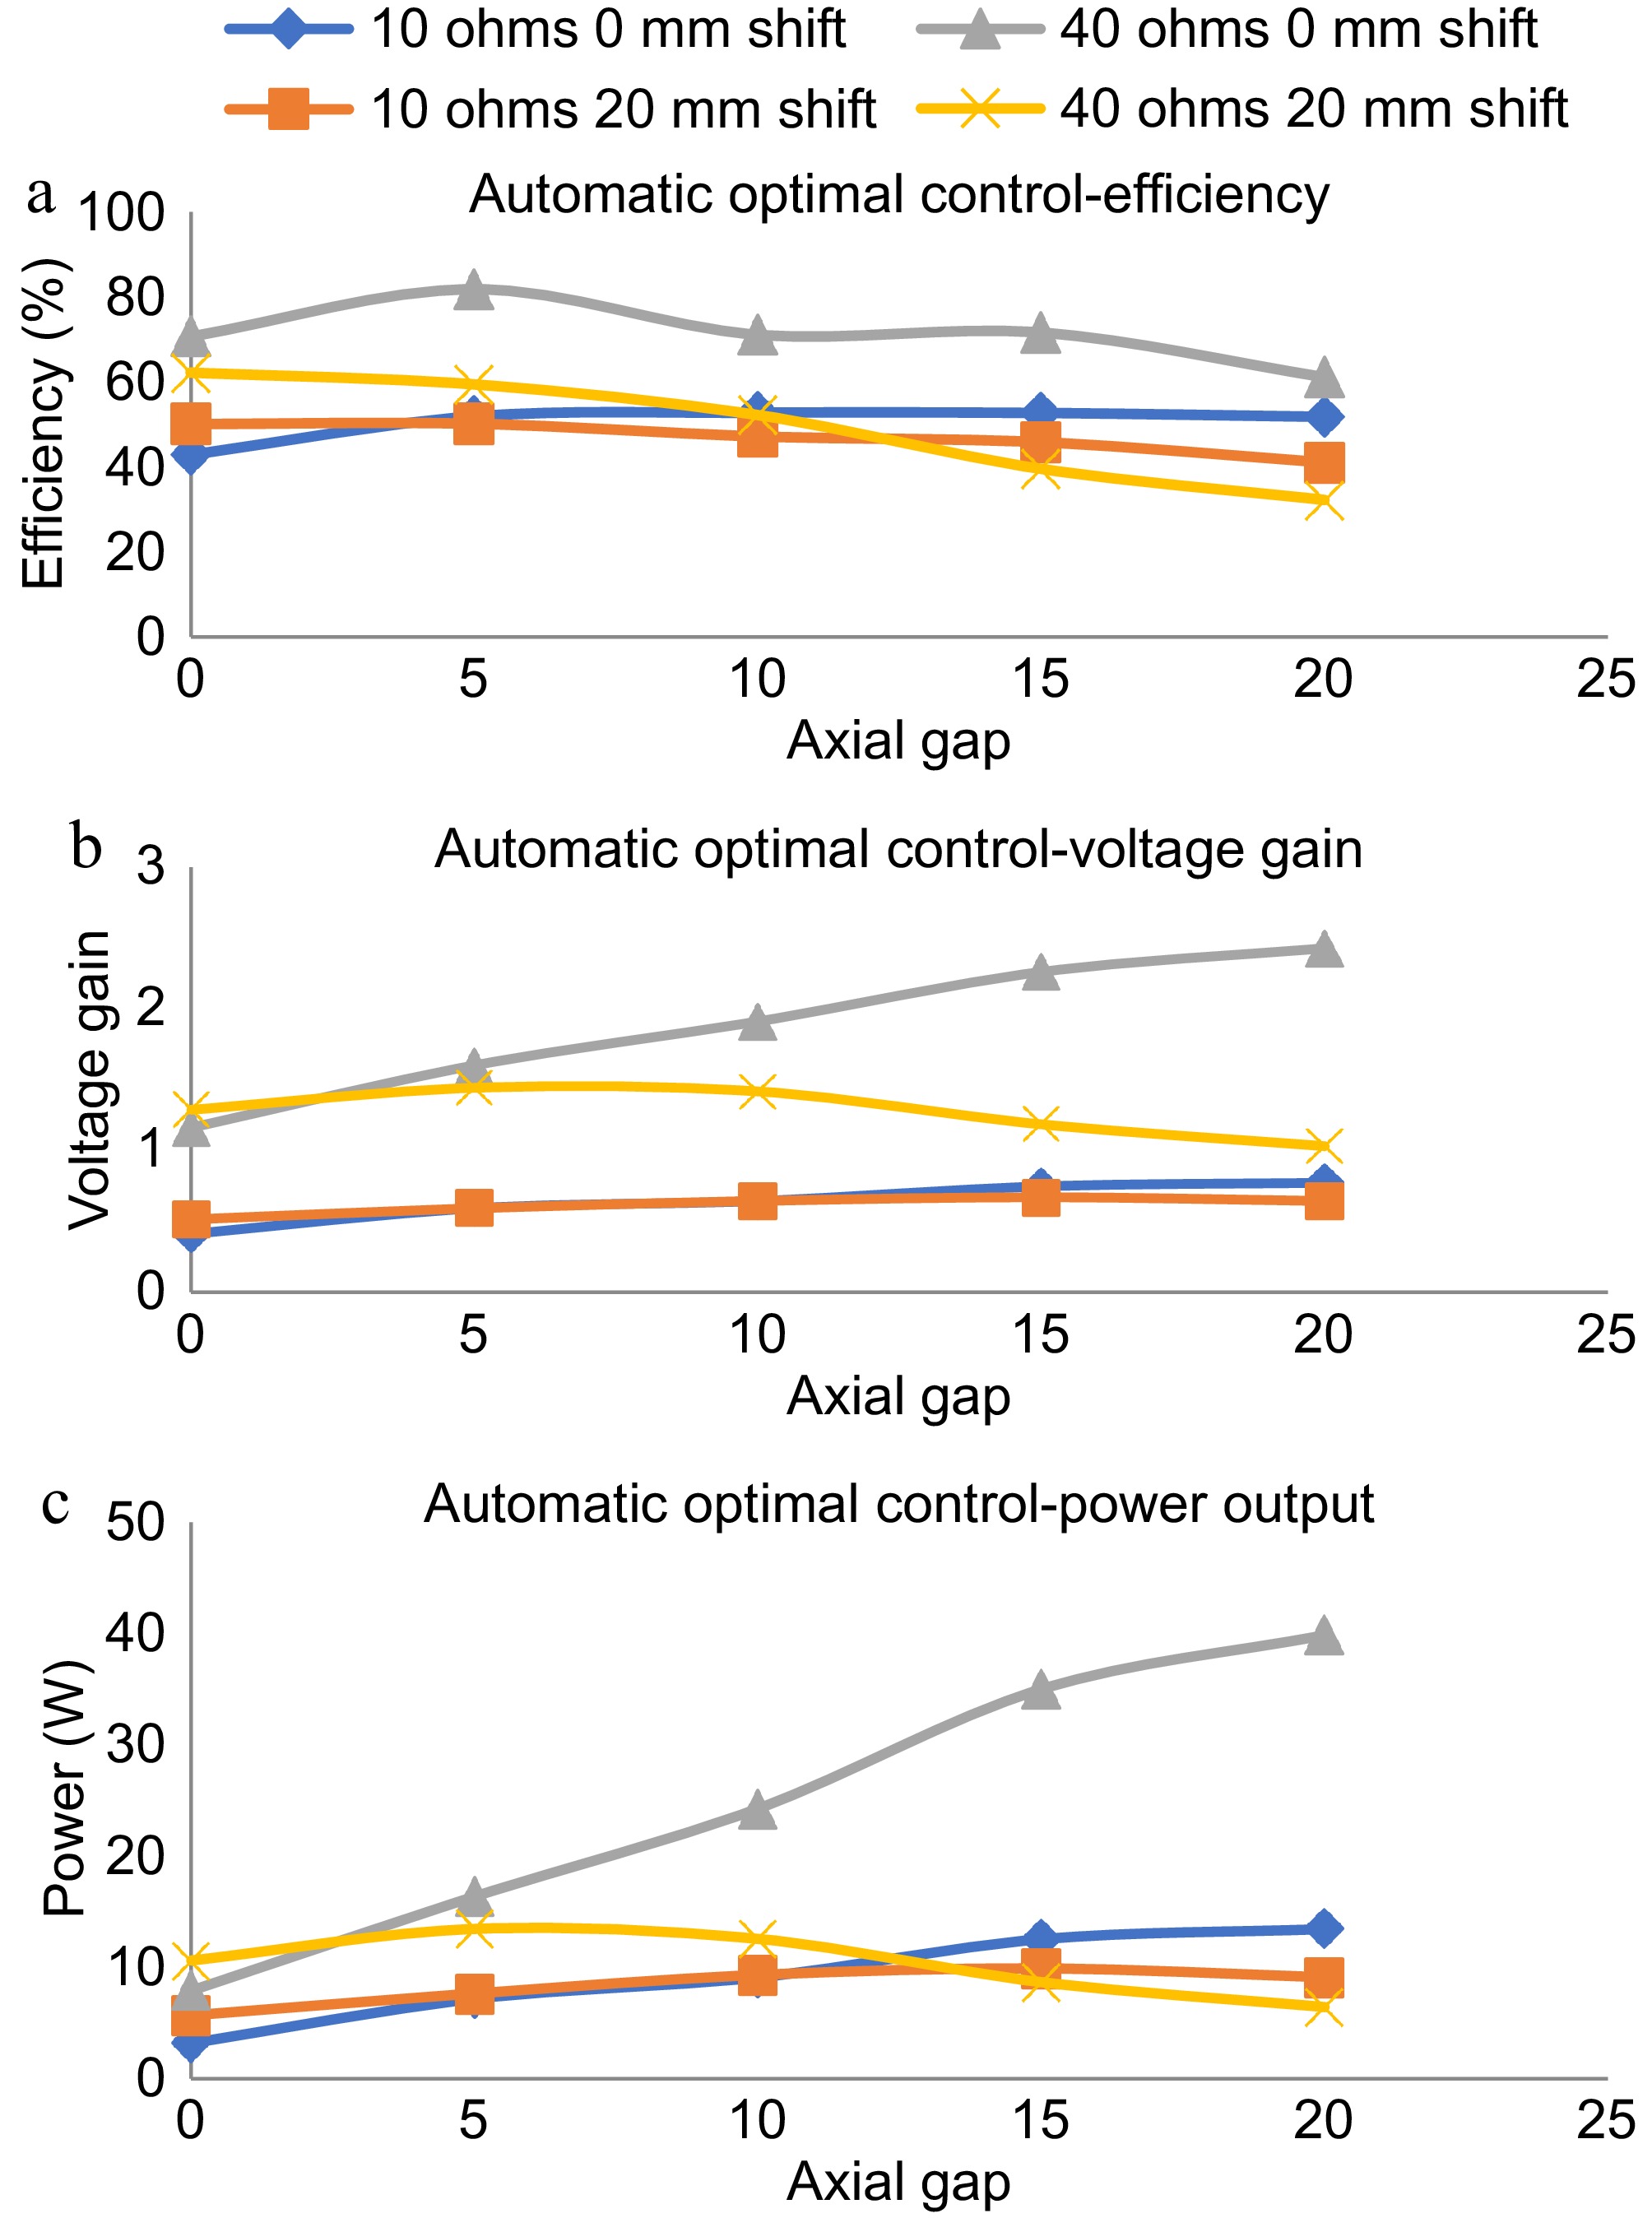
Figure 10.
Dynamic response with magnetic position feedback based automatic optimal control. (a) Efficiency plot in automatic optimal control. (b) Voltage gain plot in automatic optimal control, power output plot in automatic optimal control.
-
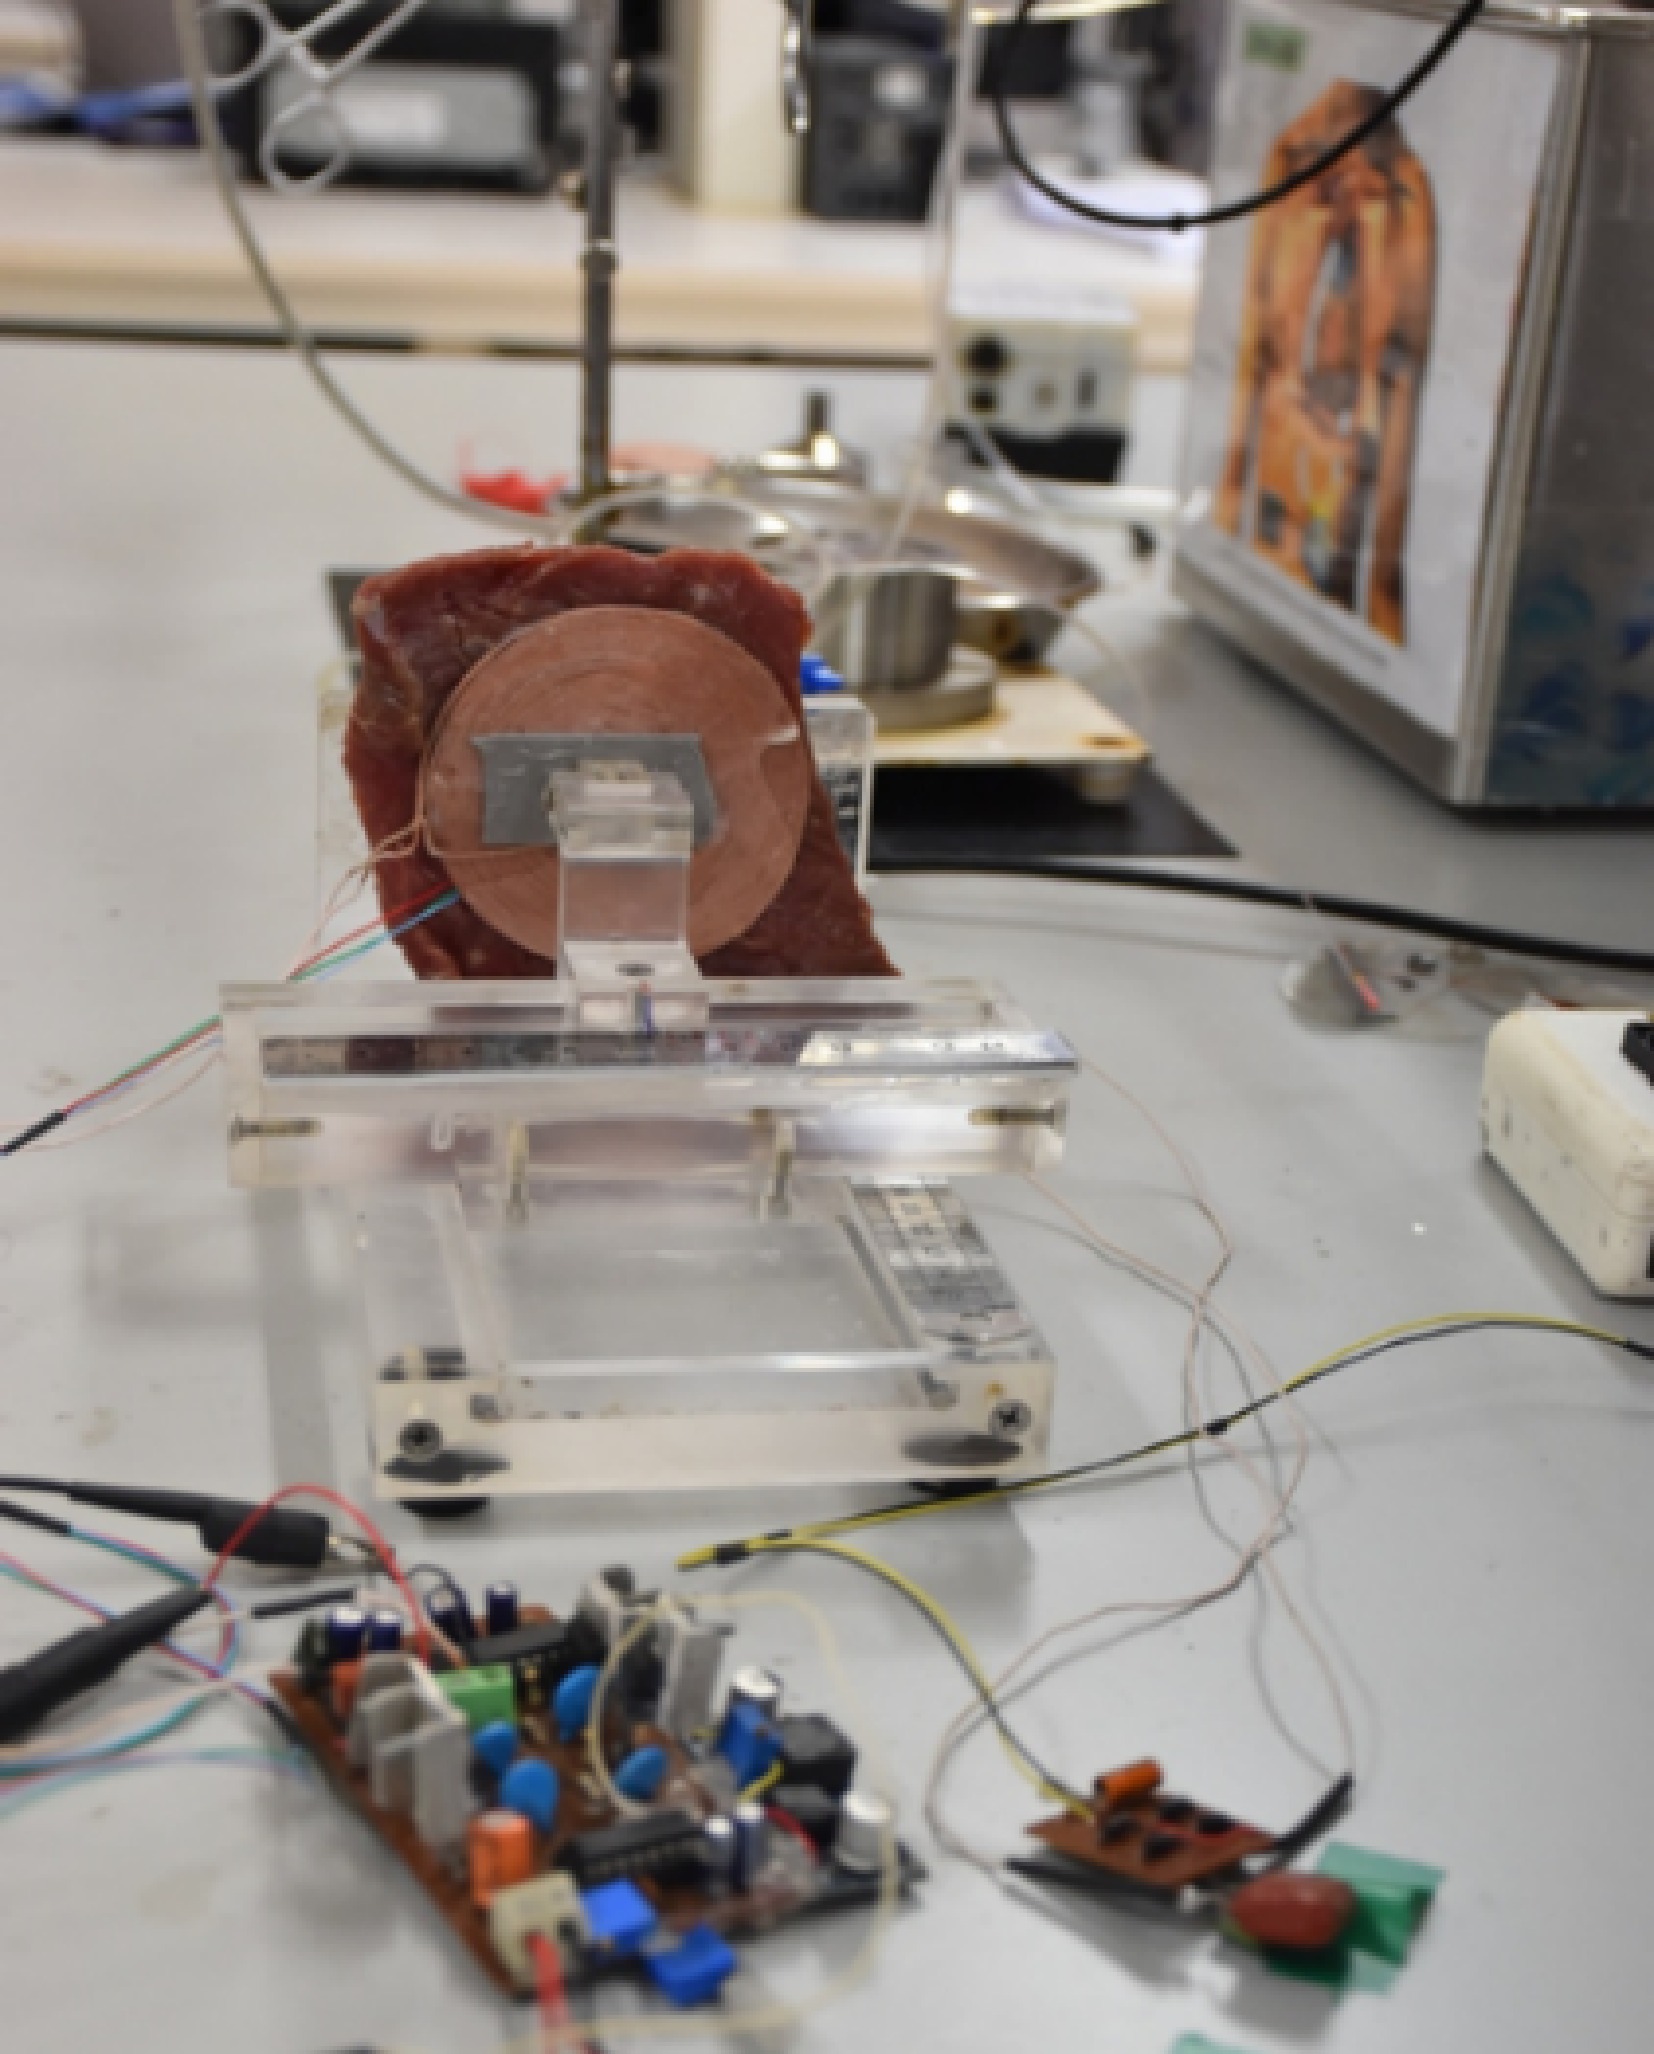
Figure 11.
In Vitro tests with animal tissue.
-
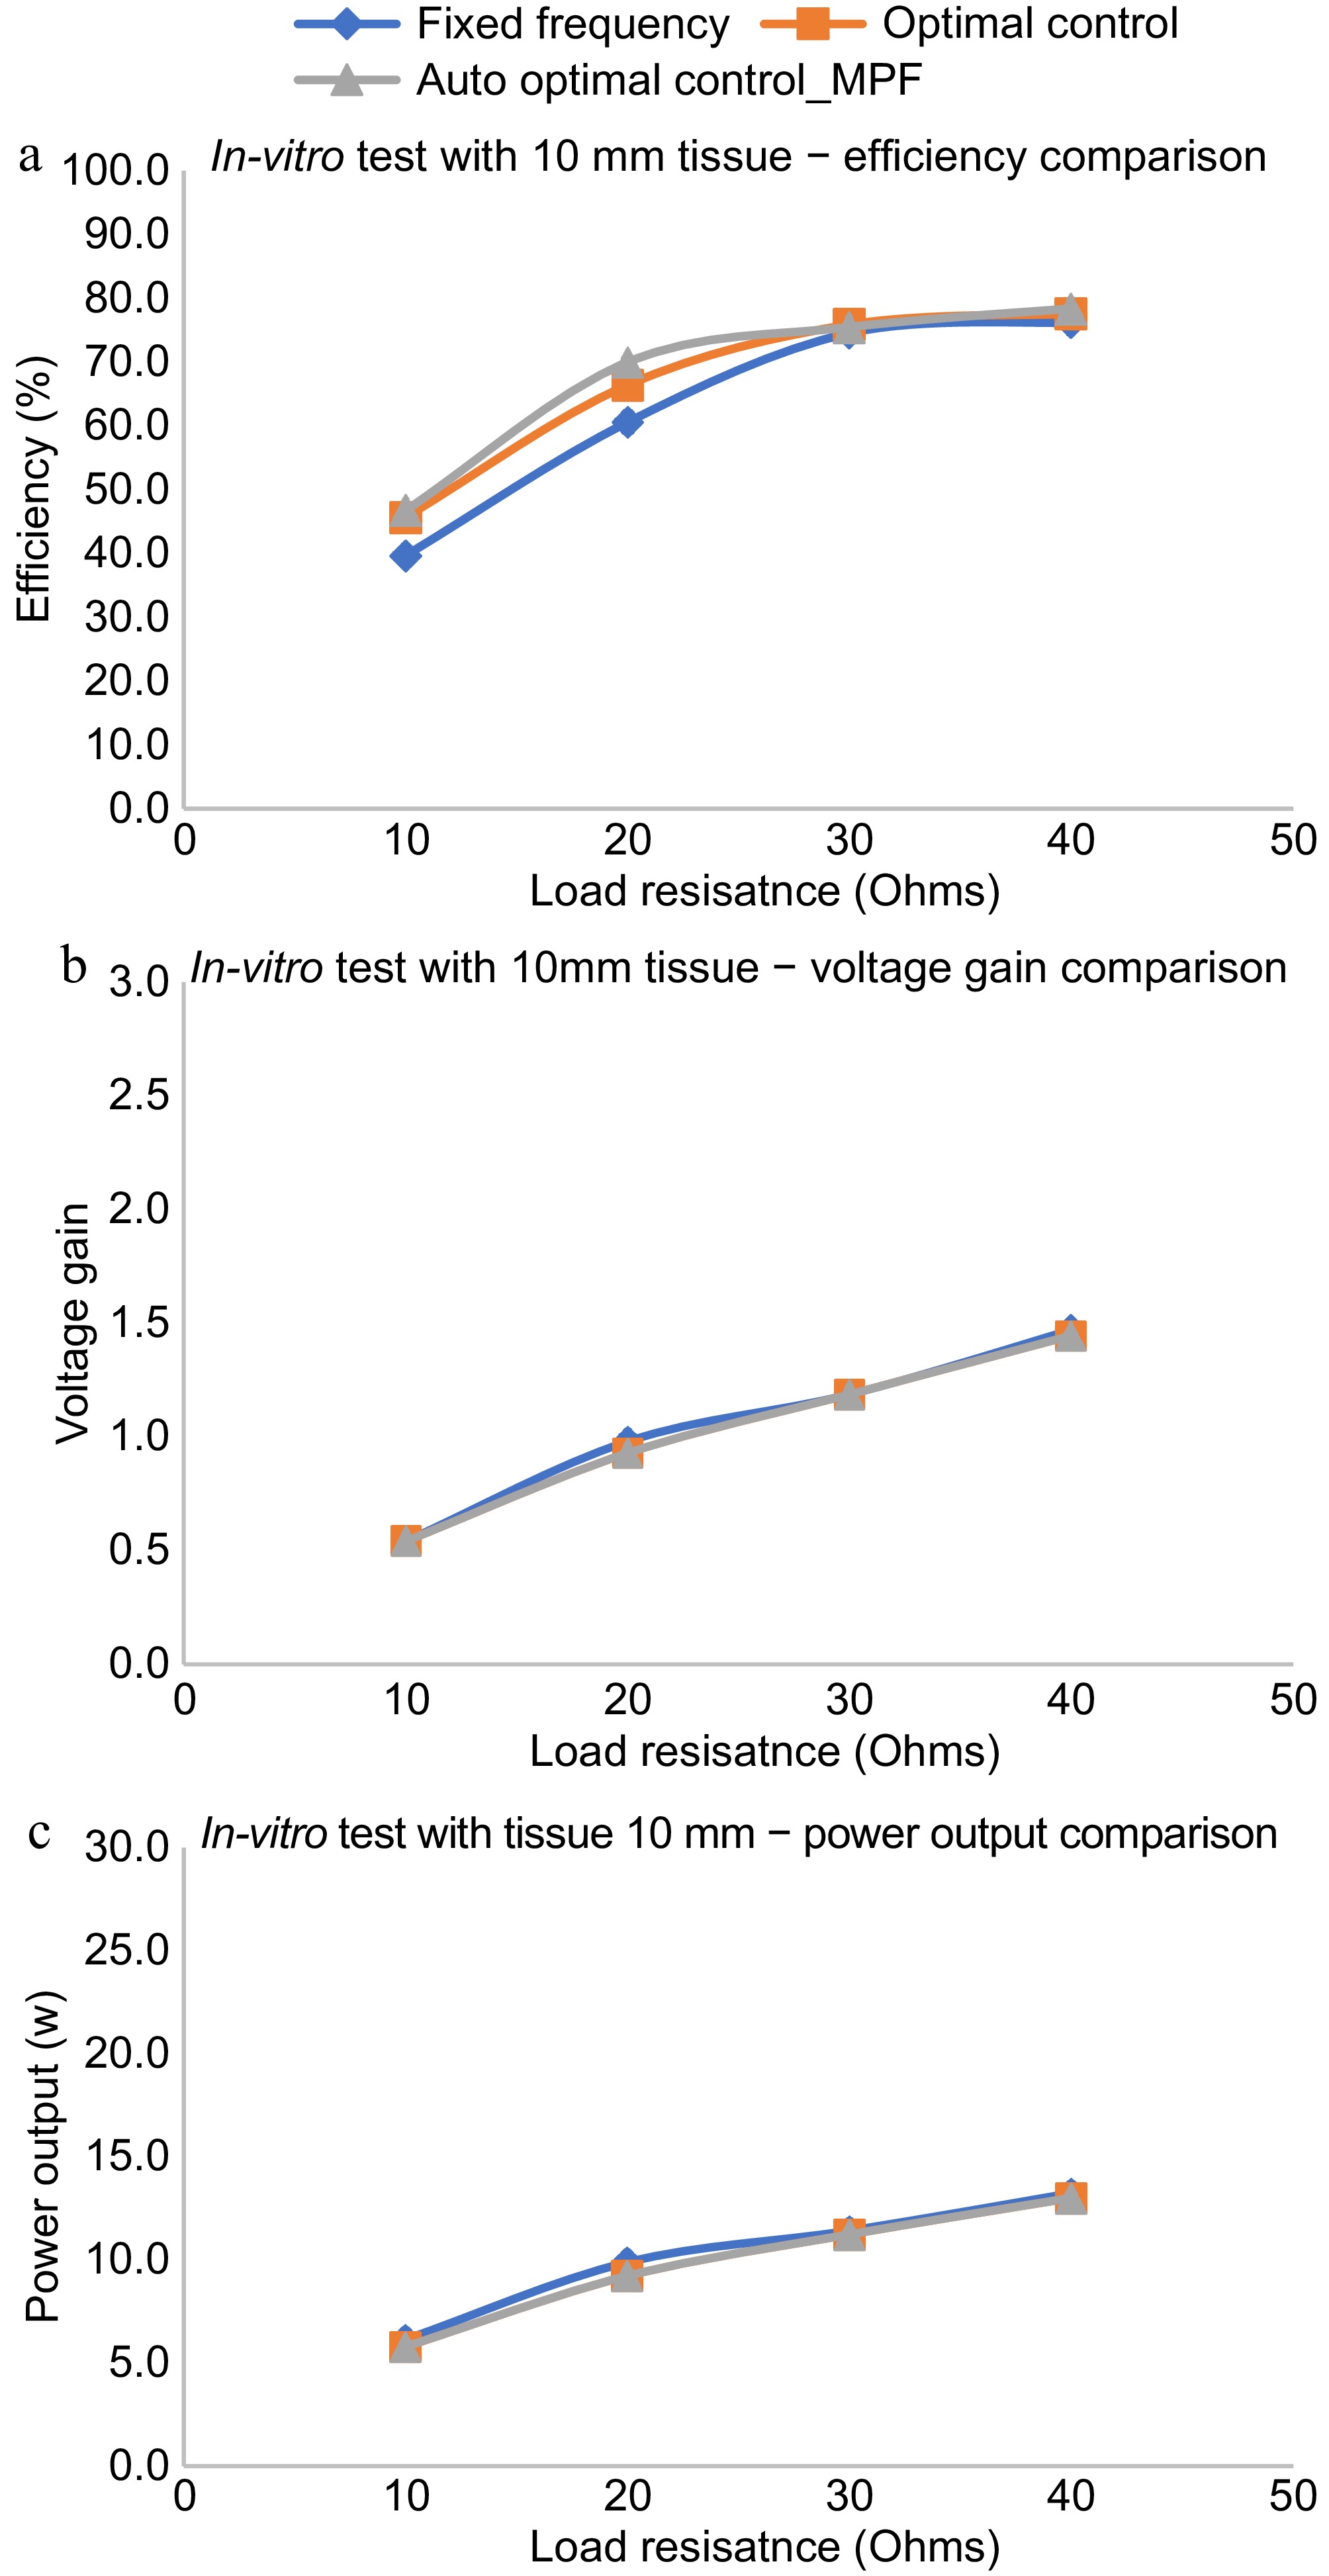
Figure 12.
In Vitro performance evaluation with animal tissue. (a) Efficiency comparison with various control schemes. (b) Voltage gain comparison with various control schemes. (c) Power output comparison with various control schemes.
-
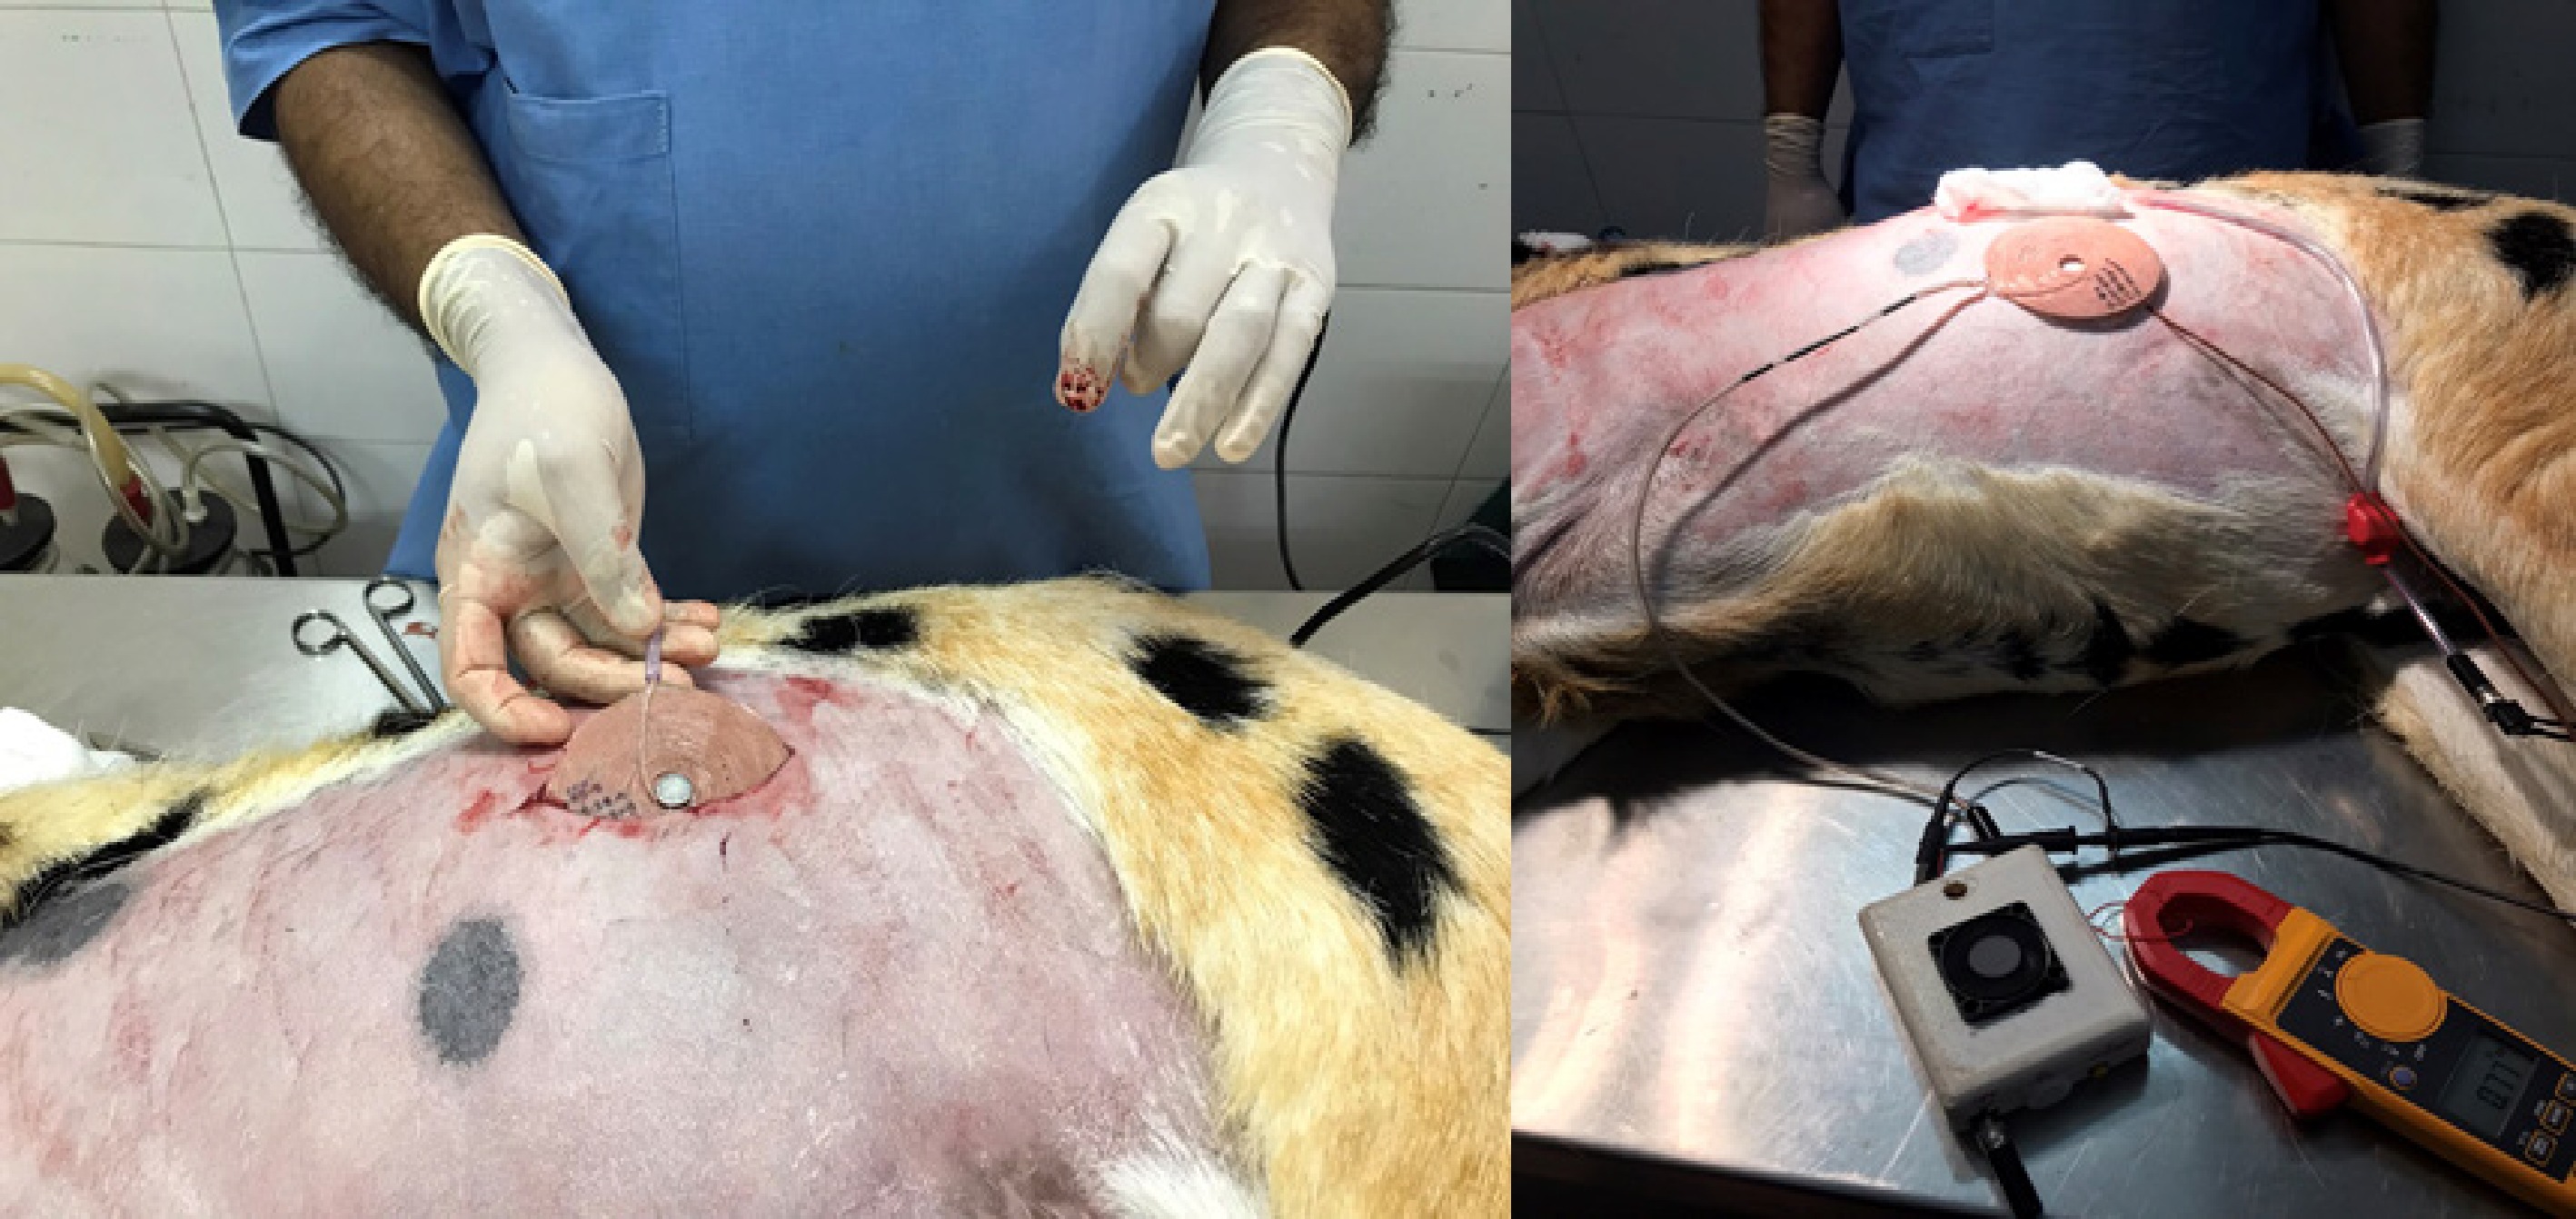
Figure 13.
TETS implantation study.
-
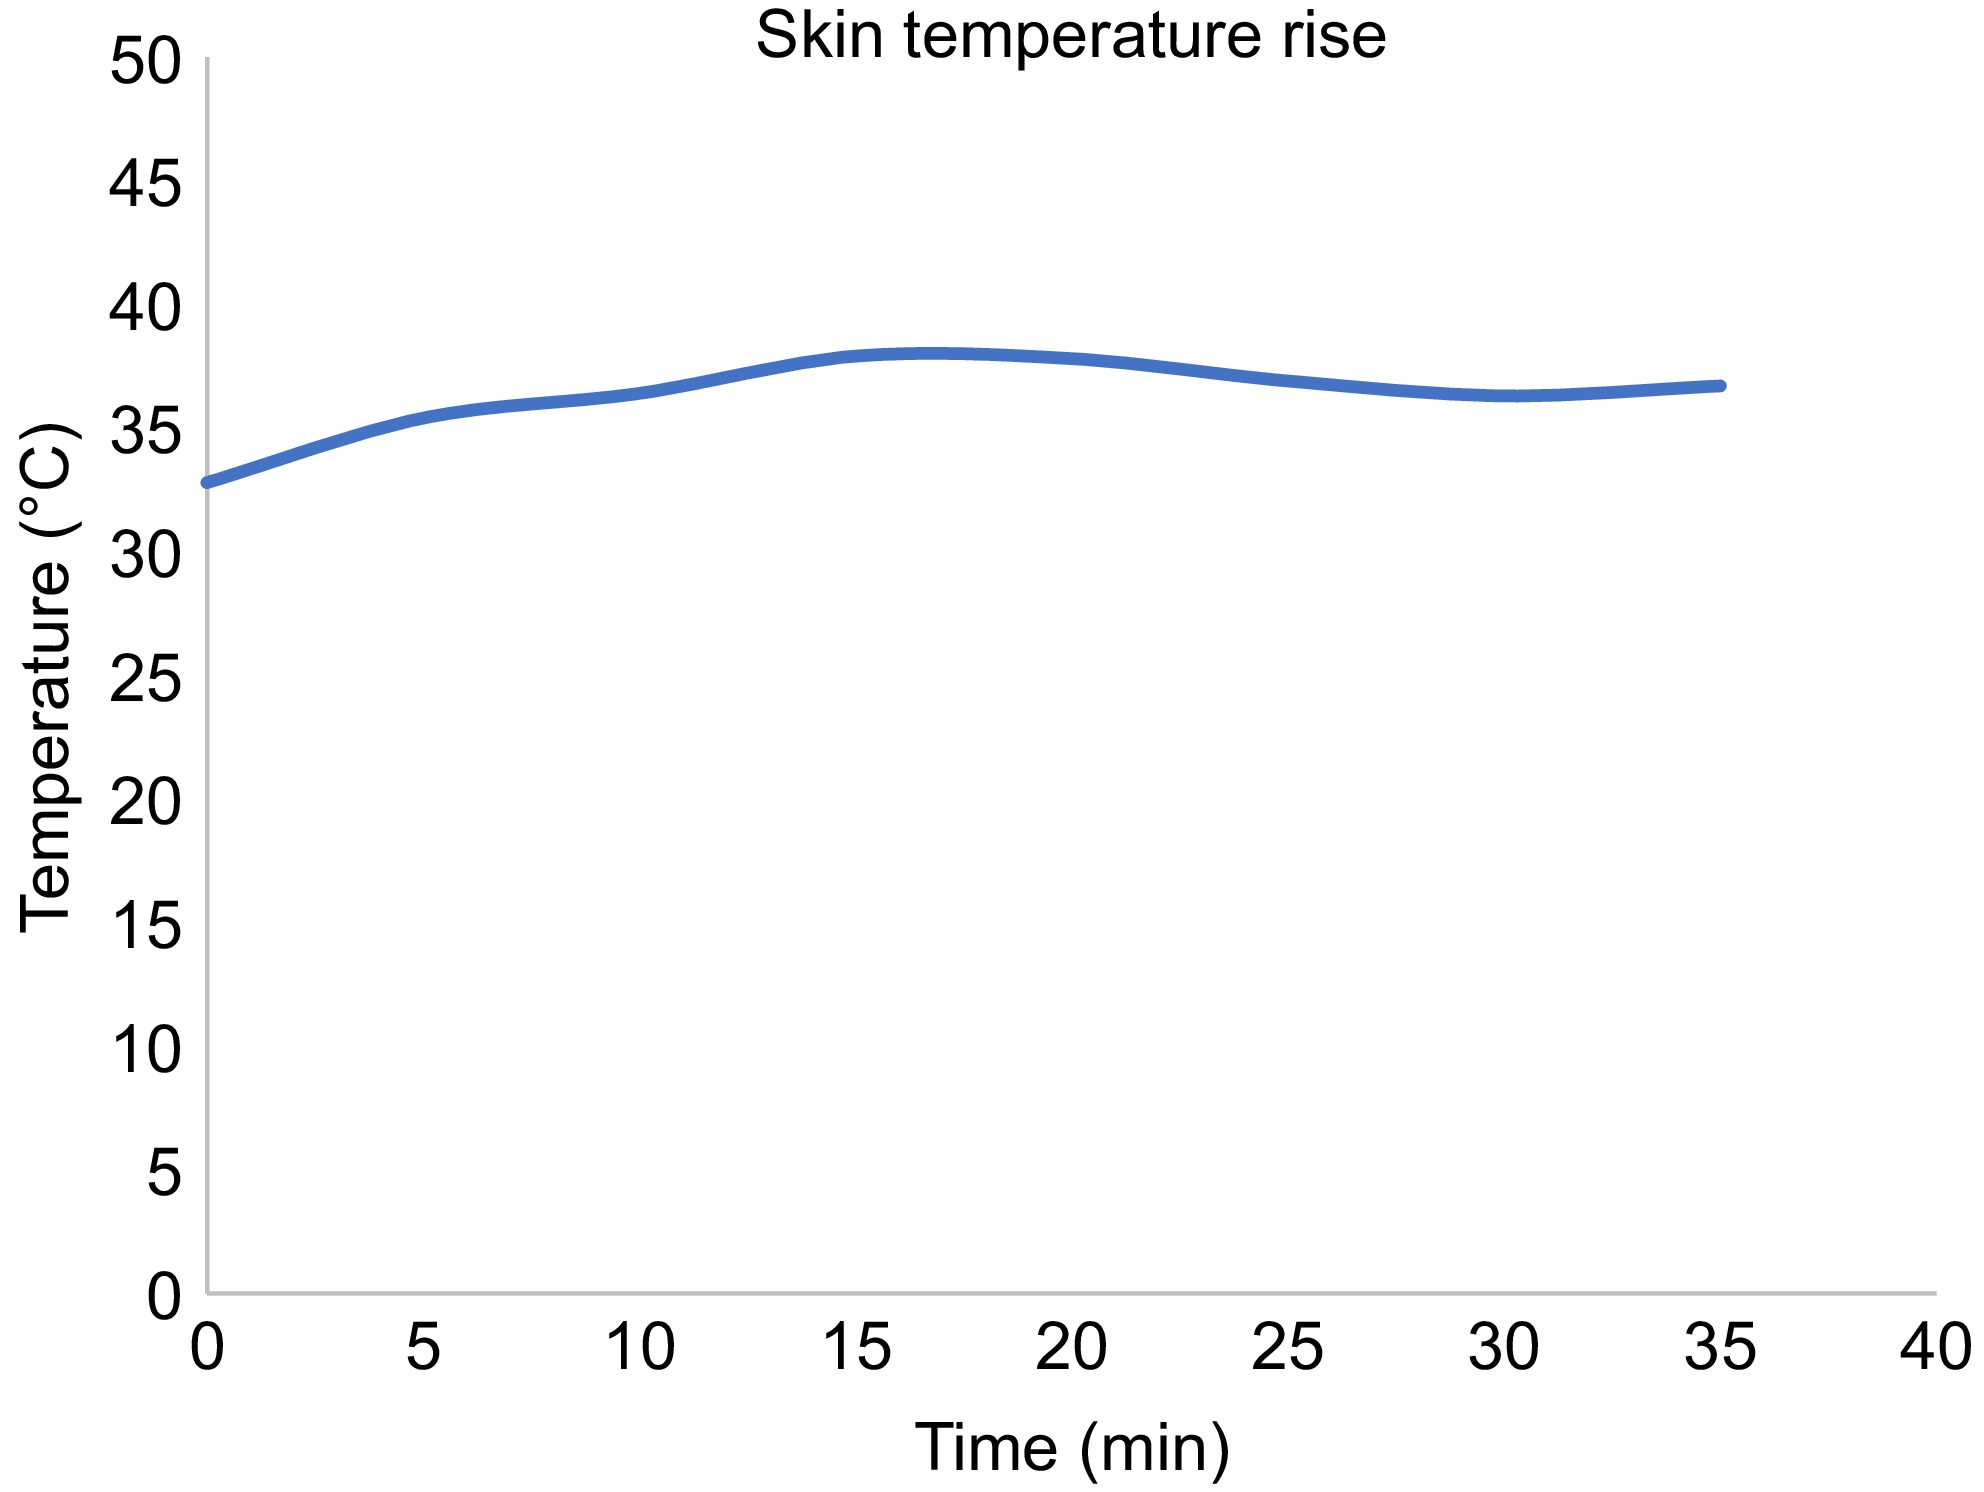
Figure 14.
Thermal rise at the implanted site.
Figures
(14)
Tables
(0)