-
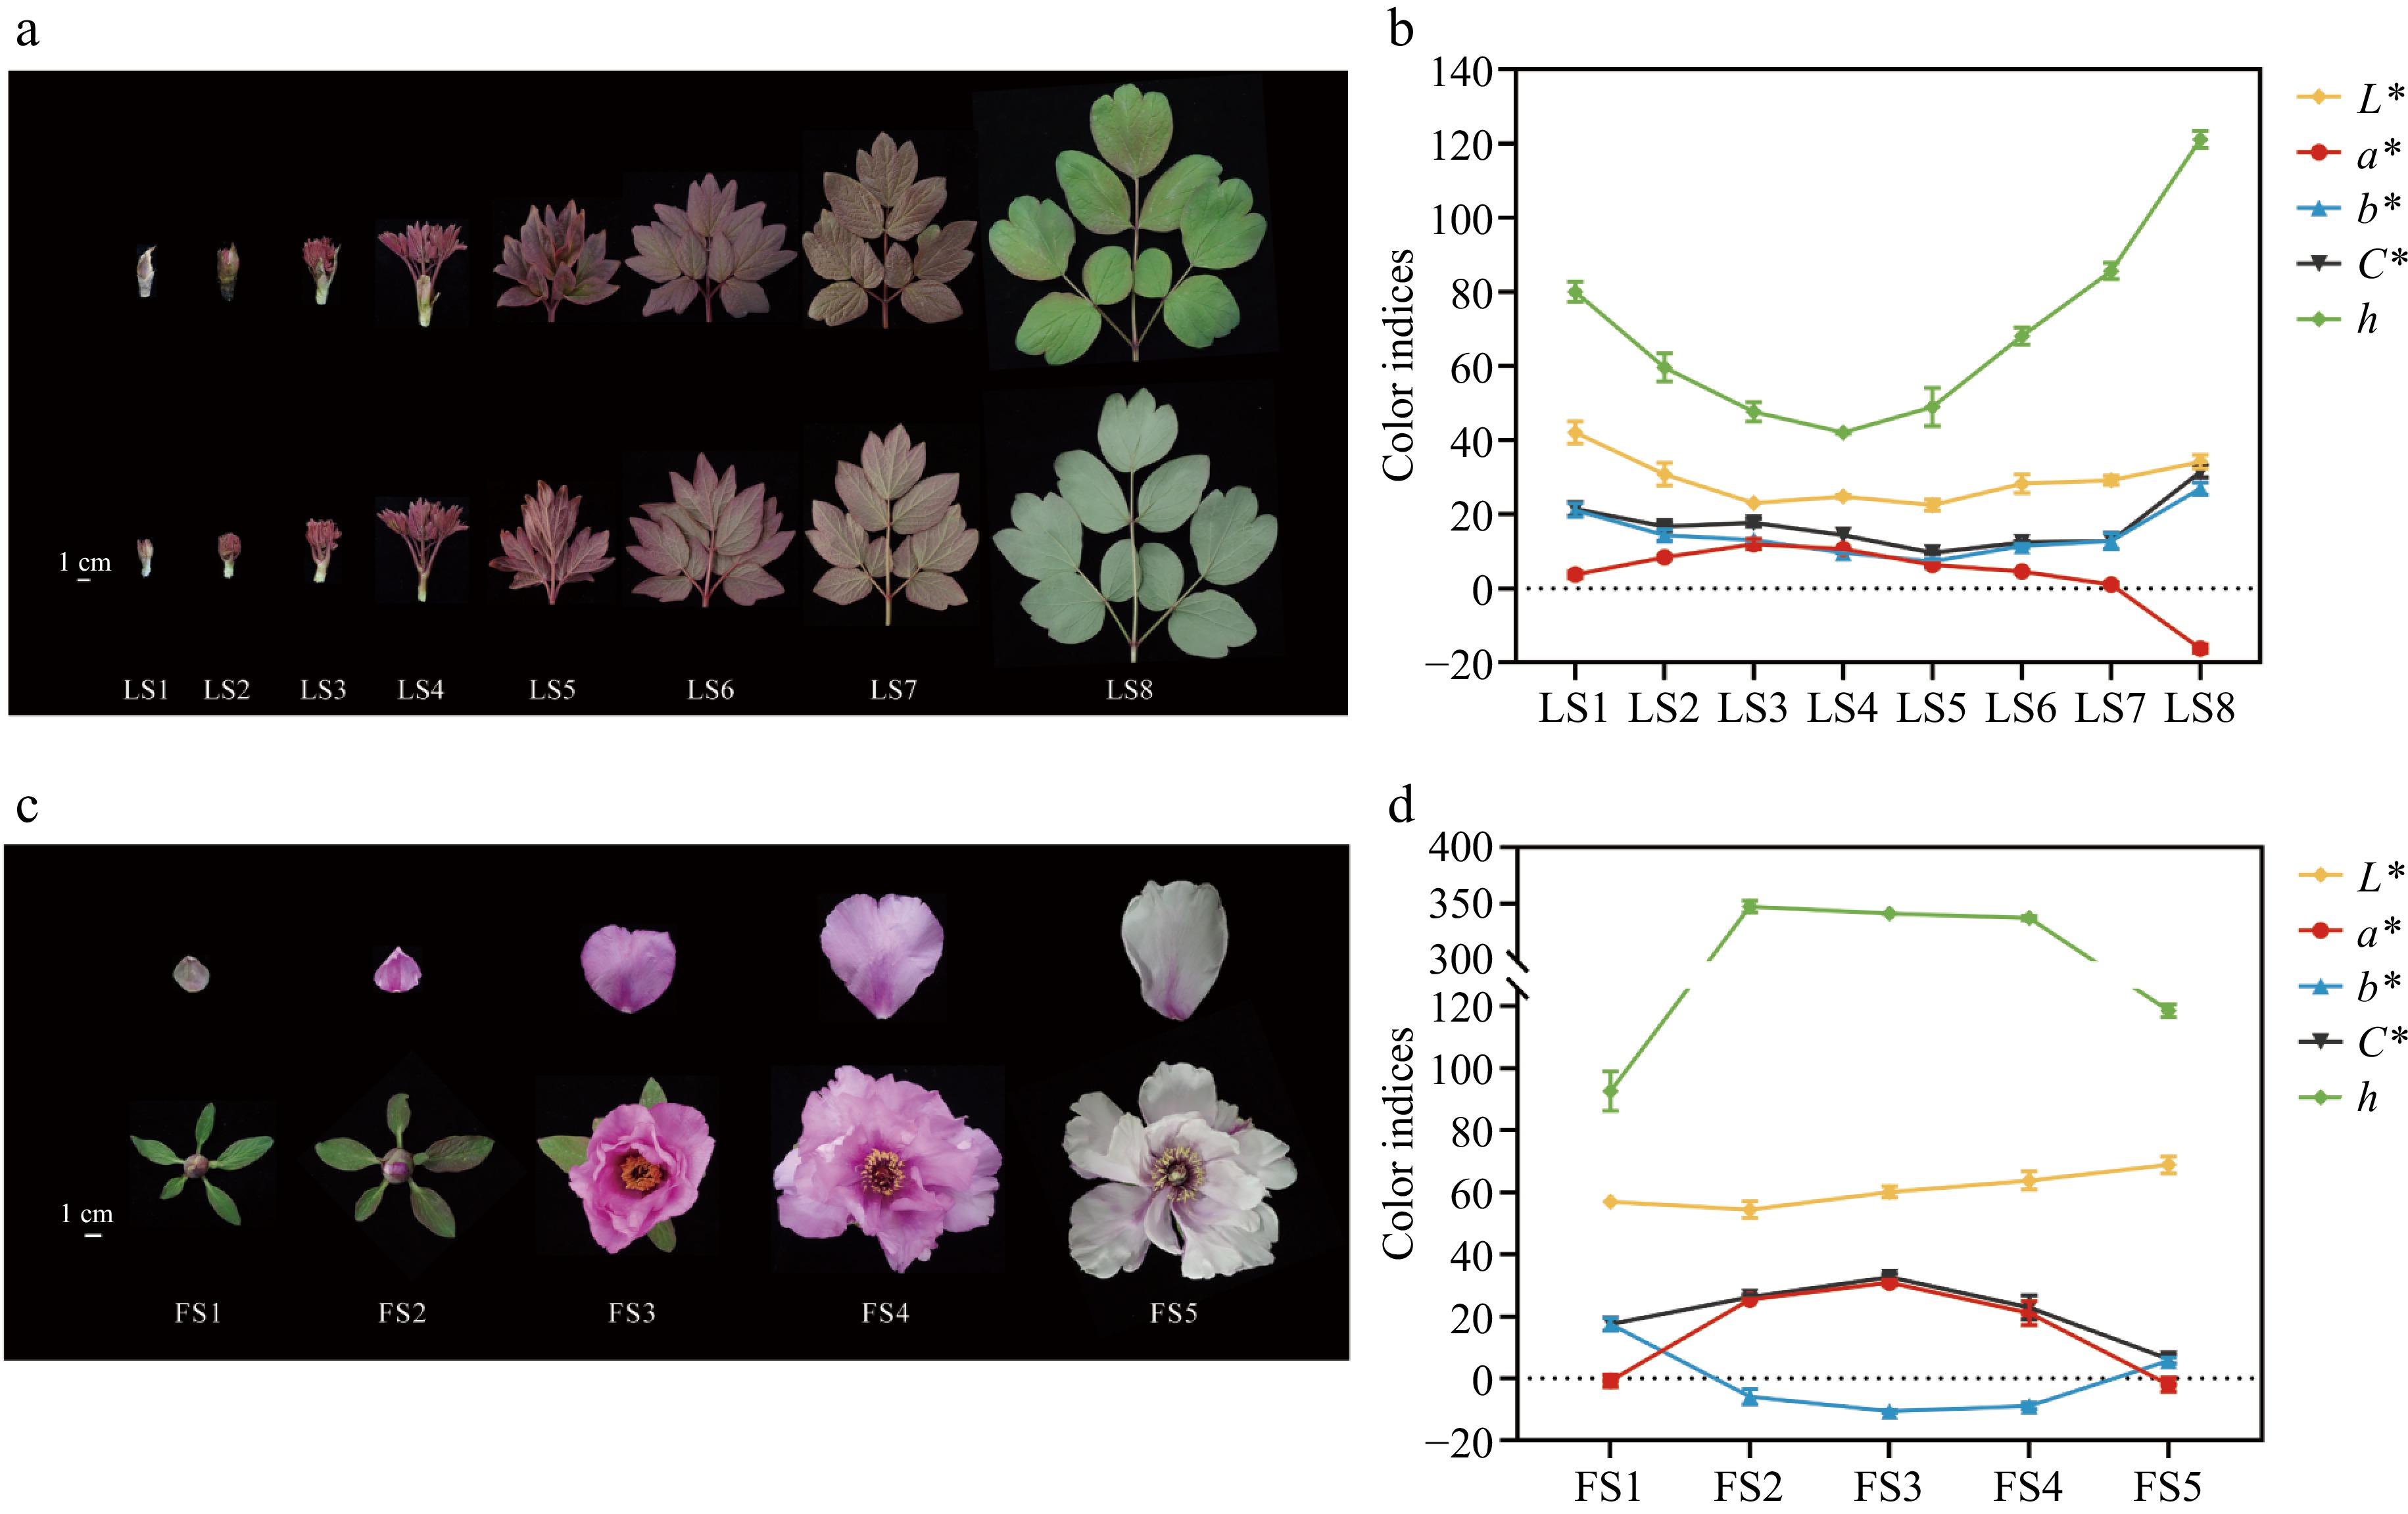
Figure 1.
Phenotypes and color indices of leaves and flowers of P. qiui at different time periods. (a) Leaf phenotypes of P. qiui. (b) Leaf color indices of P. qiui. (c) Flower phenotypes of P. qiui. (d) Flower color indices of P. qiui. LS1: emergence stage; LS2: sprouting stage; LS3: petiole visibility; LS4: petiole spreading; LS5: leaves unfolding; LS6: wind bell bud; LS7:petal coloring; LS8: full bloom stage. FS1: slightly pigmented soft bud; FS2: initially opened flower; FS3: half opened flower; FS4: fully opened flower; FS5: Decaying flowers. L* represents the brightness; a* and b* represent the redness and yellowness, respectively; C* represents chroma; h represents the hue angle.
-
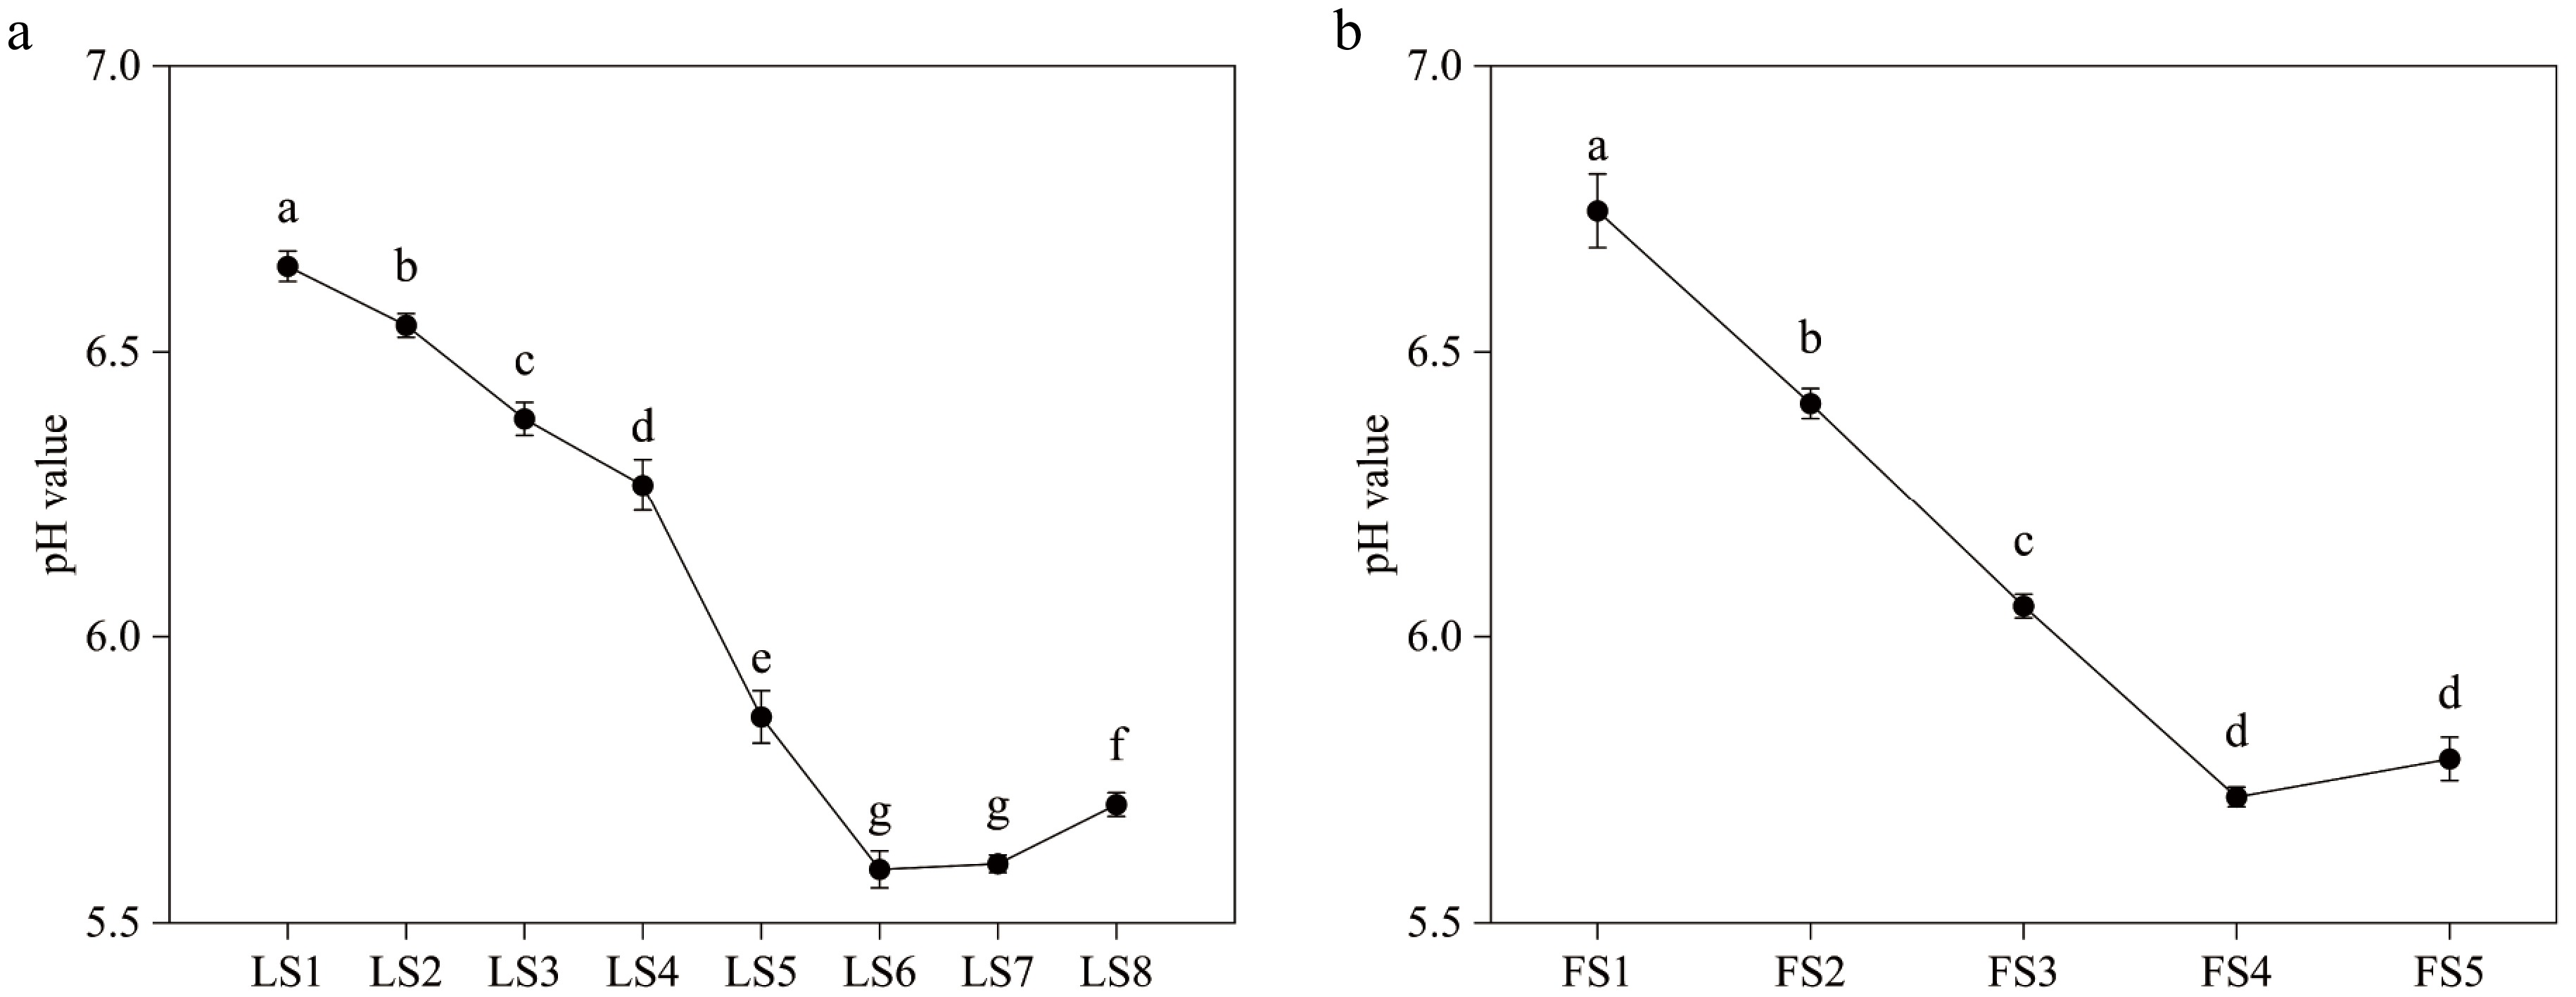
Figure 2.
Variations of pH value of leaves and petals of P. qiui at different periods. (a) Variations of pH value of P. qiui leaves at eight periods. (b) Variations of pH value of P. qiui petals at five periods. Different lowercase letters indicate significant differences at the p < 0.05 level by Duncan's test.
-
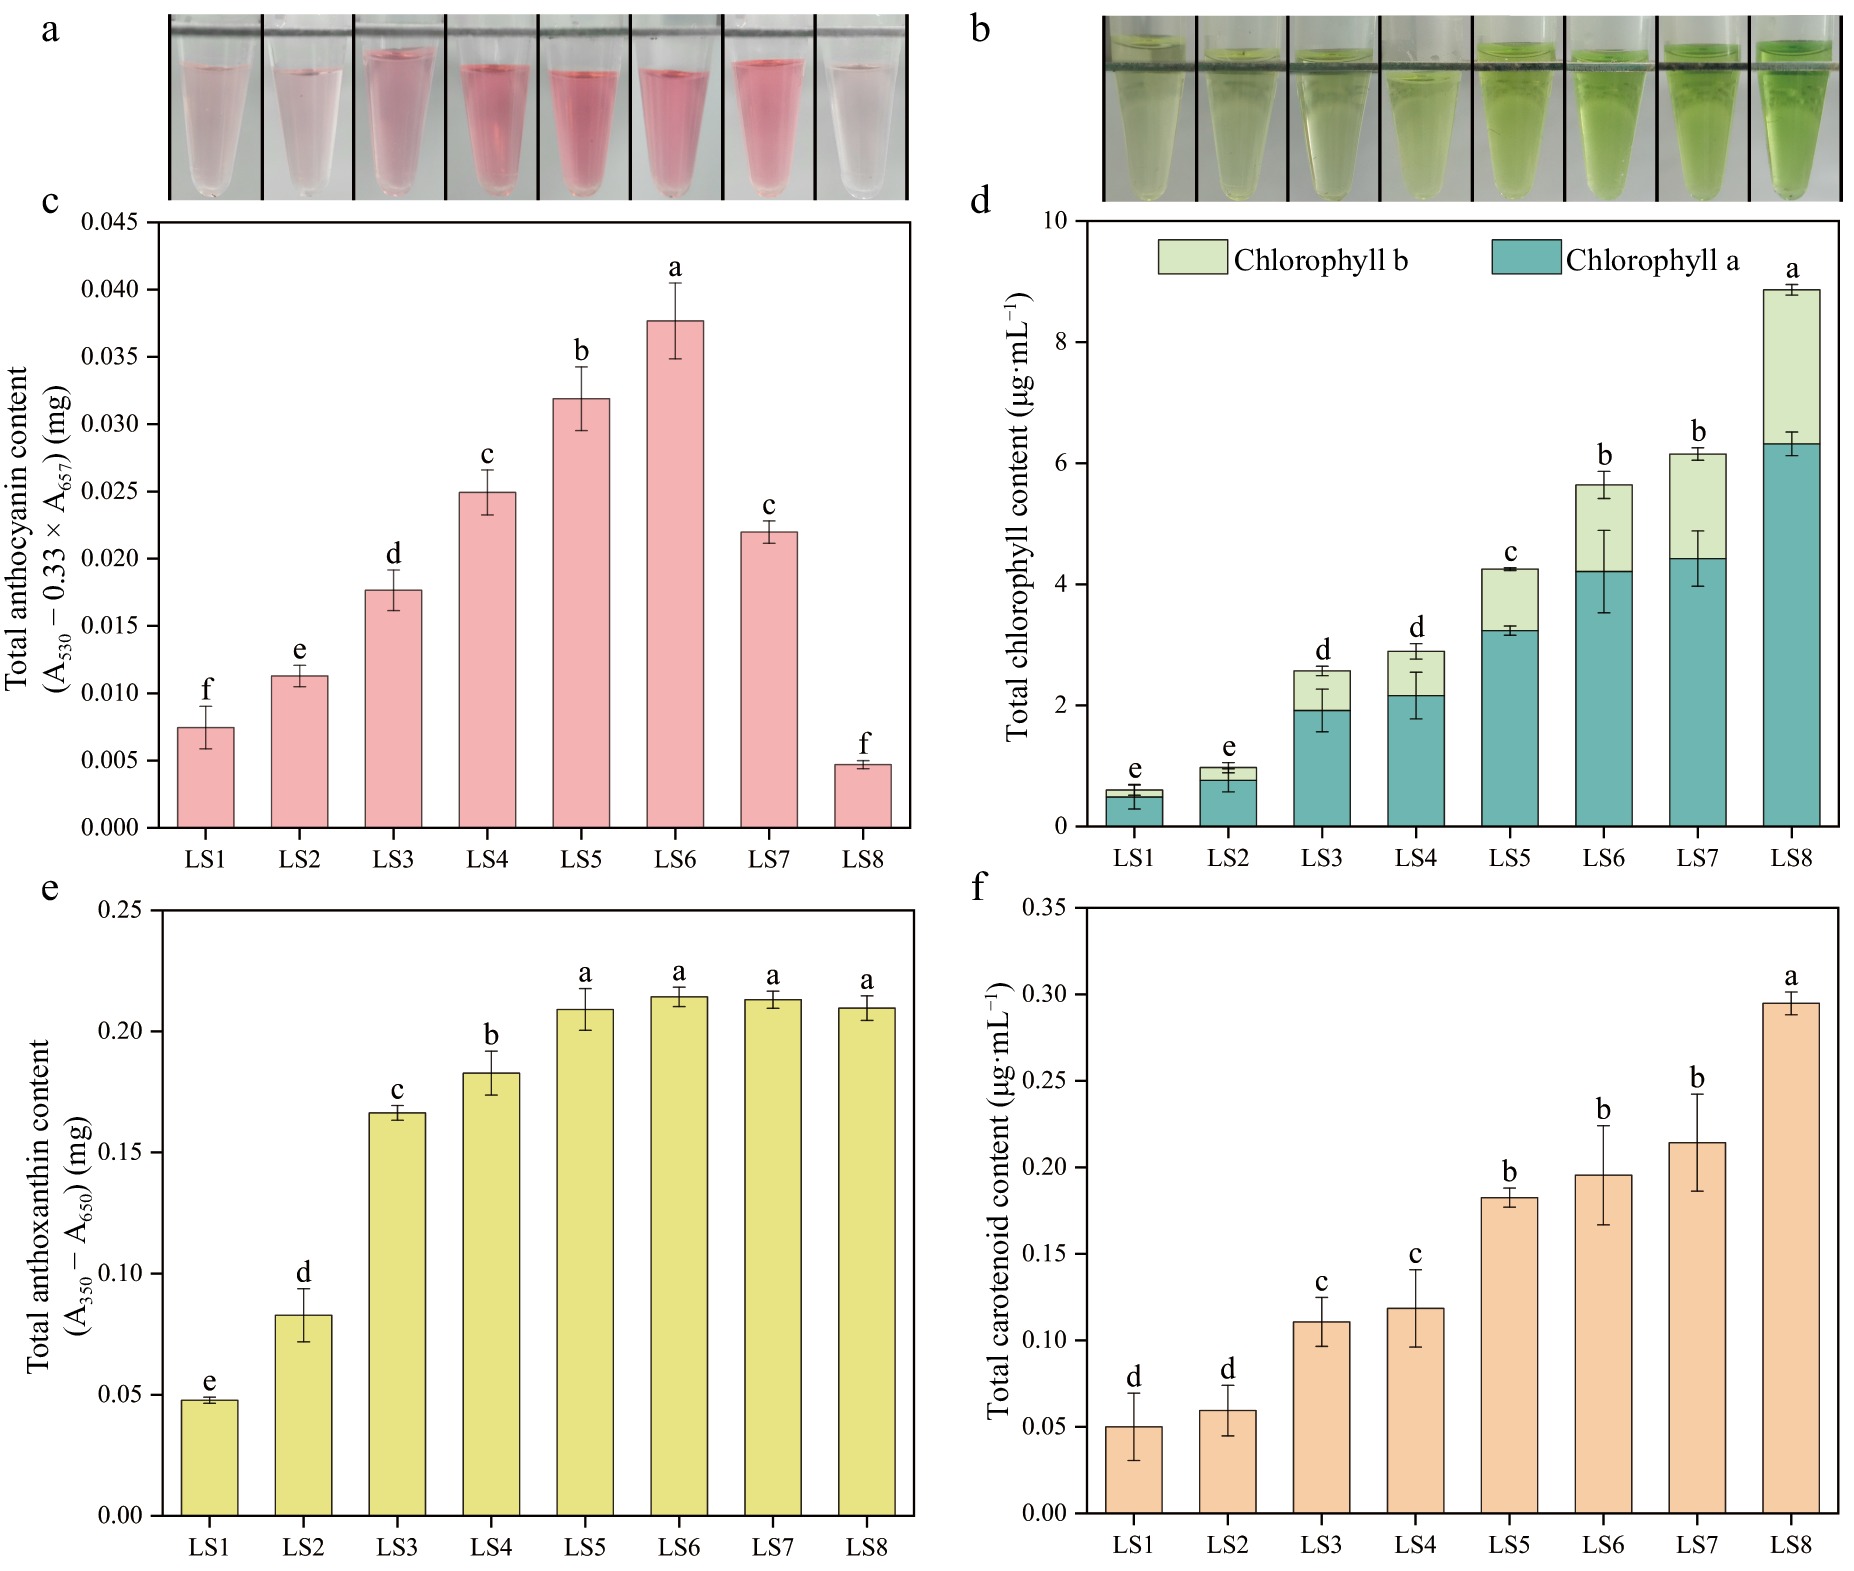
Figure 3.
Pigment contents of leaves at eight developmental stages of P. qiui. (a) Extracts of anthocyanin from leaves at eight stages. (b) Extracts of chlorophyll from leaves at eight stages. (c) Anthocyanin content of leaves at eight stages. (d) Chlorophyll content of leaves at eight stages. (e) Anthoxanthin content of leaves at eight stages. (f) Carotenoid content of leaves at eight stages. Different lowercase letters indicate significant differences at the p < 0.05 level by Duncan's test.
-
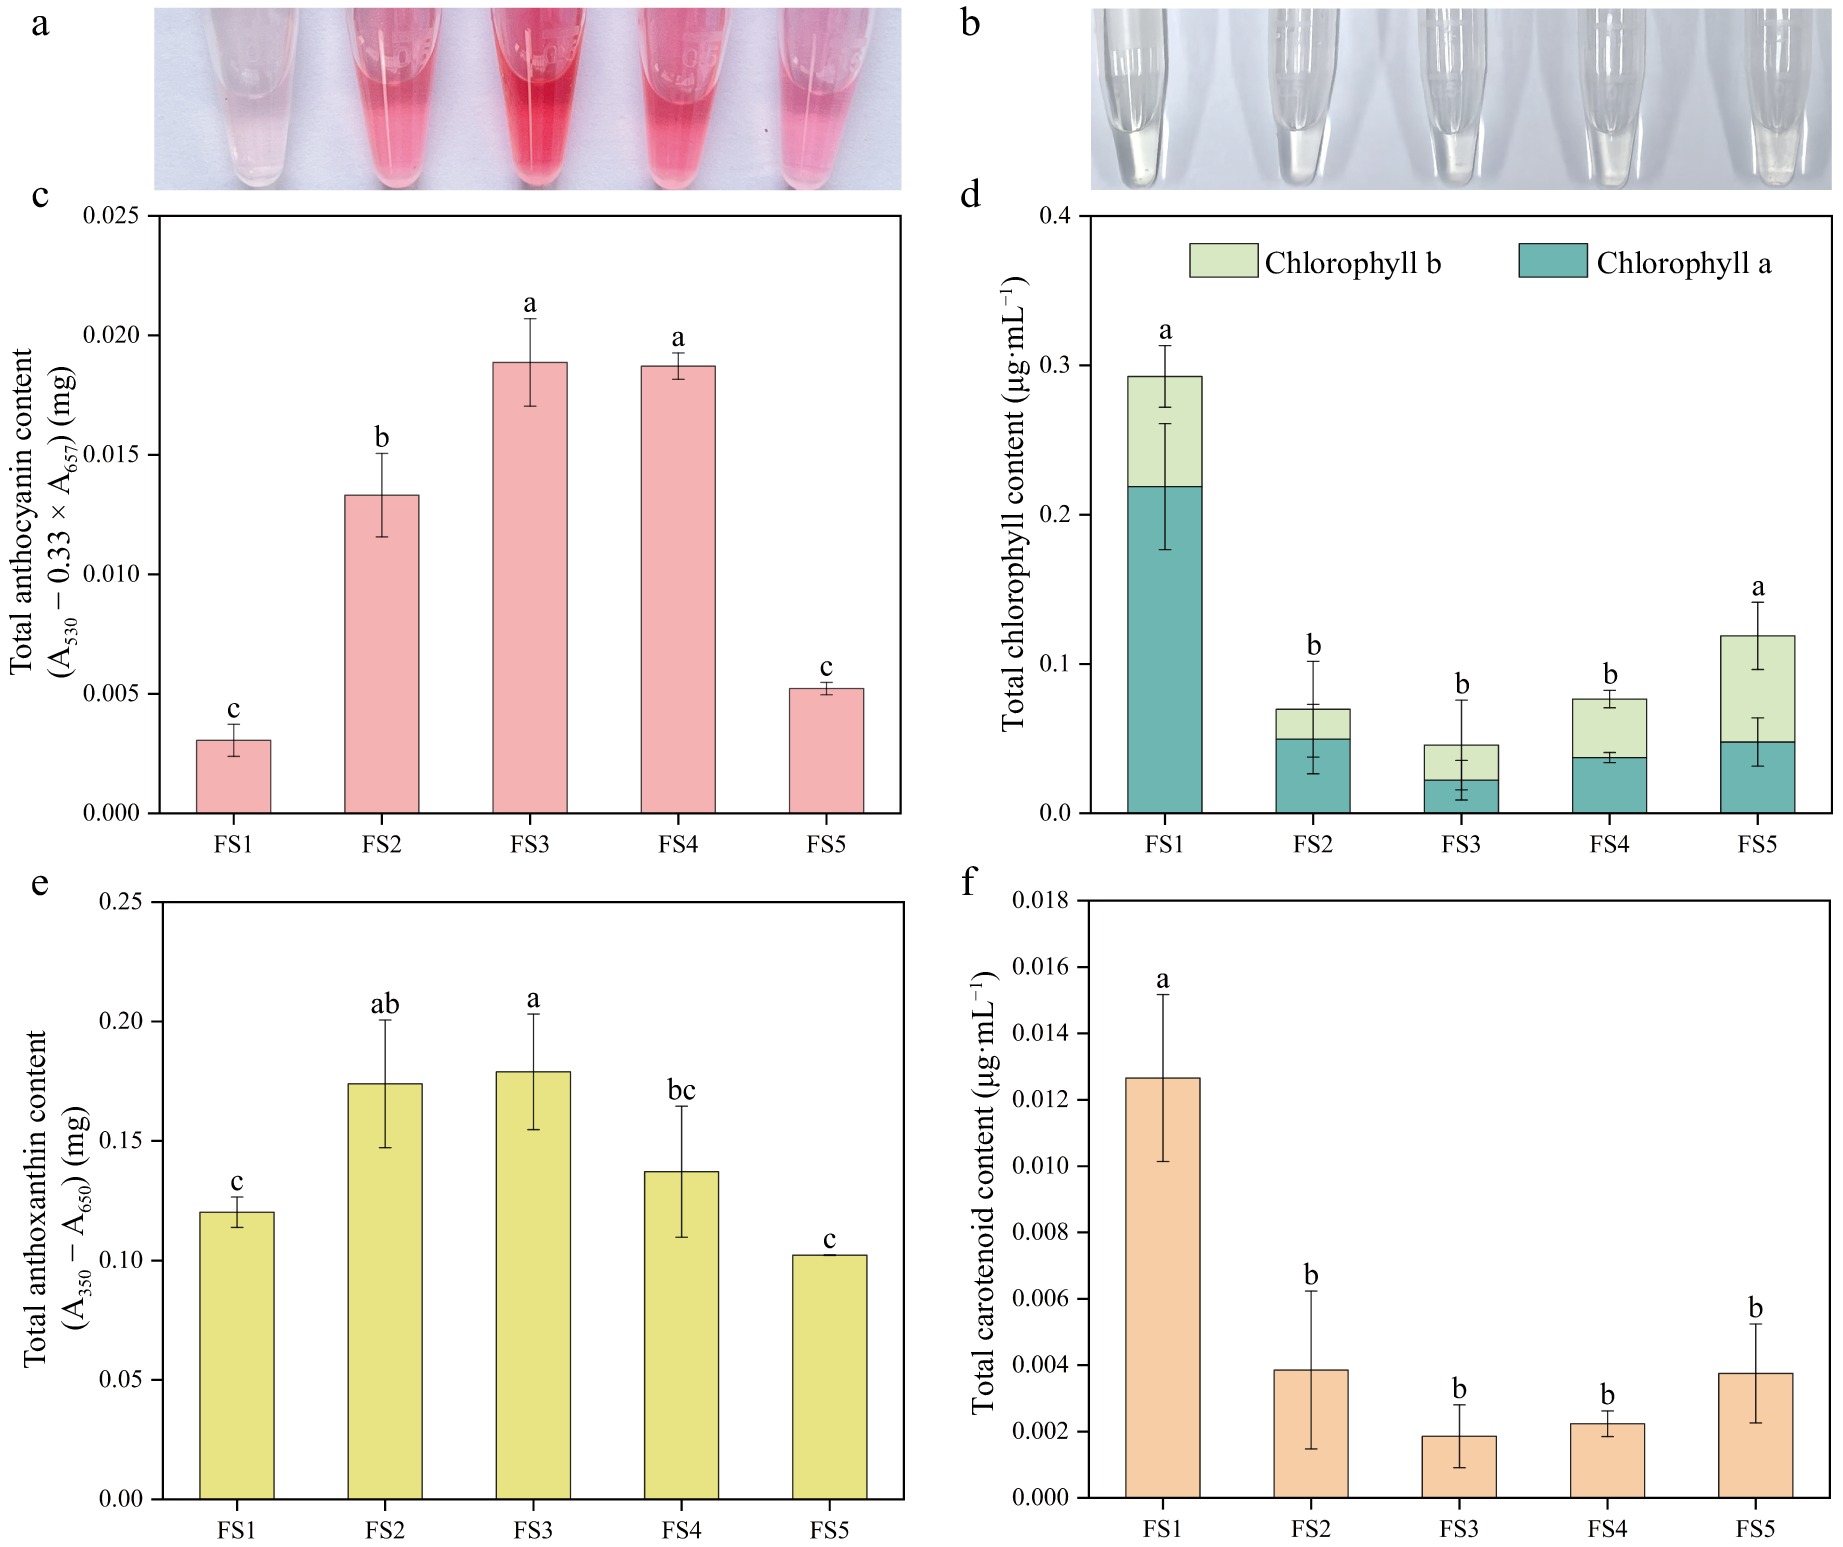
Figure 4.
Pigment contents of petals at five developmental stages of P. qiui. (a) Extracts of anthocyanin from flowers at five stages. (b) Extracts of chlorophyll from flowers at five stages. (c) Anthocyanin content of petals at five stages. (d) Chlorophyll content of petals at five stages. (e) Anthoxanthin content of petals at five stages. (f) Carotenoid content of petals at five stages. Different lowercase letters indicate significant differences at the p < 0.05 level by Duncan's test.
-
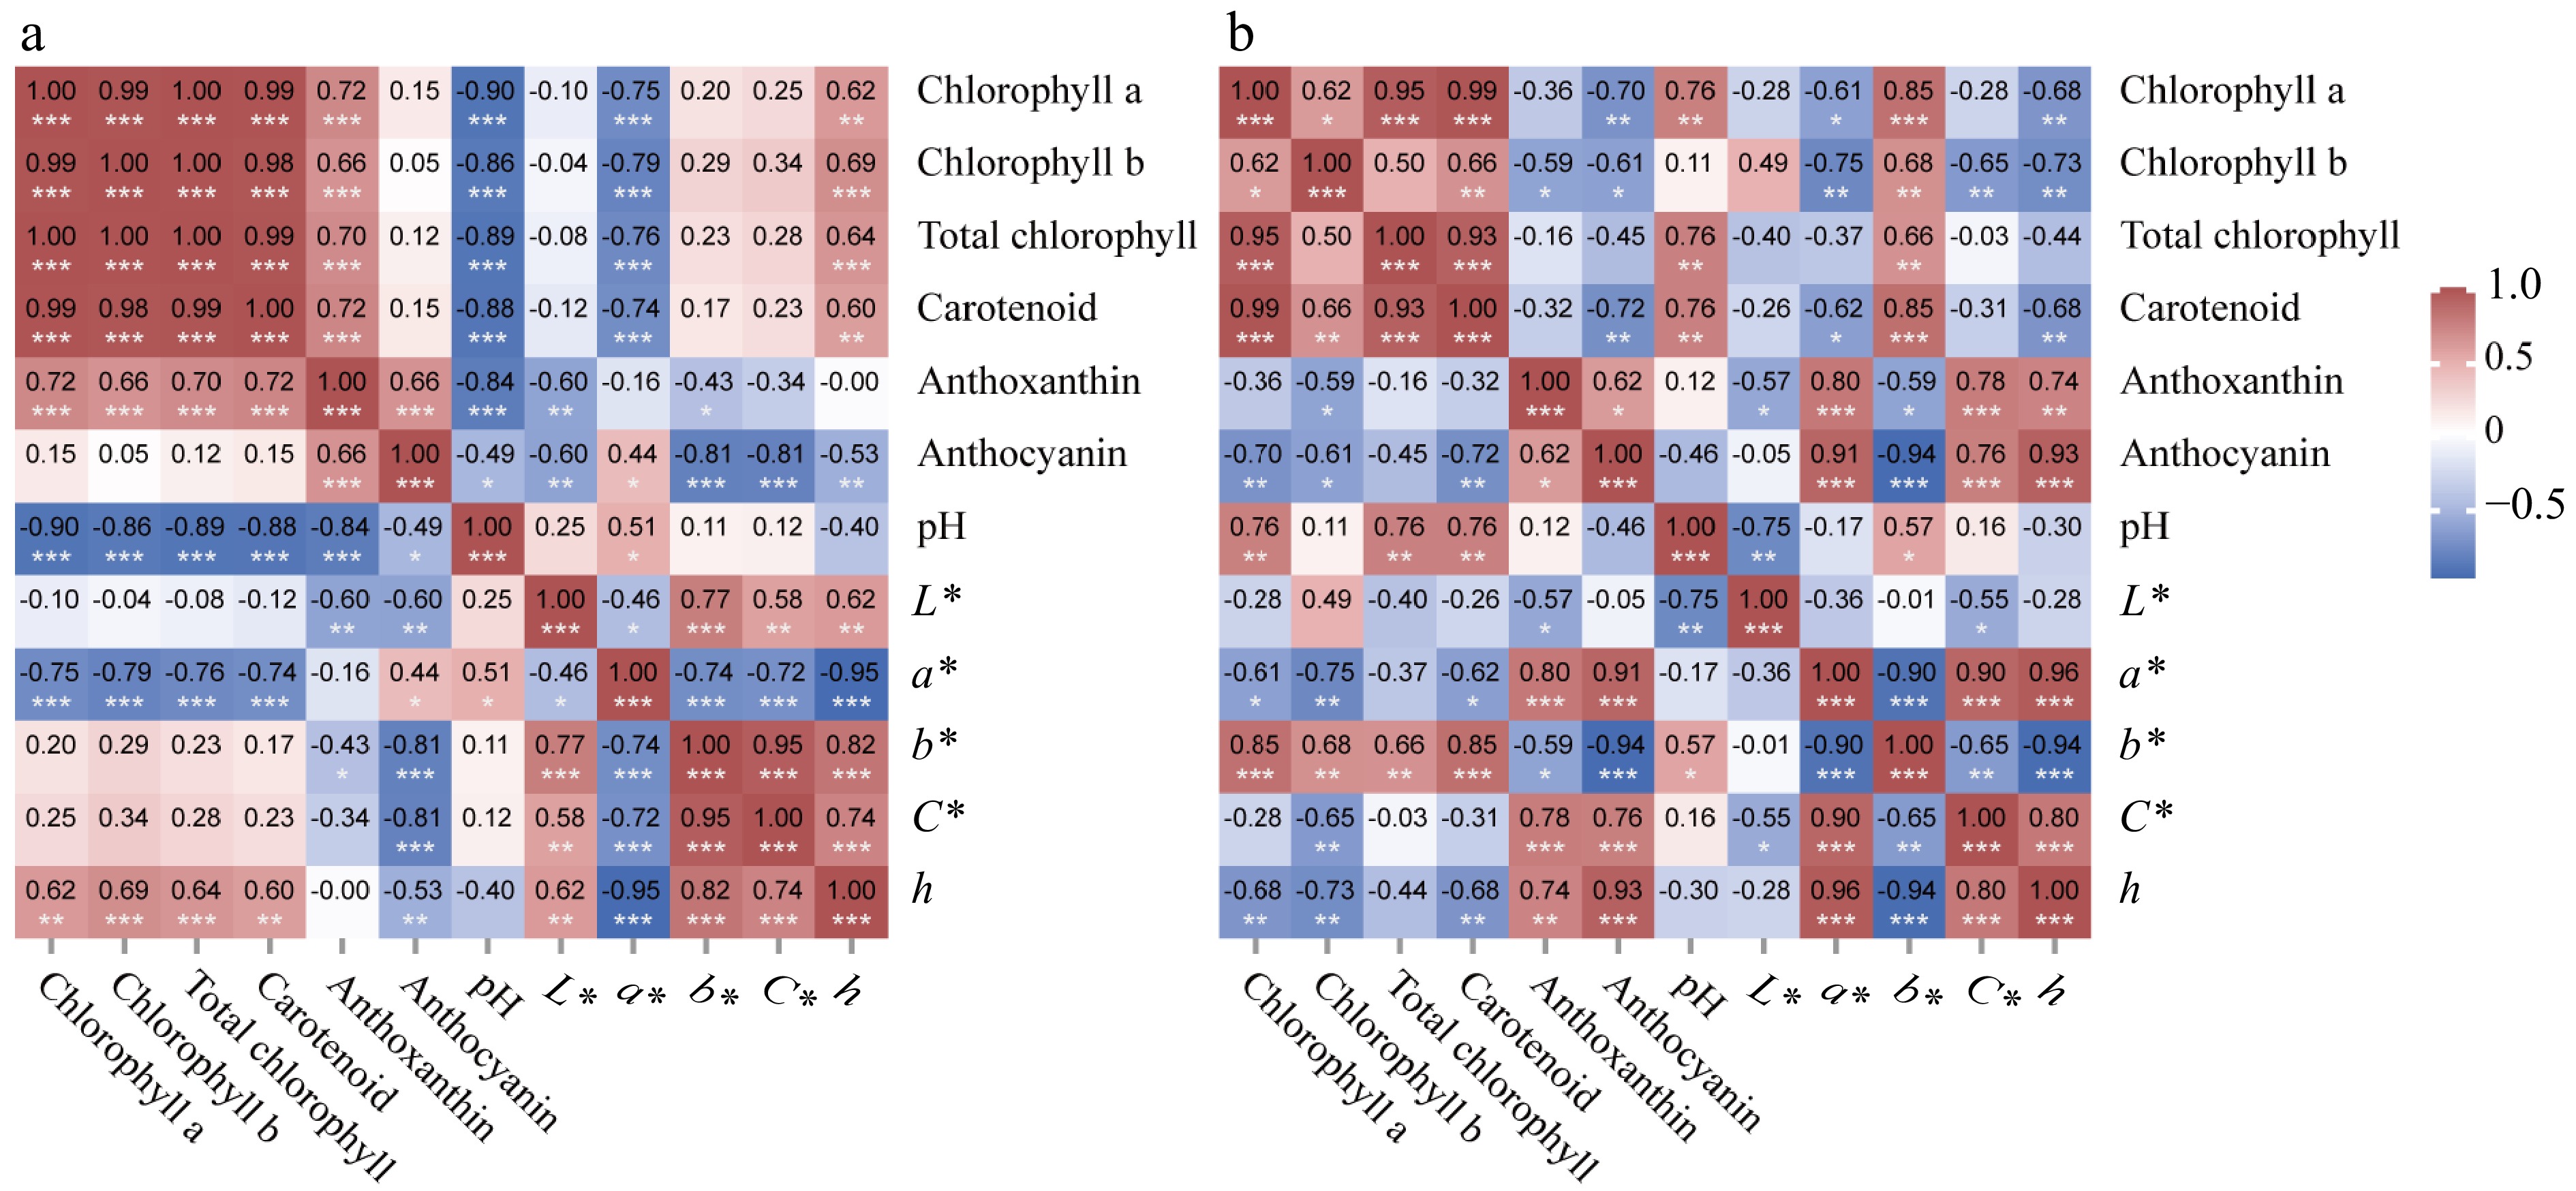
Figure 5.
Heat map of the correlation of leaf and petal color index, cellular pH value, and pigment content. (a) Heat map of the correlation of leaf color index, cellular pH value, and pigment content. (b) Heat map of the correlation of petal color index, cellular pH value, and pigment content. * p < 0.05, ** p < 0.01, *** p < 0.001.
-
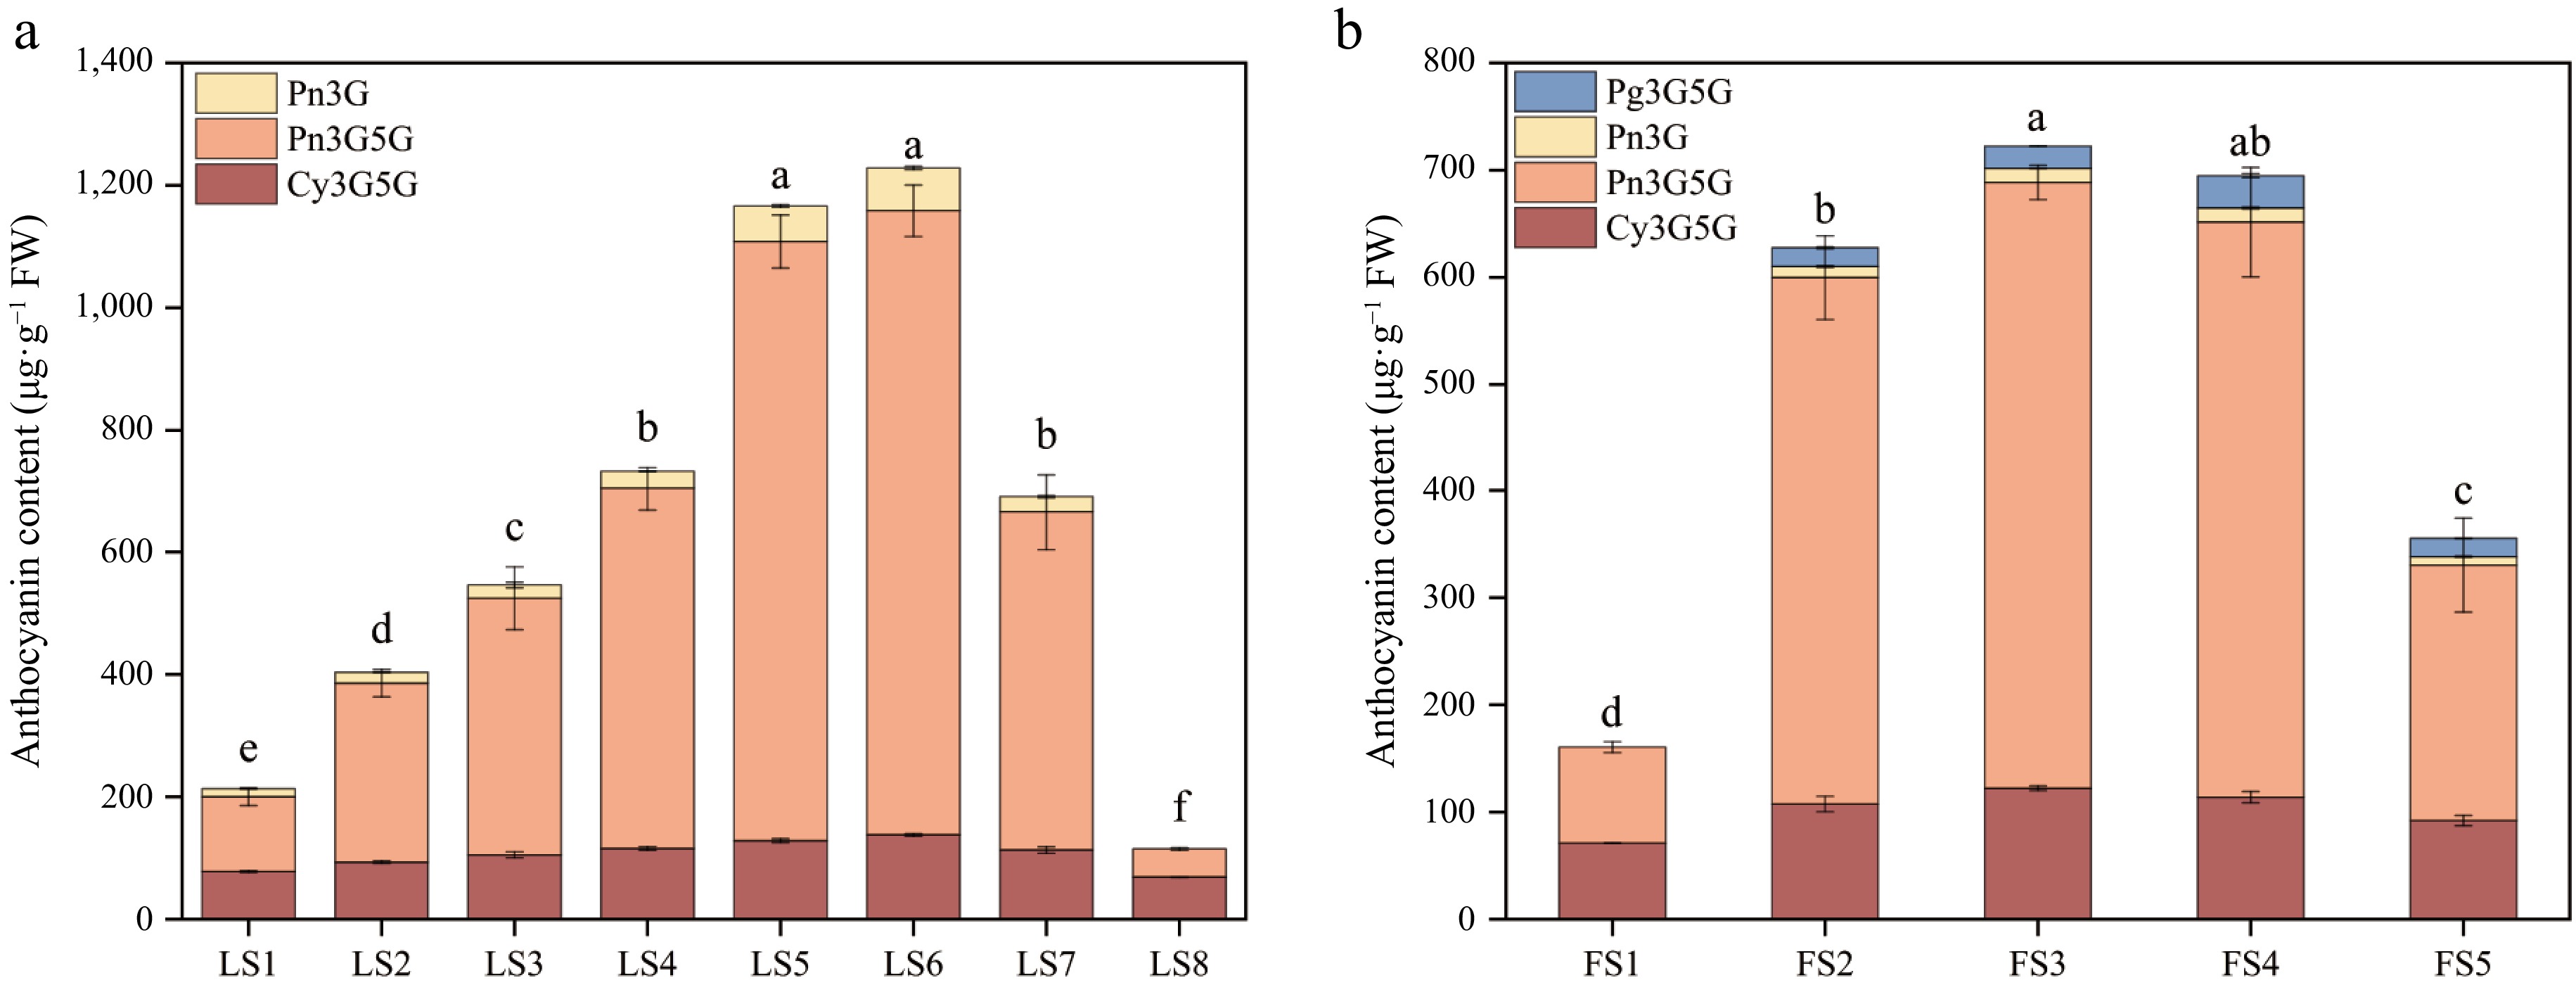
Figure 6.
Anthocyanidin composition and content of leaves and petals of P. qiui at different periods. (a) Anthocyanidin composition and content of P. qiui leaves at eight periods. (b) Anthocyanidin composition and content of P. qiui petals at five periods. Different lowercase letters indicate significant differences at the p < 0.05 level by Duncan's test.
-
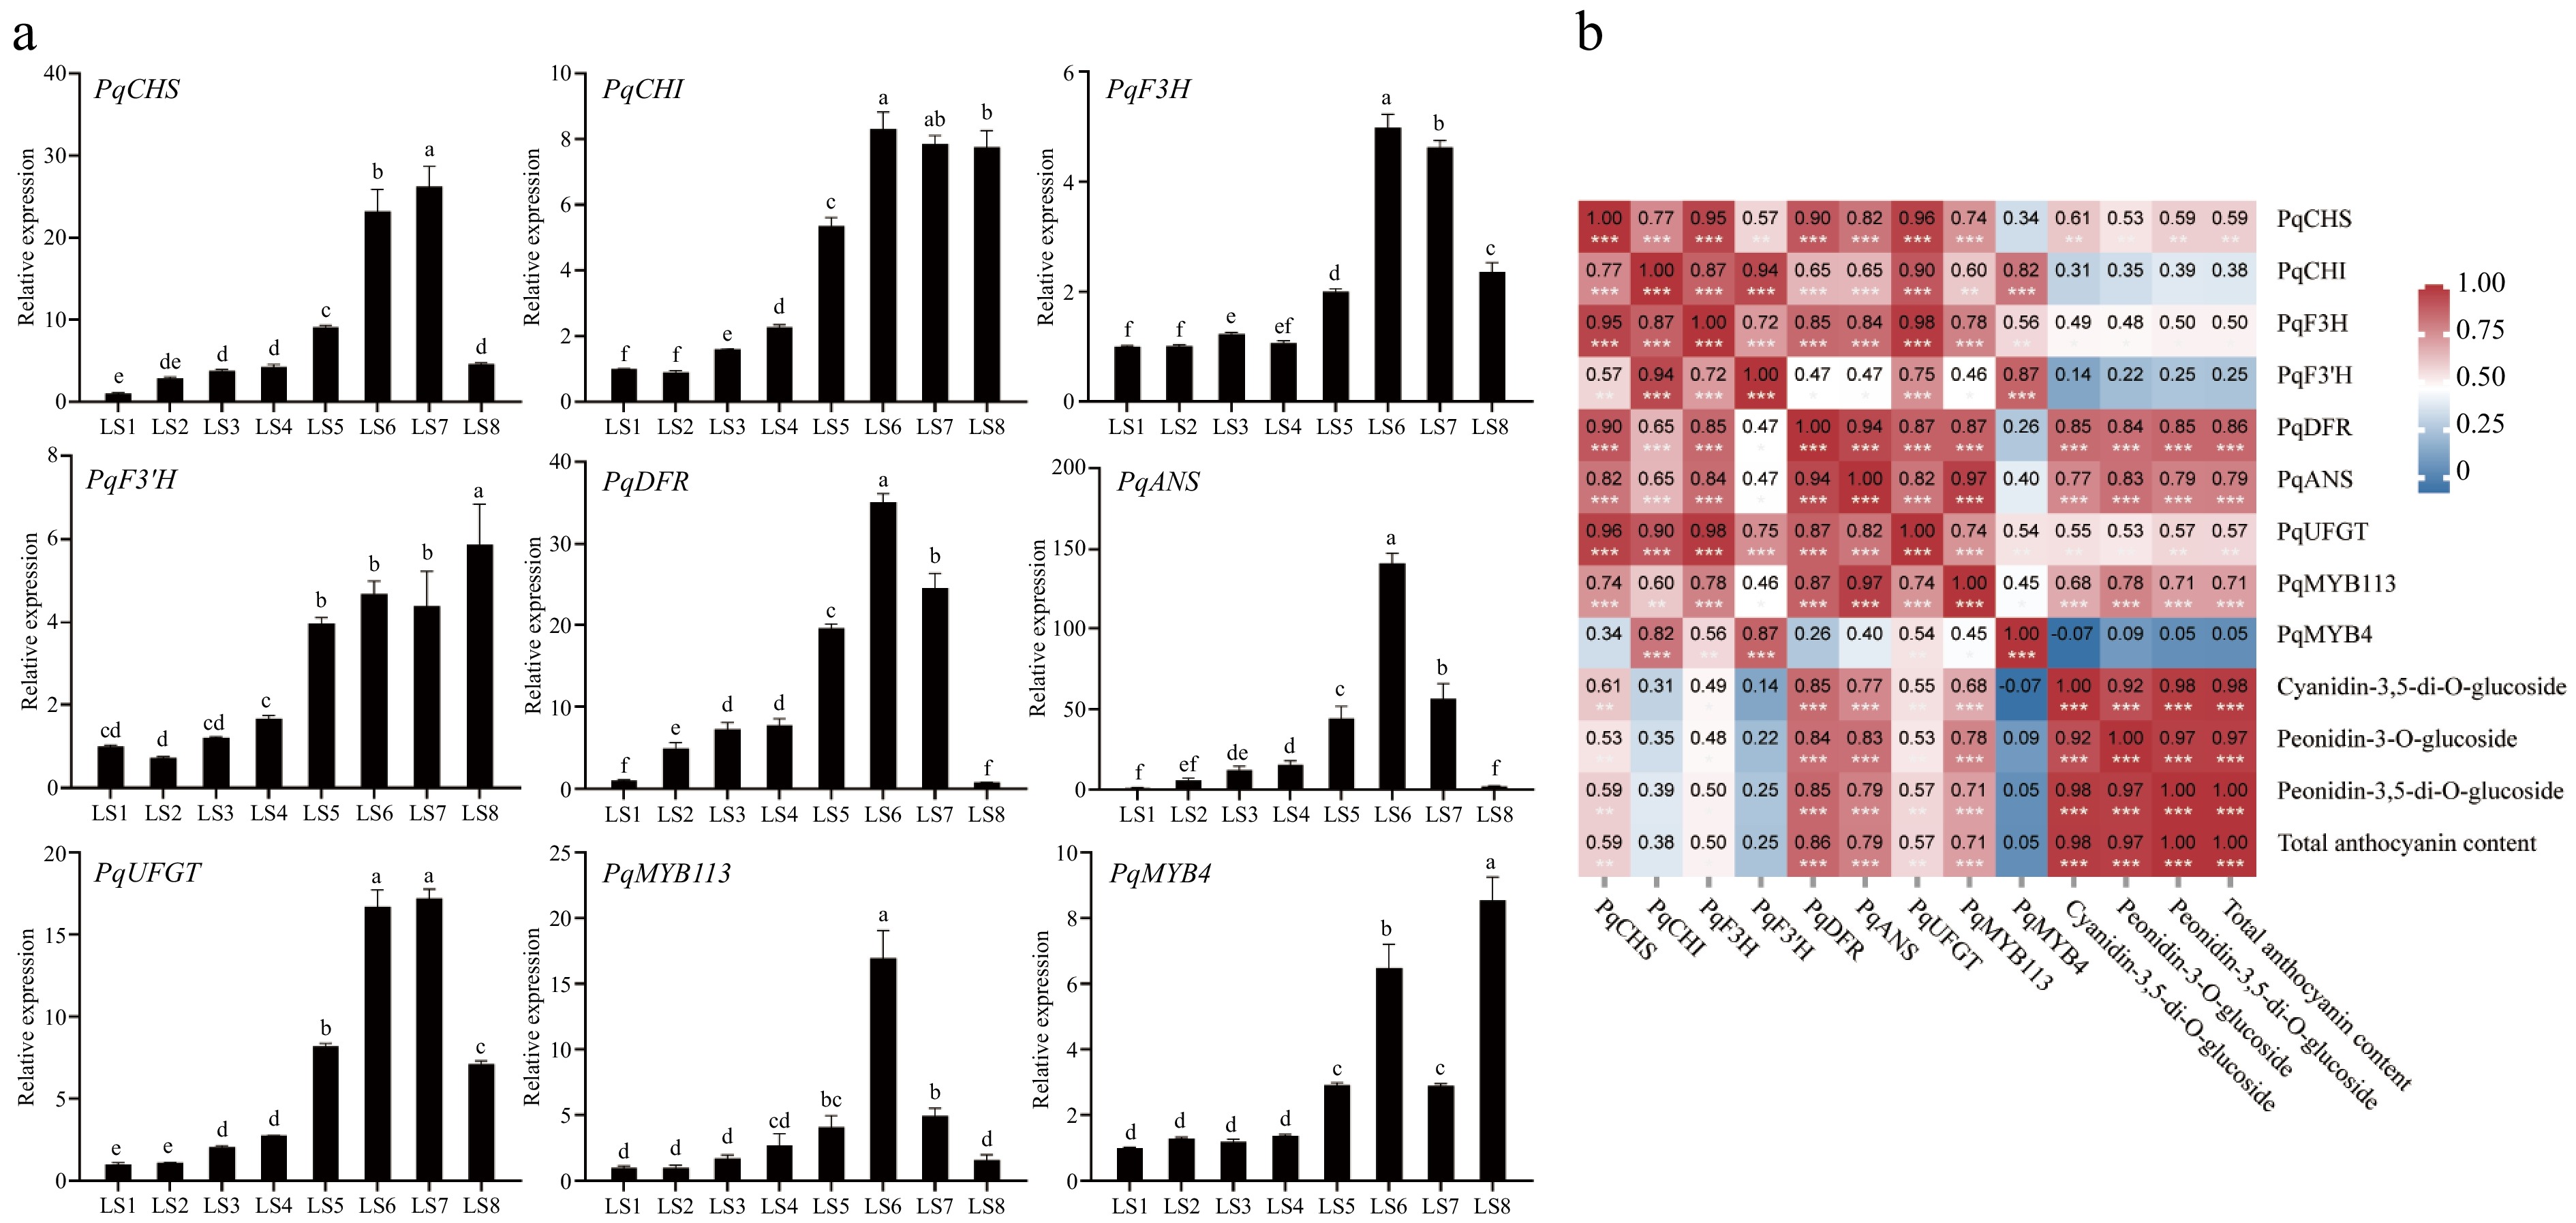
Figure 7.
Expression analysis of genes related to anthocyanin synthesis at eight periods in leaves of P. qiui. (a) Expression patterns of genes at eight periods in leaves of P. qiui. (b) Correlation analysis of key pigment compounds and differentially expressed genes in the anthocyanin synthesis pathway in leaves. Different lowercase letters indicate significant differences at the p < 0.05 level by Duncan's test. * p < 0.05, ** p < 0.01, *** p < 0.001.
-
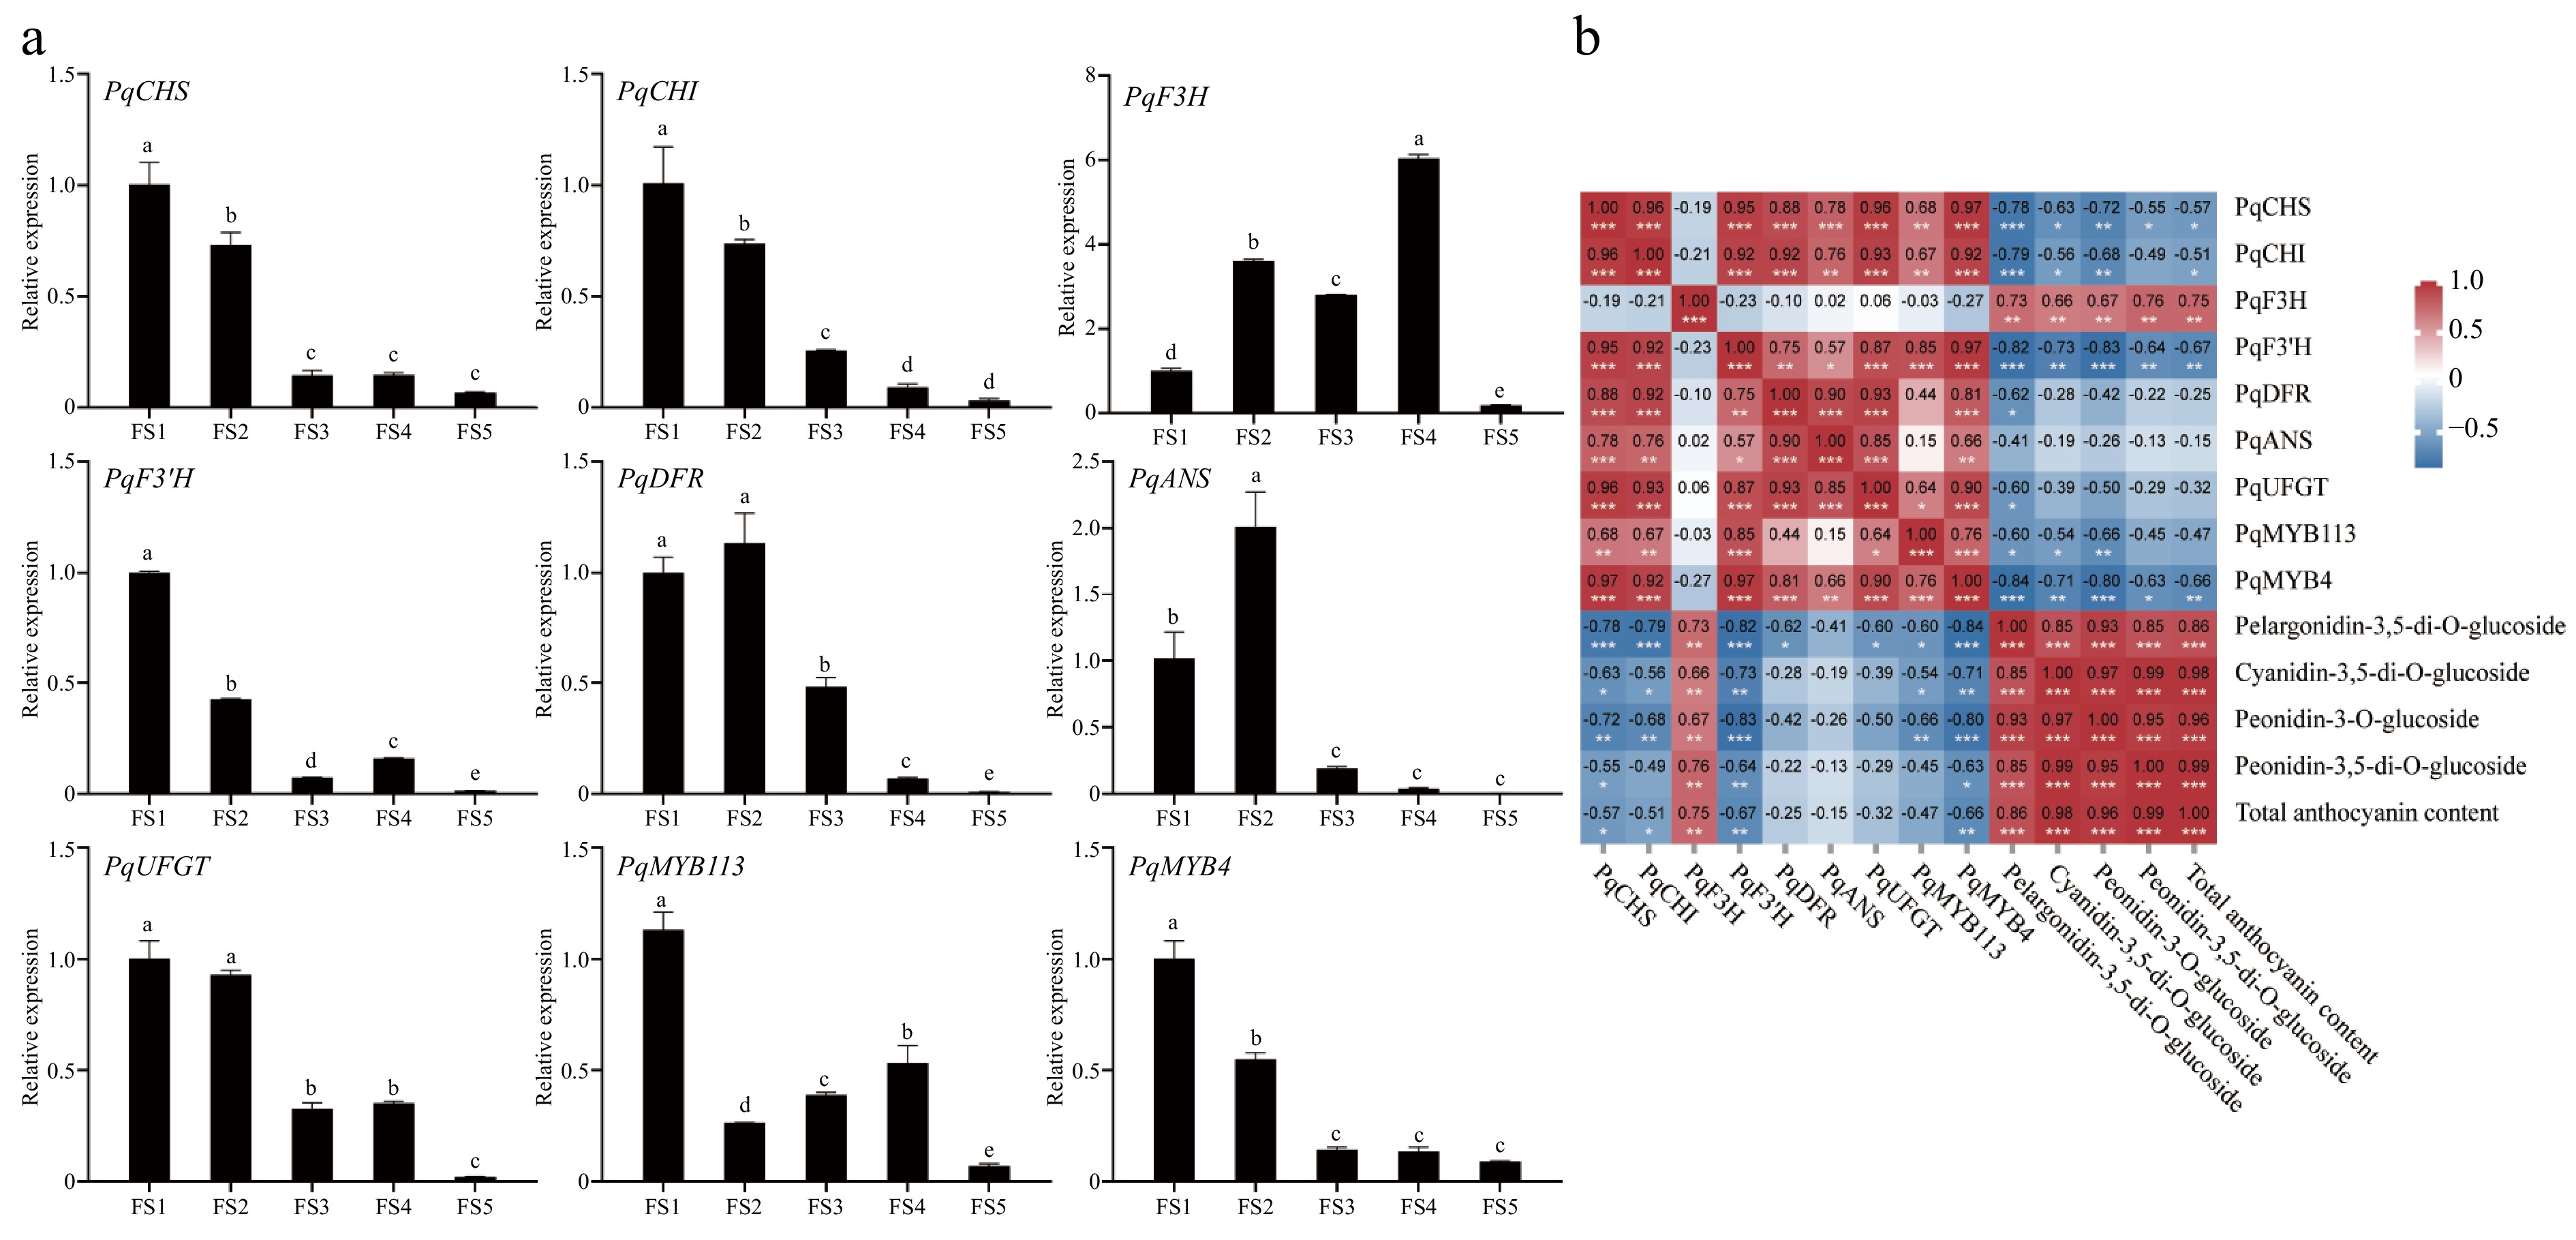
Figure 8.
Expression analysis of genes related to anthocyanin synthesis at five periods in petals of P. qiui. (a) Expression patterns of genes at five periods in petals of P. qiui. (b) Correlation analysis of key pigment compounds and differentially expressed genes in the anthocyanin synthesis pathway in petals. Different lowercase letters indicate significant differences at the p < 0.05 level by Duncan's test. * p < 0.05, ** p < 0.01, *** p < 0.001.
Figures
(8)
Tables
(0)