-
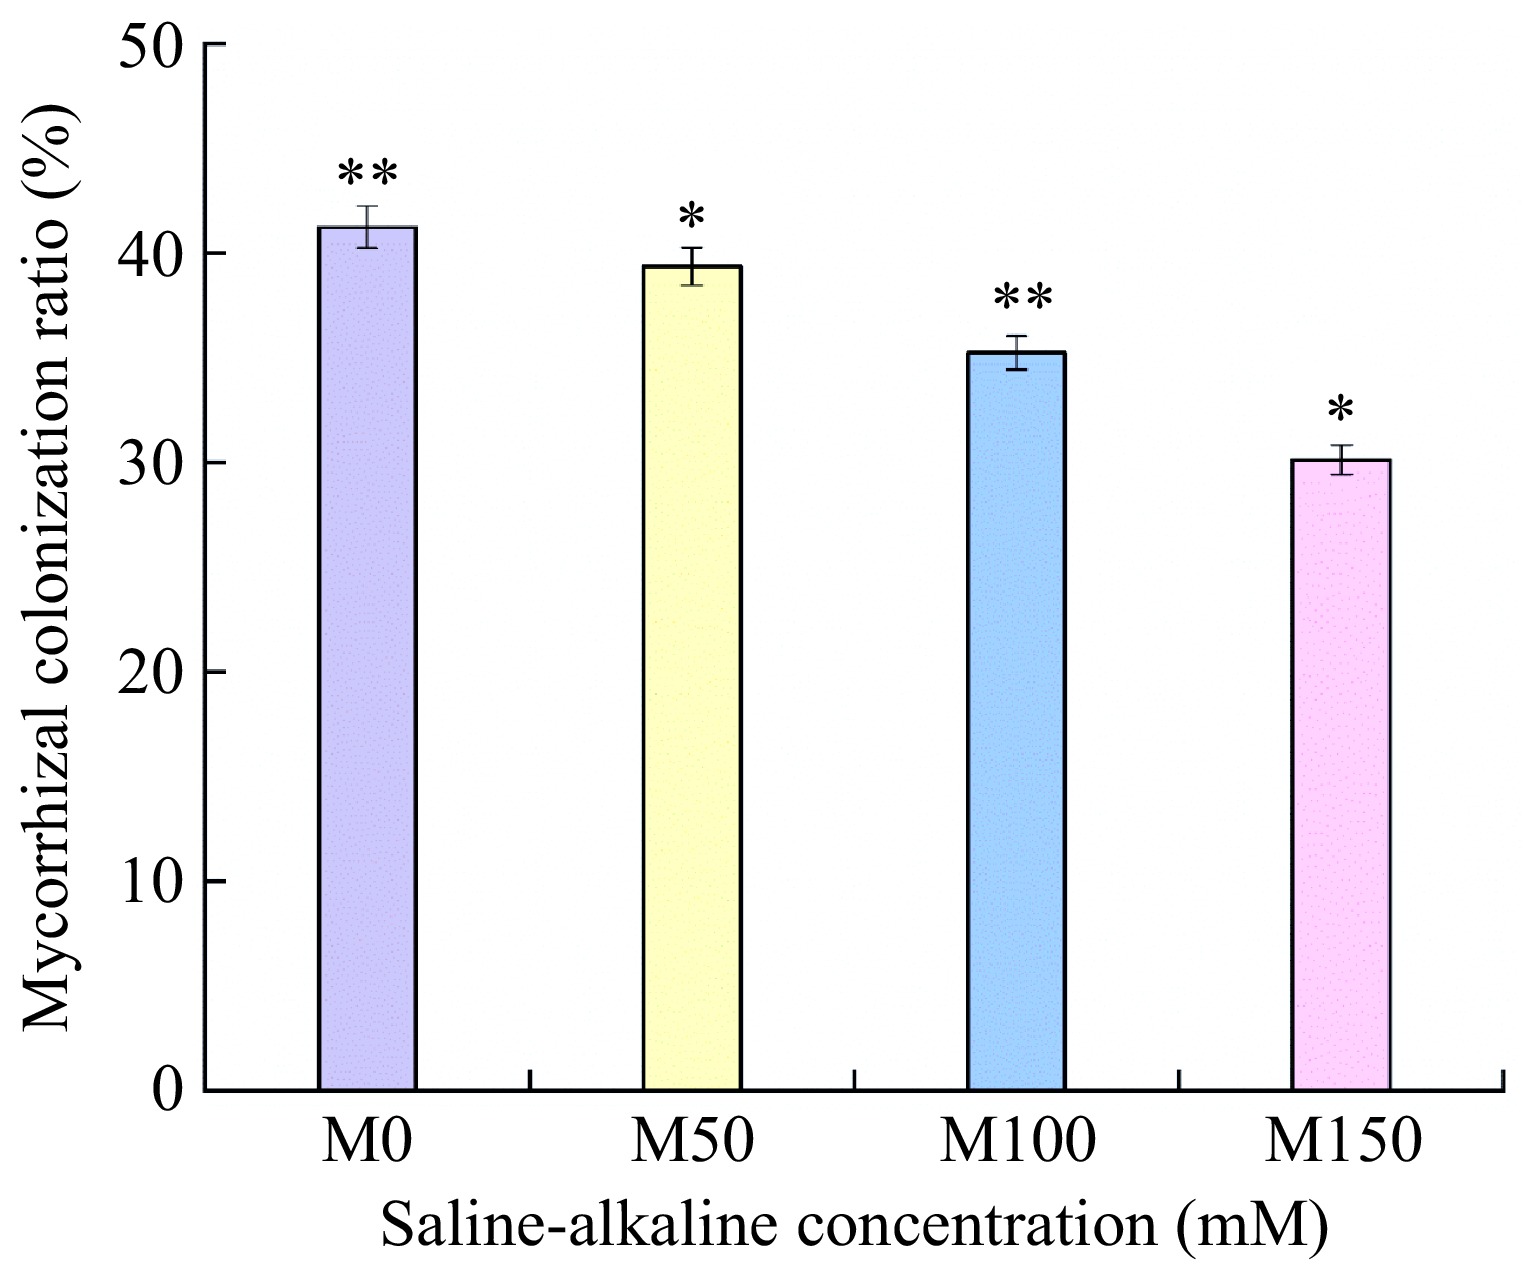
Figure 1.
Effects of saline-alkali stress on the mycorrhizal infestation rate of apple M9-T337 rootstock by arbuscular mycorrhizal. (M0) fresh water irrigation + AMF; (M50) 50 mM NaCl + NaHCO3 + AMF; (M100) 100 mM NaCl + NaHCO3 + AMF; (M150) 150 mM NaCl + NaHCO3 + AMF). * Represents a significant correlation at the 0.0.5 level; ** represents a highly significant correlation at the 0.01 level (Student's t-test).
-
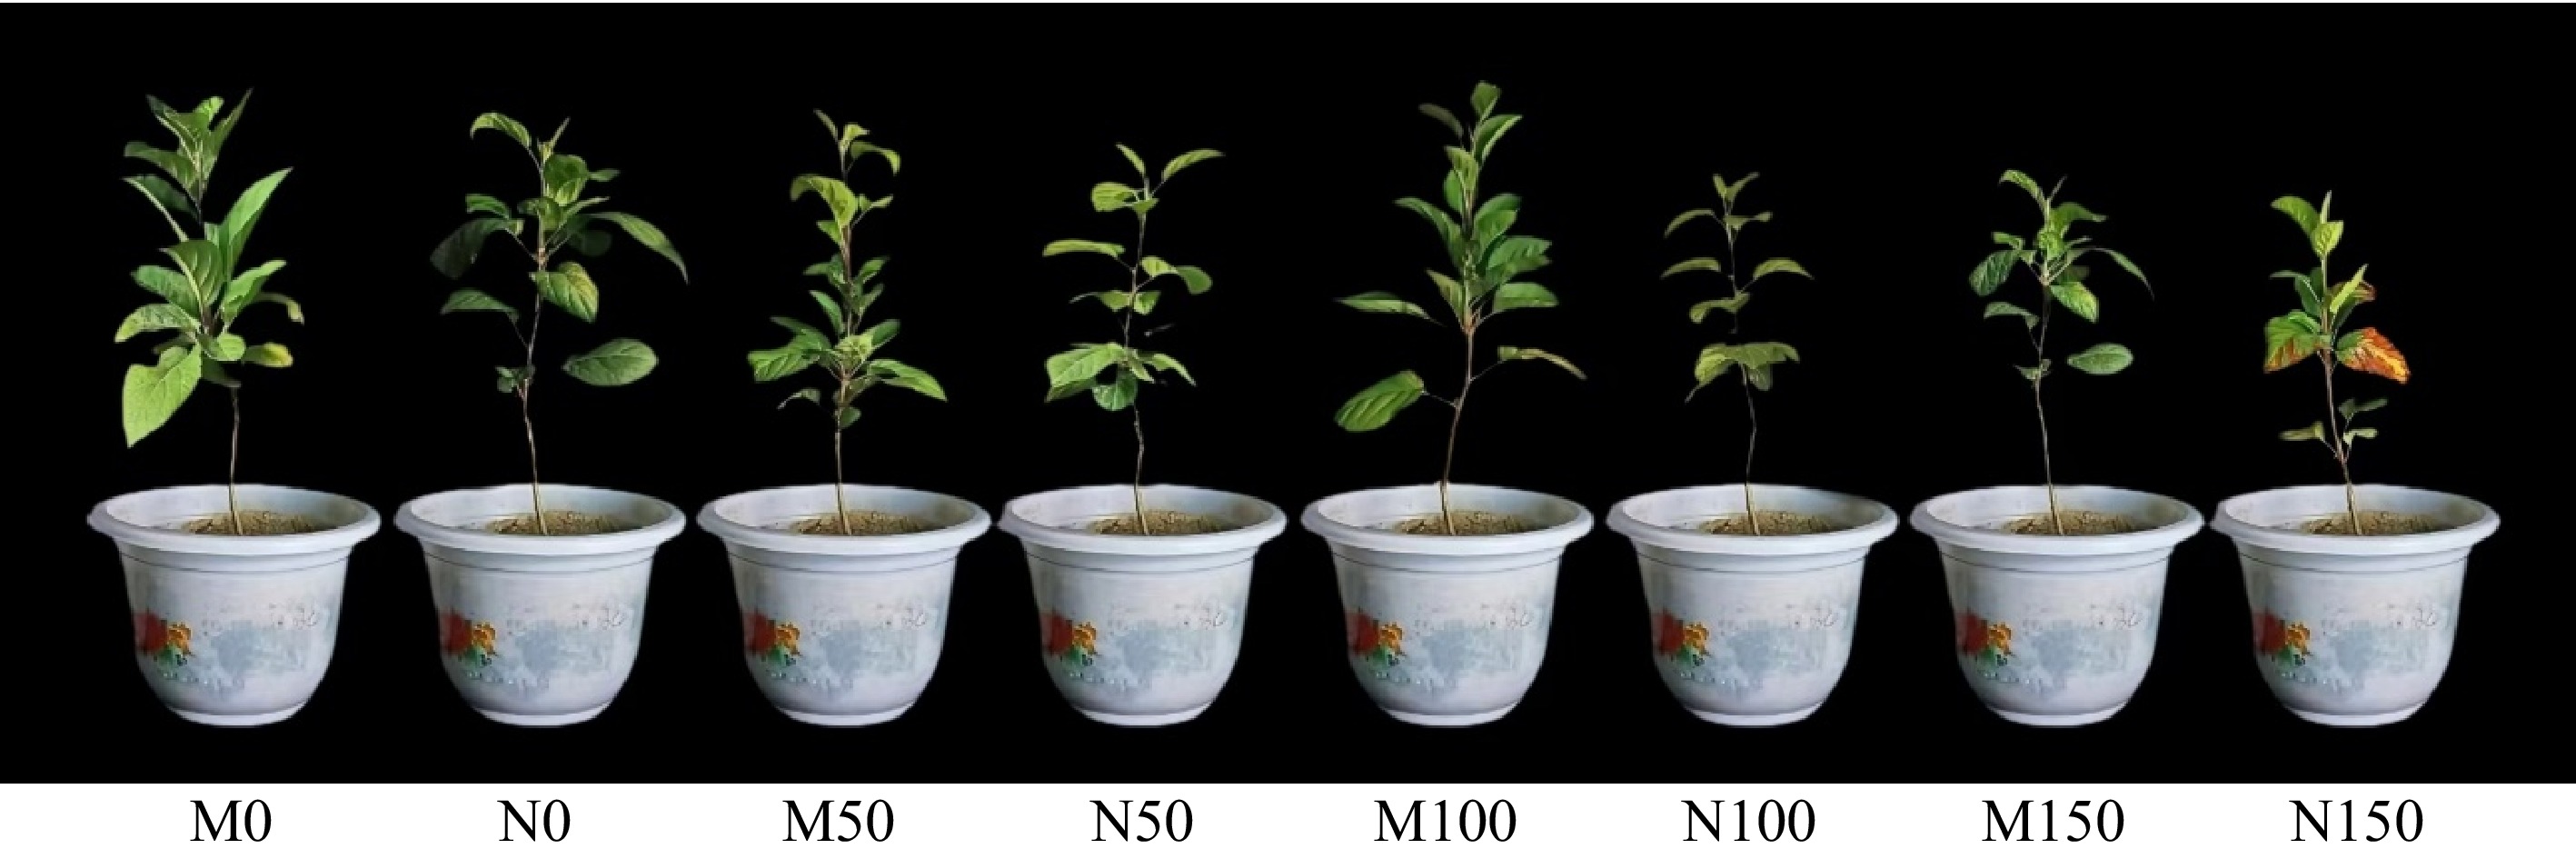
Figure 2.
Effects of AMF on phenotype 0f M9-T337 leaves under saline-alkali stress. (M0) Fresh water irrigation + AMF; (N0) fresh water irrigation; (M50) 50 mM NaCl + NaHCO3 + AMF; (N50) 50 mM NaCl + NaHCO3; (M100) 100 mM NaCl + NaHCO3 + AMF; (N100) 100 mM NaCl + NaHCO3; (M150) 150 mM NaCl + NaHCO3 + AMF); (N150) 150 mM NaCl + NaHCO3.
-
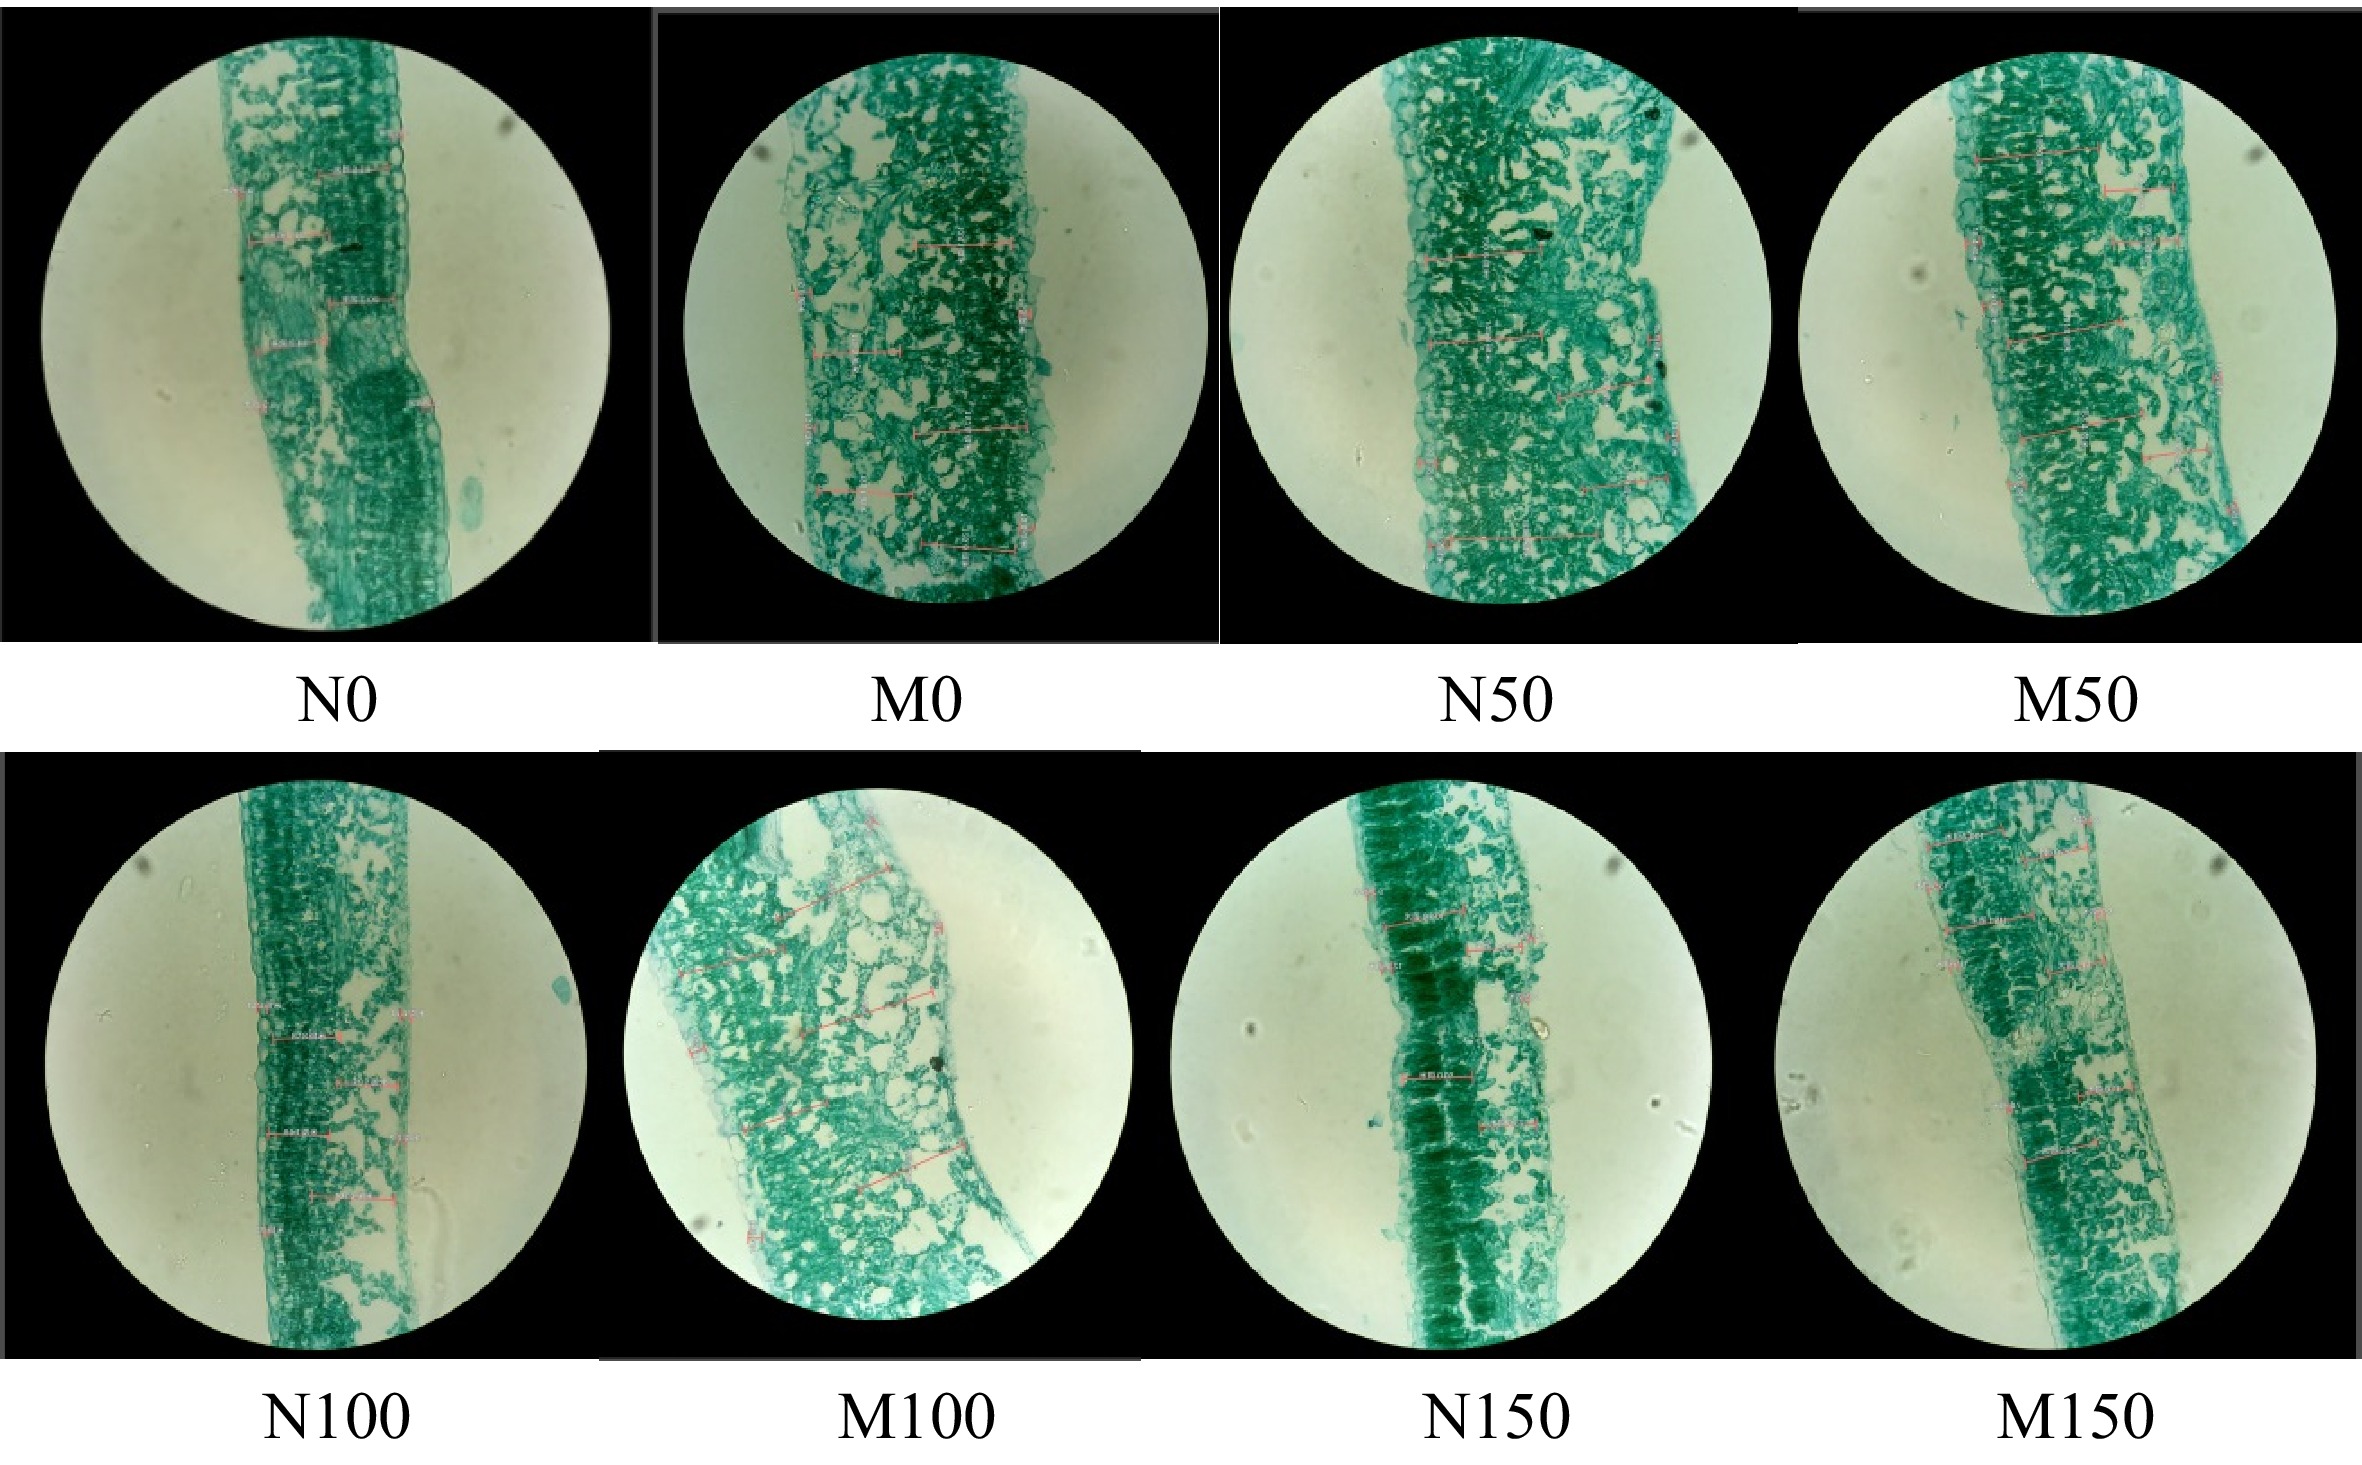
Figure 3.
Effect of AMF on the microstructure of M9-T337 leaves under saline-alkali stress. (N0) Fresh water irrigation; (M0) fresh water irrigation + AMF; (N50) 50 mM NaCl + NaHCO3; (M50) 50 mM NaCl + NaHCO3 + AMF; (N100) 100 mM NaCl + NaHCO3; (M100) 100 mM NaCl + NaHCO3 + AMF; (N150) 150 mM NaCl + NaHCO3; (M150) 150 mM NaCl + NaHCO3 + AMF.
-
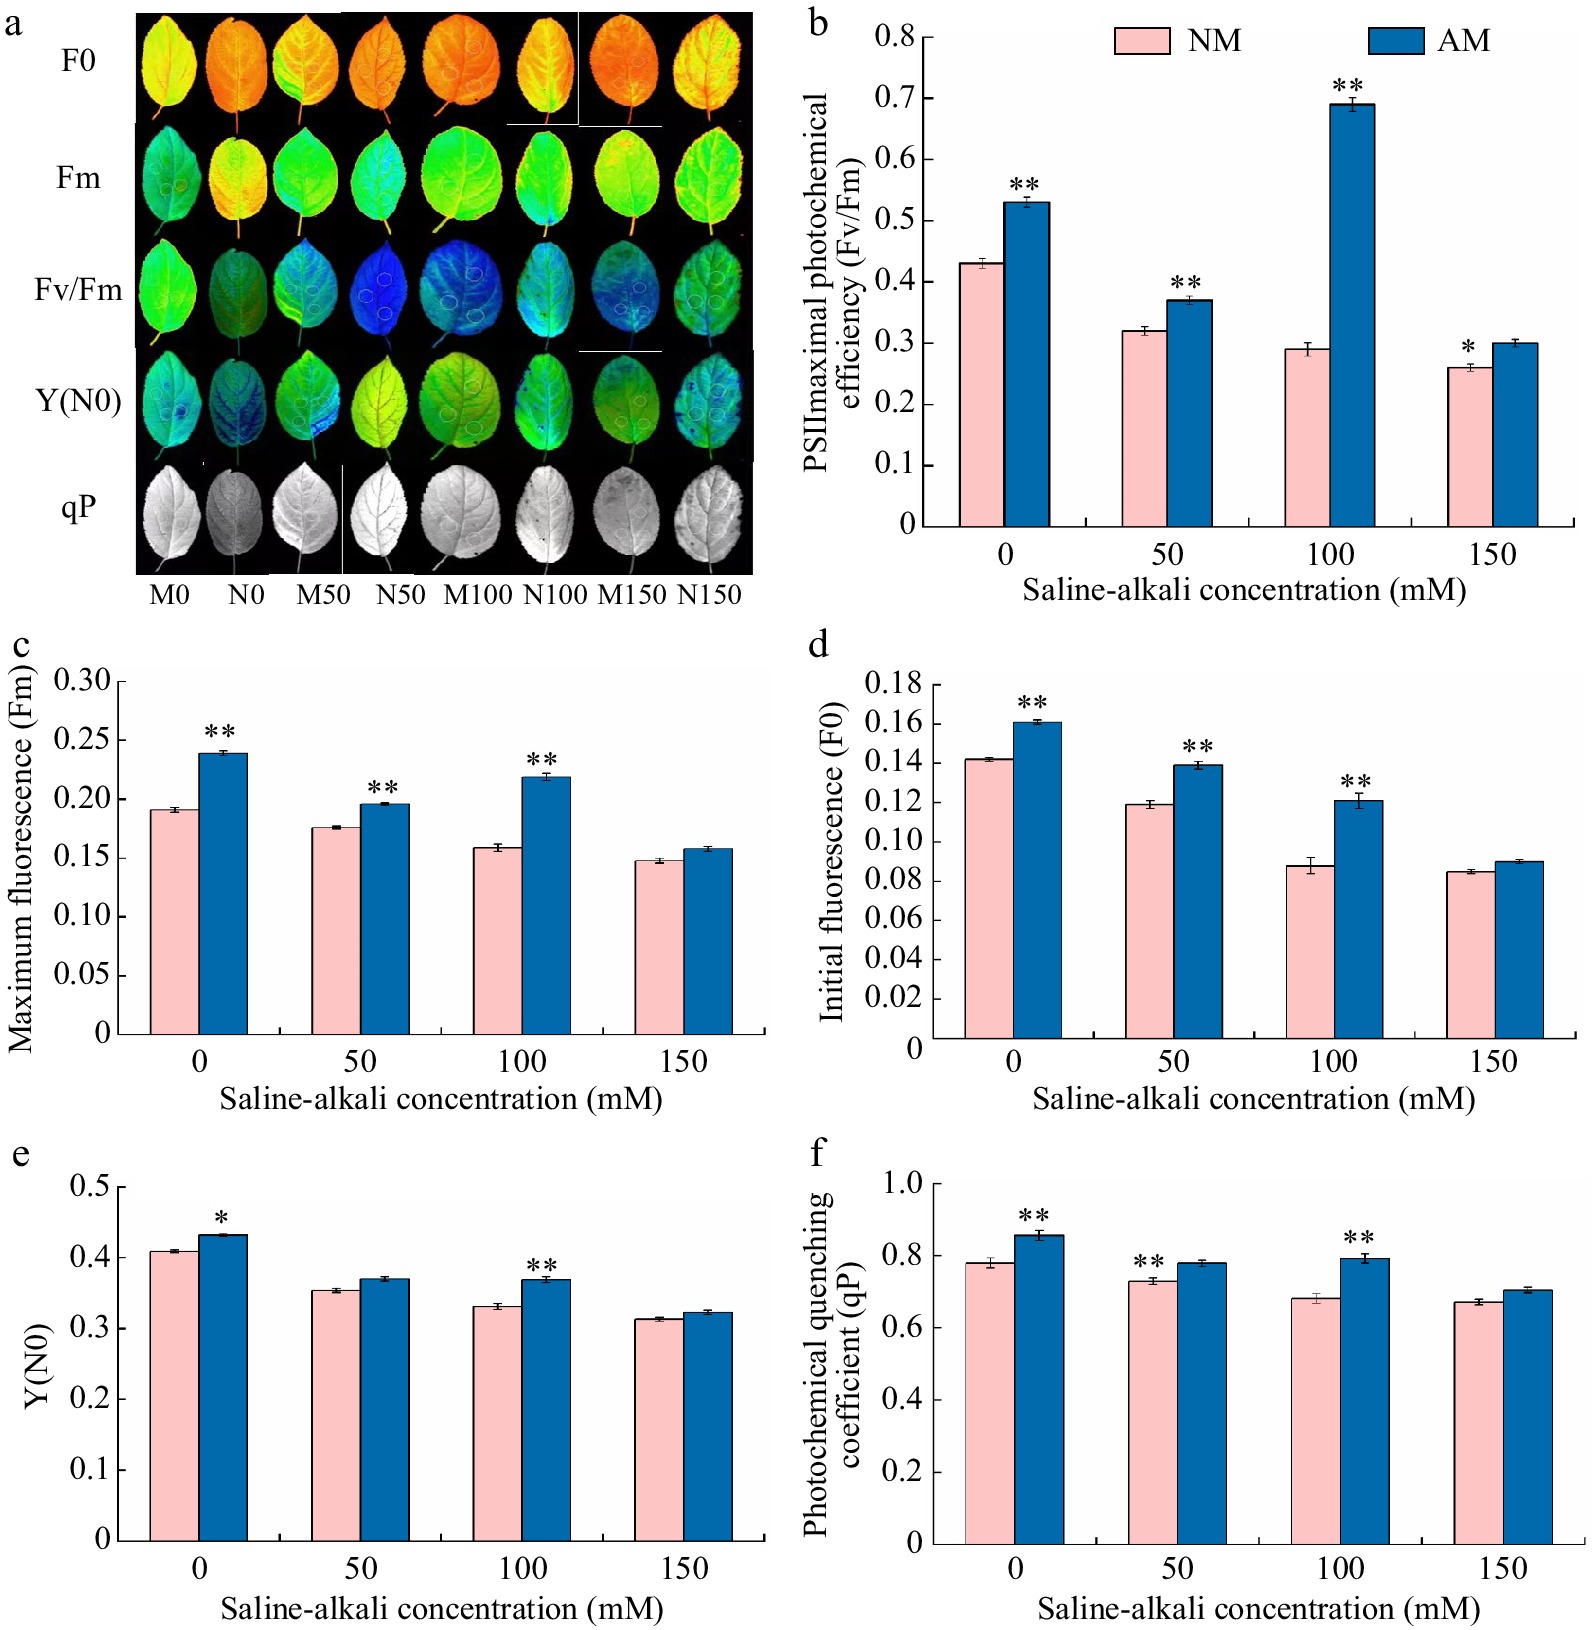
Figure 4.
Effect of AMF on fluorescence parameter of M9-T337 leaves under saline-alkali stress. NM (Inoculation with AMF); AM (Uninoculation with AMF). (a) Chlorophyll fluorescence imaging. (b) Fv/Fm, PSIImaximal photochemical efficiency. (c) Fm, maximum fluorescence. (d) F0, initial fluorescence. (d) Y(N0), quantum yield of unregulated energy dissipation. (f) qP, photochemical quenching coefficient. * Represents a significant correlation at the 0.0.5 level; ** represents a highly significant correlation at the 0.01 level (Student's t-test).
-
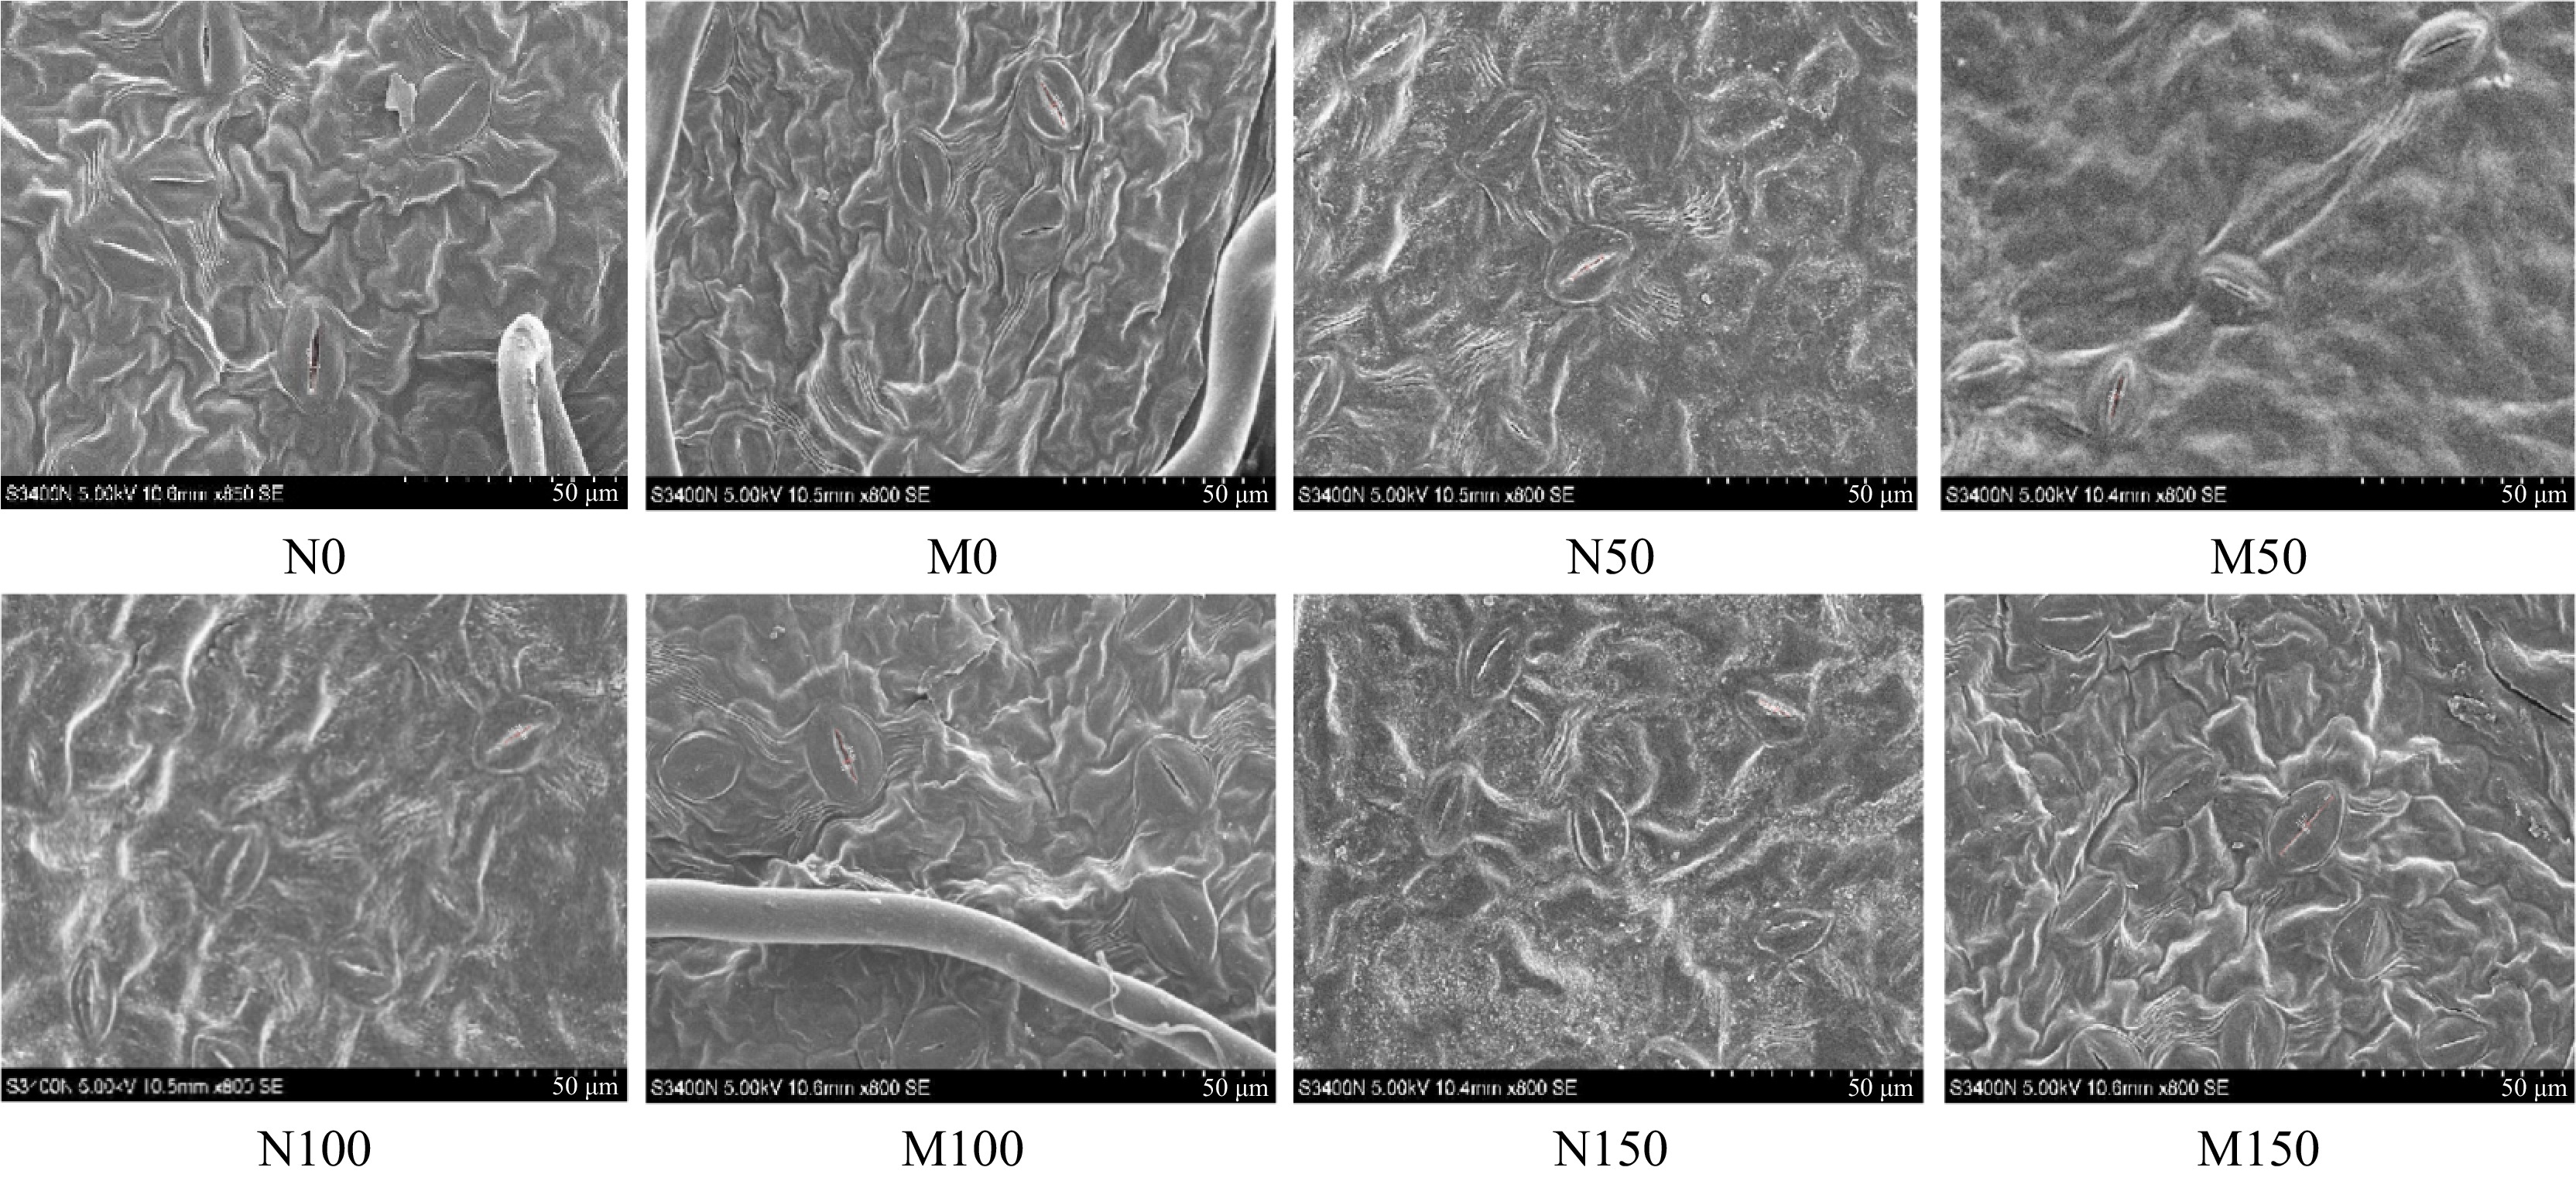
Figure 5.
Effect of AMF on stomatal morphology of M9-T337 leaves under saline-alkali stress. (N0) Fresh water irrigation; (M0) fresh water irrigation + AMF; (N50) 50 mM NaCl + NaHCO3; (M50) 50 mM NaCl + NaHCO3 + AMF; (N100) 100 mM NaCl + NaHCO3; (M100) 100 mM NaCl + NaHCO3 + AMF; (N150) 150 mM NaCl + NaHCO3; (M150) 150 mM NaCl + NaHCO3 + AMF.
-
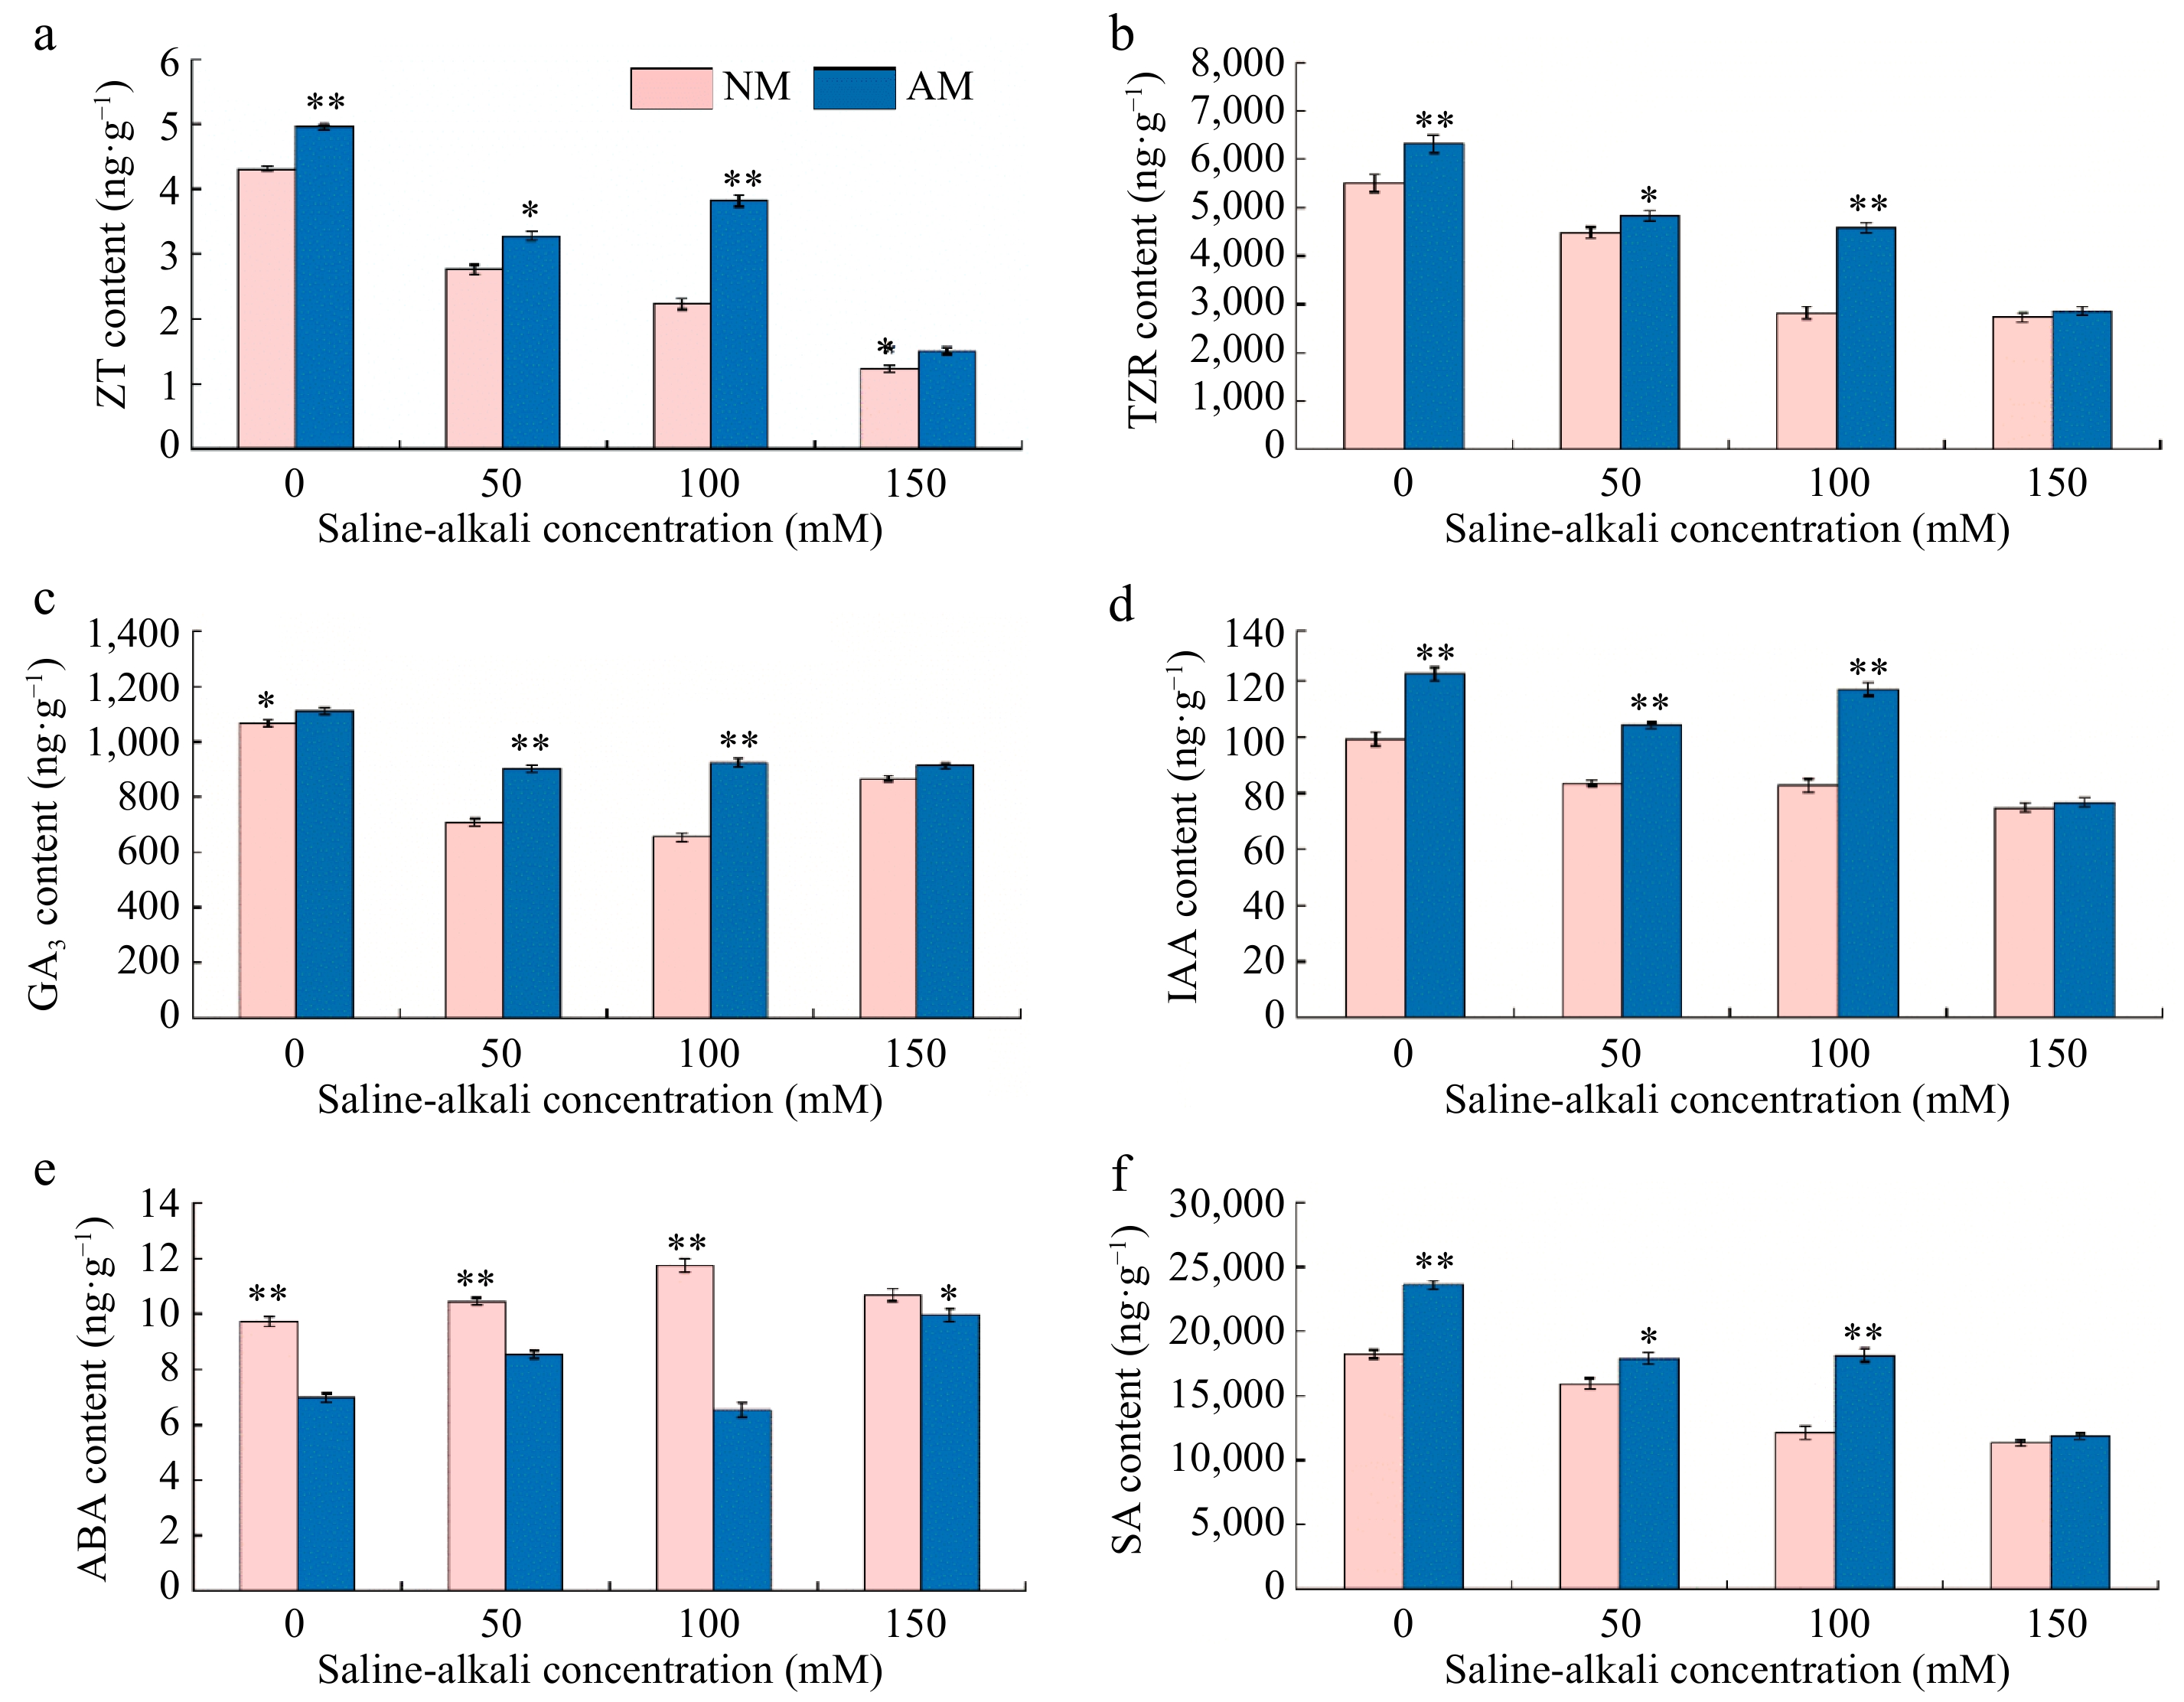
Figure 6.
Effect of AMF on endogenous hormone of M9-T337 leaves under saline-alkali stress. NM (Inoculation with AMF); AM (Uninoculation AMF). (a) Zeatin content, (b) maize kernel riboside content, (c) gibberellin content, (d) indole acetic acid content, (e) abscisic acid content, (f) salicylic acid content. * Represents a significant correlation at the 0.0.5 level; ** represents a highly significant correlation at the 0.01 level (Student's t-test).
-
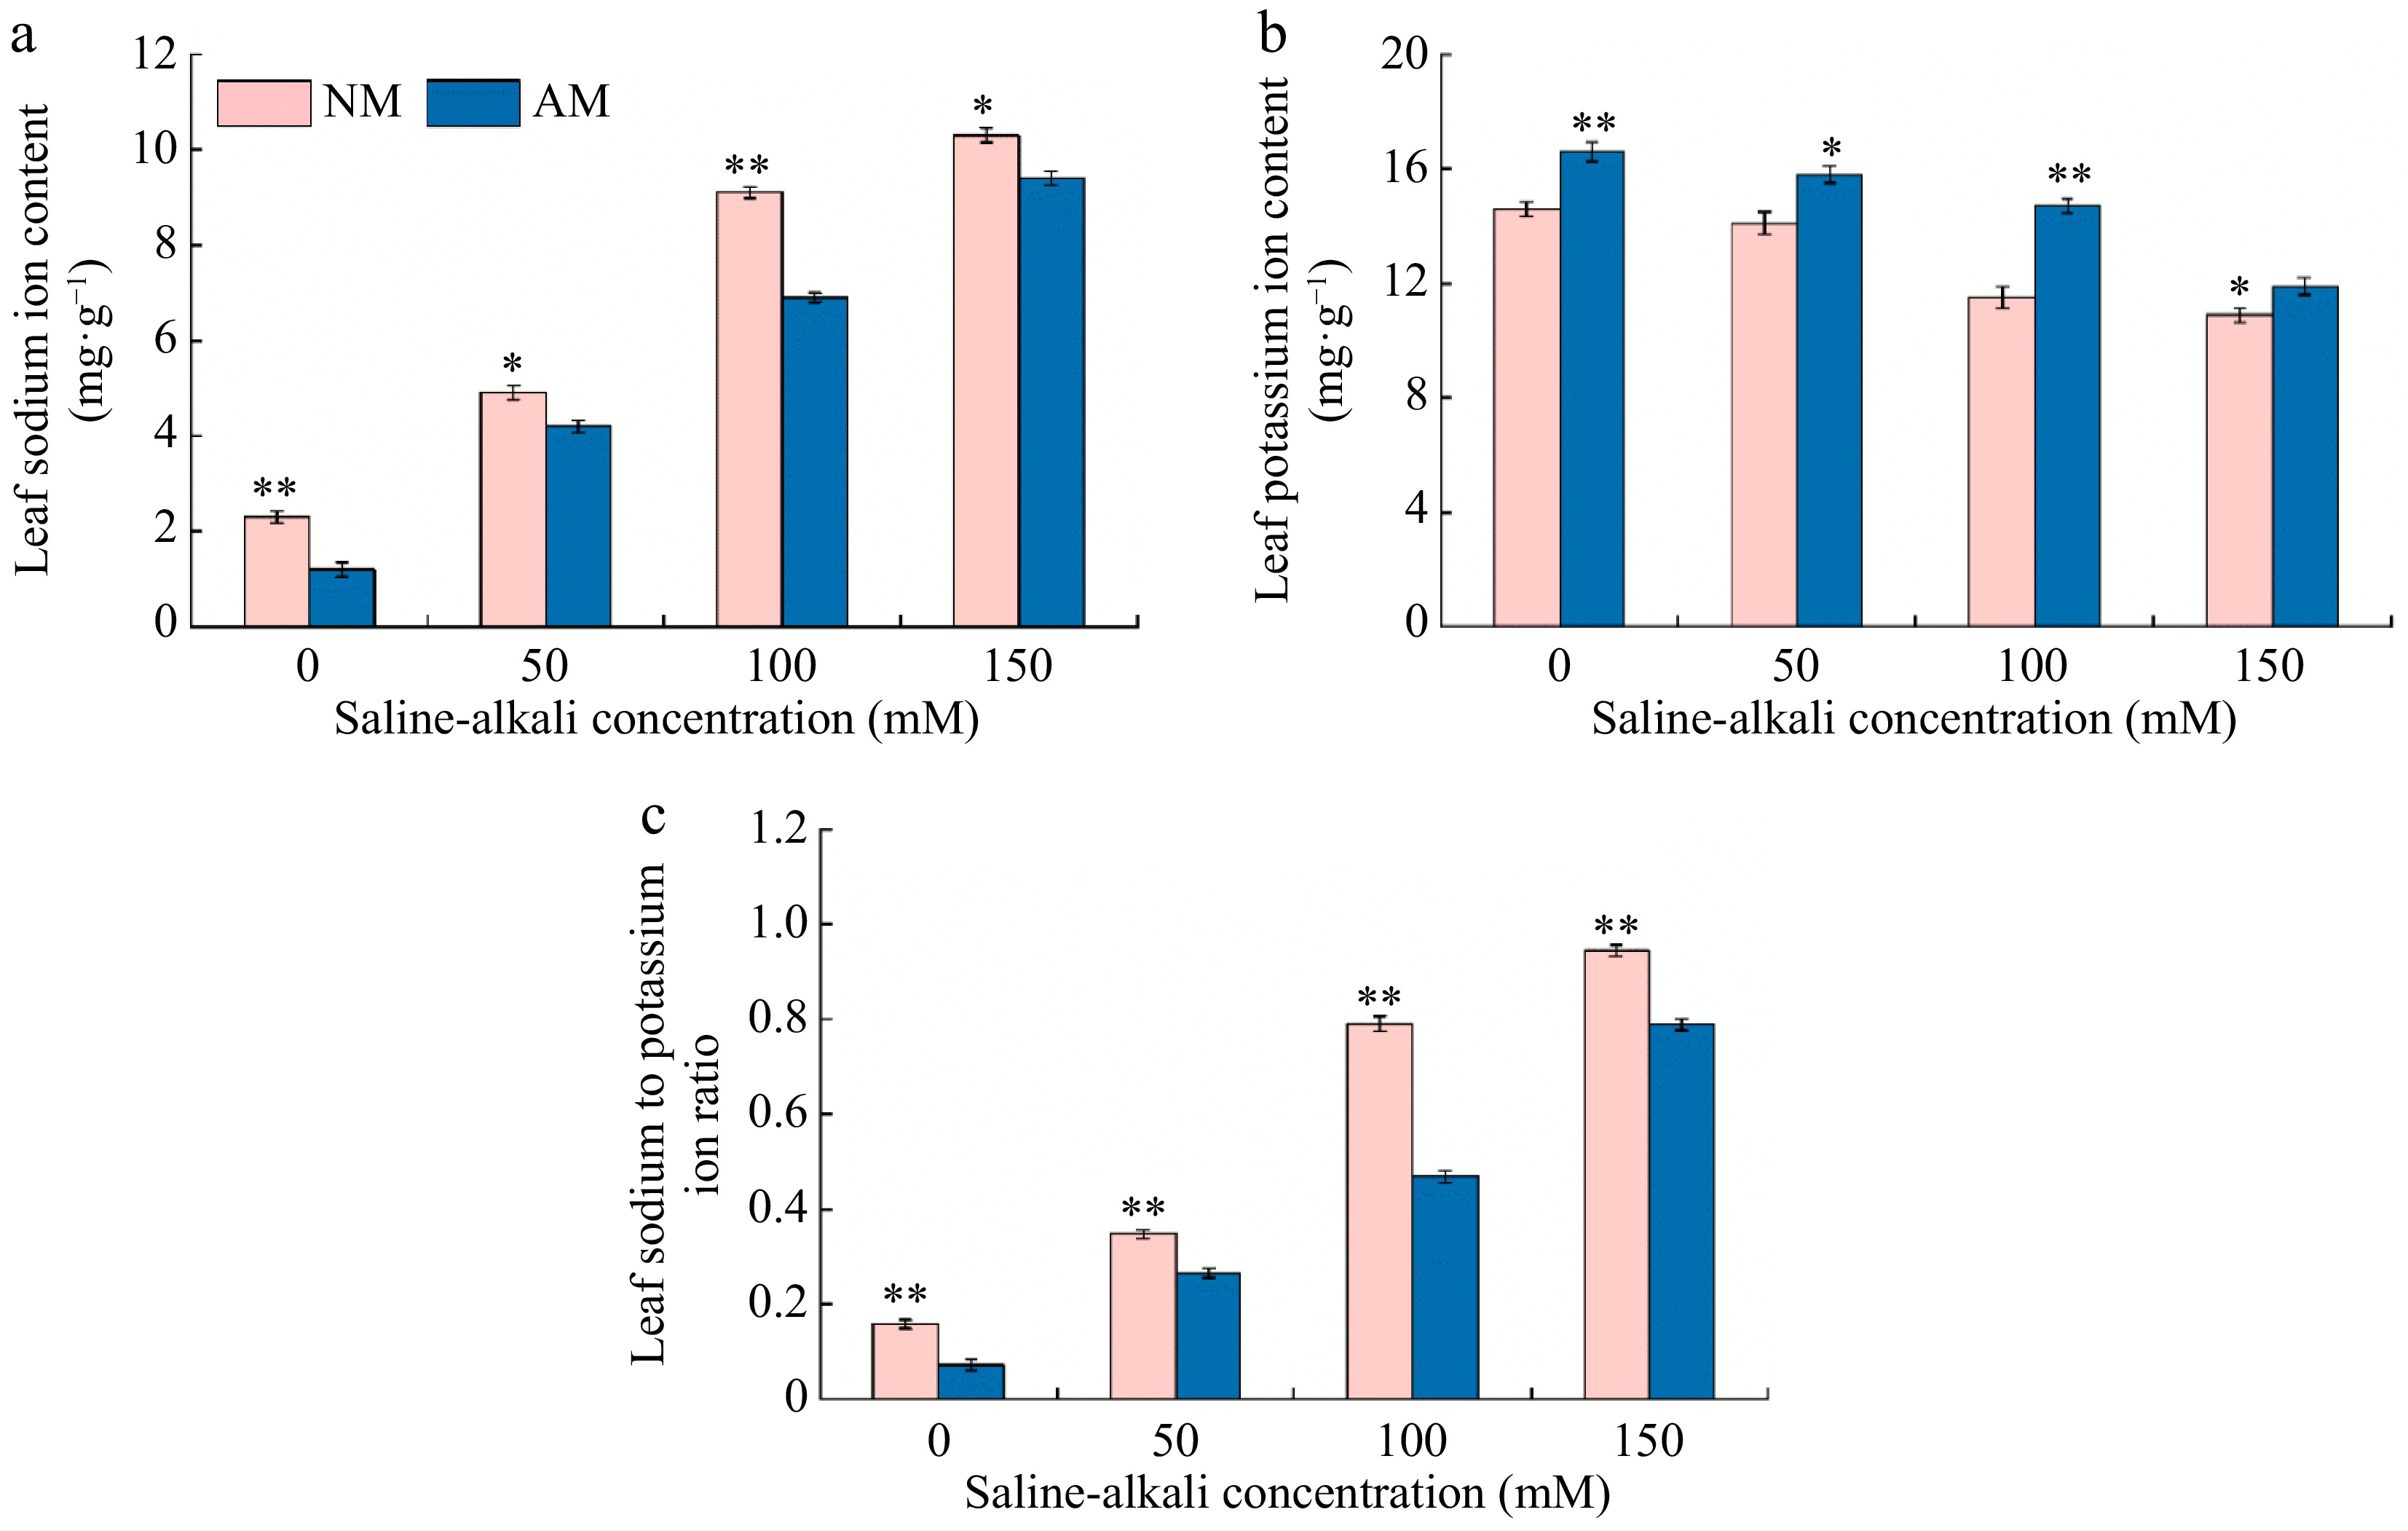
Figure 7.
Effect of AMF on changes of sodium and potassium contents of M9-T337 leaves under saline-alkali stress. NM (Inoculation with AMF); AM (Uninoculation AMF). (a) Leaf Na+ content, (b) leaf K+ content, (c) leaf Na+ /K+content. * Represents a significant correlation at the 0.0.5 level; ** represents a highly significant correlation at the 0.01 level (Student's t-test).
-
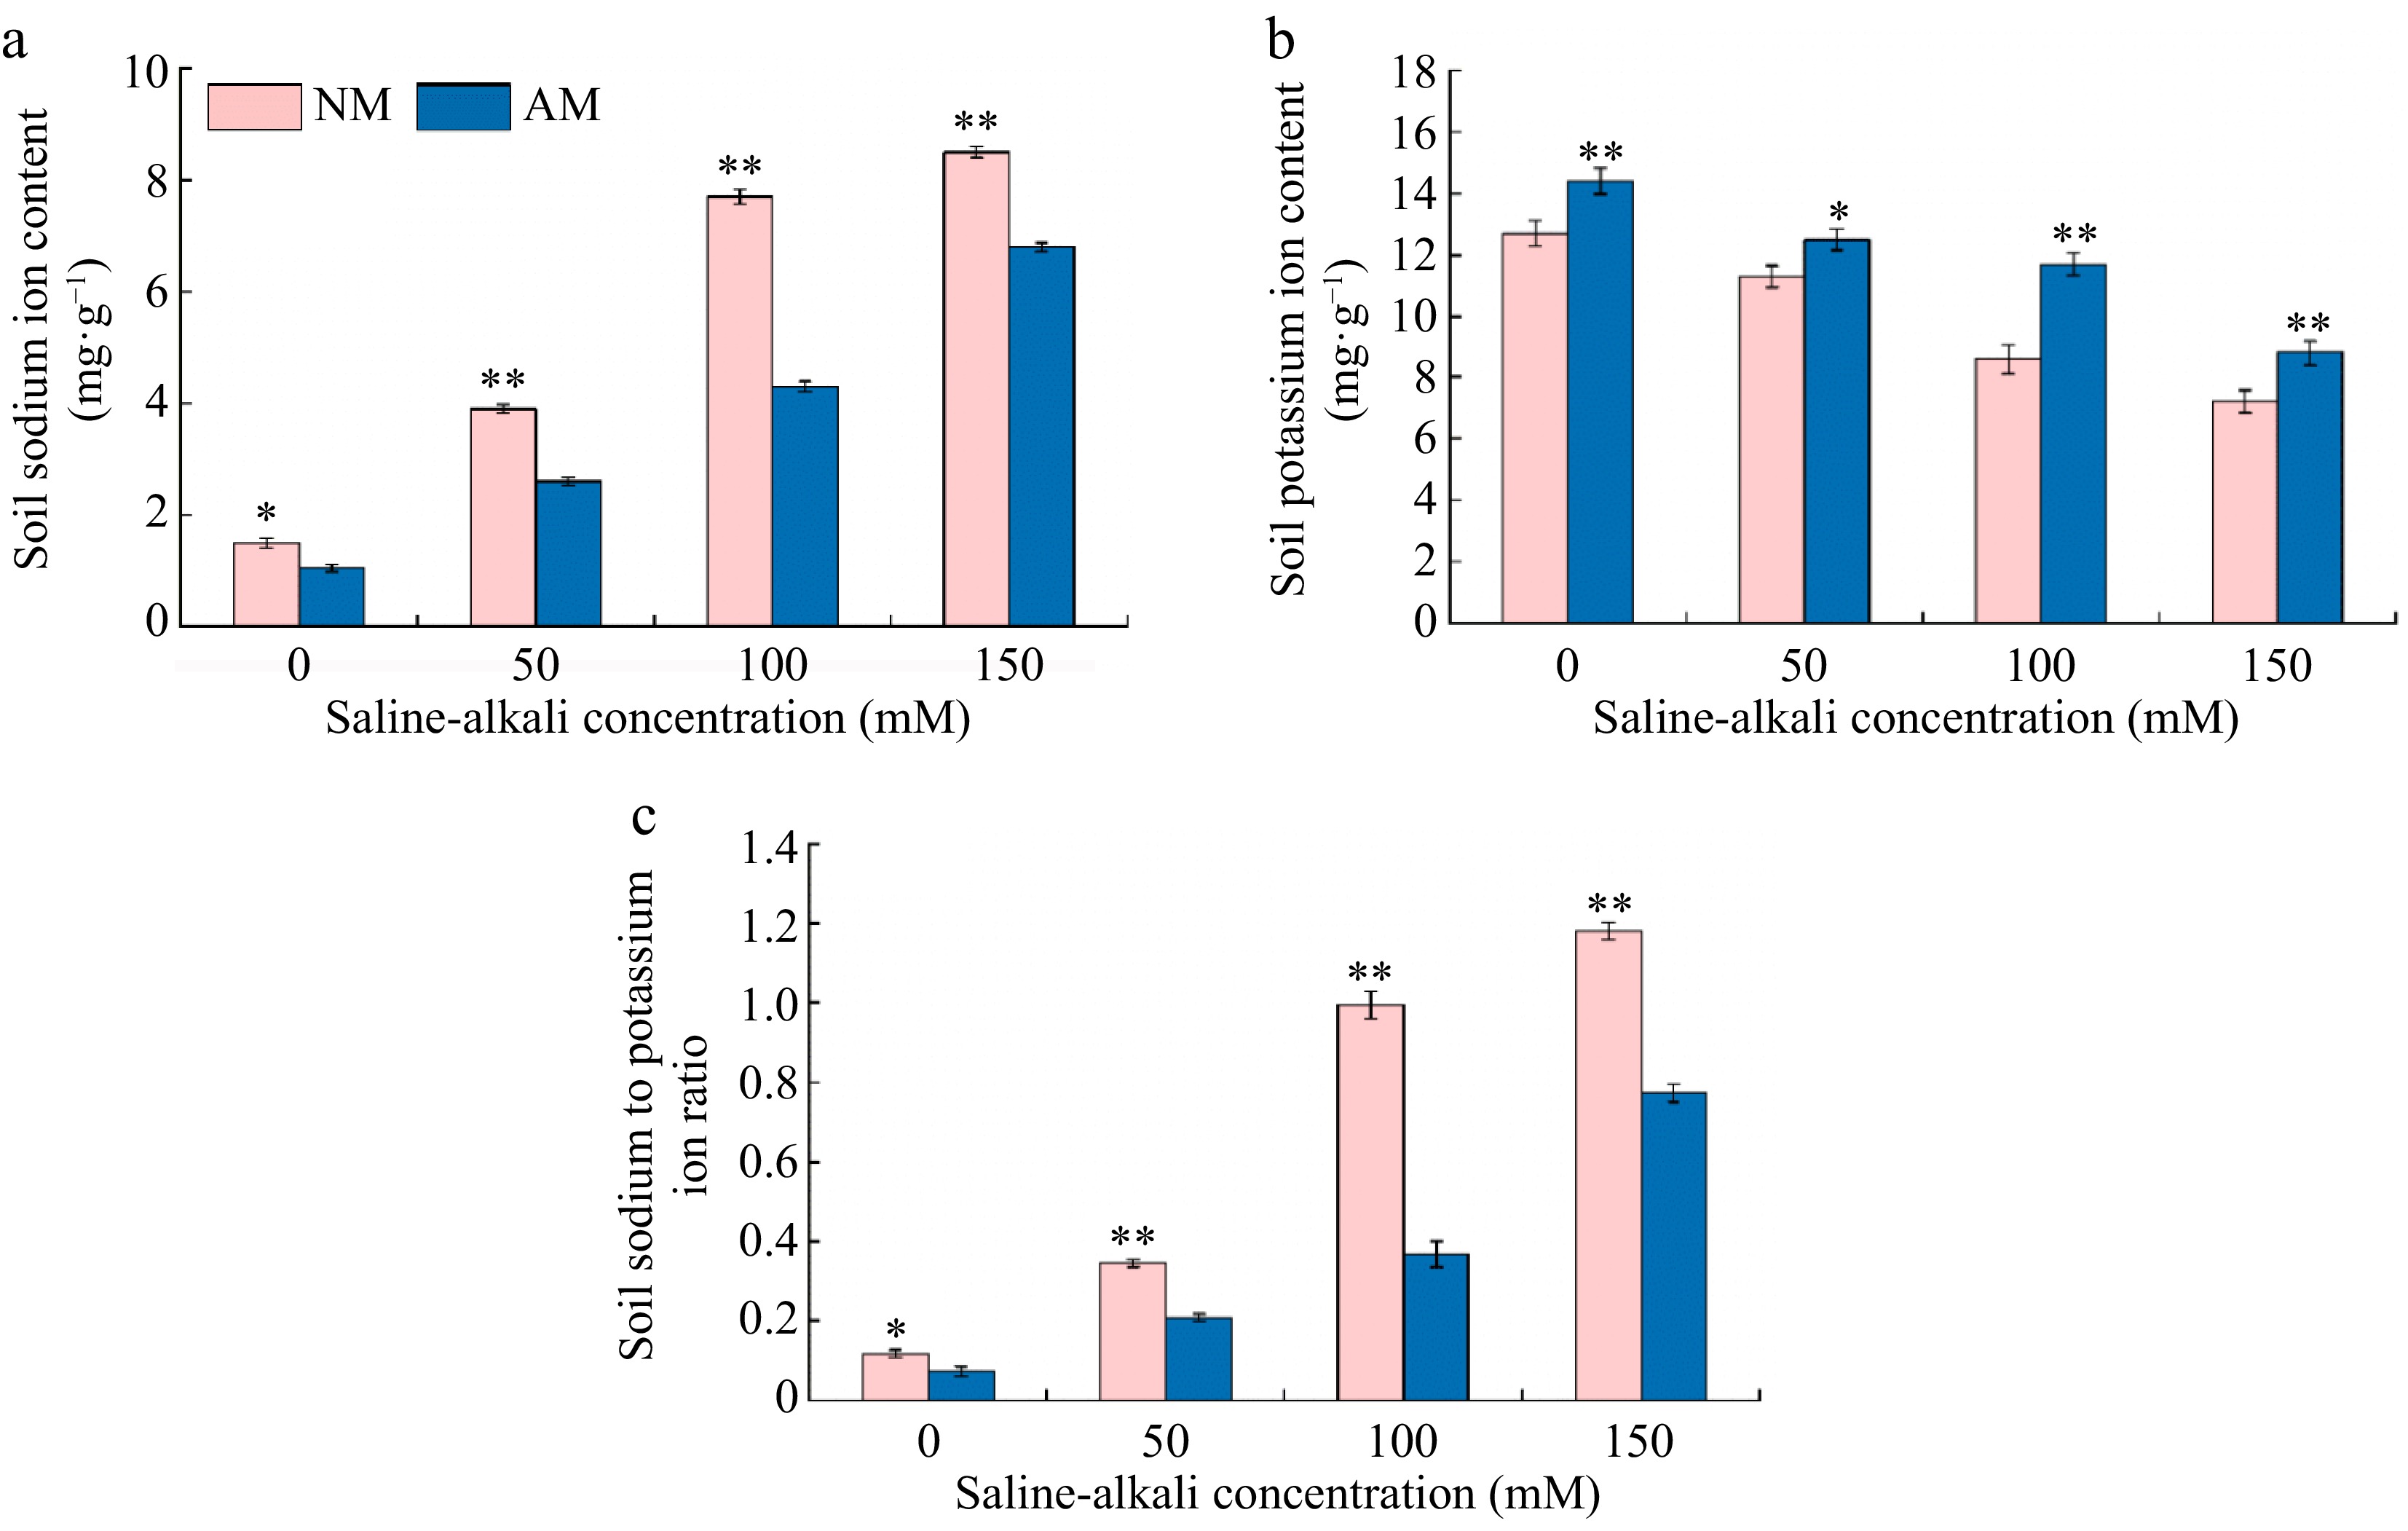
Figure 8.
Effect of AMF on changes of sodium and potassium contents of soil under saline-alkalii stress. NM (Inoculation with AMF); AM (Uninoculation AMF). (a) Soil Na+ content, (b) soil K+ content, (c) soil Na+/K+content. * Represents a significant correlation at the 0.0.5 level; ** represents a highly significant correlation at the 0.01 level (Student's t-test).
-
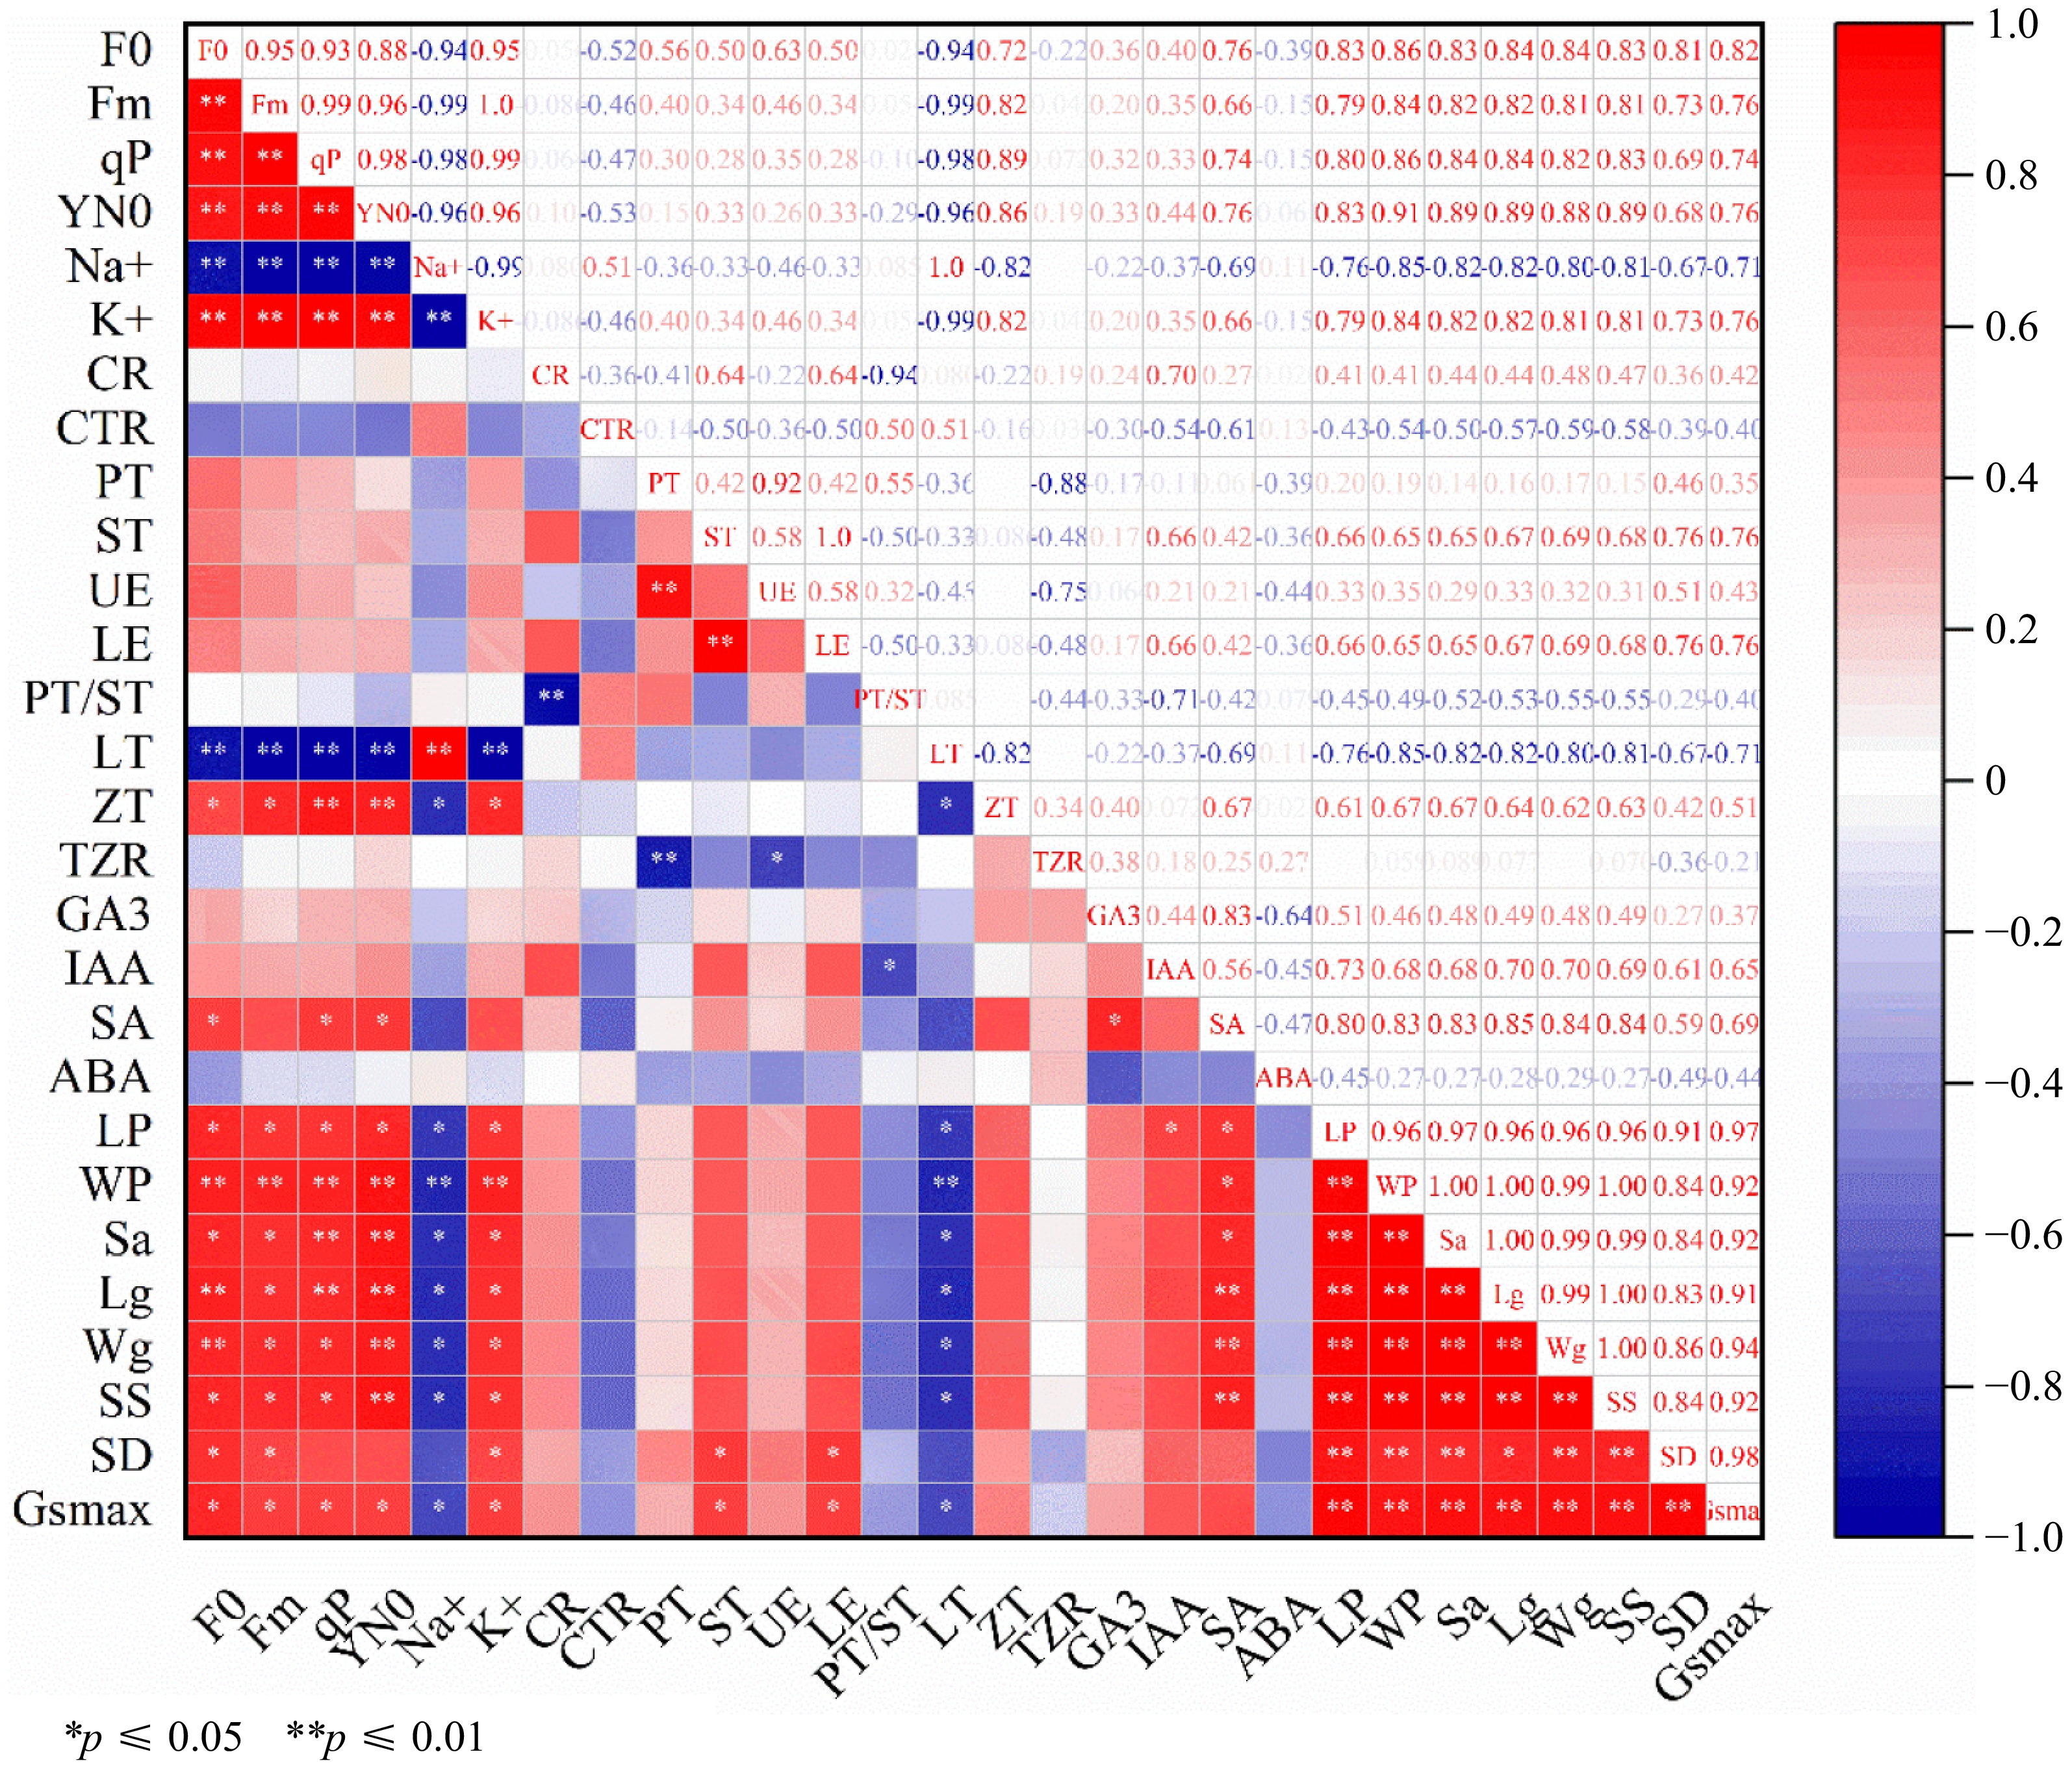
Figure 9.
Correlation analysis of AMF on physiological indexes of M9-T337 rootstock under saline-alkali stress. * Represents a significant correlation at the 0.0.5 level; ** represents a highly significant correlation at the 0.01 level.
-
Treatments Blade thickness (μm) Leaf width (μm) Leaf length (μm) Leaf area (μm) Blade perimeter (μm) Length/width M0 298.30 ± 9.87a 52.06 ± 1.88a 47.70 ± 2.22a 1907.73 ± 106.87a 652.32 ± 71.19a 0.91 ± 0.01ab N0 291.80 ± 10.14a 45.62 ± 3.56b 47.12 ± 2.67a 1433.16 ± 43.85b 529.07 ± 20.85b 1.05 ± 0.08a M50 300.10 ± 50.92a 46.47 ± 3.05ab 41.26 ± 1.33ab 1280.90 ± 206.76a 506.16 ± 11.02a 0.89 ± 0.01a N50 280.10 ± 2.93b 44.15 ± 1.46b 40.35 ± 0.83b 956.87 ± 7.74b 407.62 ± 7.42b 0.91 ± 0.04a M100 309.30 ± 28.74a 42.84 ± 2.19bc 39.27 ± 1.16a 1210.65 ± 39.82a 420.23 ± 30.11a 0.94 ± 0.07a N100 181.30 ± 14.28b 41.53 ± 0.47bcd 31.41 ± 1.82b 965.13 ± 61.19b 330.13 ± 21.95b 0.64 ± 0.01b M150 183.6 ± 18.81a 36.25 ± 1.63ab 45.38 ± 1.77a 943.76 ± 32.43ab 459.74 ± 51.02a 1.25 ± 0.17a N150 178.10 ± 12.39a 37.26 ± 3.44a 35.78 ± 2.38b 971.73 ± 26.19a 329.27 ± 20.34b 0.96 ± 0.13b (M0) Fresh water irrigation + AMF; (N0) fresh water irrigation; (M50) 50 mM NaCl + NaHCO3 + AMF; (N50) 50 mM NaCl + NaHCO3; (M100) 100 mM NaCl + NaHCO3 + AMF; (N100) 100 mM NaCl + NaHCO3; (M150) 150 mM NaCl + NaHCO3 + AMF; (N150) 150 mM NaCl + NaHCO3. Different lowercase letters in the same column indicate significant difference at the 0.05 level. Table 1.
Effects of AMF on phenotype 0f M9-T337 leaves under saline-alkali stress.
-
Treatments Thickness of leaf (μm) Upper skin thickness (μm) Lower skin thickness (μm) Thickness of palisade (μm) Thickness of spongy (μm) Cell tightness rate (CTR,%) Scattered rate (CR,%) PT/ST M0 275.30 ± 9.97a 16.10 ± 0.92a 16.45 ± 3.61a 135.80 ± 14.53a 122.30 ± 8.20a 44.02 ± 1.84a 44.42 ± 2.98ab 0.89 ± 0.03n N0 204.30 ± 10.32b 12.90 ± 0.99b 7.60 ± 1.27b 82.95 ± 3.75b 93.55 ± 6.86b 40.60 ± 6.29b 45.79 ± 2.11a 1.14 ± 0.07a M50 304.70 ± 52.96a 22.50 ± 0.42a 15.15 ± 1.06a 162.90 ± 25.57a 116.40 ± 7.50a 53.46 ± 2.57b 38.20 ± 2.46a 1.78 ± 0.03a N50 281.10 ± 2.97b 21.20 ± 3.96ab 10.90 ± 0.57b 159.07 ± 6.33a 87.57 ± 2.64b 56.59 ± 9.67a 31.15 ± 1.21b 1.28 ± 0.05b M100 305.30 ± 29.41a 19.90 ± 1.84a 11.85 ± 3.61a 135.10 ± 18.24a 171.80 ± 17.68a 44.25 ± 6.08a 56.27 ± 8.03a 0.92 ± 0.13a N100 190.70 ± 14.35b 11.40 ± 3.54b 8.95 ± 1.20b 83.95 ± 5.44b 93.65 ± 19.73b 44.02 ± 5.98a 49.11 ± 10.34b 0.83 ± 0.07b M150 184.30 ± 18.88a 10.67 ± 3.33a 8.85 ± 1.06a 104.17 ± 9.68a 76.77 ± 7.32a 56.52 ± 5.38b 41.65 ± 4.11a 1.24 ± 0.01a N150 181.40 ± 12.94a 11.05 ± 2.47a 7.45 ± 1.06b 97.90 ± 9.76ab 73.40 ± 0.71a 53.97 ± 14.46b 40.46 ± 0.39ab 1.16 ± 0.03a (M0) Fresh water irrigation + AMF; (N0) fresh water irrigation; (M50) 50 mM NaCl + NaHCO3 + AMF; (N50) 50 mM NaCl + NaHCO3; (M100) 100 mM NaCl + NaHCO3 + AMF; (N100) 100 mM NaCl + NaHCO3; (M150) 150 mM NaCl + NaHCO3 + AMF); (N150) 150 mM NaCl + NaHCO3. Different lower case letters in the same column indicate significant difference at the 0.05 level. Table 2.
Effect of AMF on the microstructure of M9-T337 leaves under saline-alkali stress.
-
Treaments Lp (μm) Wp (μm) Lg (μm) Wg (μm) SD (mm2) SS (μm2) Sa (μm2) Gsmax (μm3) N0 14.99 ± 0.32a 2.19 ± 0.44a 25.94 ± 0.98a 18.88 ± 0.67a 218.72 ± 2.44b 358.68 ± 43.54ab 25.77 ± 6.10a 1.35 ± 0.87b M0 15.03 ± 0.33a 2.27 ± 0.48a 25.99 ± 1.00a 19.43 ± 0.72a 274.93 ± 9.31a 369.63 ± 64.56a 26.78 ± 6.67a 1.7 ± 0.96a N50 11.70 ± 0.44a 1.11 ± 0.09ab 21.43 ± 0.10ab 15.32 ± 0.46ab 201.38 ± 9.11ab 247.53 ± 38.23b 10.19 ± 4.13a 0.99 ± 0.67ab M50 12.1 ± 0.16a 1.36 ± 0.05a 22.76 ± 0.20a 16.83 ± 0.45a 218.94 ± 7.67a 287.78 ± 35.63a 12.92 ± 4.51a 1.12 ± 0.7a N100 10.24 ± 0.54b 0.83 ± 0.09b 20.68 ± 0.68b 15.18 ± 0.09b 166.58 ± 9.1b 239.76 ± 29.79b 6.67 ± 2.89b 0.73 ± 0.54b M100 14.86 ± 0.61a 1.99 ± 0.21a 25.23 ± 0.22a 18.65 ± 0.75a 270.33 ± 9.14a 346.16 ± 54.44a 23.21 ± 4.99a 1.66 ± 0.99a N150 9.16 ± 0.81b 0.60 ± 0.72ab 19.84 ± 0.66ab 14.21 ± 1.33ab 121,43 ± 9.49b 216.99 ± 25.59ab 4.31 ± 2.23ab 0.49 ± 0.42b M150 11.77 ± 0.69a 0.80 ± 0.07a 20.49 ± 0.68a 15.21 ± 0.10a 206.85 ± 7.23a 237.26 ± 30.04a 7.39 ± 3.77a 1.03 ± 0.52a (M0) Fresh water irrigation + AMF; (N0) fresh water irrigation; (M50) 50 mM NaCl + NaHCO3 + AMF; (N50) 50 mM NaCl + NaHCO3; (M100) 100 mM NaCl + NaHCO3 + AMF; (N100) 100 mM NaCl + NaHCO3; (M150) 150 mM NaCl + NaHCO3 + AMF); (N150) 150 mM NaCl + NaHCO3. Different lower case letters in the same column indicate significant difference at the 0.05 level. Table 3.
Effect of AMF on stomatal morphology of M9-T337 leaves under saline-alkali stress.
-
Idex Eigen value Proportion of variance (%) Cumulative variance (%) PC1 16.656 86.711 86.711 PC2 4.917 9.732 96.443 PC1−2 respectively principal component 1−2. Table 4.
Total variance explained.
-
Treatments Principal component score Comprehensive
score (F)Comprehensive
score rankingPC1 (F1) PC2 (F2) N0 1.04054 1.43068 1.041496 3 M0 1.26879 1.23858 1.220719 1 N50 −0.2474 1.50243 −0.068310 5 M50 0.38632 1.18549 0.450354 4 N100 −0.95254 −0.65578 −0.889780 7 M100 1.22317 0.43467 1.102925 2 N150 −1.40833 −0.3609 −1.256300 8 M150 −0.81908 −0.24448 −0.734030 6 (M0) Fresh water irrigation + AMF; (N0) fresh water irrigation; (M50) 50 mM NaCl + NaHCO3 + AMF; (N50) 50 mM NaCl + NaHCO3; (M100) 100 mM NaCl + NaHCO3 + AMF; (N100) 100 mM NaCl + NaHCO3; (M150) 150 mM NaCl + NaHCO3 + AMF); (N150) 150 mM NaCl + NaHCO3. Different lower case letters in the same column indicate significant difference at the 0.05 level. Table 5.
Comprehensive score ranking of M9-T337 seedling leaves under different treatments.
Figures
(9)
Tables
(5)