-
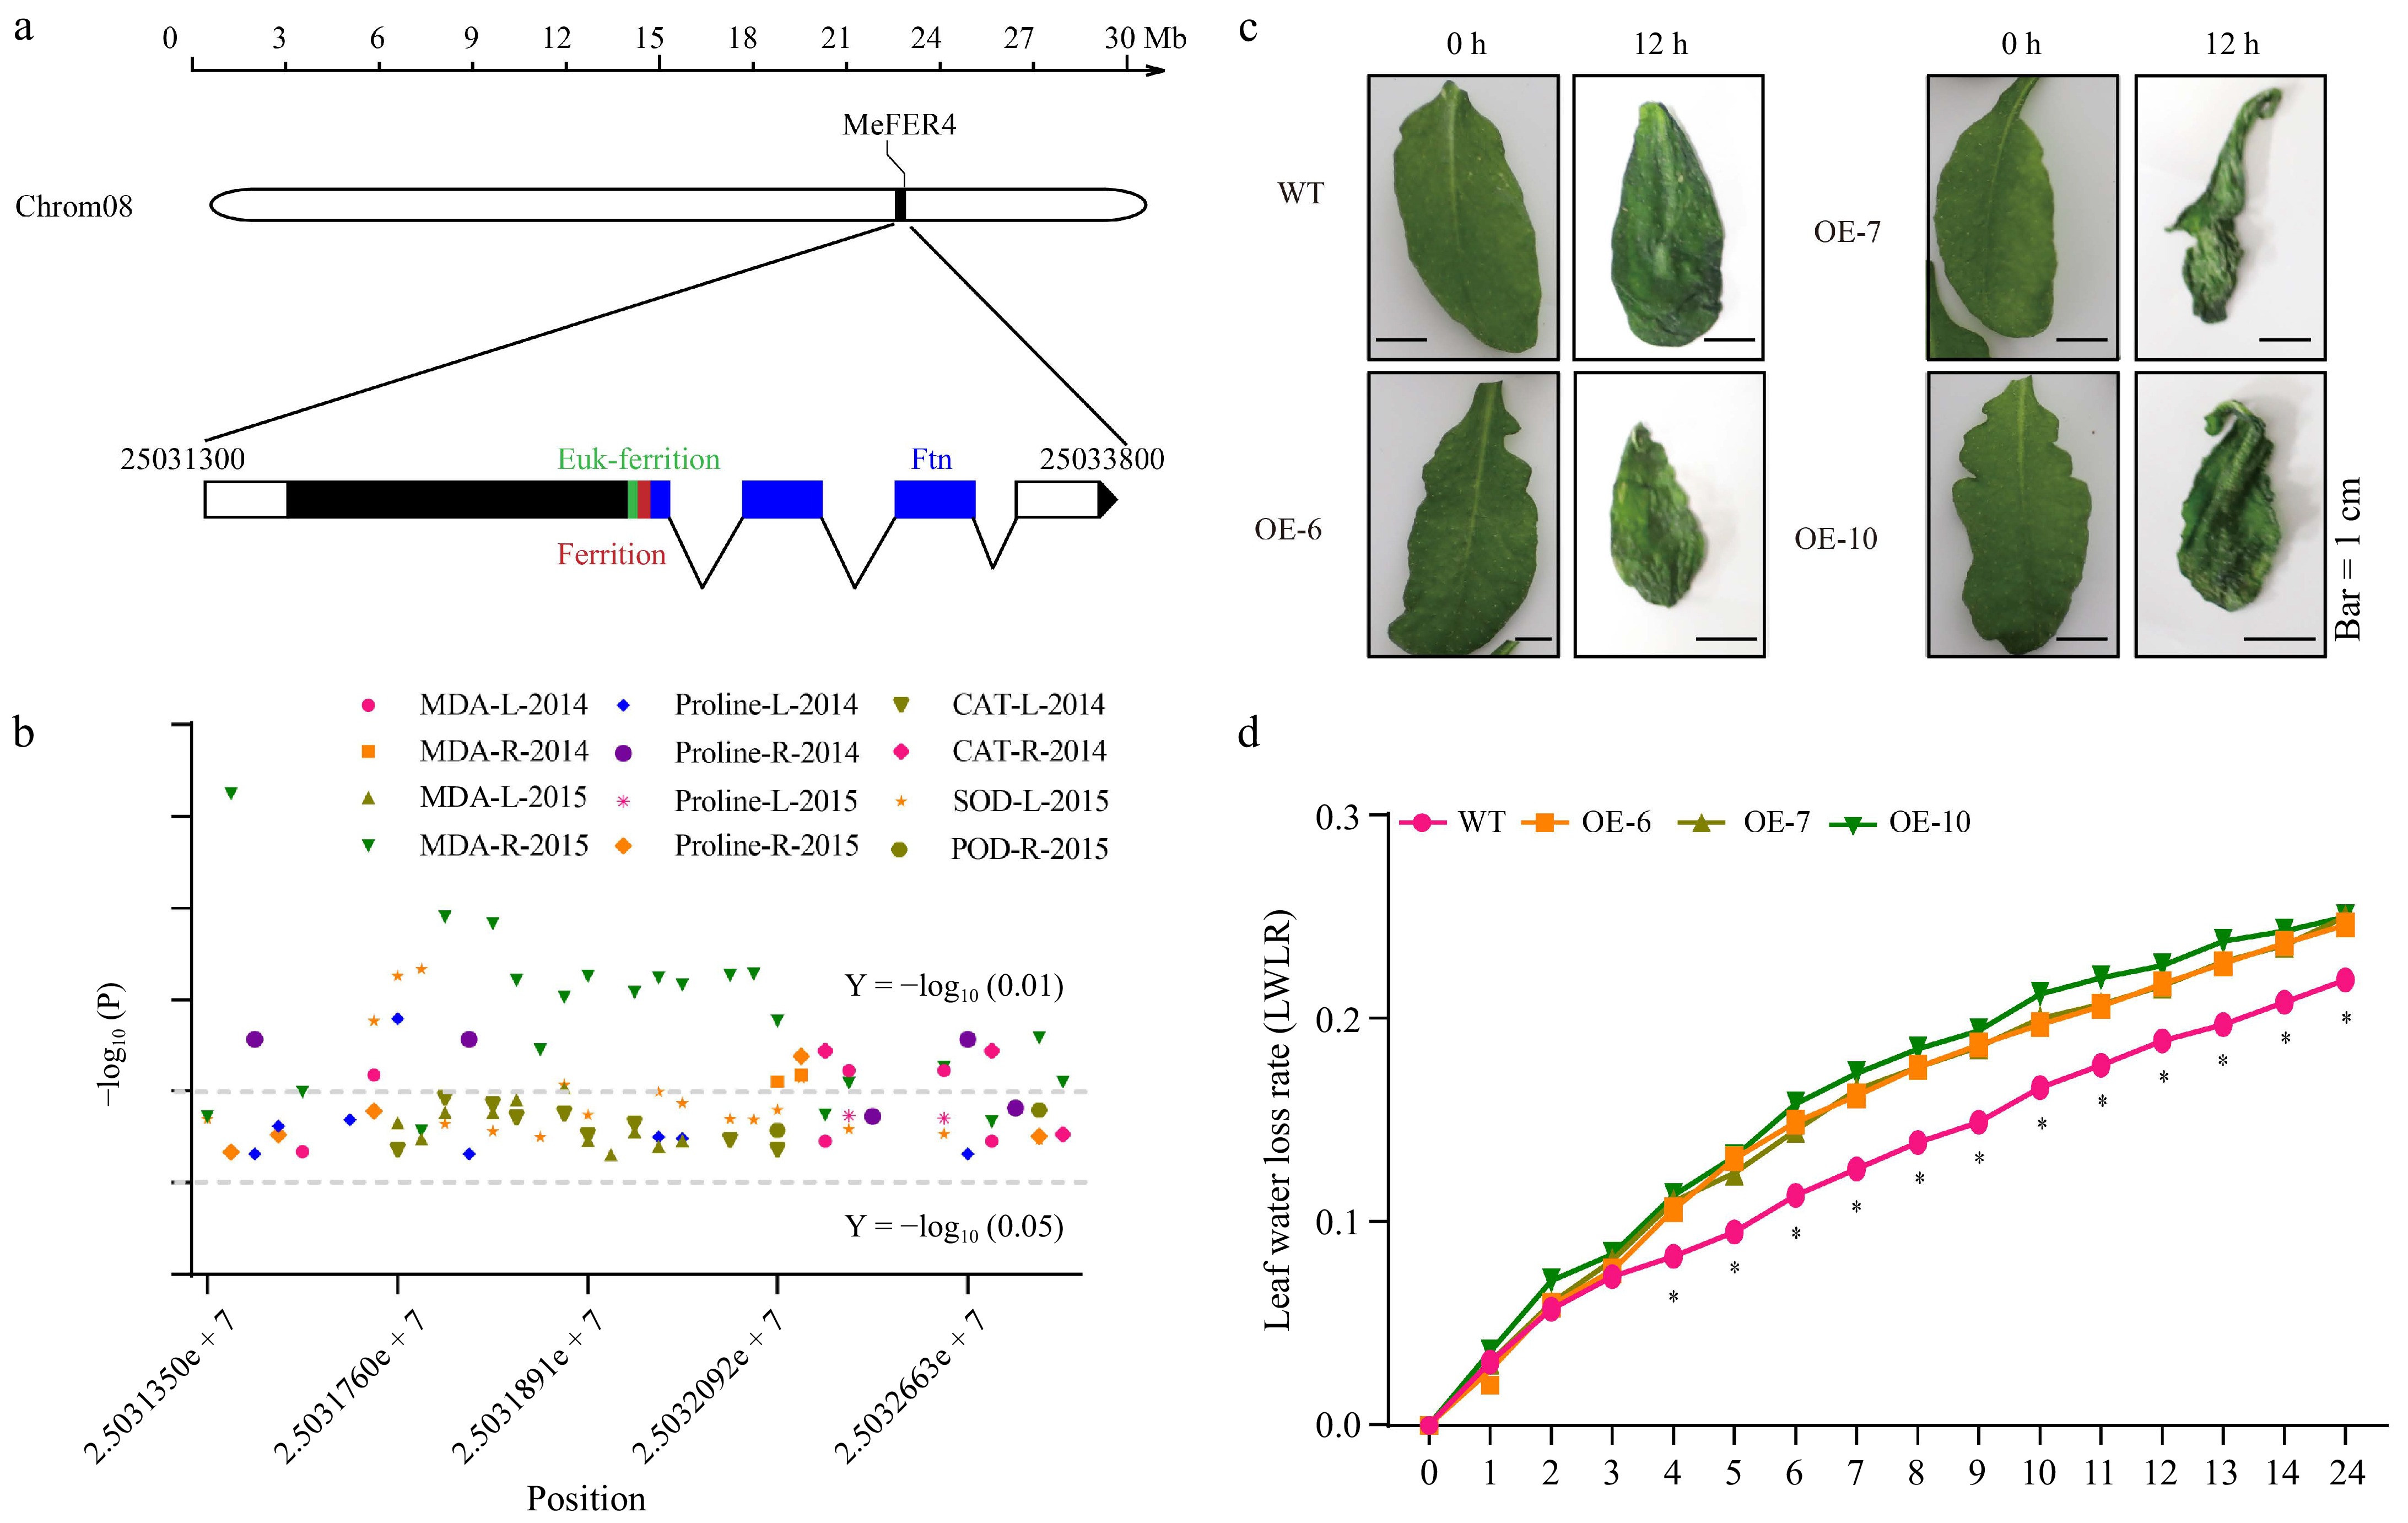
Figure 1.
MeFER4 is associated with drought-related physiological traits in cassava cultivars under drought stress. (a) Schematic diagram of the MeFER4 locus in the cassava genome (version 08). (b) SNPs in the MeFER4 Coding Sequence (CDS) region are correlated with drought-related trait coefficients, including MAD (MDA-L-2014, MDA-R-2014, MDA-L-2015, MDA-R-2015), proline (Proline-L-2014, Proline-R-2014, Proline-L-2015, Proline-R-2015), catalase (CAT-L-2014, CAT-R-2014), superoxide dismutase (SOD-L-2015), and peroxidase (POD-R-2015) in 100 cultivated cassava germplasms under drought stress. Horizontal lines represent significance thresholds at Y = −log10(0.01) and Y = −log10(0.05). (c) MeFER4 affects the water retention capacity of Arabidopsis leaves. (d) Water loss rate of detached leaves within 24 h. Asterisks indicate significant differences from wild-type plants, determined by Student's t-test (* p < 0.05).
-
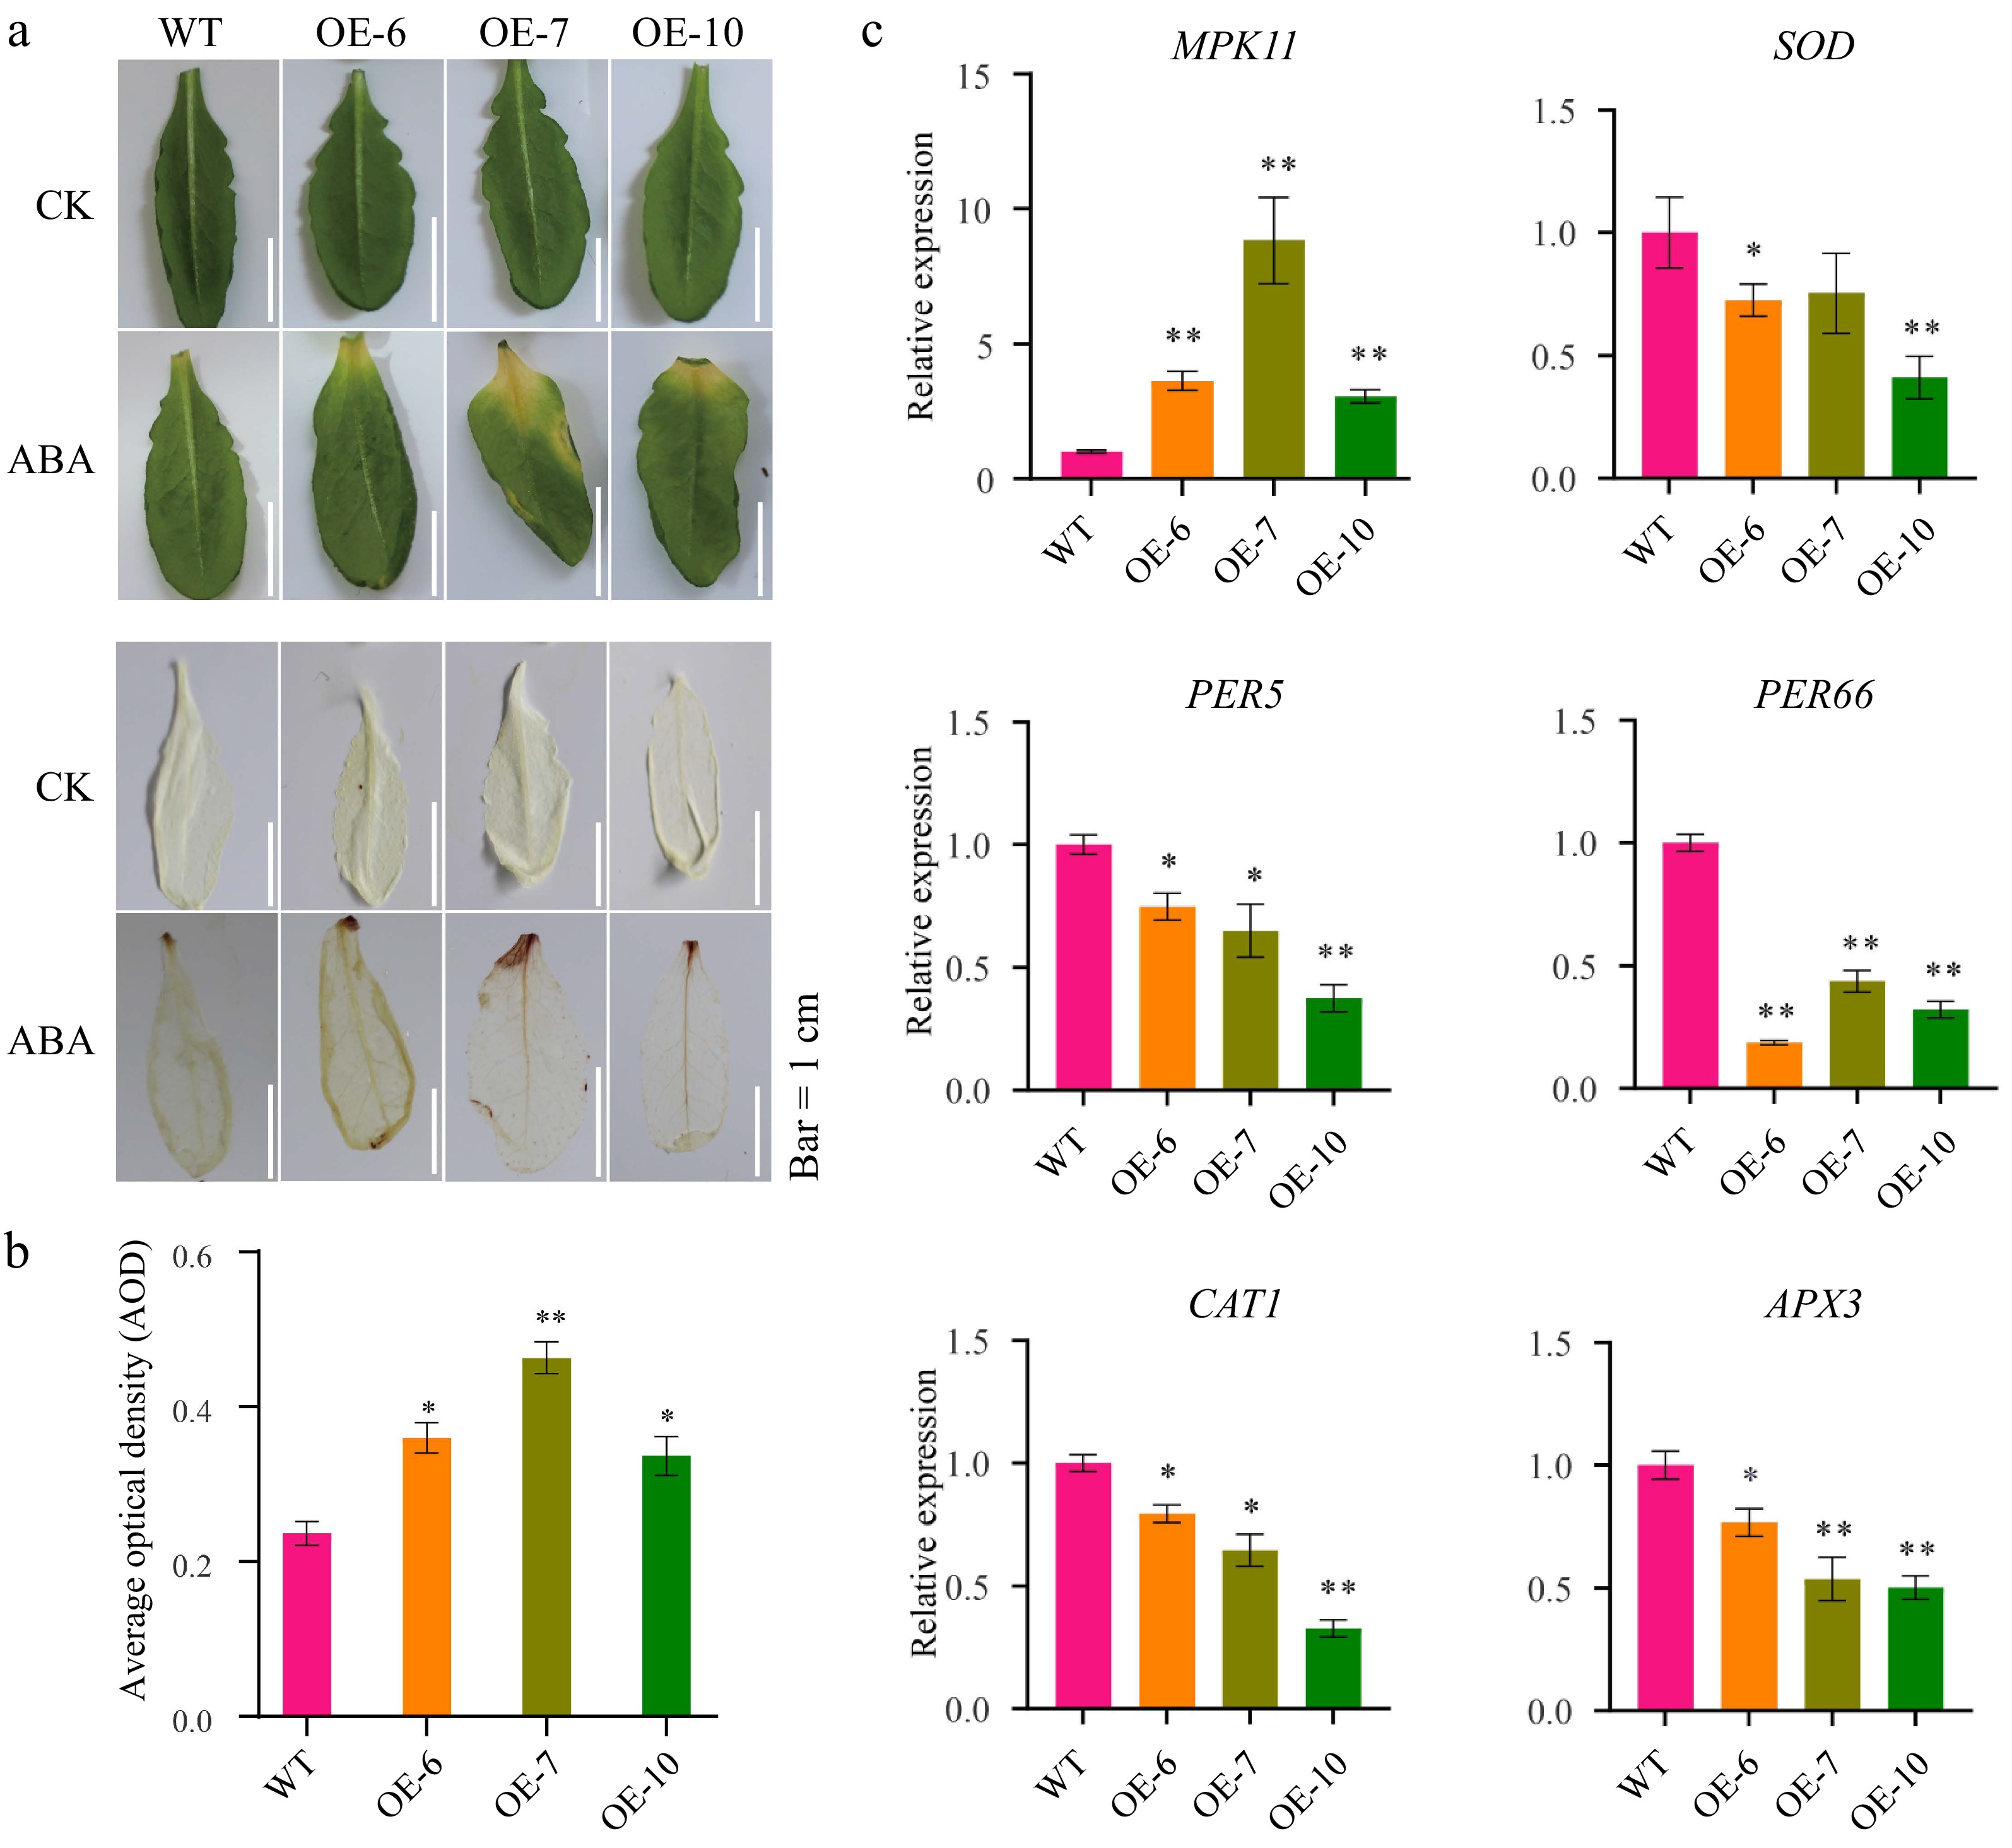
Figure 2.
MeFEE4 transcription level enhances ABA sensitivity and regulates the expression of stress-responsive genes in Arabidopsis. (a) Phenotypic differences in wild-type and MeFER4-overexpressing Arabidopsis lines (OE-6, OE-7, OE-10) under control (CK), and ABA treatment conditions. Top: Leaf coloration and phenotype under CK and ABA treatment. Bottom: DAB staining for ROS accumulation in wild-type and transgenic lines, indicating oxidative stress under ABA treatment. Scale bar = 1 cm. (b) Quantification of ROS accumulation by average optical density in DAB-stained leaves under ABA treatment. Data represent means ± SD (n = 3). Asterisks indicate significant differences compared to wild-type plants (* p < 0.05, ** p < 0.01). (c) Relative expression levels of stress-responsive genes, including MPK11, SOD, CAT1, PER5, PER66, and APX3, in wild-type and MeFER4-overexpressing lines under ABA treatment. Data represent means ± SD (n = 3). Asterisks indicate significant differences compared to wild-type plants (* p < 0.05, ** p < 0.01).
-
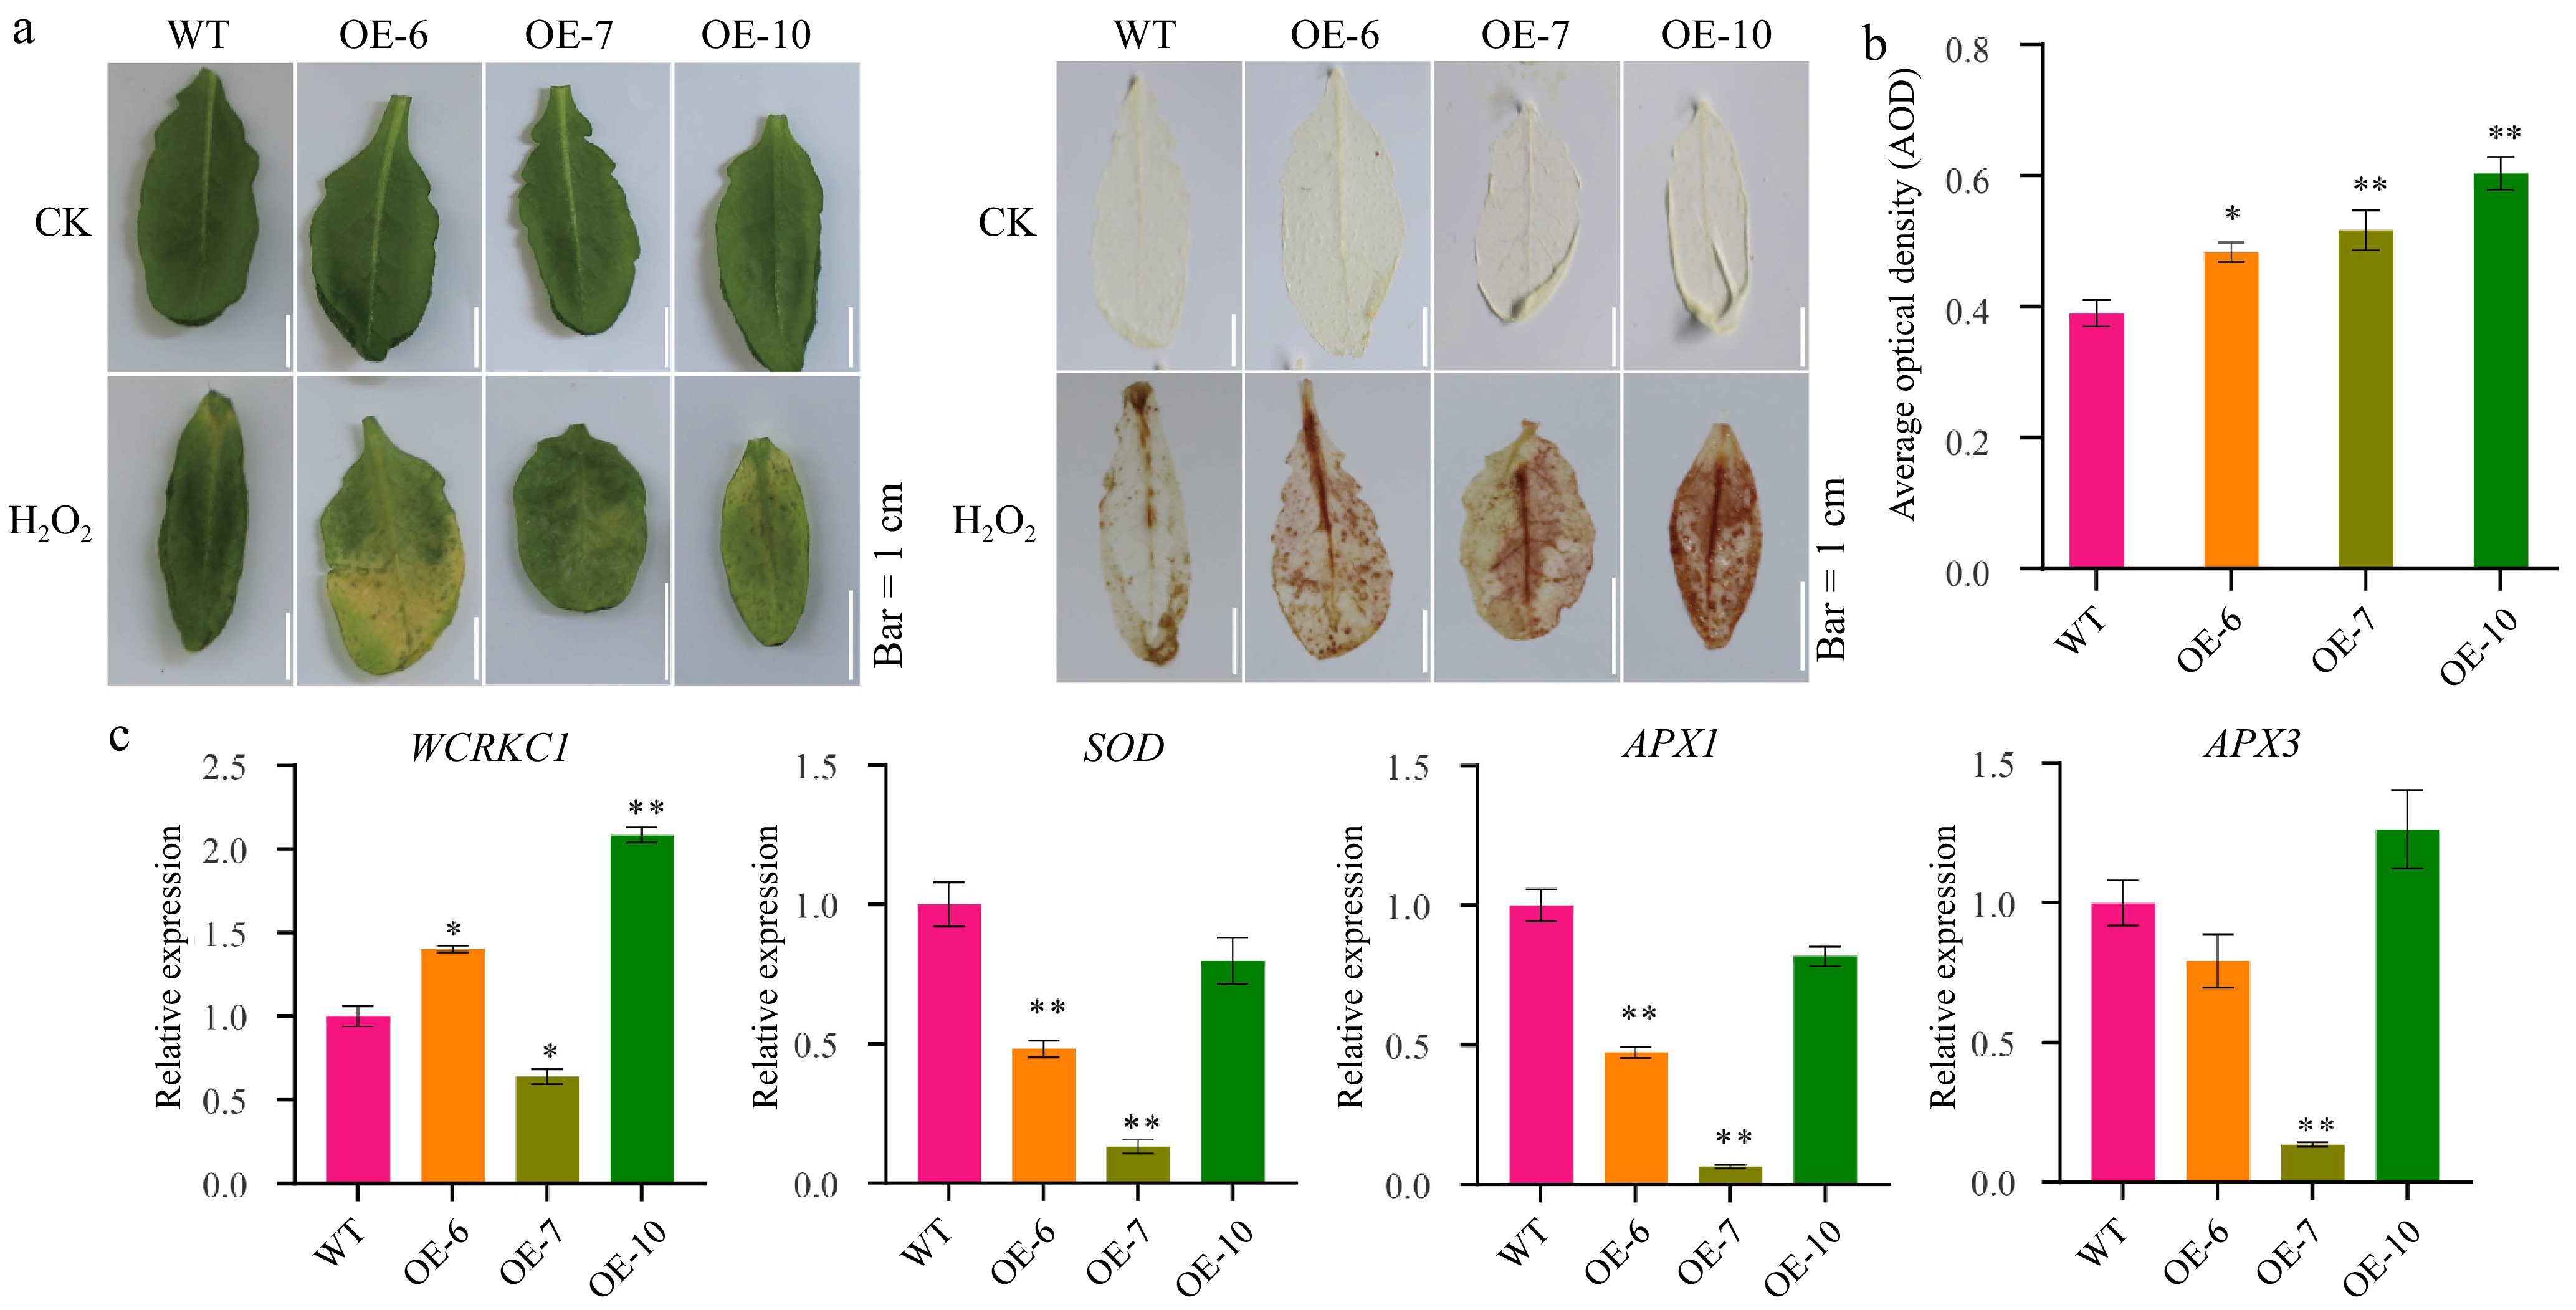
Figure 3.
MeFEE4 transcription level enhances H2O2 sensitivity and regulates the expression of stress-responsive genes in Arabidopsis. (a) Phenotypic differences in wild-type and MeFER4-overexpressing Arabidopsis lines (OE-6, OE-7, OE-10) under control (CK), and H2O2 treatment conditions. Top: Leaf coloration and phenotype under CK and ABA treatment. Bottom: DAB staining for ROS accumulation in wild-type and transgenic lines, indicating oxidative stress under H2O2 treatment. Scale bar = 1 cm. (b) Quantification of ROS accumulation by average optical density in DAB-stained leaves under H2O2 treatment. Data represent means ± SD (n = 3). Asterisks indicate significant differences compared to wild-type plants (* p < 0.05, **p < 0.01). (c) Relative expression levels of stress-responsive genes, including WCRKC1, SOD, APX1, and APX3, in wild-type and MeFER4-overexpressing lines under H2O2 treatment. Data represent means ± SD (n = 3). Asterisks indicate significant differences compared to wild-type plants (* p < 0.05, ** p < 0.01).
-
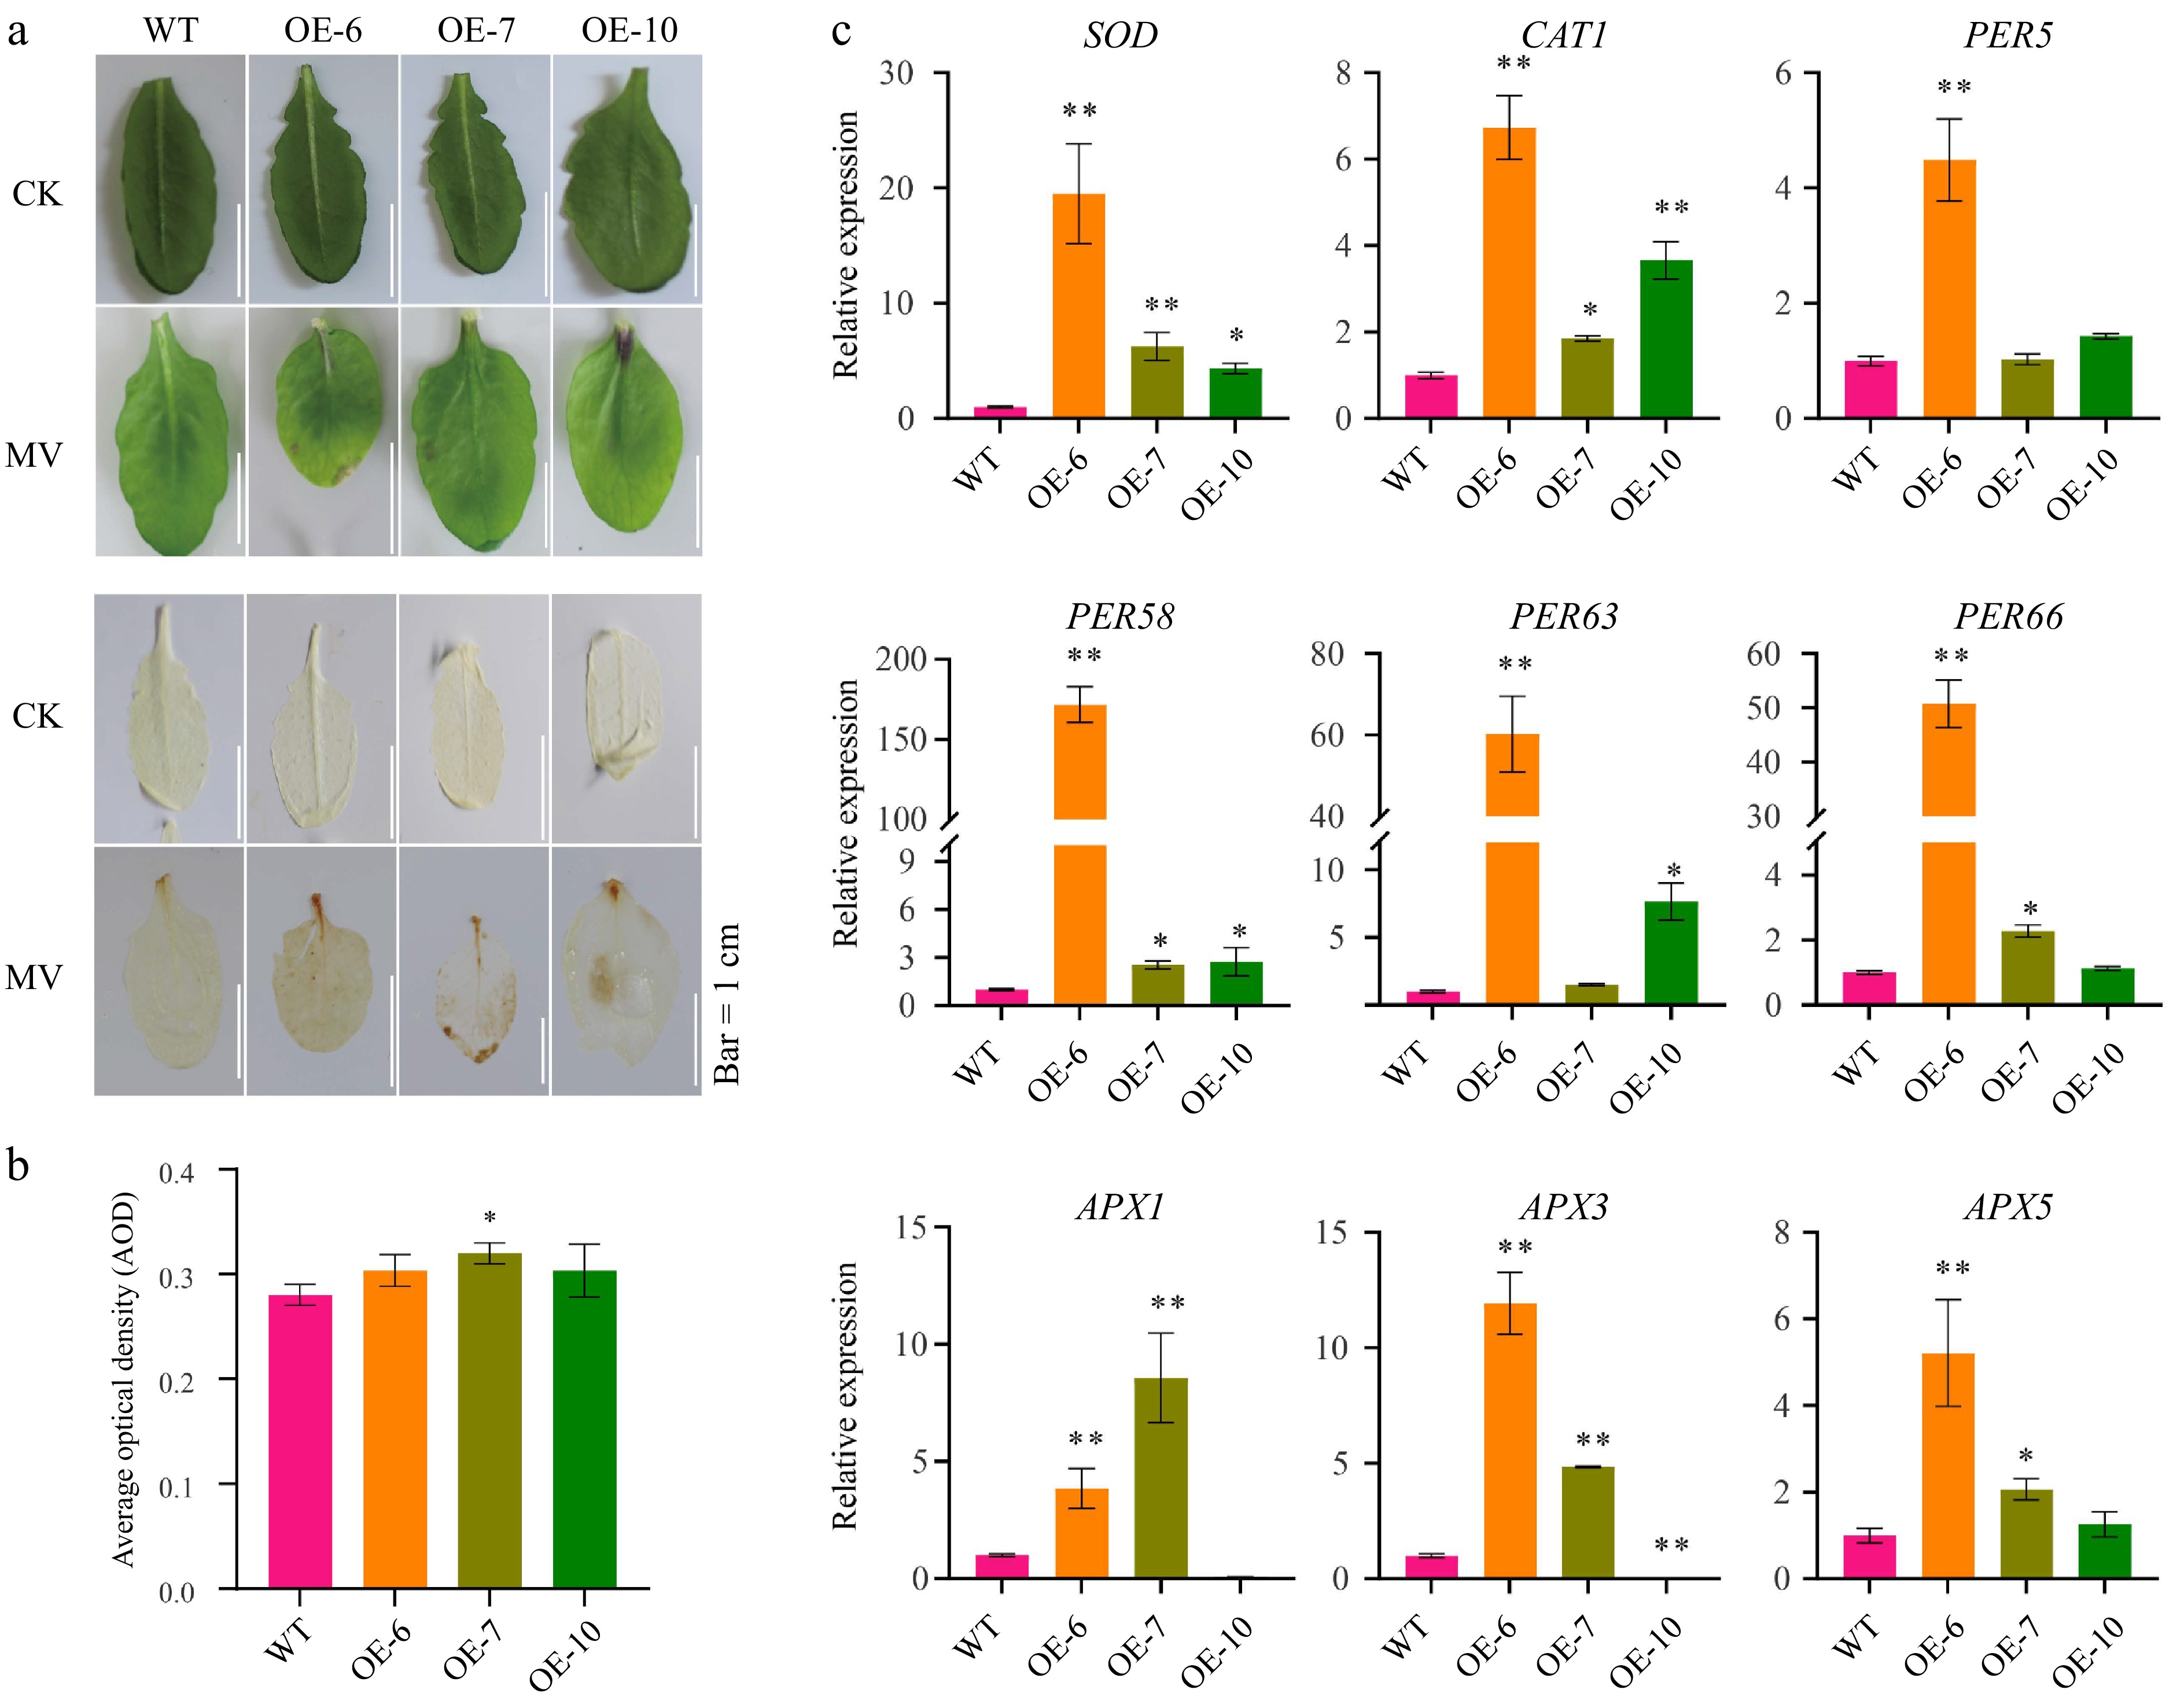
Figure 4.
MeFEE4 transcription level enhances MV sensitivity and regulates the expression of stress-responsive genes in Arabidopsis. (a) Phenotypic differences in wild-type and MeFER4-overexpressing Arabidopsis lines (OE-6, OE-7, OE-10) under control (CK), and MV treatment conditions. Top: Leaf coloration and phenotype under CK and MV treatment. Bottom: DAB staining for ROS accumulation in wild-type and transgenic lines, indicating oxidative stress under MV treatment. Scale bar = 1 cm. (b) Quantification of ROS accumulation by average optical density in DAB-stained leaves under MV treatment. Data represent means ± SD (n = 3). Asterisks indicate significant differences compared to wild-type plants (* p < 0.05). (c) Relative expression levels of stress-responsive genes, including SOD, CAT1, PER5, PER58, PER63, PER66, APX1, APX3, and APX5, in wild-type and MeFER4-overexpressing lines under MV treatment. Data represent means ± SD (n = 3). Asterisks indicate significant differences compared to wild-type plants (* p < 0.05, ** p < 0.01).
-
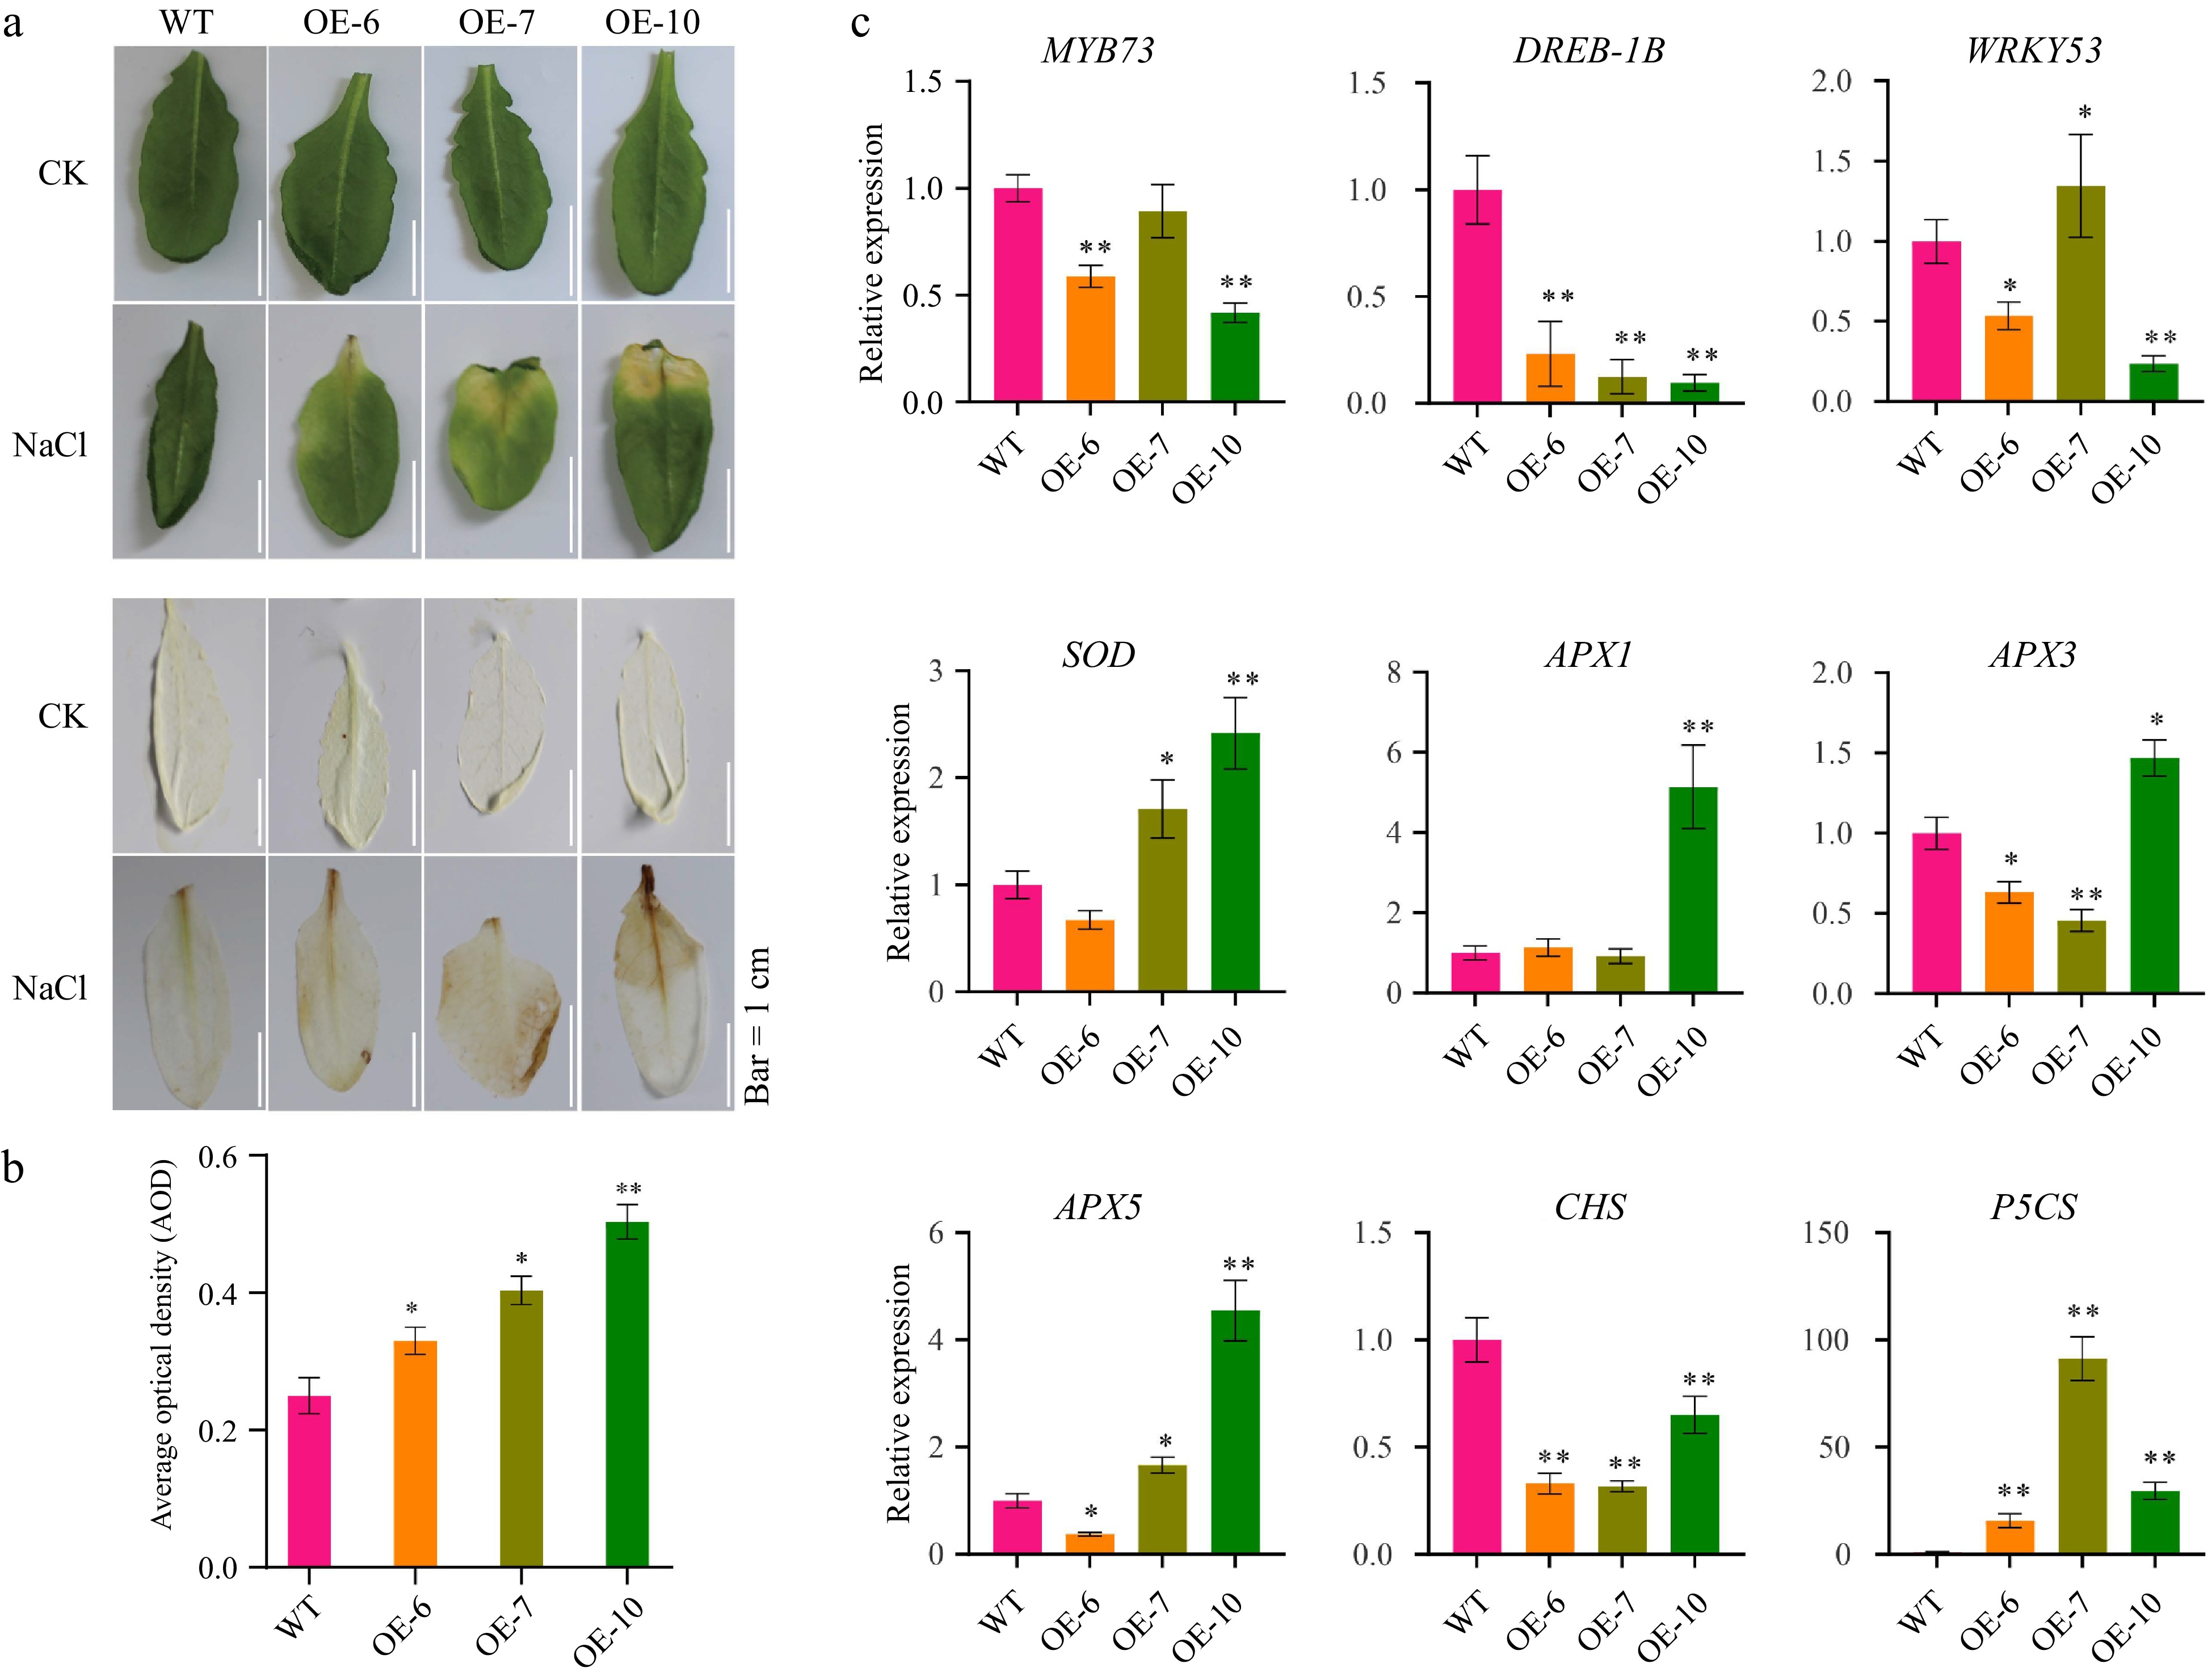
Figure 5.
MeFEE4 transcription level enhances Salinity sensitivity and regulates the expression of stress-responsive genes in Arabidopsis. (a) Phenotypic differences in wild-type and MeFER4-overexpressing Arabidopsis lines (OE-6, OE-7, OE-10) under control (CK), and NaCl treatment conditions. Top: Leaf coloration and phenotype under CK and NaCl treatment. Bottom: DAB staining for ROS accumulation in wild-type and transgenic lines, indicating oxidative stress under NaCl treatment. Scale bar = 1 cm. (b) Quantification of ROS accumulation by average optical density in DAB-stained leaves under NaCl treatment. Data represent means ± SD (n = 3). Asterisks indicate significant differences compared to wild-type plants (* p < 0.05, ** p < 0.01). (c) Relative expression levels of stress-responsive genes, including MYB73, DERB-1B, WRKY53, SOD, APX1, APX3, APX5, CHS, and P5CS, in wild-type and MeFER4-overexpressing lines under NaCl treatment. Data represent means ± SD (n = 3). Asterisks indicate significant differences compared to wild-type plants (* p < 0.05, ** p < 0.01).
-
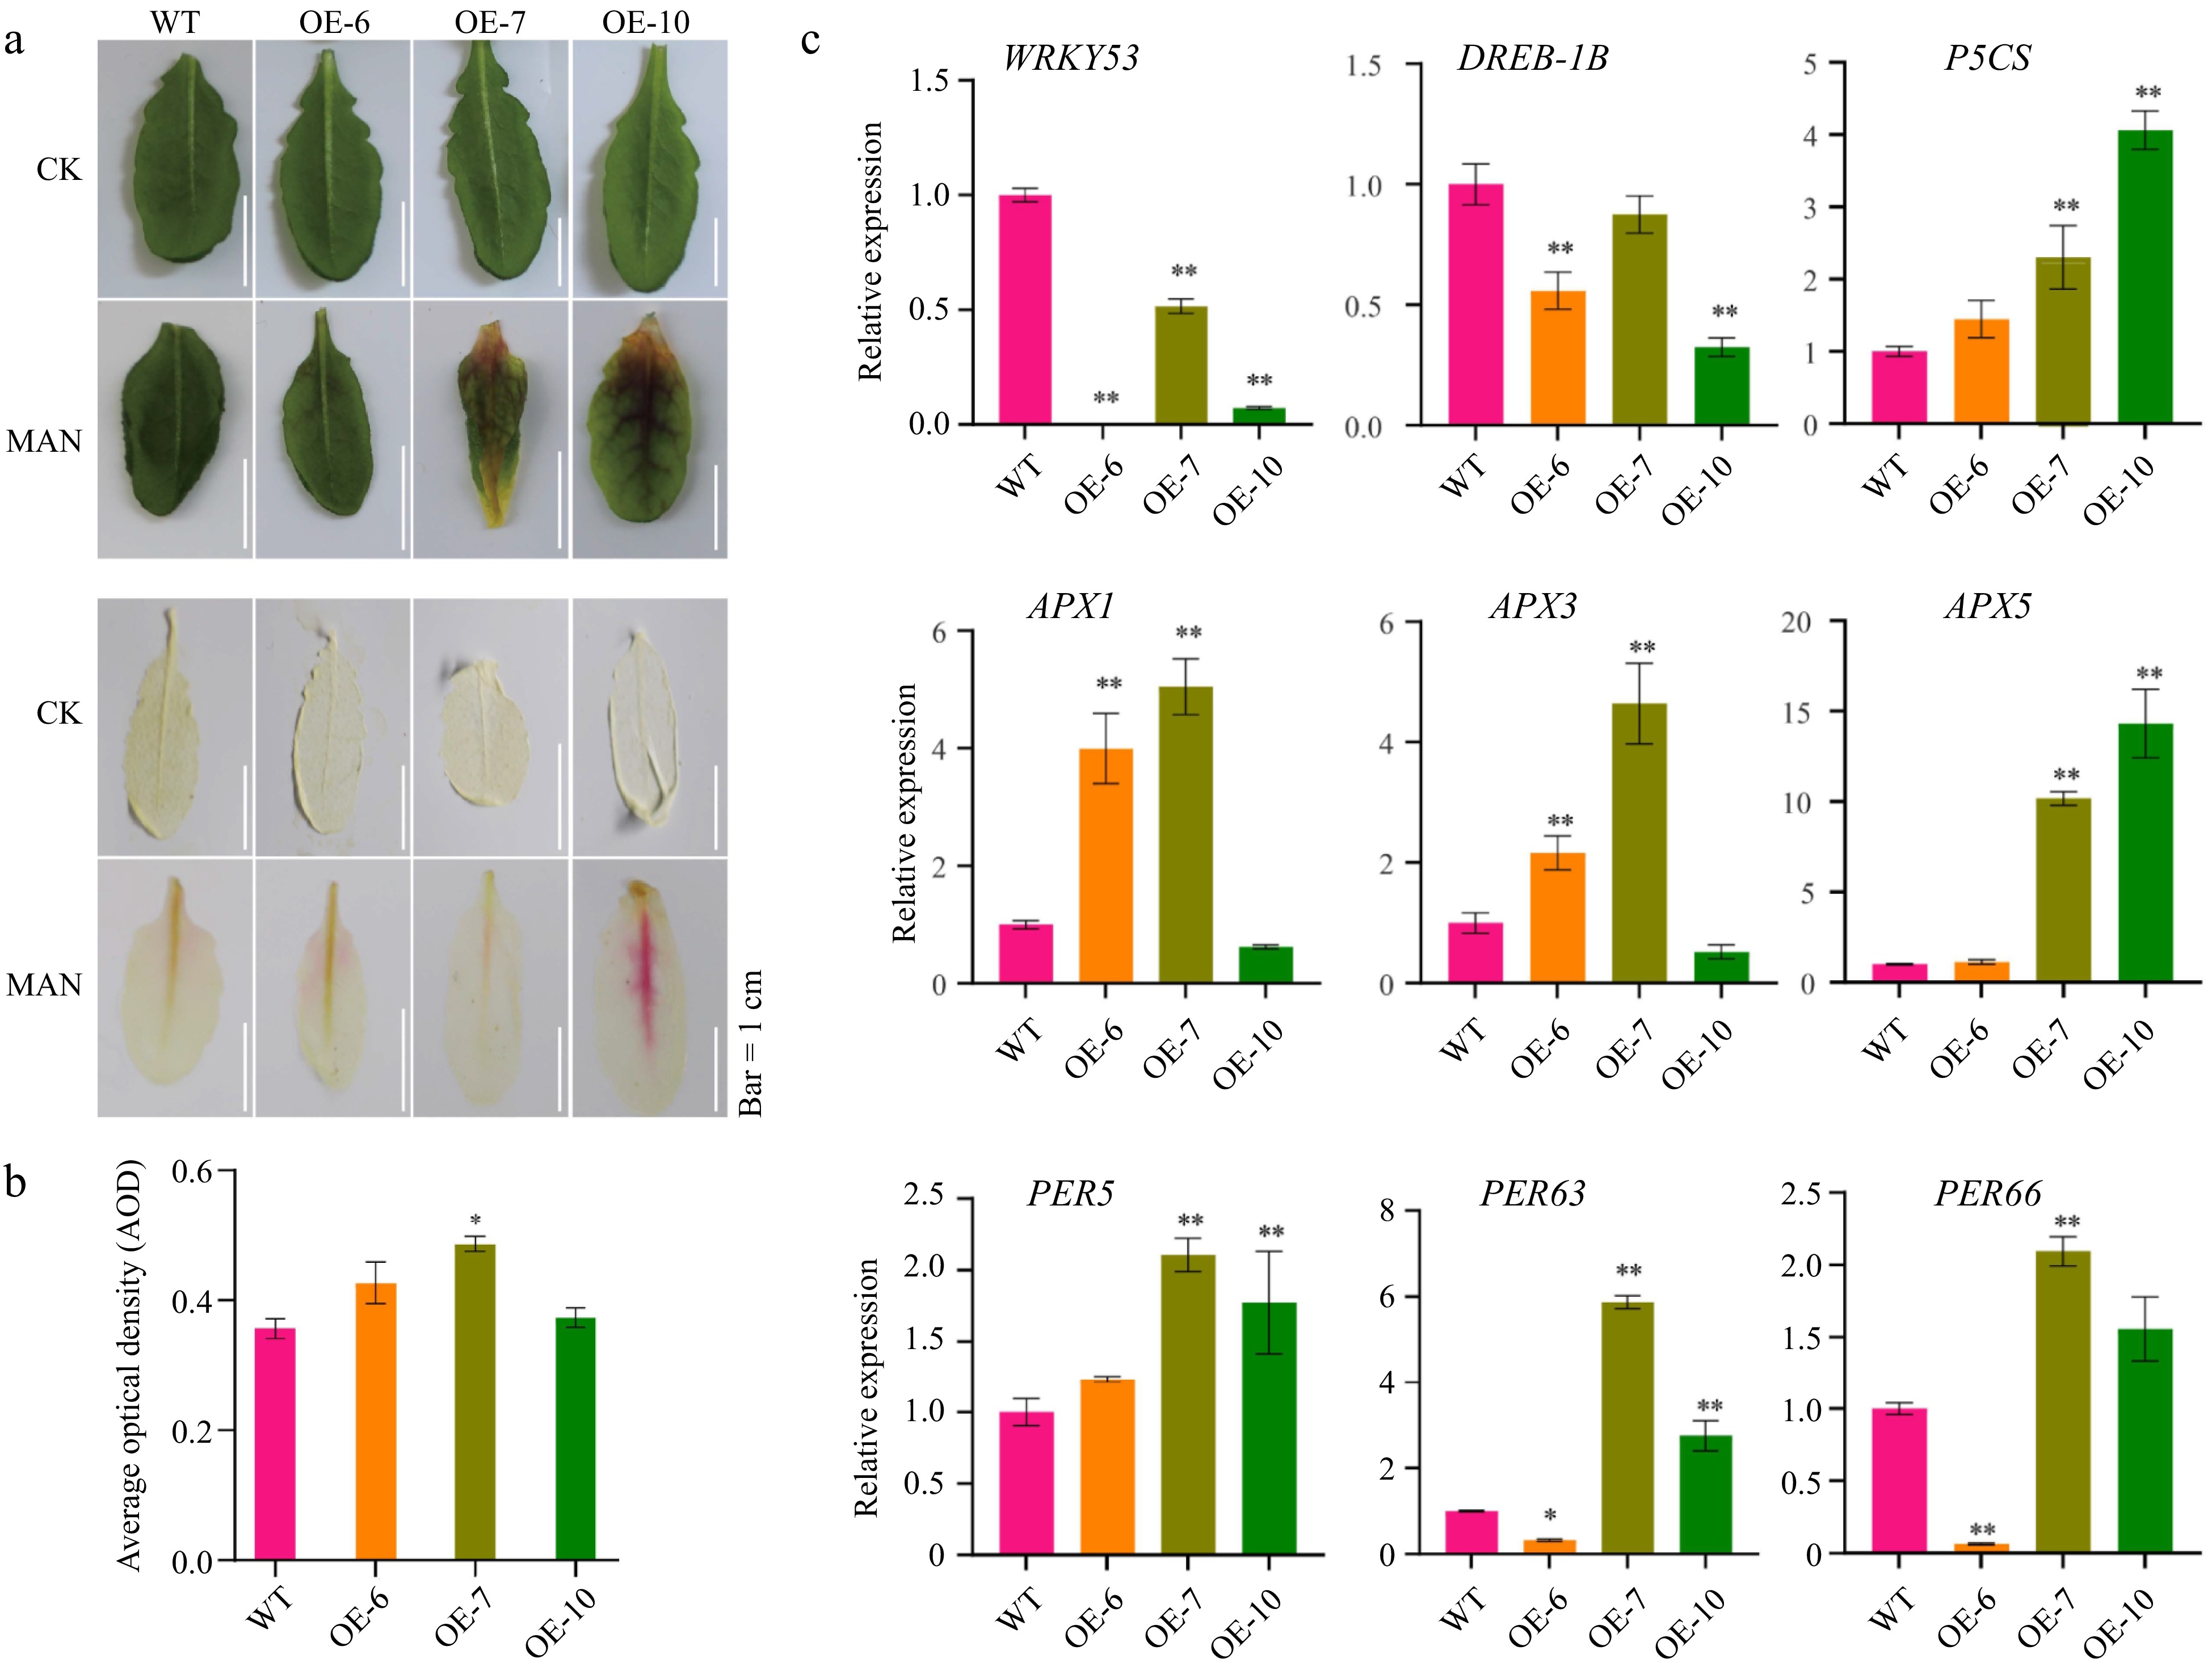
Figure 6.
MeFEE4 transcription level enhances osmotic stress sensitivity and regulates the expression of stress-responsive genes in Arabidopsis. (a) Phenotypic differences in wild-type and MeFER4-overexpressing Arabidopsis lines (OE-6, OE-7, OE-10) under control (CK), and mannitol (MAN) treatment conditions. Top: Leaf coloration and phenotype under CK and MAN treatment. Bottom: DAB staining for ROS accumulation in wild-type and transgenic lines, indicating oxidative stress under MAN treatment. Scale bar = 1 cm. (b) Quantification of ROS accumulation by average optical density in DAB-stained leaves under MAN treatment. Data represent means ± SD (n = 3). Asterisks indicate significant differences compared to wild-type plants (* p < 0.05). (c) Relative expression levels of stress-responsive genes, including SOD, CAT1, PER5, PER58, PER63, PER66, APX1, APX3, and APX5, in wild-type and MeFER4-overexpressing lines under MAN treatment. Data represent means ± SD (n = 3). Asterisks indicate significant differences compared to wild-type plants (* p < 0.05, ** p < 0.01).
-
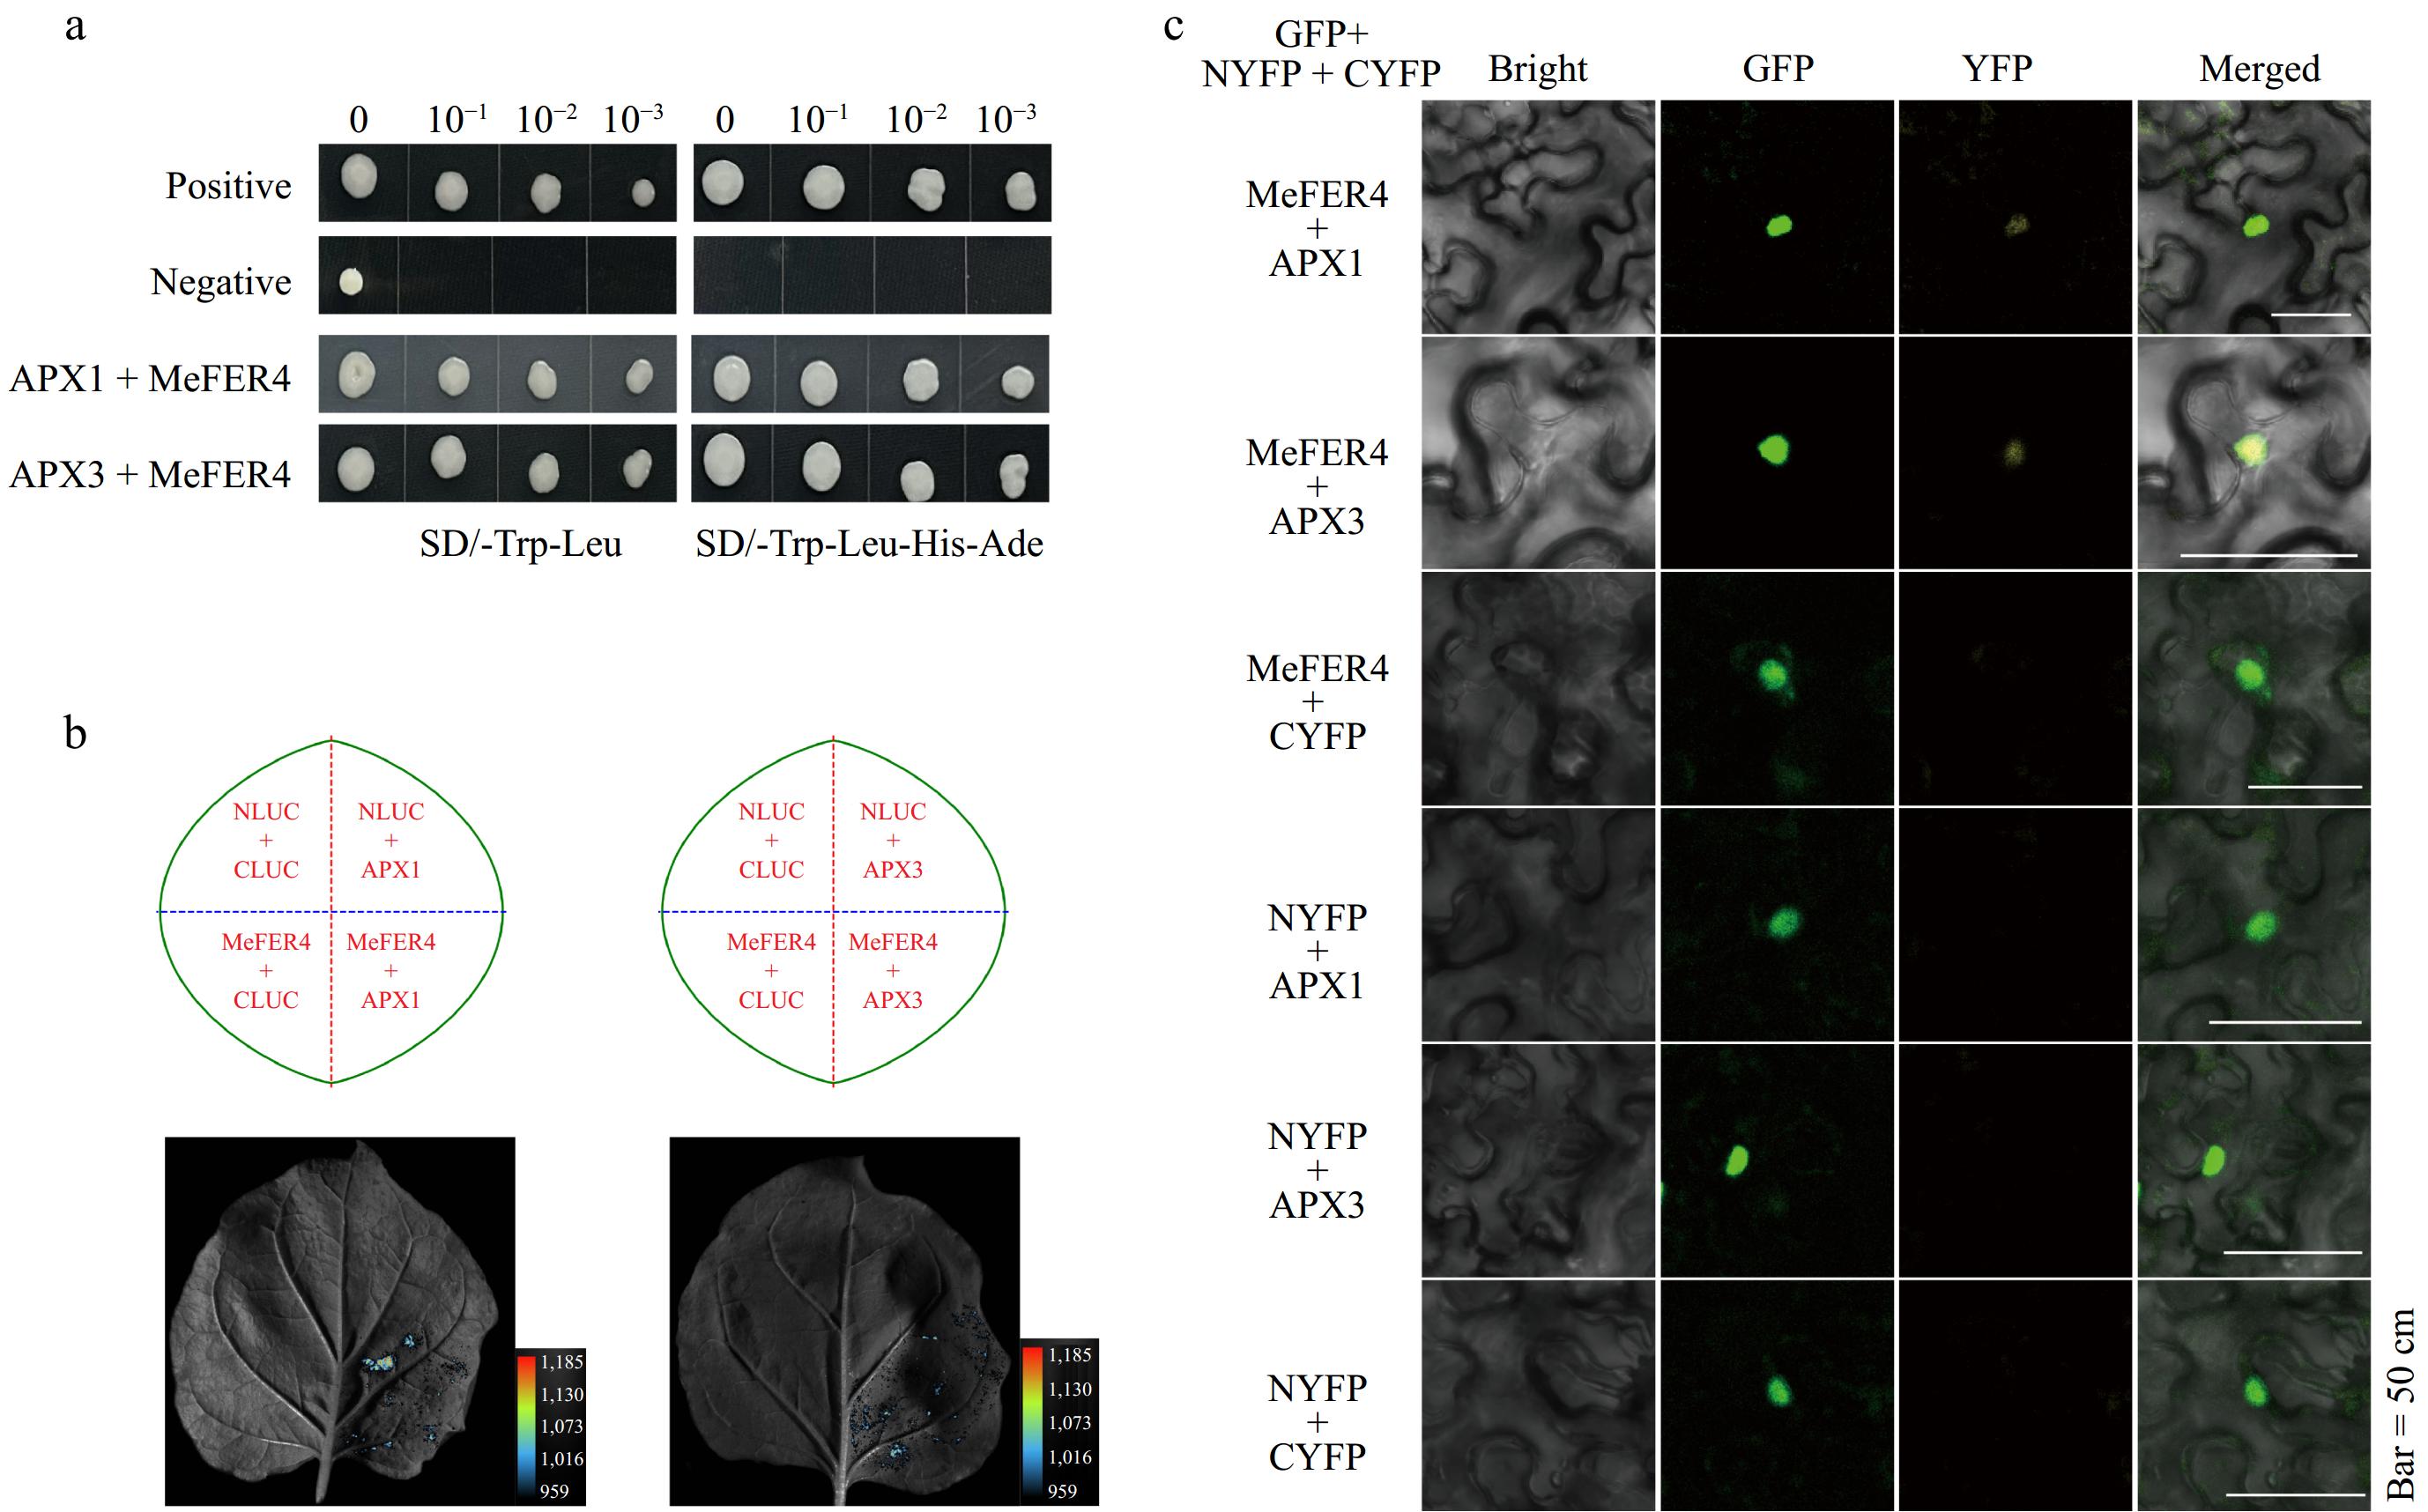
Figure 7.
Interaction analysis of MeFER4 with APX1 and APX3. (a) Yeast two-hybrid assay results showing the interaction between MeFER4 with APX1 and APX3. The positive and negative controls indicate the expected results. Growth on selective media SD/-Trp-Leu and SD/-Trp-Leu-His-Ade demonstrates the interactions between the proteins in APX1 + MeFER4 and APX3 + MeFER4. (b) Split-LUC assay results indicating the interaction between MeFER4 with APX1 and APX3. The left and right panels show the interaction of MeFER4 with APX1 and APX3 in tobacco leaves, respectively. The luminescence signal confirms the protein-protein interaction. (c) BiFC assay results illustrating the interaction between MeFER4 with APX1 and APX3. The GFP, YFP, and merged images demonstrate the fluorescence signal in tobacco leaf cells, further validating the protein interactions. Scale bar = 50 μm.
-
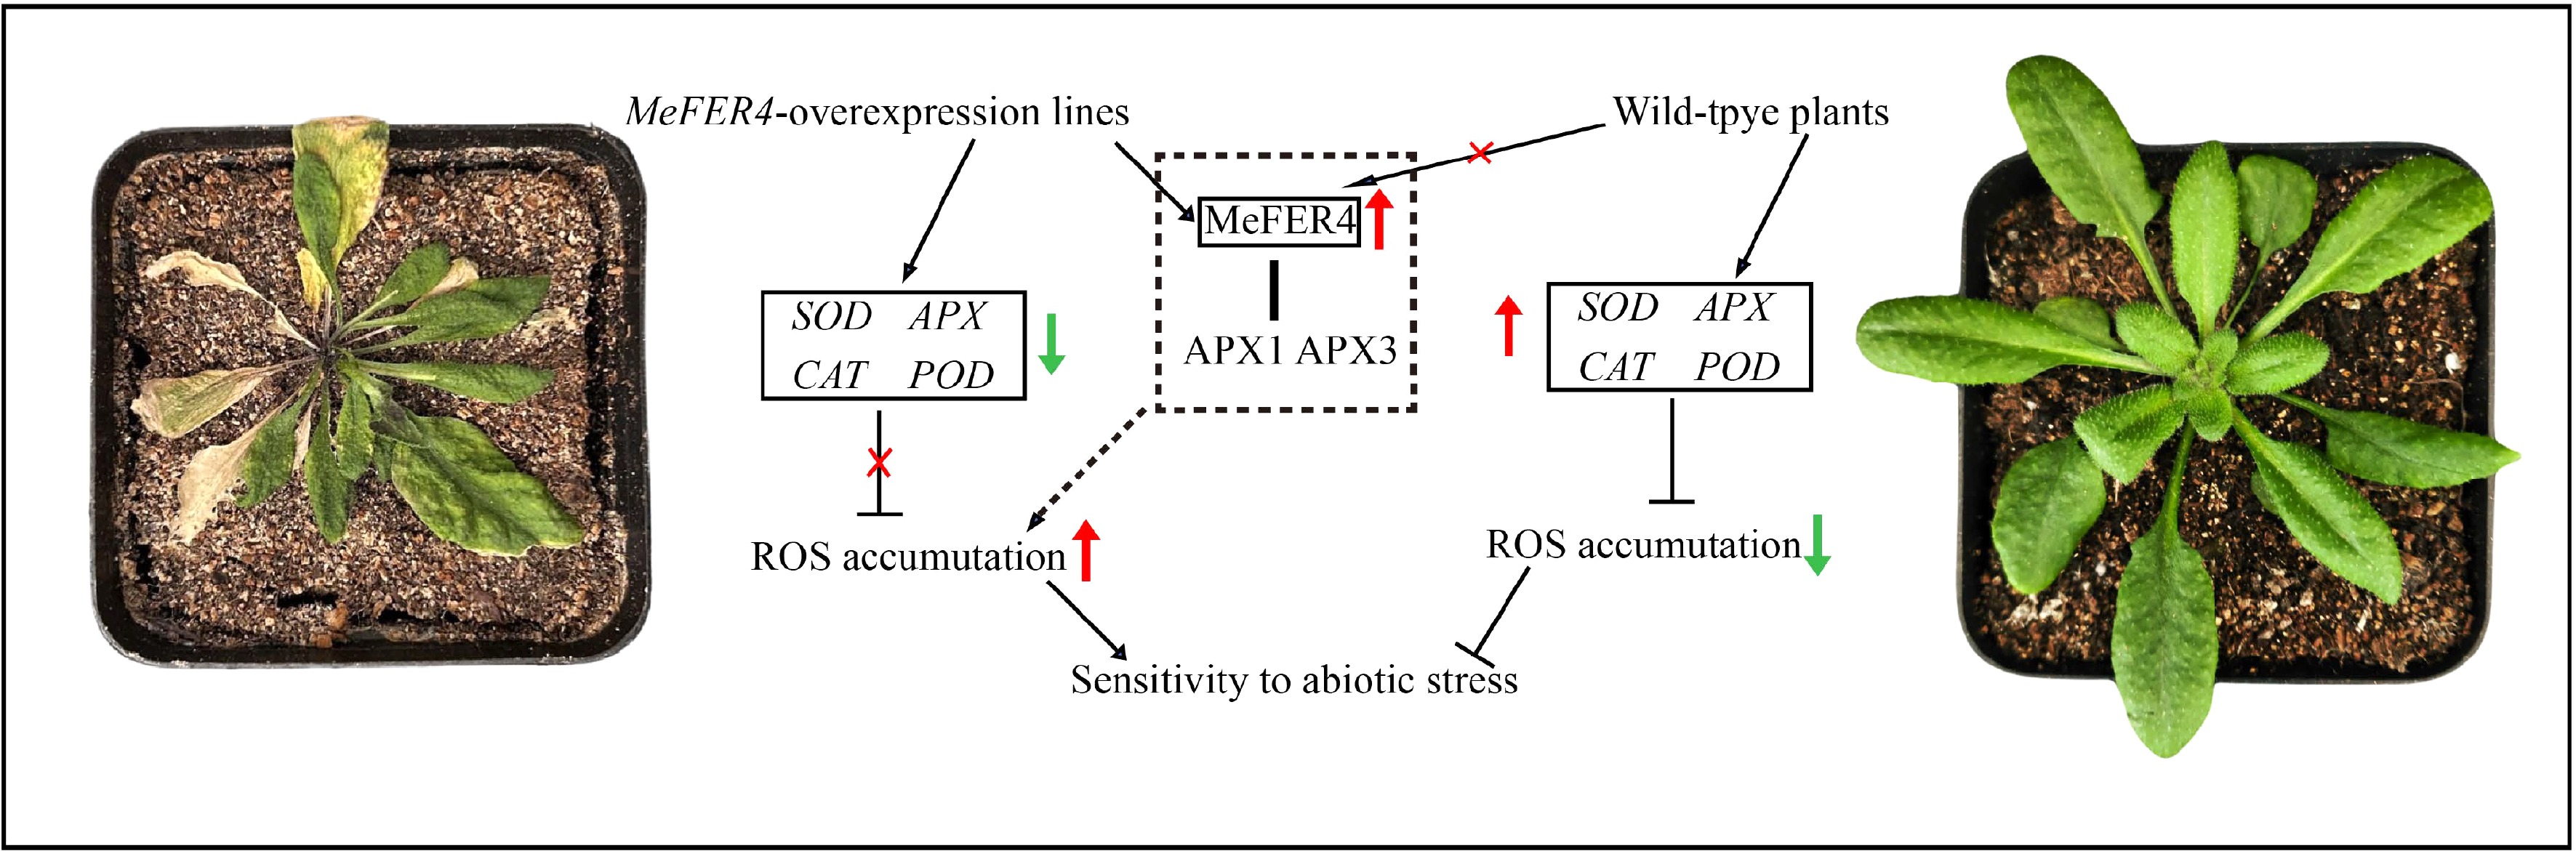
Figure 8.
The mechanism by which MeFER4 promotes ROS accumulation in Arabidopsis under abiotic stress. In MeFER4-overexpressing transgenic lines, the presence of MeFER4 leads to the downregulation of antioxidant genes such as SOD, APX, CAT, and POD, and interacts with APX1 and APX3, ultimately promoting ROS accumulation and increasing sensitivity to abiotic stress. In contrast, in wild-type plants, the absence of MeFER4 allows the normal expression of antioxidant enzyme genes, resulting in higher resistance to abiotic stress.
Figures
(8)
Tables
(0)