-
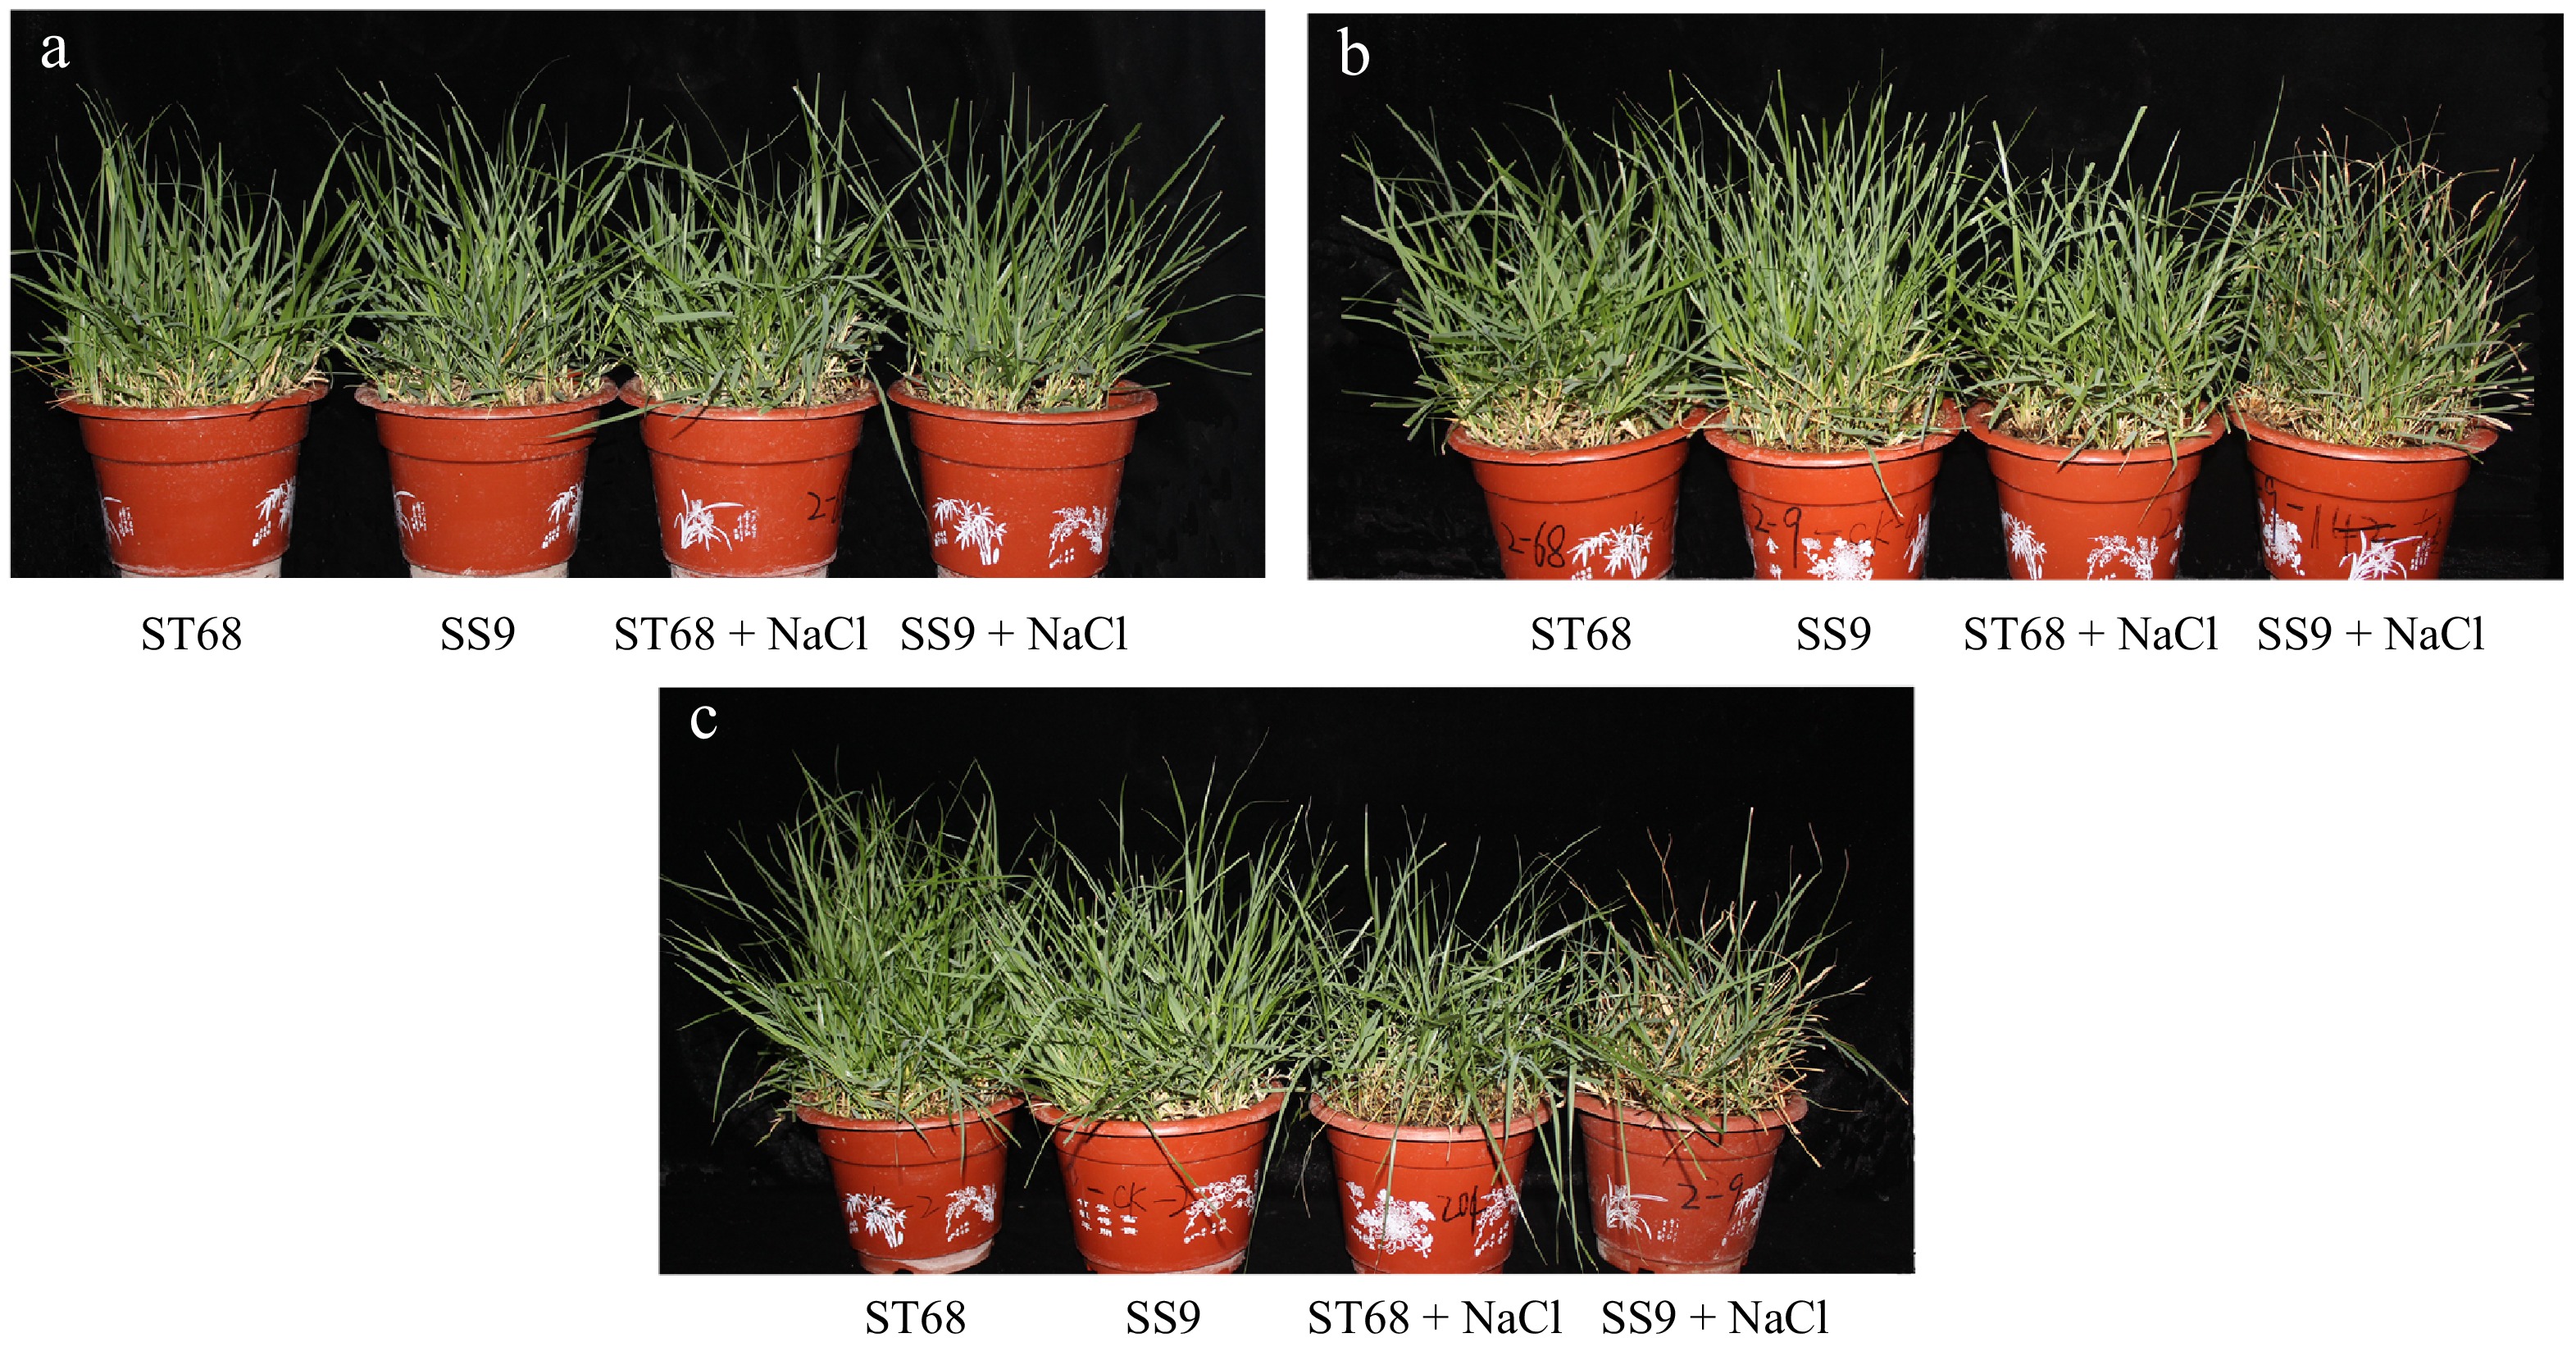
Figure 1.
Phenotypic change of ST68 and SS9 under salt treatment. (a), (b), and (c) show plants treated with 250 mM NaCl for 0, 9, and 12 d, respectively.
-
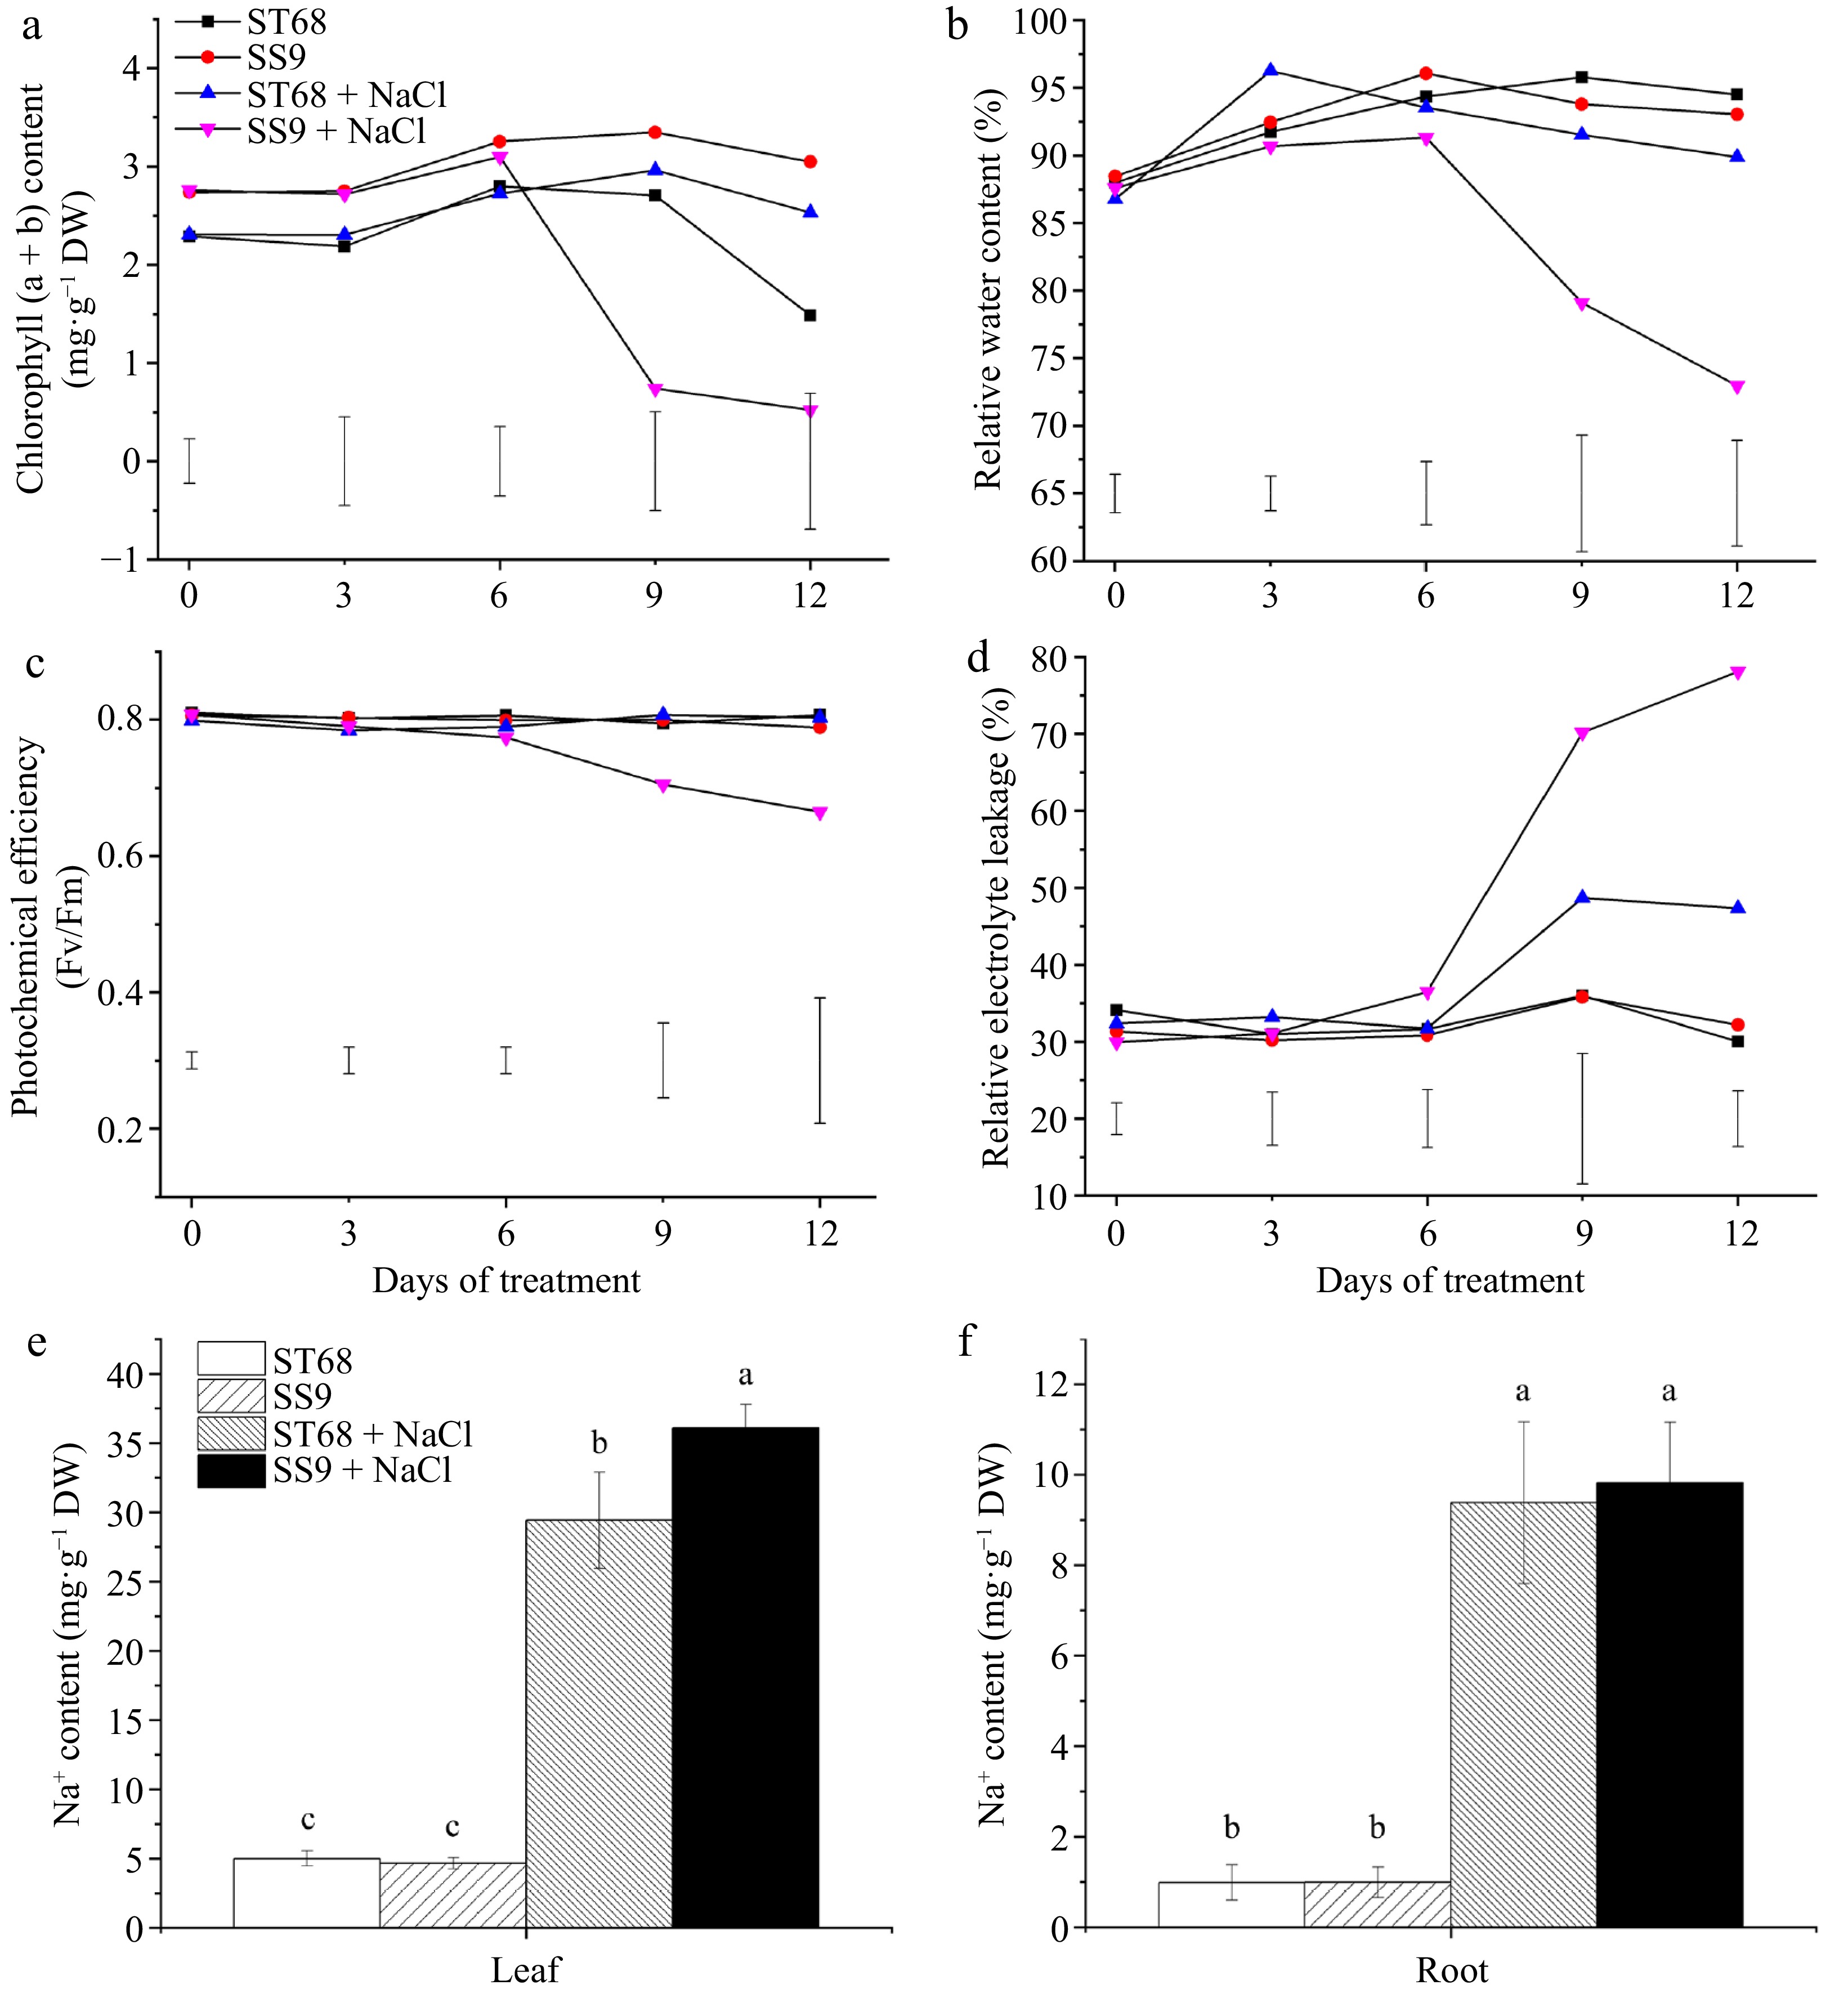
Figure 2.
Physiological performances of ST68 and SS9 under salt stress (250 mM NaCl). (a) Changes in chlorophyll content under salt stress. (b) Changes in relative water content (RWC) under salt stress. (c) Changes in photochemical efficiency (Fv/Fm) under salt stress. (d) Changes in relative electrolyte leakage (REL) under salt stress. (e) Sodium ion content in leaves after 9 d of salt stress. (f) Sodium ion content in roots after 9 d of salt stress. Values of (a)−(d) are means ± LSD and values of (e), (f) are means ± SD, all from four replicates. Different lowercase letters indicate significance at p < 0.05.
-
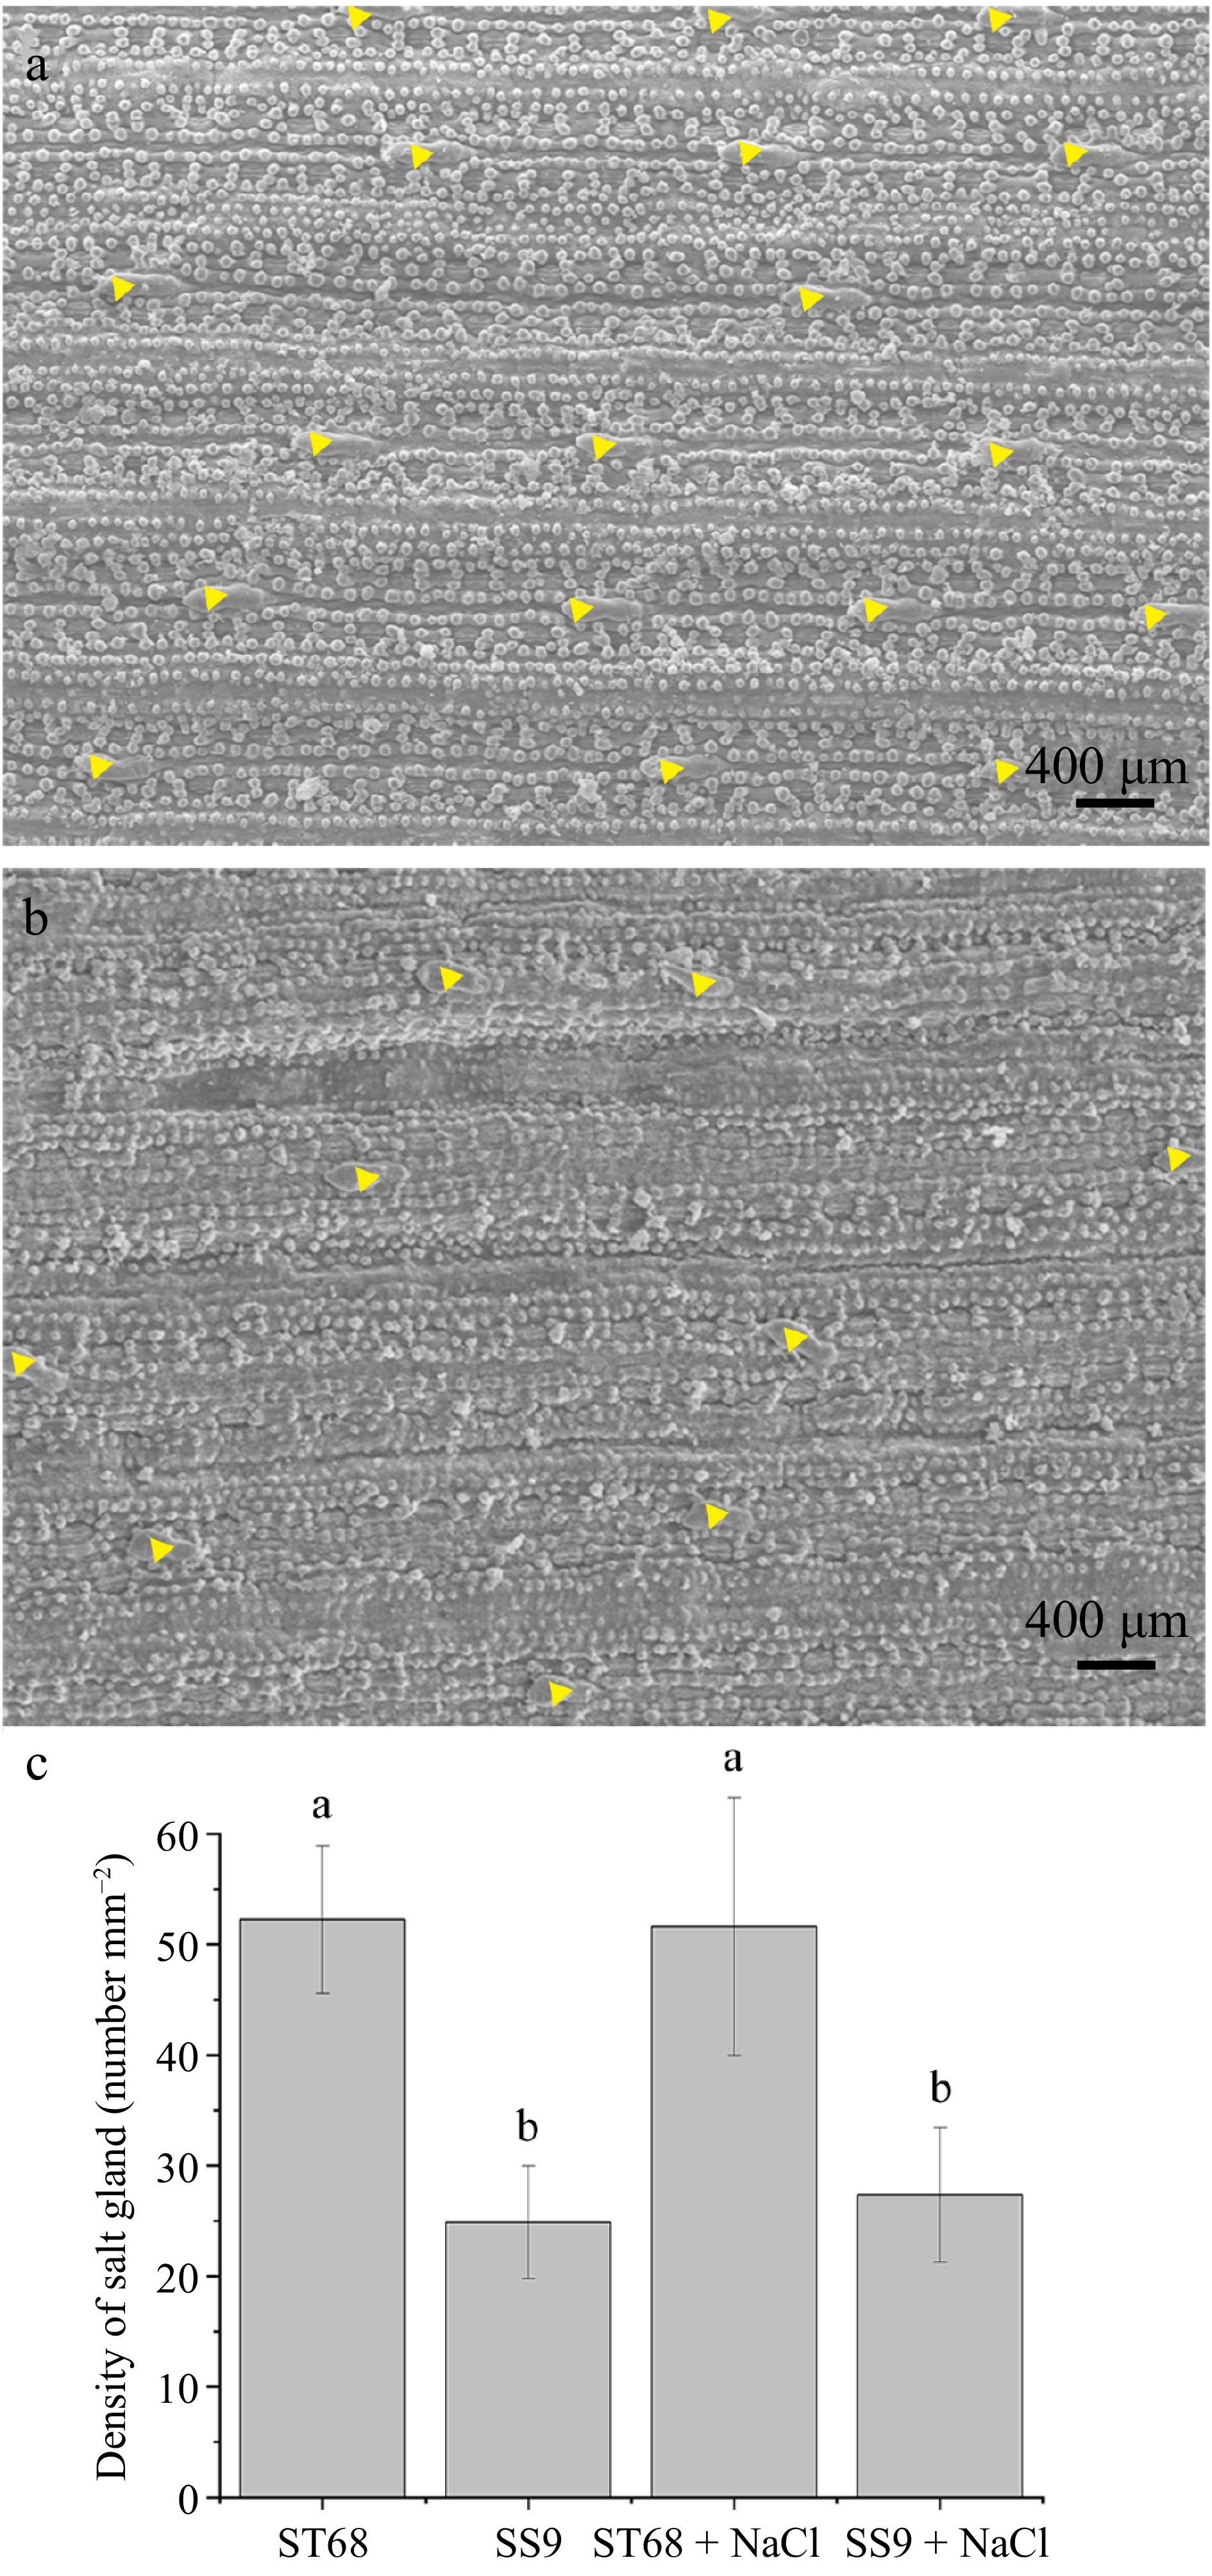
Figure 3.
Distribution and quantification of salt glands in two Zoysiagrass germplasm accessions (ST68 and SS9) under salt stress. (a) Distribution of salt glands on the leaves surface in ST68 + NaCl. (b) Distribution of salt glands on the leaves surface in SS9 + NaCl. (c) Density of salt glands in ST68 and SS9 with and without NaCl treatment. The values are means ± SD from six replicates. Different lowercase letters indicate significance at p < 0.05.
-
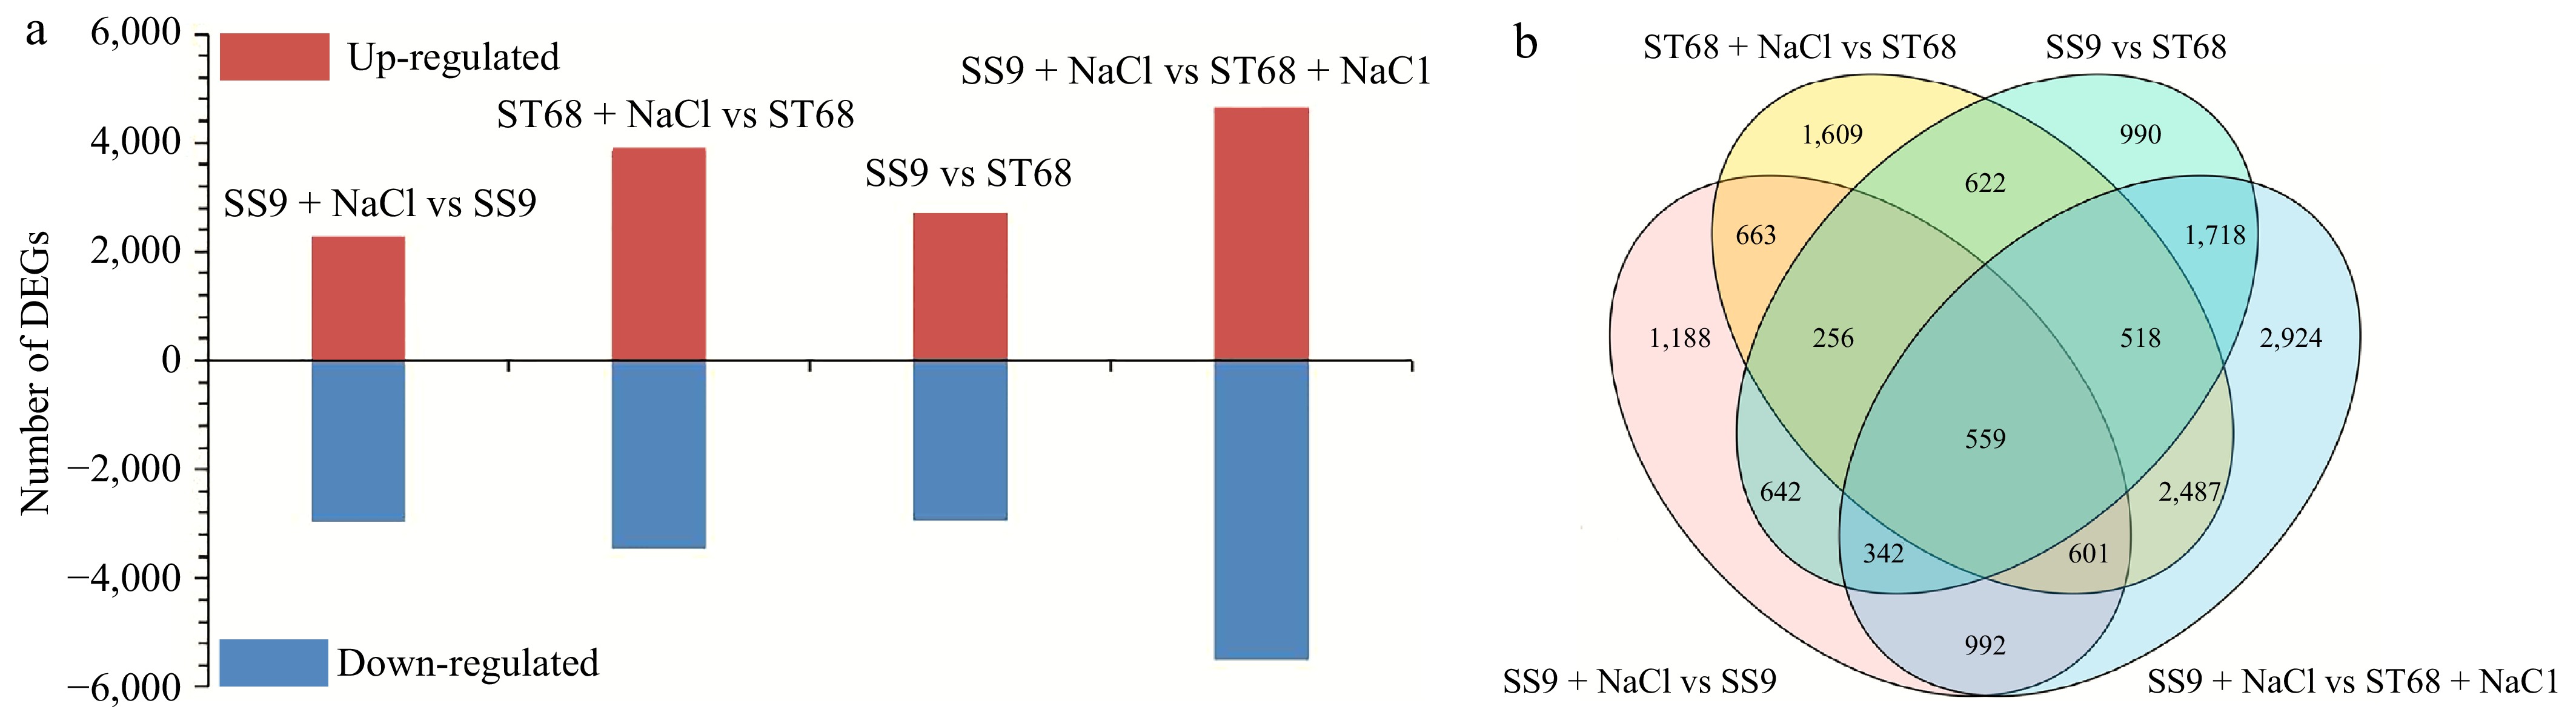
Figure 4.
DEGs identified in ST68 and SS9. (a) Number of DEGs in ST68 and SS9 under unstressed and stressed conditions. (b) Venn diagram illustrating the overlap and unique DEGs between ST68 and SS9 under salt stress.
-
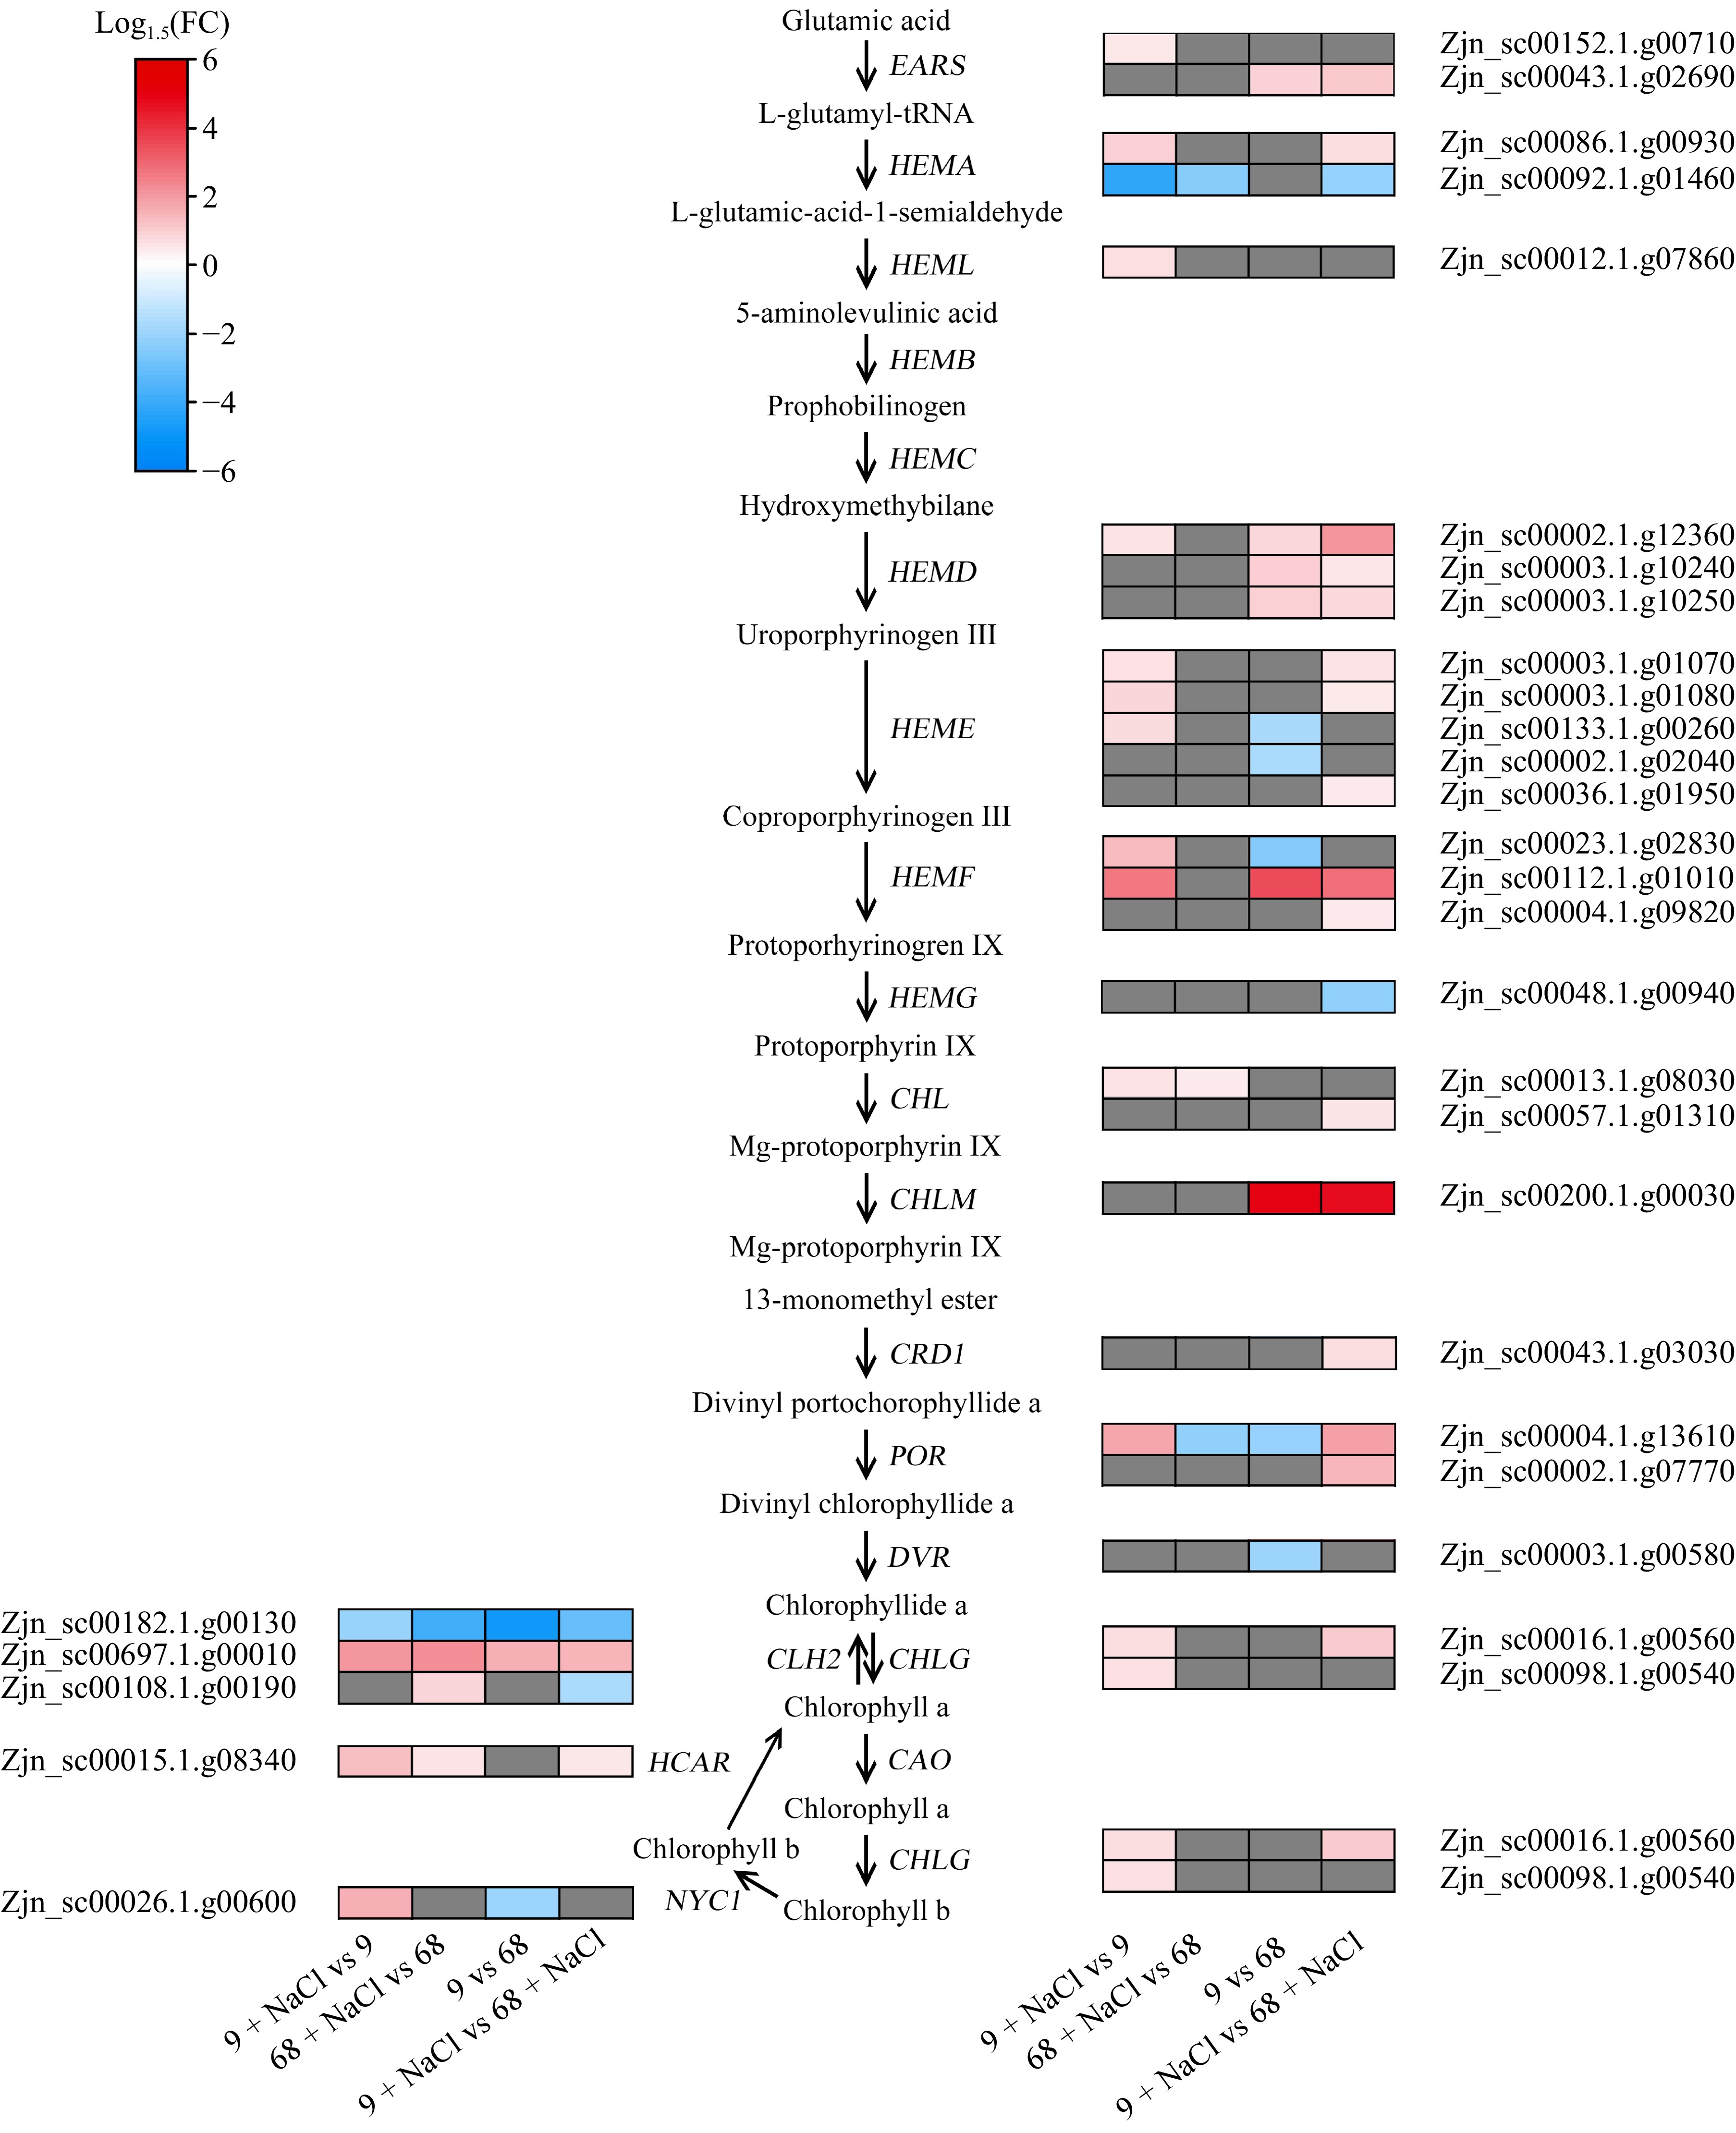
Figure 5.
Expression profiles of DEGs related to chlorophyll metabolism. EARS, glutamyl-tRNA synthetase; HEMA, glutamyl-tRNA reductase; HEML, glutamate-1-semialdehyde 2,1-aminomutase; HEMB, porphobilinogen synthase; HEMC, hydroxymethylbilane synthase; HEMD, uroporphyrinogen III synthase; HEME, uroporphyrinogen III decarboxylase, HEMF, coproporphyrinogen III oxidase; HEMG, protoporphyrinogen oxidase; CHLD, magnesium chelatase; CHLM, magnesium proto IX methyltransferase; CRD1, Mg-protoporphyrin IX monomethyl ester cyclase; POR, protochlorophyllide oxidoreductase; DVR, 3,8-divinyl protochlorophylide a 8-vinyl reductase; CAO, chlorophyllide a oxygenase; CHLG, chlorophyll synthase; NYC1, chlorophyll b reductase; HCAR, 7-hydroxymethyl chlorophyll a reductase.
-
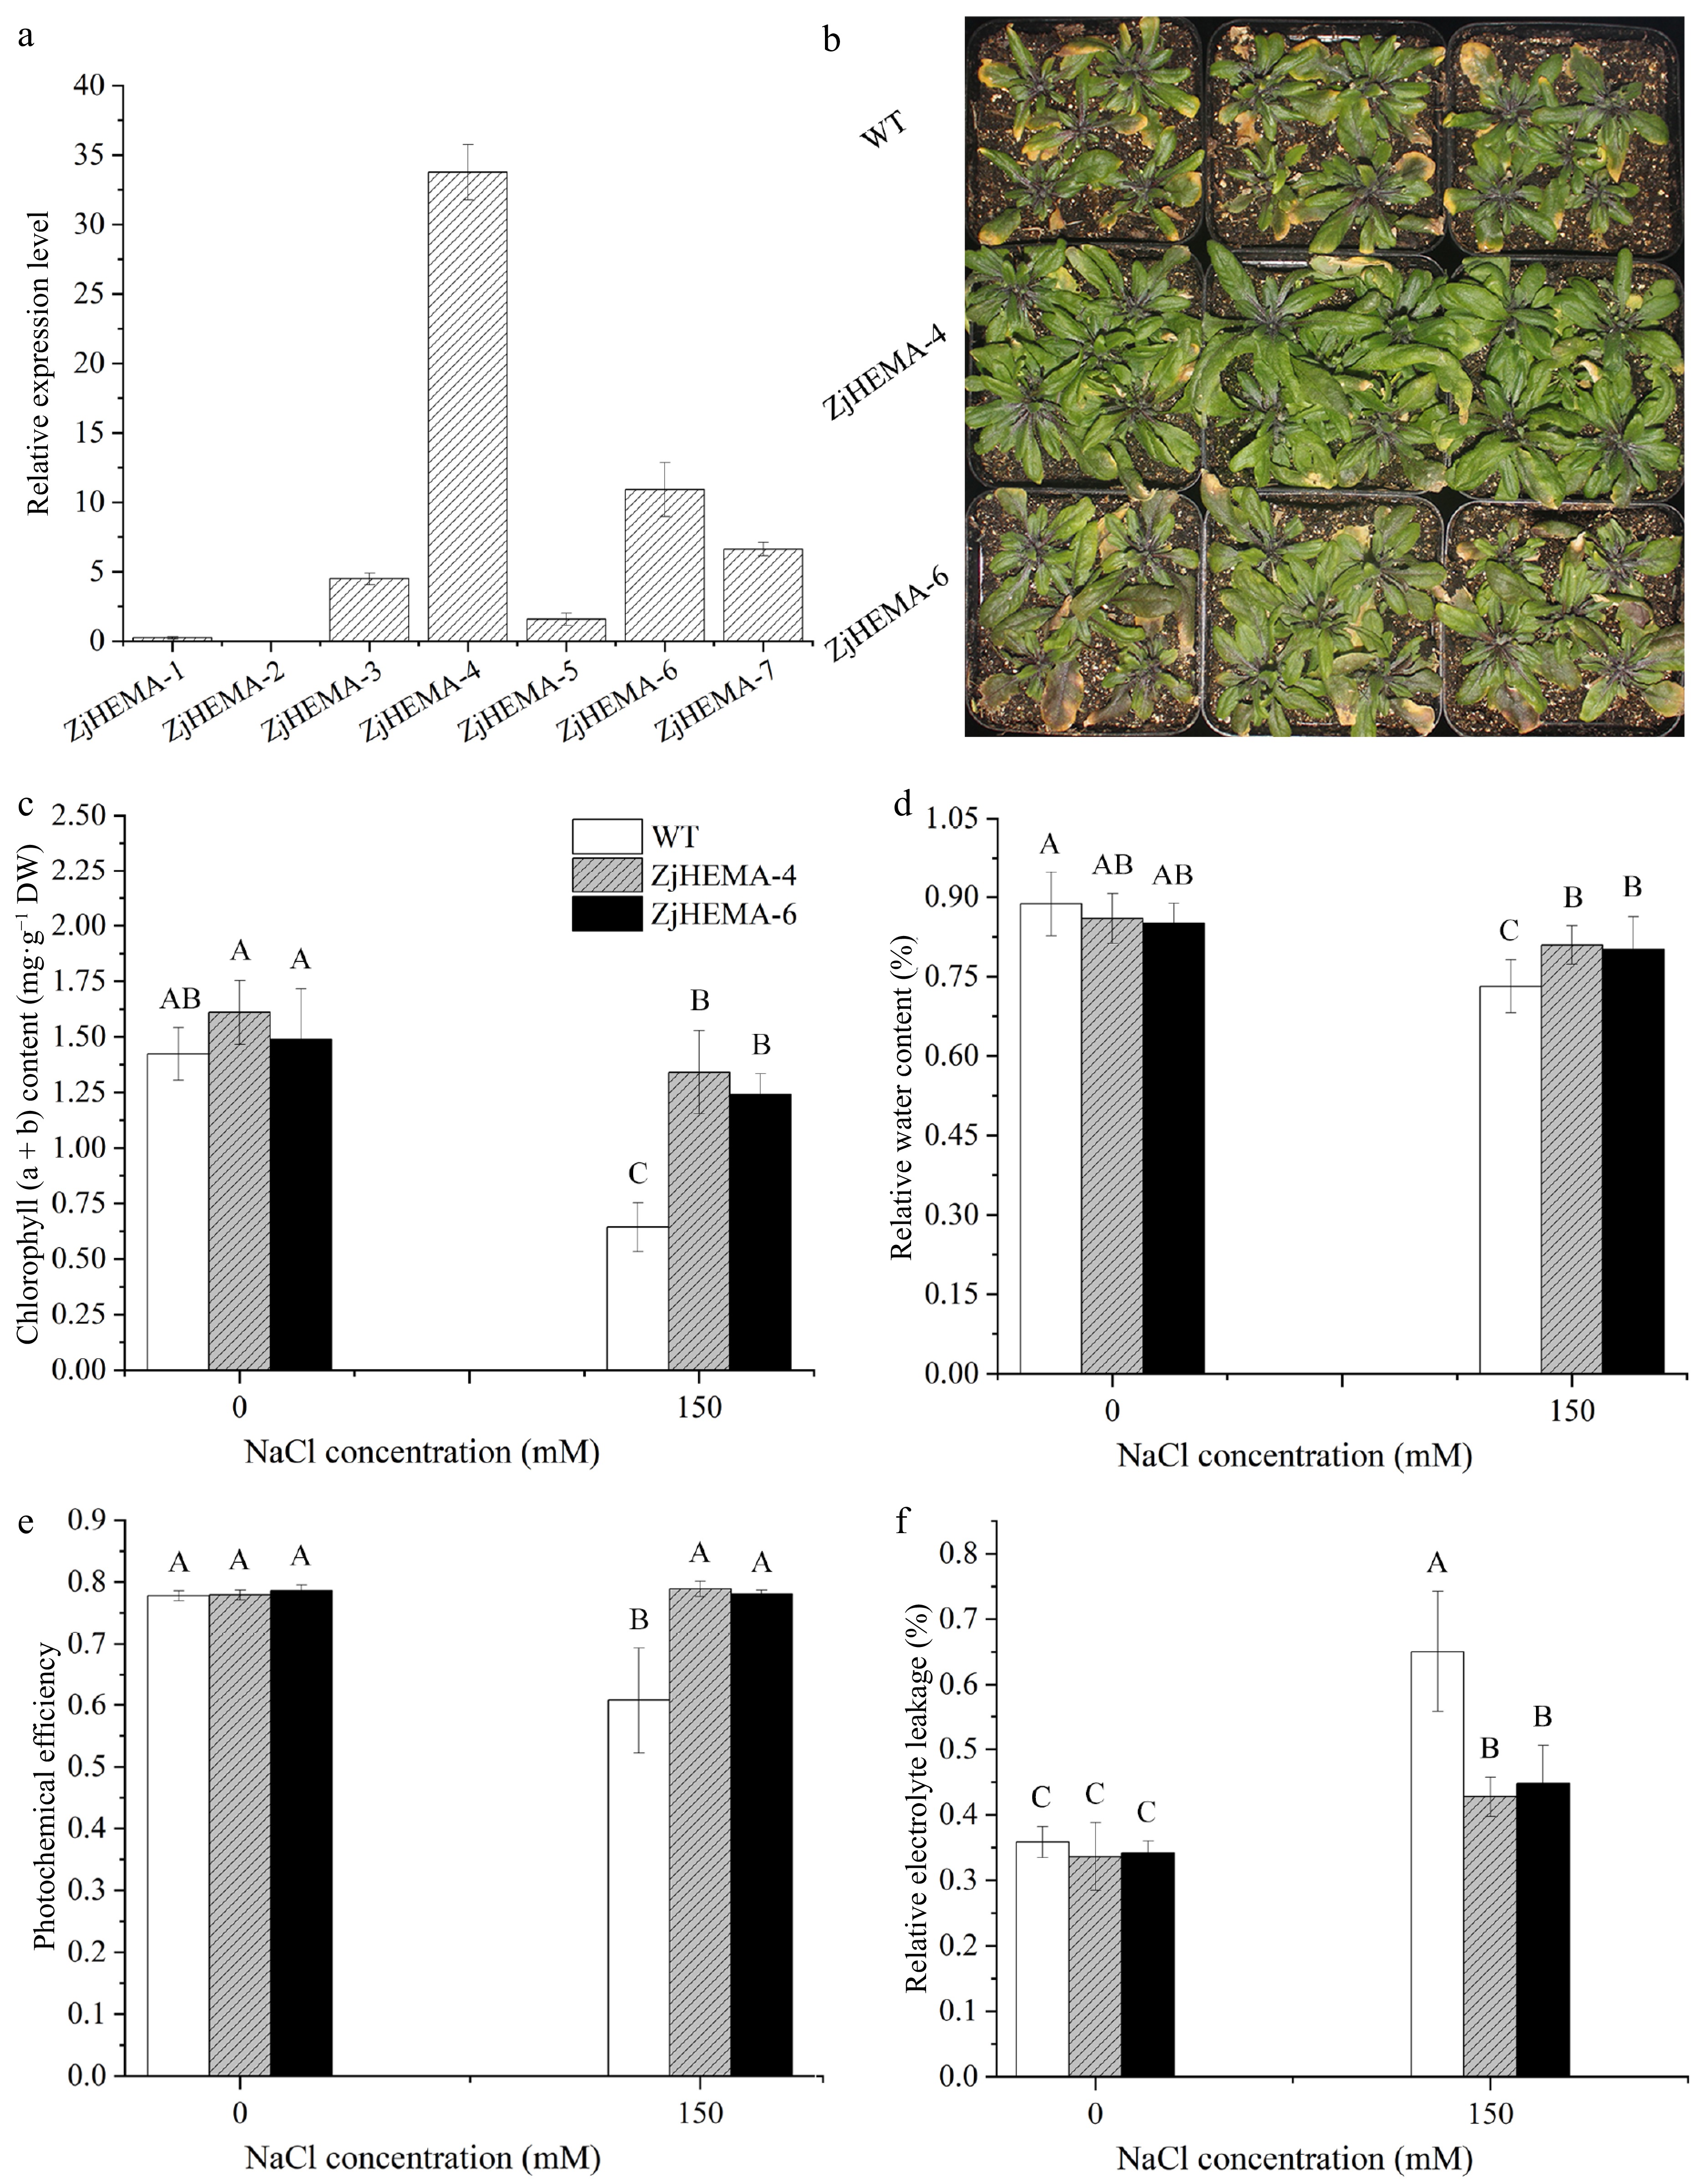
Figure 6.
Morphological and physiological responses of ZjHEMA overexpression Arabidopsis lines under salt stress. (a) Relative expression levels of ZjHEMA in Arabidopsis transgenic lines. AtUBQ served as the endogenous control. (b) Plant morphologies of the WT and ZjHEMA OE lines under salt stress. (c) Chlorophyll (a + b) contents in the WT and ZjHEMA OE lines. (d) RWC of the WT and ZjHEMA OE lines. (e) Fv/Fm ratios of WT and ZjHEMA OE lines. (f) REL of the WT and ZjHEMA OE lines. The values are means ± SD from four replicates. Different uppercase letters indicate significance at p < 0.01.
-
Category Term ST68 + NaCl vs ST68 SS9 + NaCl vs SS9 Name ID Pop hits p-adjust List hits List total p-adjust List hits List total Commonly up-regulated DEGs BP Response to heat GO:0009408 177 1.66E-07 40 2374 2.34E-03 19 1,352 CC Chloroplast GO:0009507 1,999 5.92E-09 273 4.02E-51 283 MF Beta-amylase activity GO:0016161 18 1.40E-07 10 1.62E-02 3 Commonly down-regulated DEGs BP Response to chitin GO:0010200 170 1.08E-18 55 1,992 2.25E-05 33 1,978 CC Integral component of membrane GO:0016021 4,892 1.49E-13 542 5.15E-22 579 MF Serine/threonine kinase activity GO:0004674 611 7.06E-07 90 1.65E-03 76 Table 1.
GO terms enriched for DEGs common to SS9 and ST68 in response to salt stress.
-
Category GO term ID Pop hits Adjusted p-value List hits List total Uniquely up-regulated DEGs BP Photosynthesis GO:0015979 112 1.44E-15 45 2,568 CC Chloroplast thylakoid GO:0009535 400 2.06E-12 93 MF Chlorophyll binding GO:0016168 35 3.79E-07 16 Uniquely down-regulated DEGs BP L-phenylalanine catabolic process GO:0006559 24 3.50E-08 15 3,143 CC Integral component of membrane GO:0016021 4,892 1.31E-08 769 MF Phenylalanine ammonia-lyase activity GO:0045548 18 3.95E-06 11 Table 2.
GO terms enriched for DEGs unique to each Zoysiagrass line in response to salt stress.
-
Pathway
IDPathway term Associated genes number Enrichment score Adjusted
p-valueko00195 Photosynthesis 42 2.490597262 8.70494E-10 ko00760 Nicotinate and nicotinamide metabolism 16 2.424708445 0.000766994 ko00680 Methane metabolism 39 1.67974868 0.002913442 ko00860 Porphyrin and chlorophyll metabolism 30 1.753583786 0.00503669 ko00196 Photosynthesis-antenna proteins 15 2.116394225 0.00671243 ko00520 Amino sugar and nucleotide sugar metabolism 76 1.394479184 0.00671243 ko00500 Starch and sucrose metabolism 109 1.307902668 0.008129324 ko00480 Glutathione metabolism 53 1.417384716 0.021540316 ko00471 D-Glutamine and D-glutamate metabolism 3 3.068771626 0.046258729 ko00514 Other types of O-glycan biosynthesis 4 2.727797001 0.048753999 ko00902 Monoterpenoid biosynthesis 9 2.045847751 0.048753999 Table 3.
KEGG enrichment analysis for DEGs of two Zoysiagrass germplasm accessions under salt stress.
Figures
(6)
Tables
(3)