-
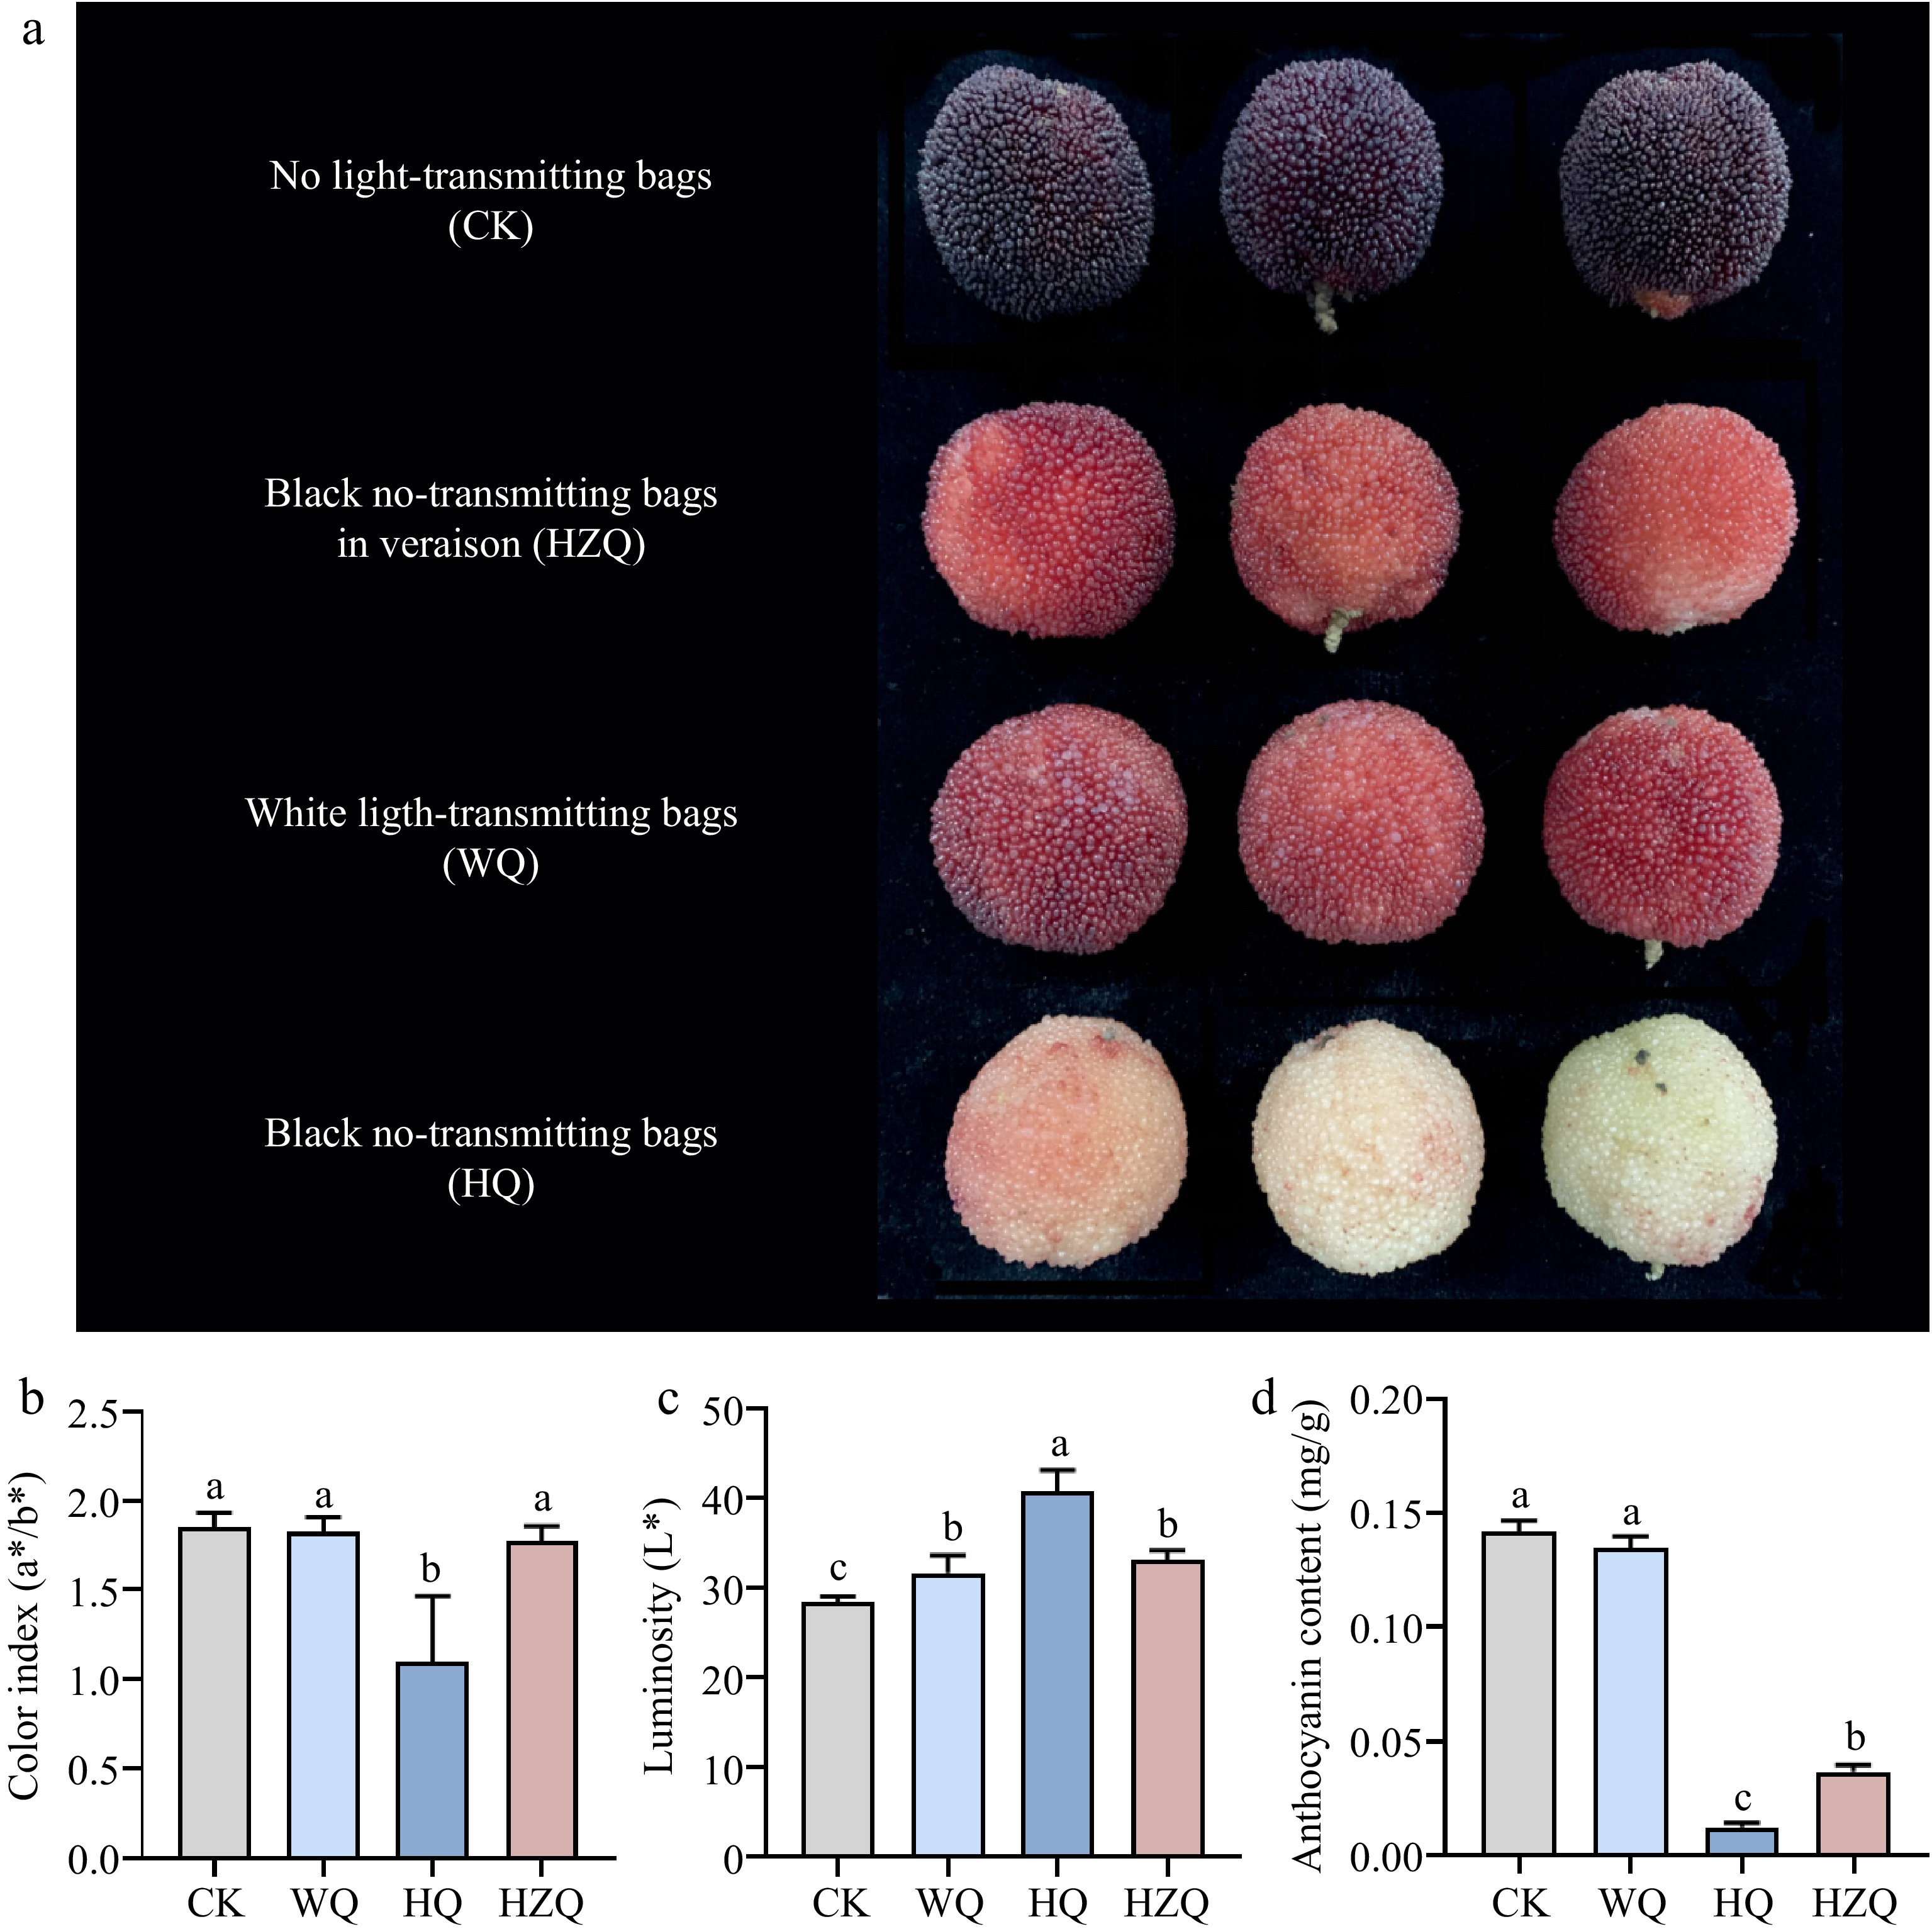
Figure 1.
(a), (b) Effect of fruit color, (c) luminosity, and (d) anthocyanin in mature Chinese bayberry after treatment with different light-transmitting bags. Bars represent the mean and standard error of three independently transformed biological replicates (n = 3). Different letters indicate statistically significant difference in one-way ANOVA analysis (p < 0.05). HQ: Blank-no-transmitting bag treatment; WQ: white-light treatment.
-
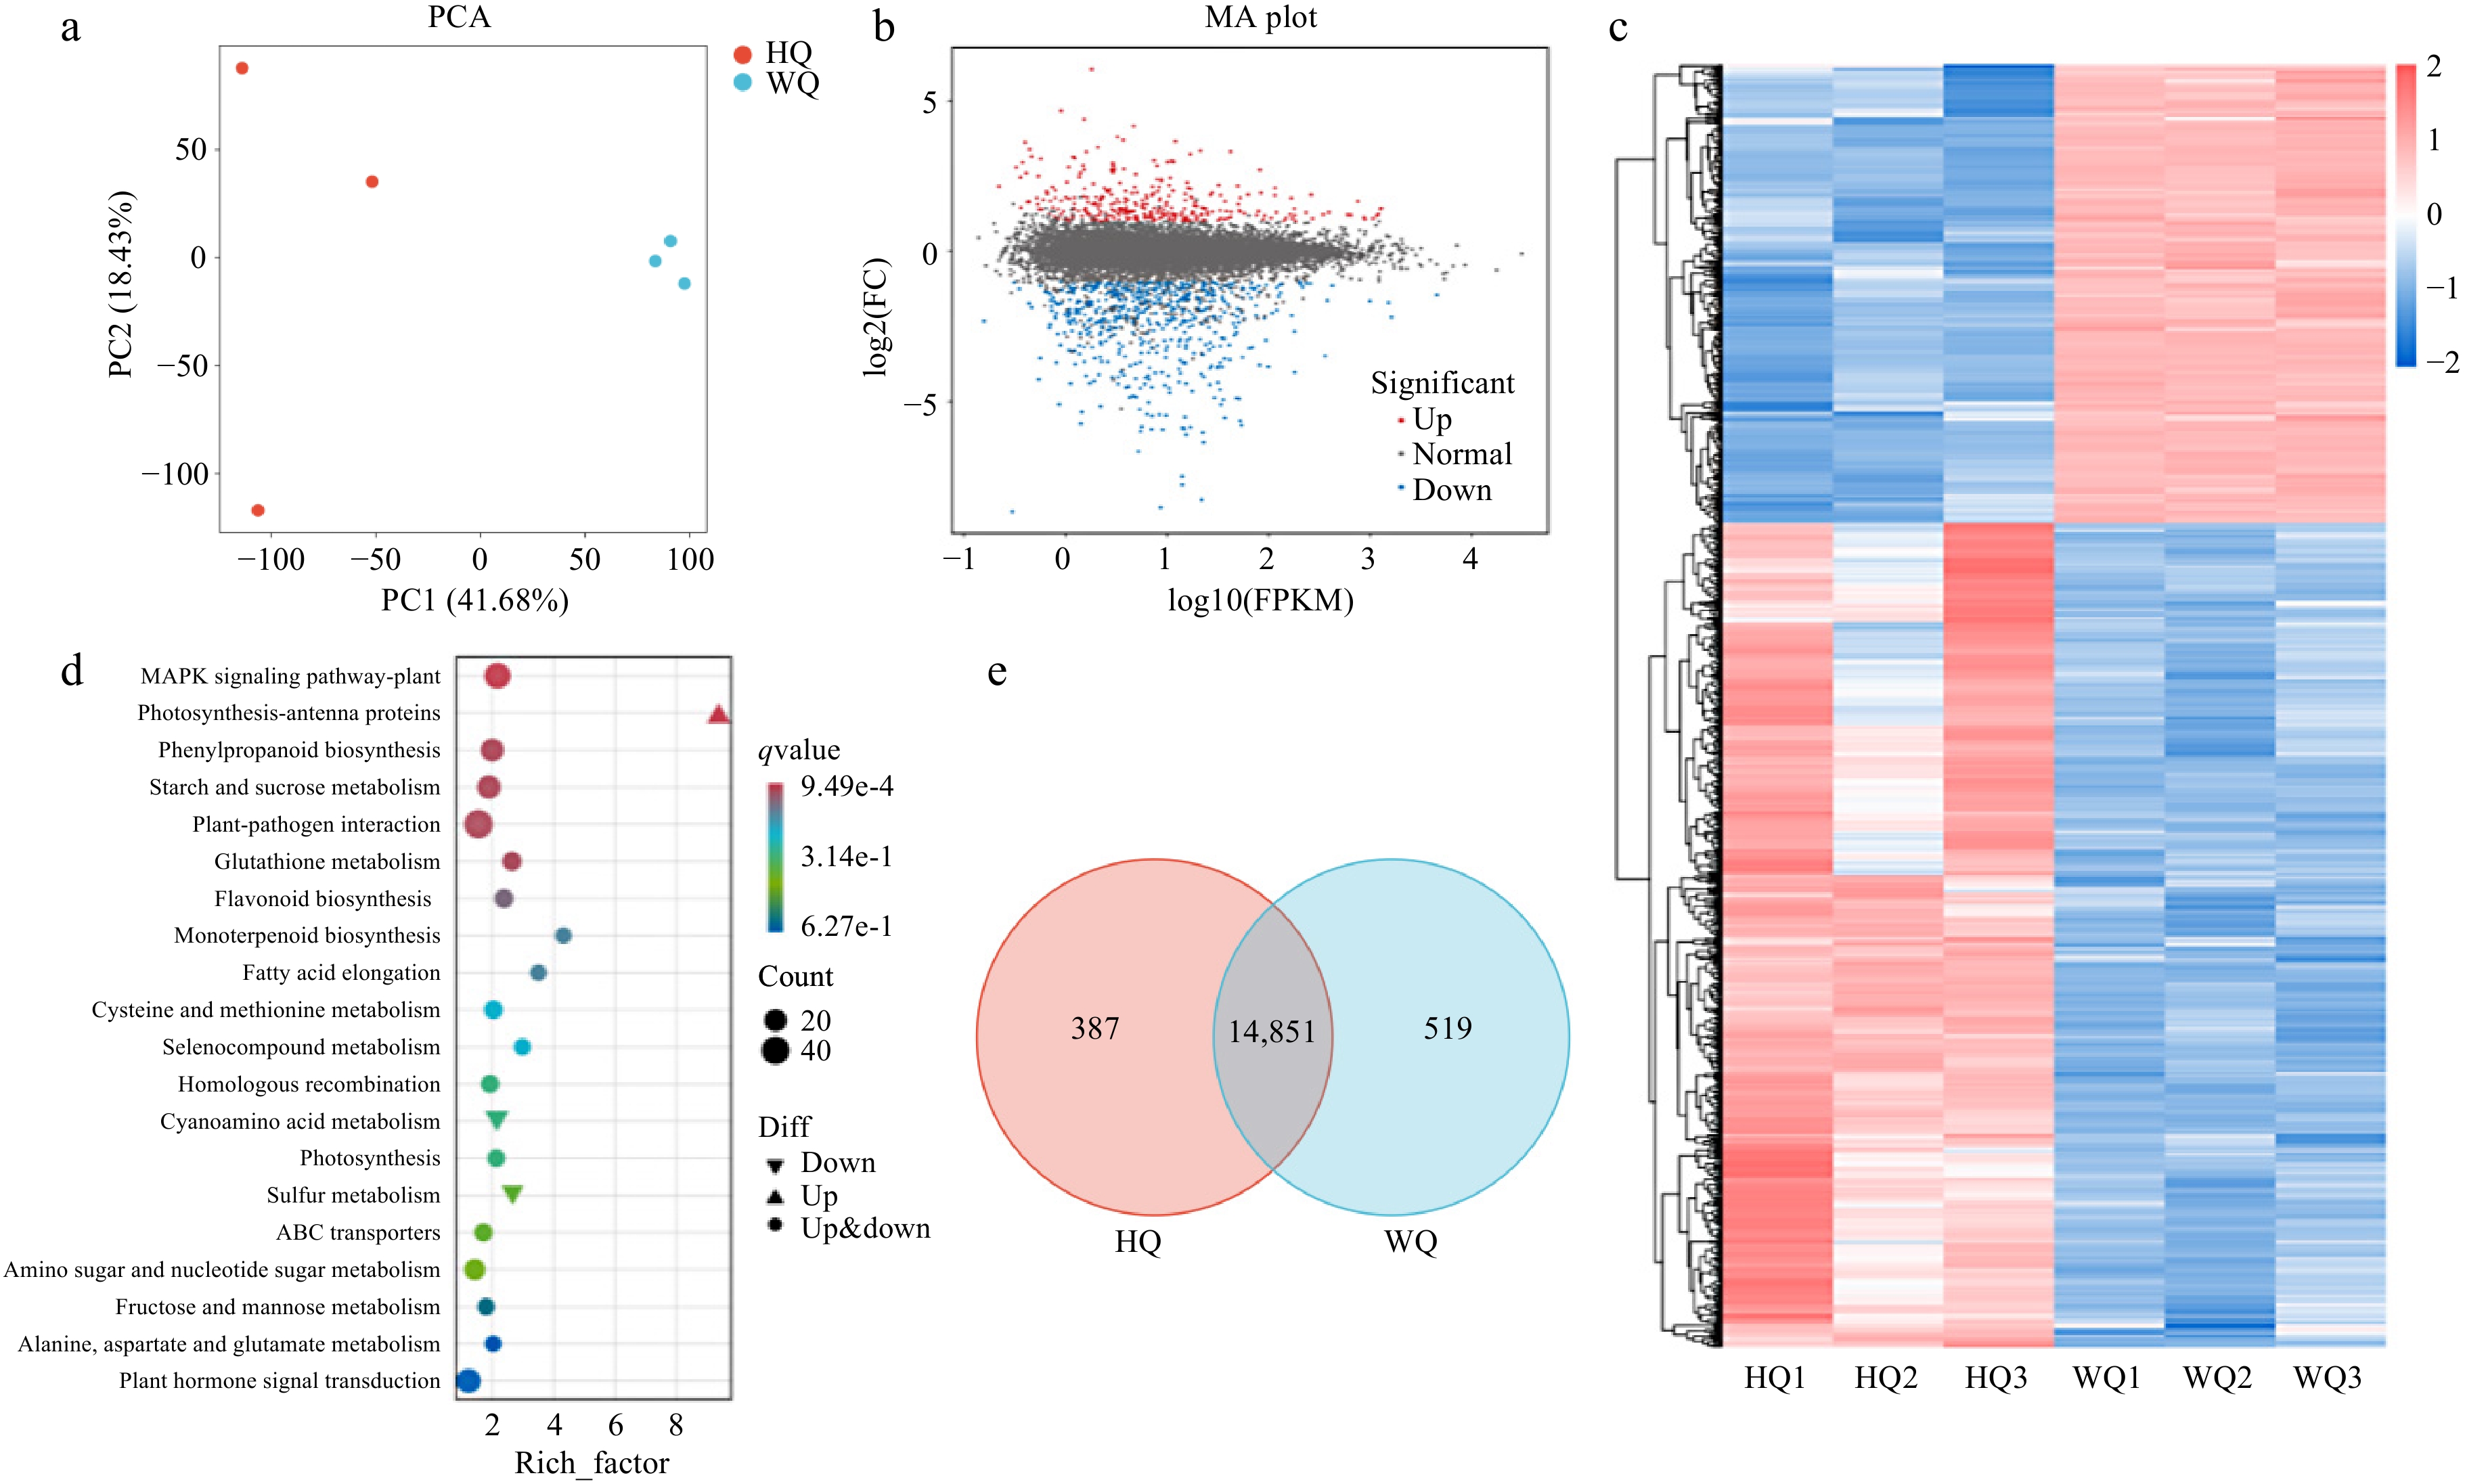
Figure 2.
Transcriptome analysis of Chinese bayberry bagged with two light-transmitting bags. (a) PCA analysis, (b) volcano plot (c) heatmap clustering, (d) KEGG analysis, and (e) Venn analysis the treatments with black no-transmitting bags (HQ) and transmitting bags during (WQ).
-
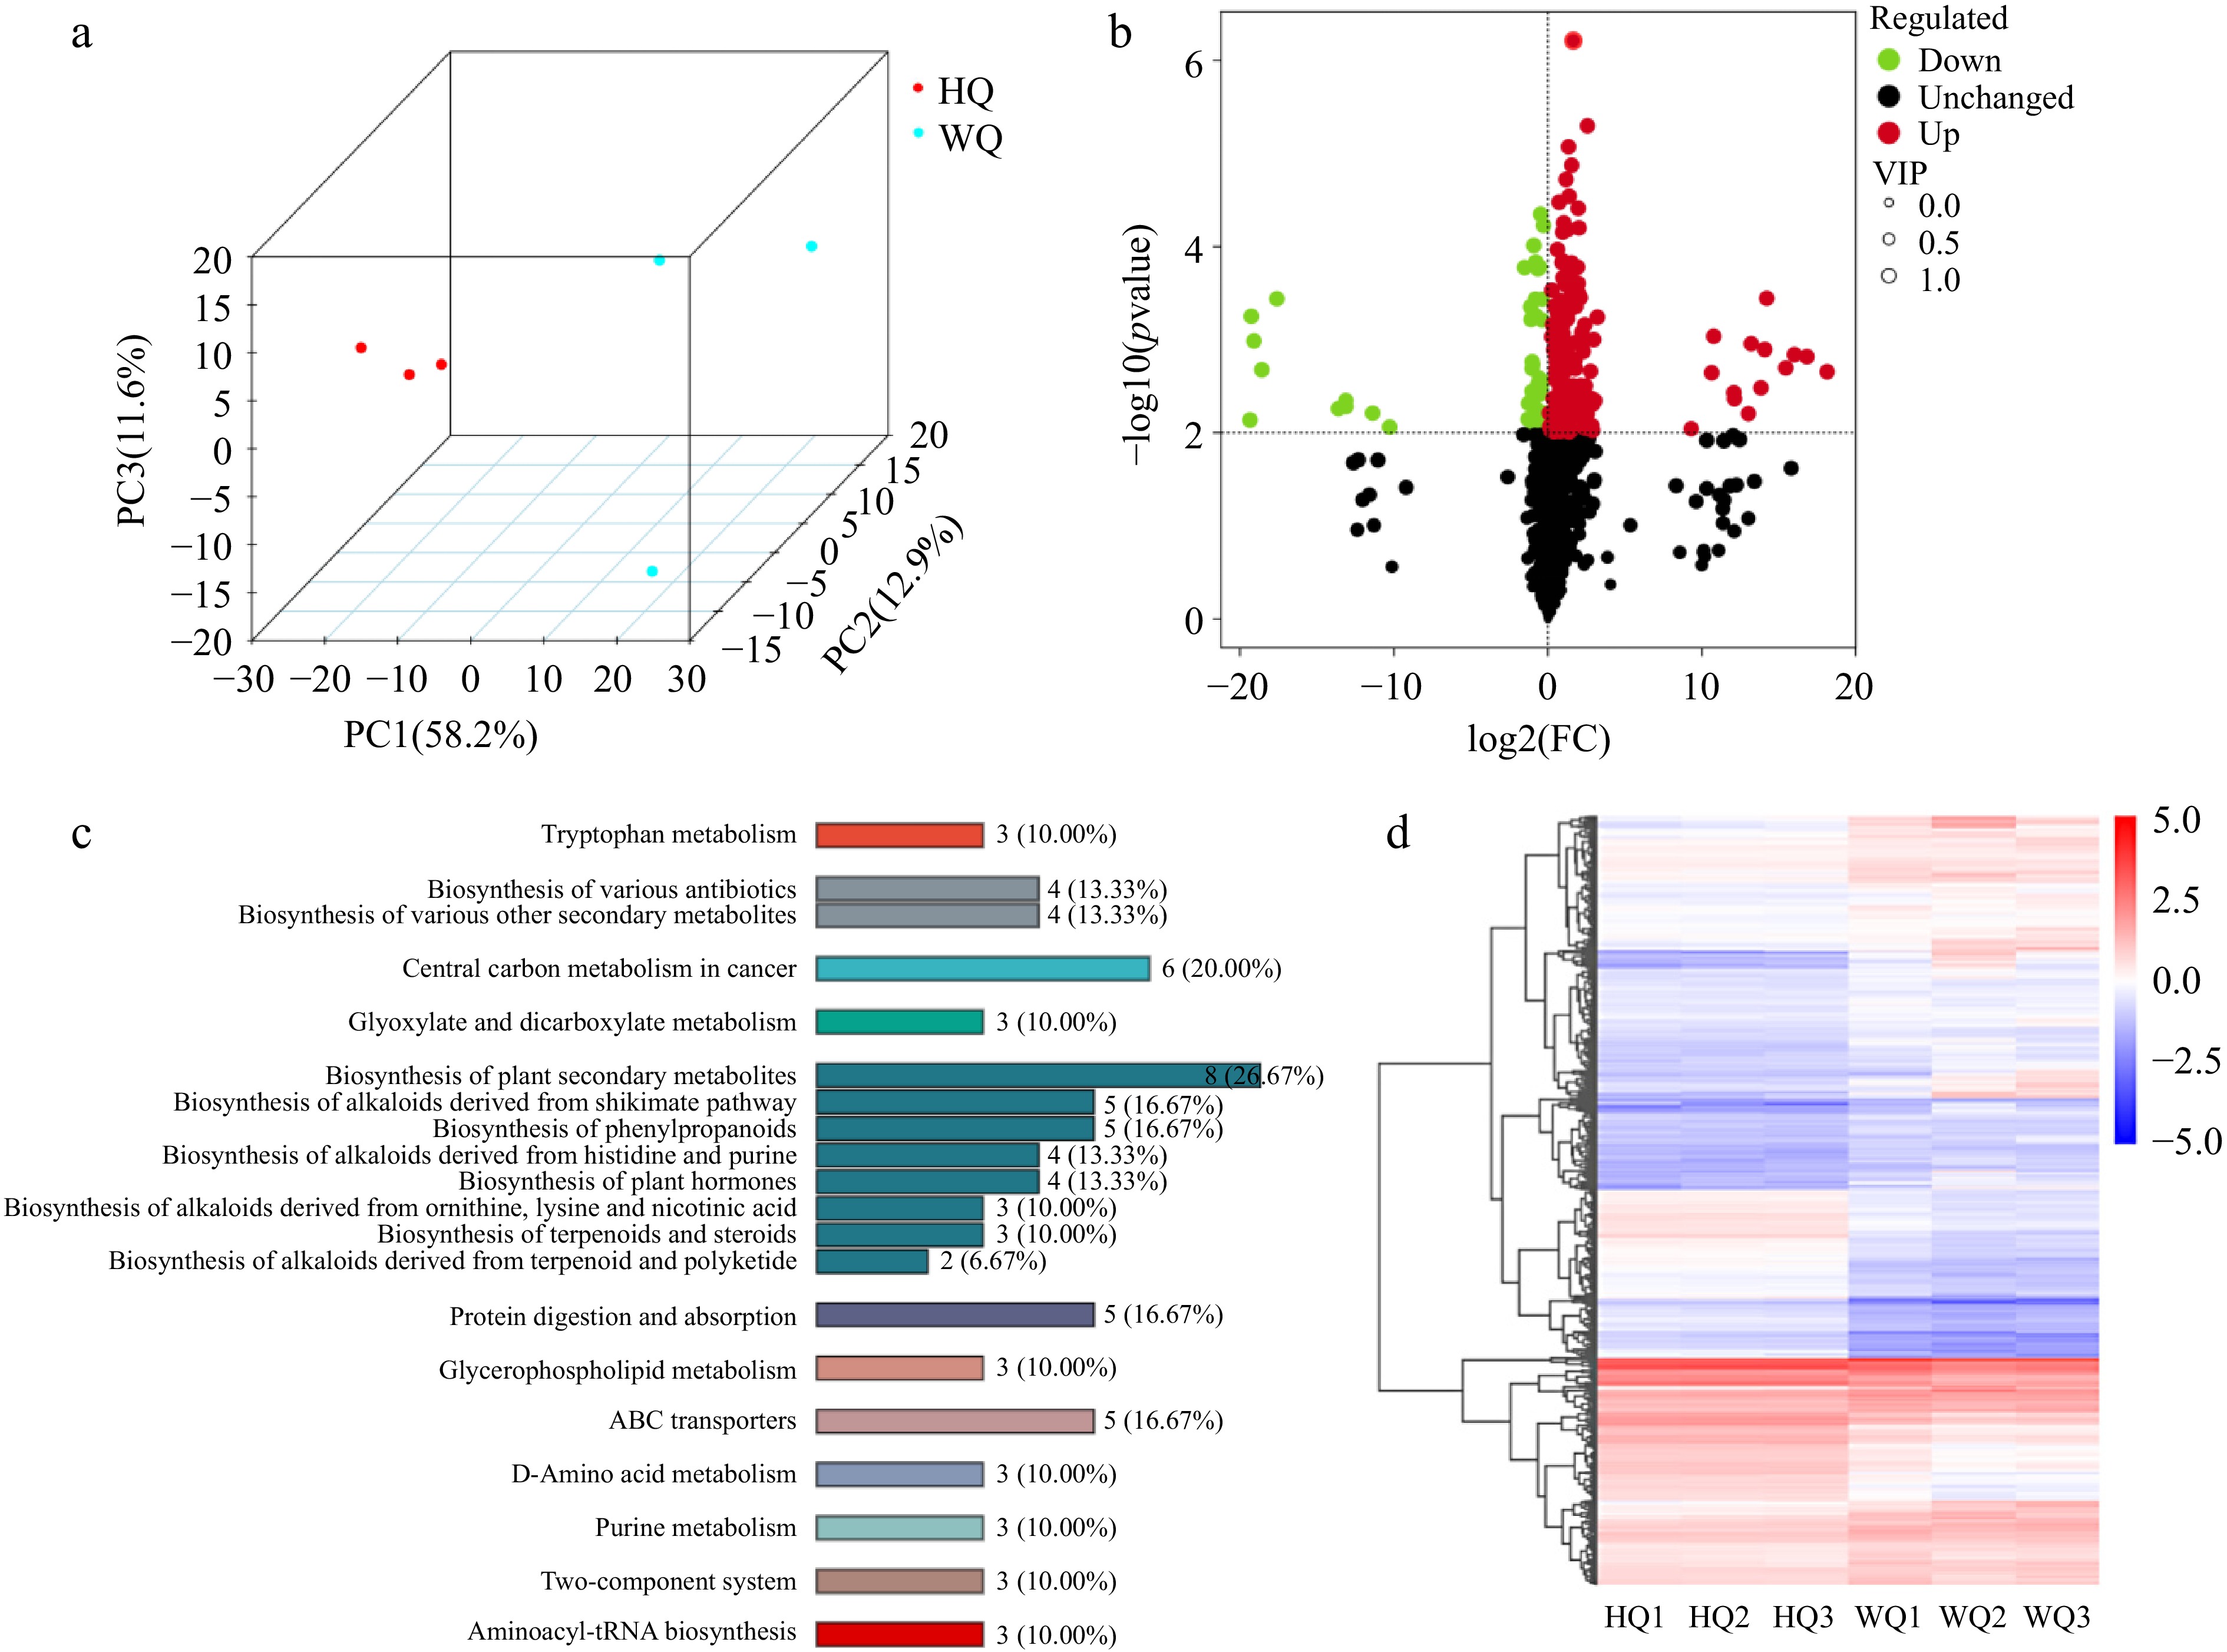
Figure 3.
Metabolism analysis of Chinese bayberry bagged with two light-transmitting bags. (a) PCA analysis, (b) volcano plot, (c) KEGG analysis, and (d) heatmap clustering analysis the treatments with black no-transmitting bags (HQ) and transmitting bags during (WQ).
-
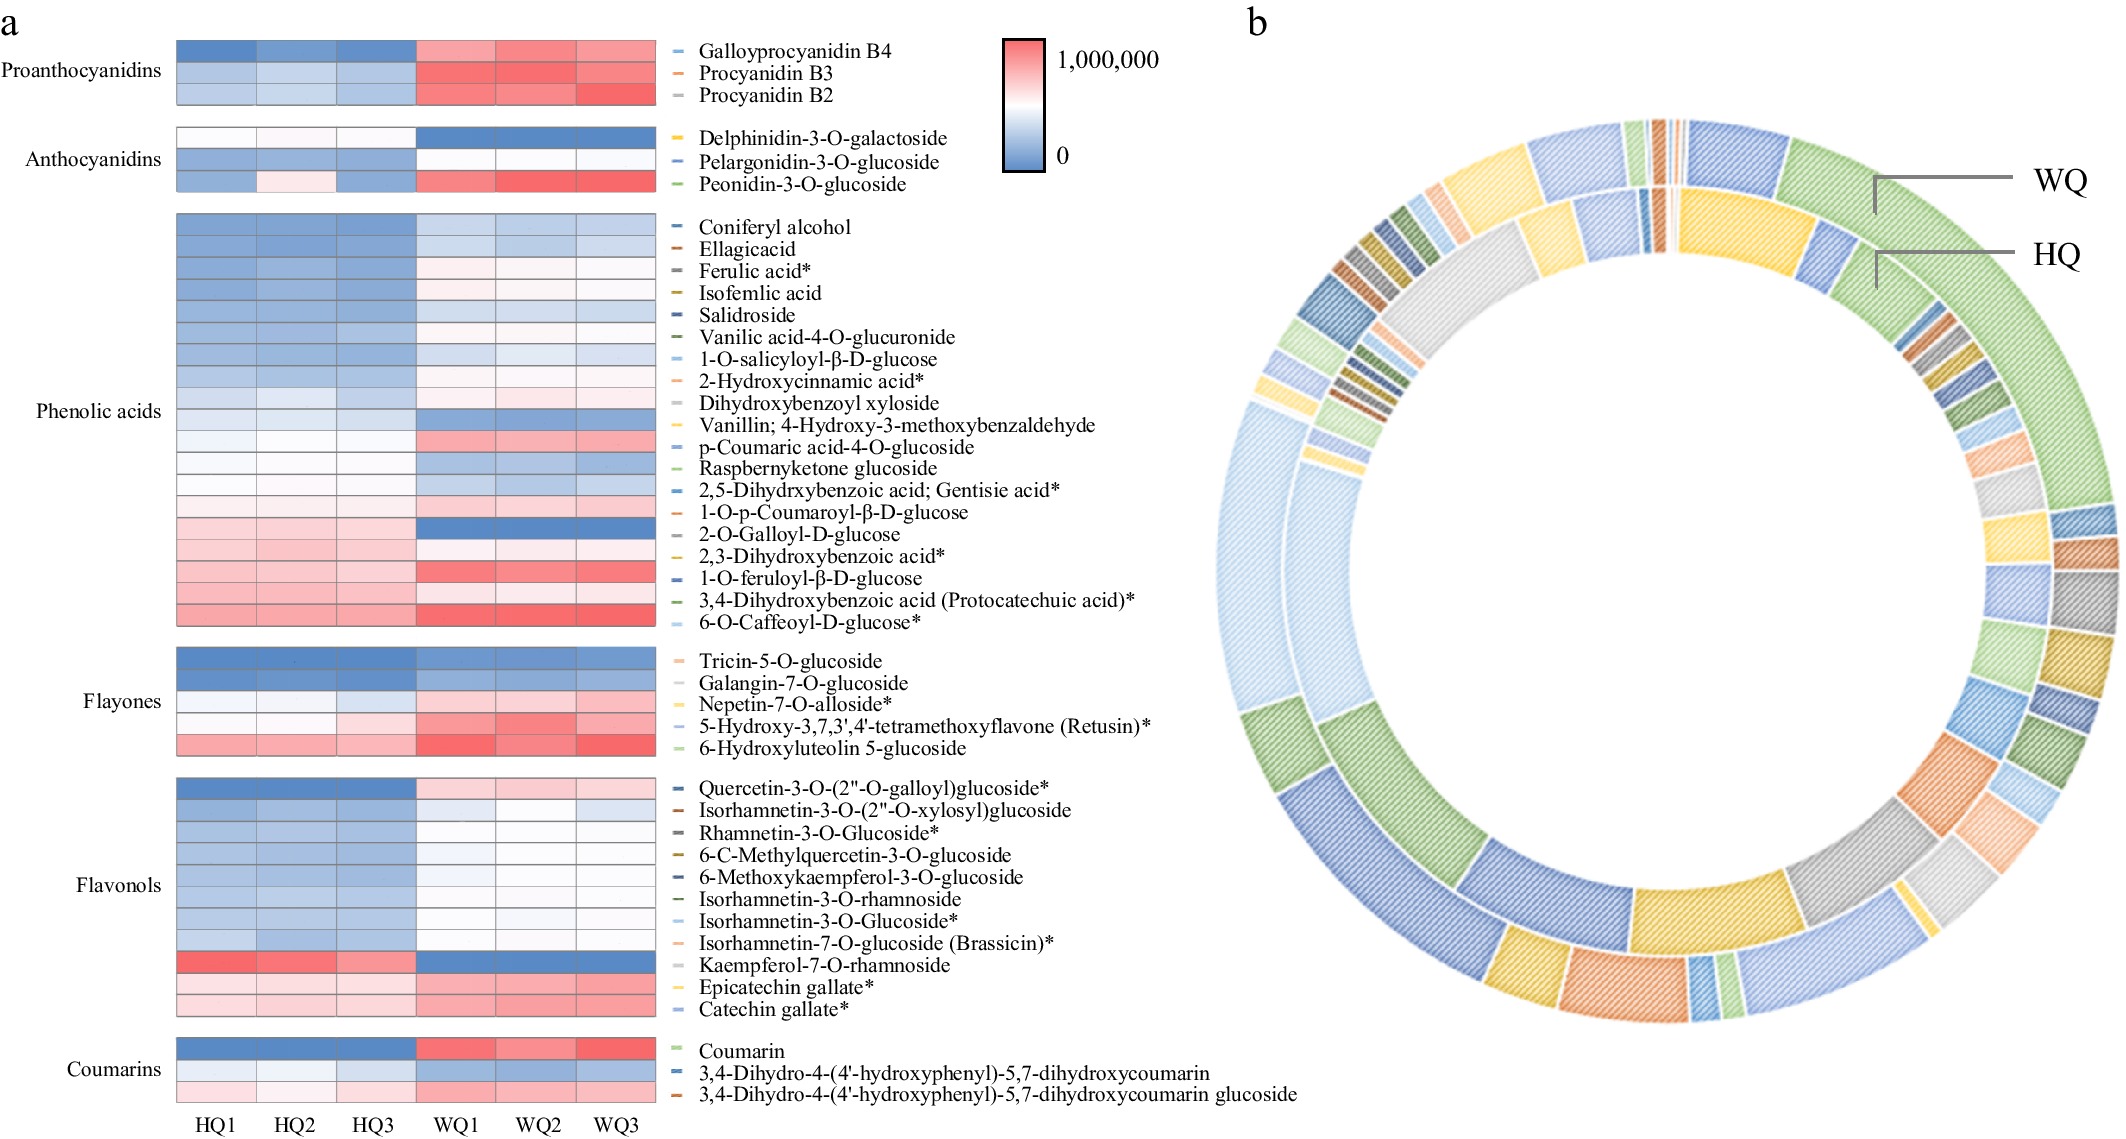
Figure 4.
Cyanidin profiles in Chinese bayberry fruit treated with bags of varying light transmittance. (a) A visual heat map of cyanidins in Chinese bayberry fruit. Metabolite content is represented by peak area values. (b) Differences in cyanidin content in Chinese bayberry fruit subjected to different bagging treatments.
-
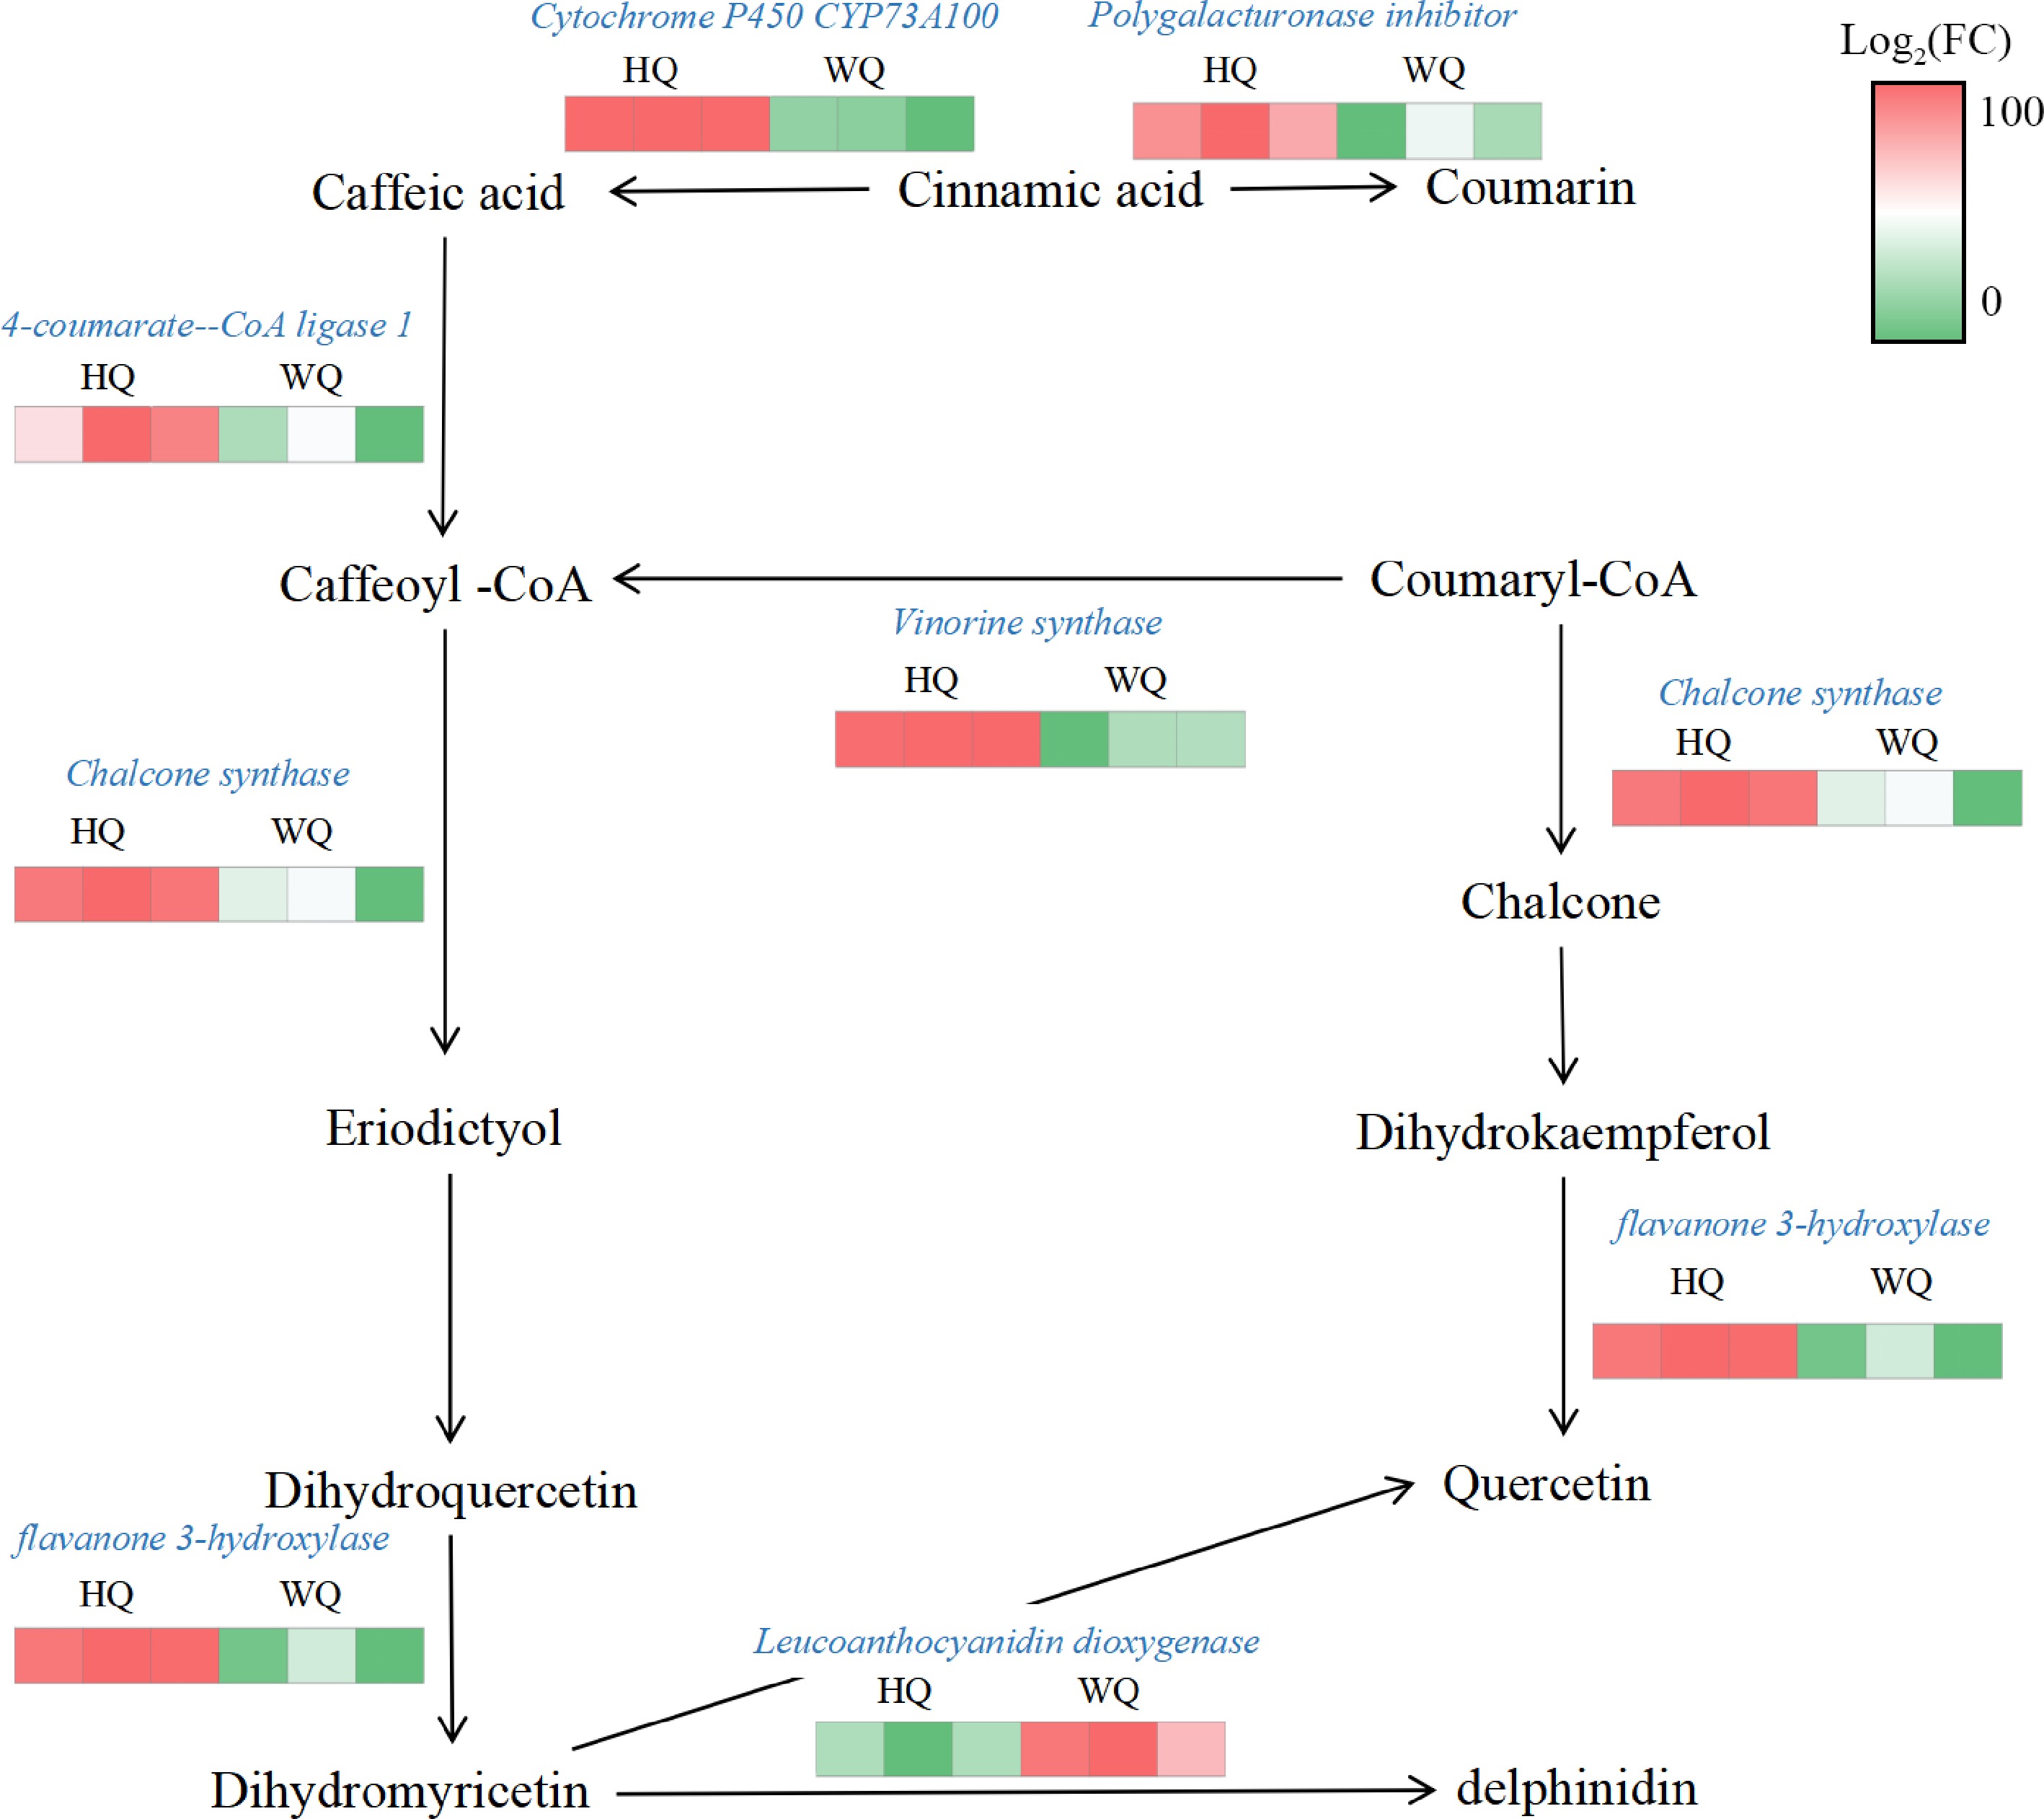
Figure 5.
Transcriptome analysis of the expression patterns of anthocyanin-related genes. HQ: black no-transmitting bags, WQ: transmitting bagsduring. Green to red color indicate the gene expression increasing abundance.
-
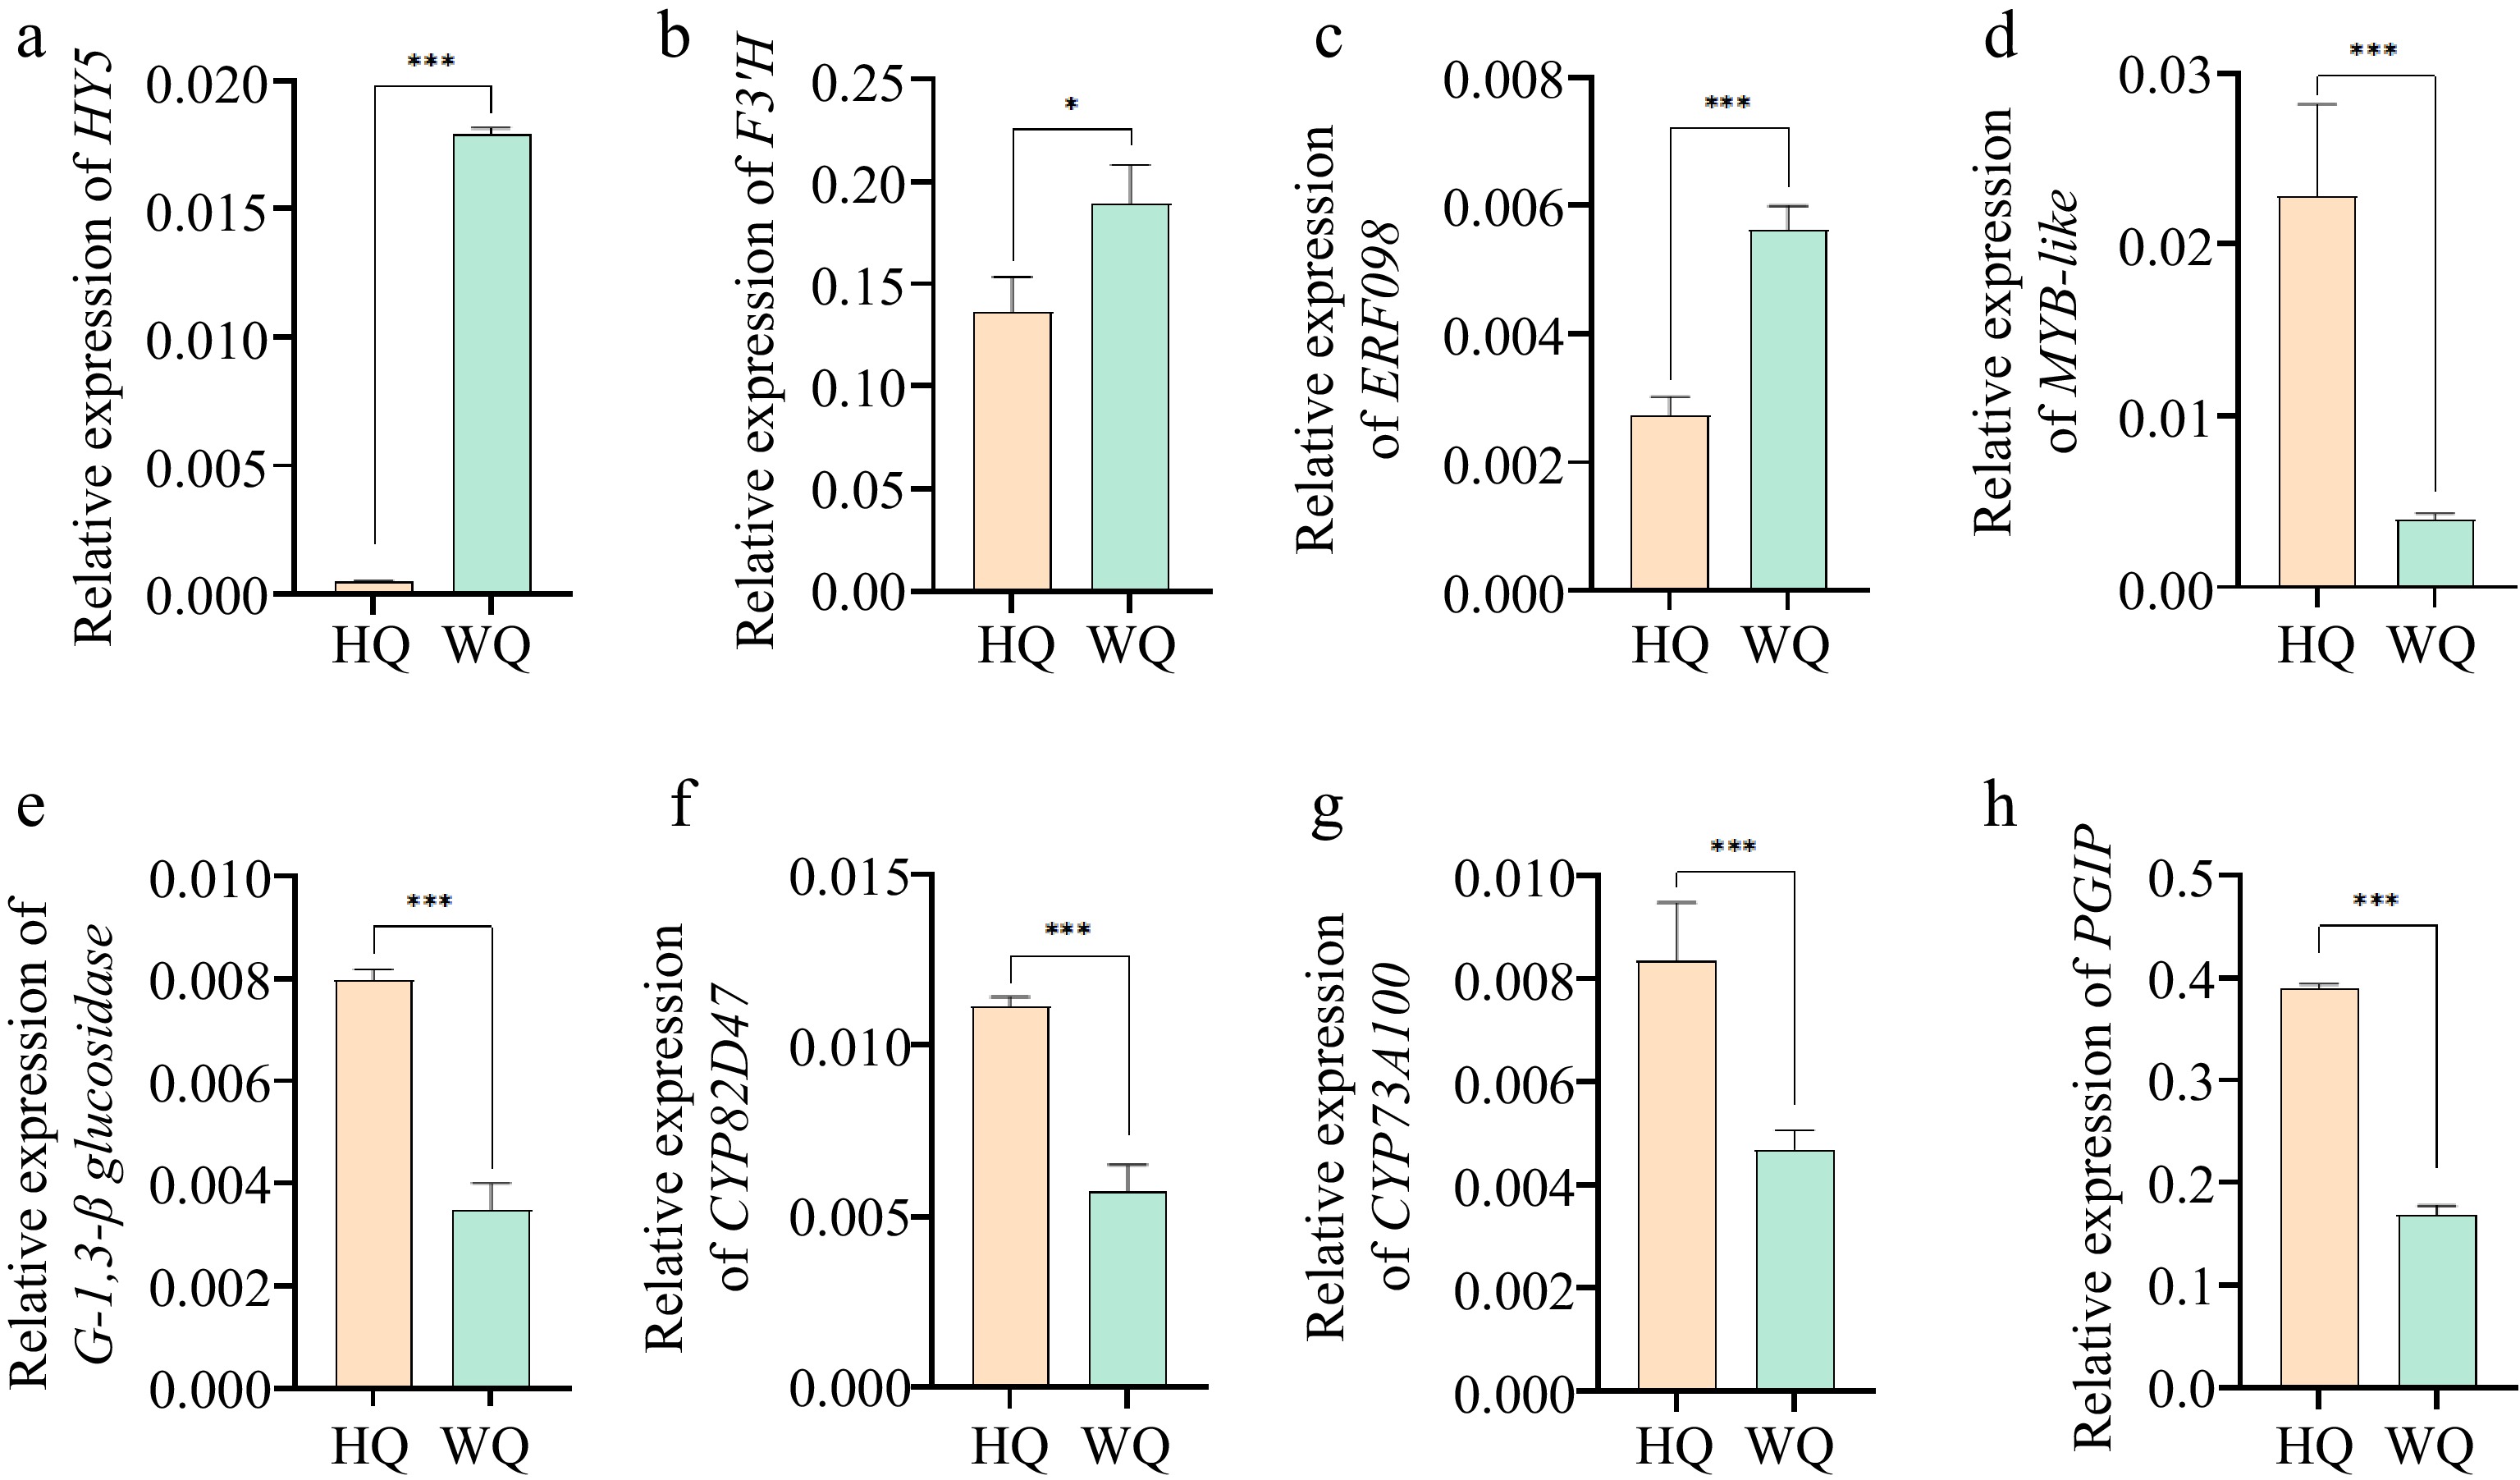
Figure 6.
qRT-PCR analysis of the expression levels of DEGs identified from RNA-Seq. (a) HY5: Transcription factor HY5; (b) F3'H: flavonol synthase; (c) ERF098: Ethylene-responsive transcription factor ERF098; (d) MYB/DF1: MYB-like protein; (e) G-1,3-β-glucosidase: Glucan endo-1,3-beta-glucosidase; (f) CYP82D47: Cytochrome P450 CYP82D47; (g) CYP73A100: Cytochrome P450 CYP73A100; (h) PGIP: Polygalacturonase inhibitor. Error bars indicate standard error from three biological replicates (n = 3). Asterisks indicate a statistically significant difference in one-way ANOVA analysis (* p < 0.05, ** p < 0.01, *** p < 0.001).
-

Figure 7.
The correlation between light-regulated anthocyanins through integrated transcriptome and metabolomics data. Pentagons represent metabolites, triangles denote genes, circles indicate microorganisms, and proteins are depicted as rectangles. Microorganisms can be classified at various taxonomic levels, such as the genus level. If metabolites have specific names, these names are used in place of identifiers. Red lines signify positive correlations, while green lines indicate negative correlations; the thicker the line, the stronger the correlation.
Figures
(7)
Tables
(0)