-
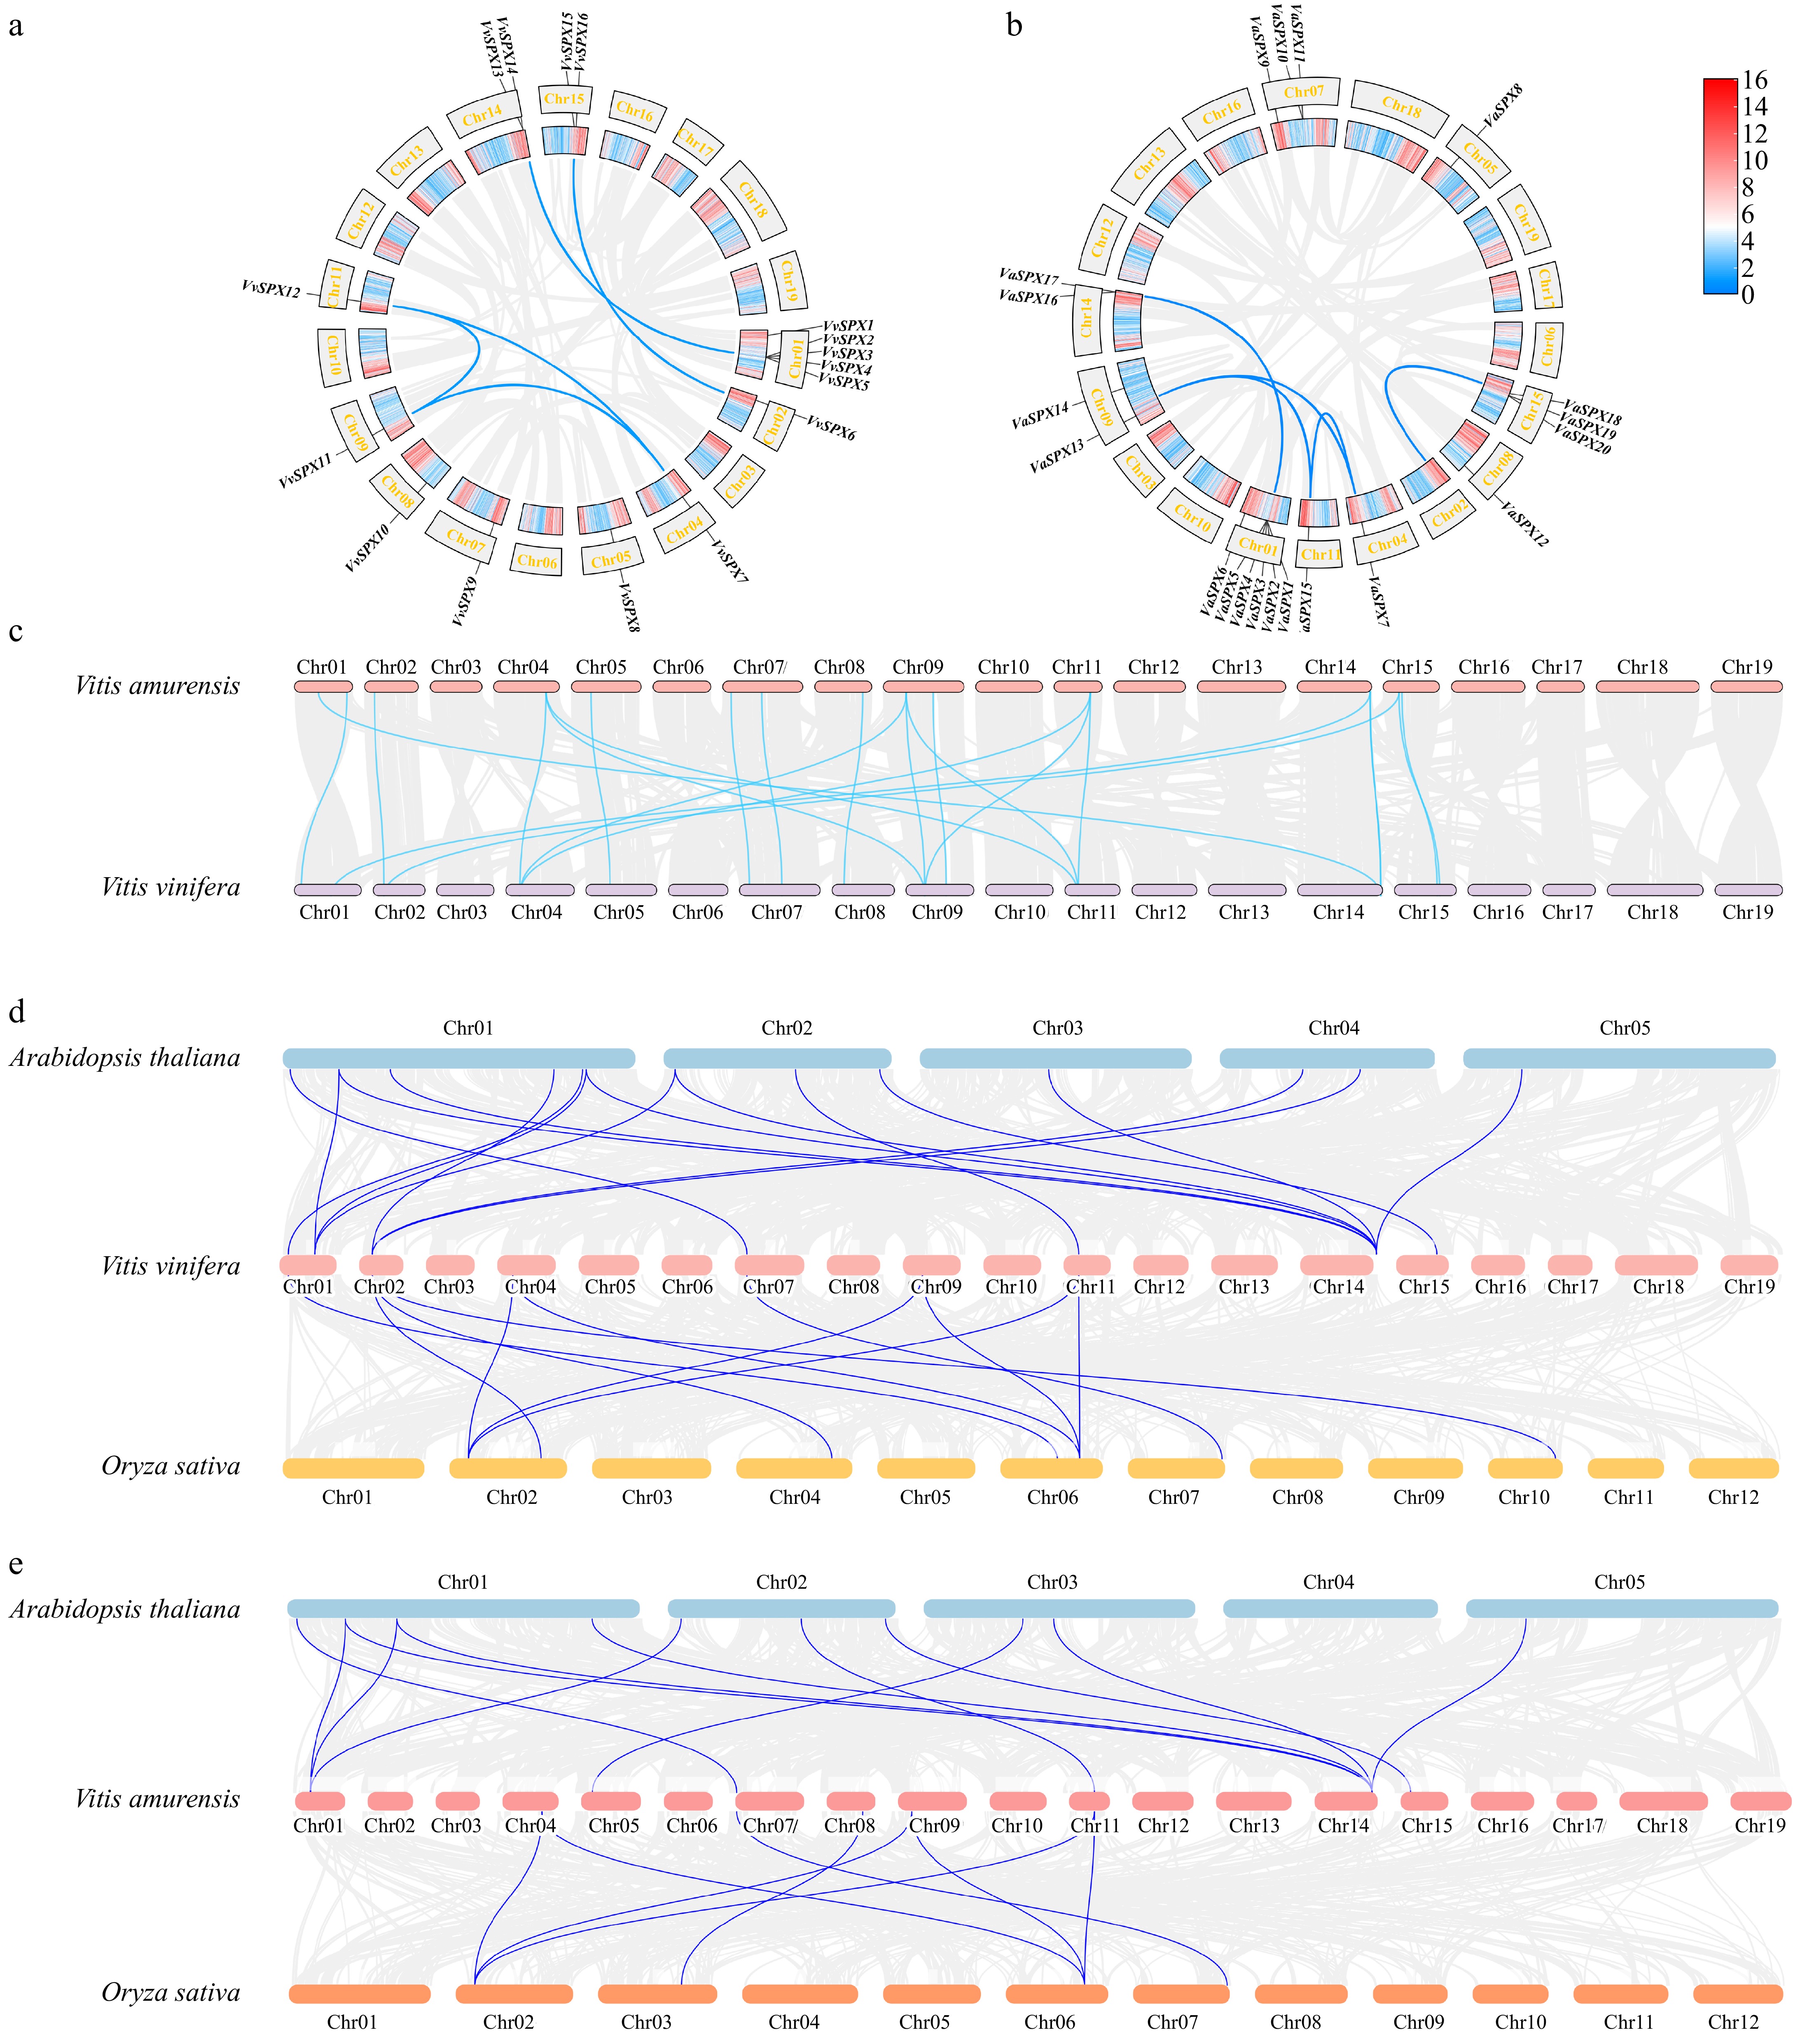
Figure 1.
Analysis of collinearity within VvSPX and VaSPX species. (a) Collinearity analysis within V. vinifera species. (b) Collinearity analysis within V. amurensis species. The gray line represents all collinear blocks in the V. vinifera and V. amurensis genomes, and the blue line represents gene pairs between VvSPX and VaSPX genes. (c) Colinearity analysis between V. vinifera and V. amurensis SPX genomes. (d) Colinearity analysis of SPX genes in V. vinifera, Arabidopsis, and Oryza sativa. Collinearity between the genomes of V. vinifera, Arabidopsis, and Oryza sativa is depicted by the gray lines in the backdrop. The blue lines show the collinearity between the VvSPX gene, Arabidopsis, and Oryza sativa. (e) Colinearity analysis of SPX genes in V. amurensis, Arabidopsis, and Oryza sativa. The gray lines in the background show the collinearity between the genomes of V. amurensis, Arabidopsis, and Oryza sativa. The blue lines show the collinearity between the VaSPX gene, Arabidopsis, and Oryza sativa.
-
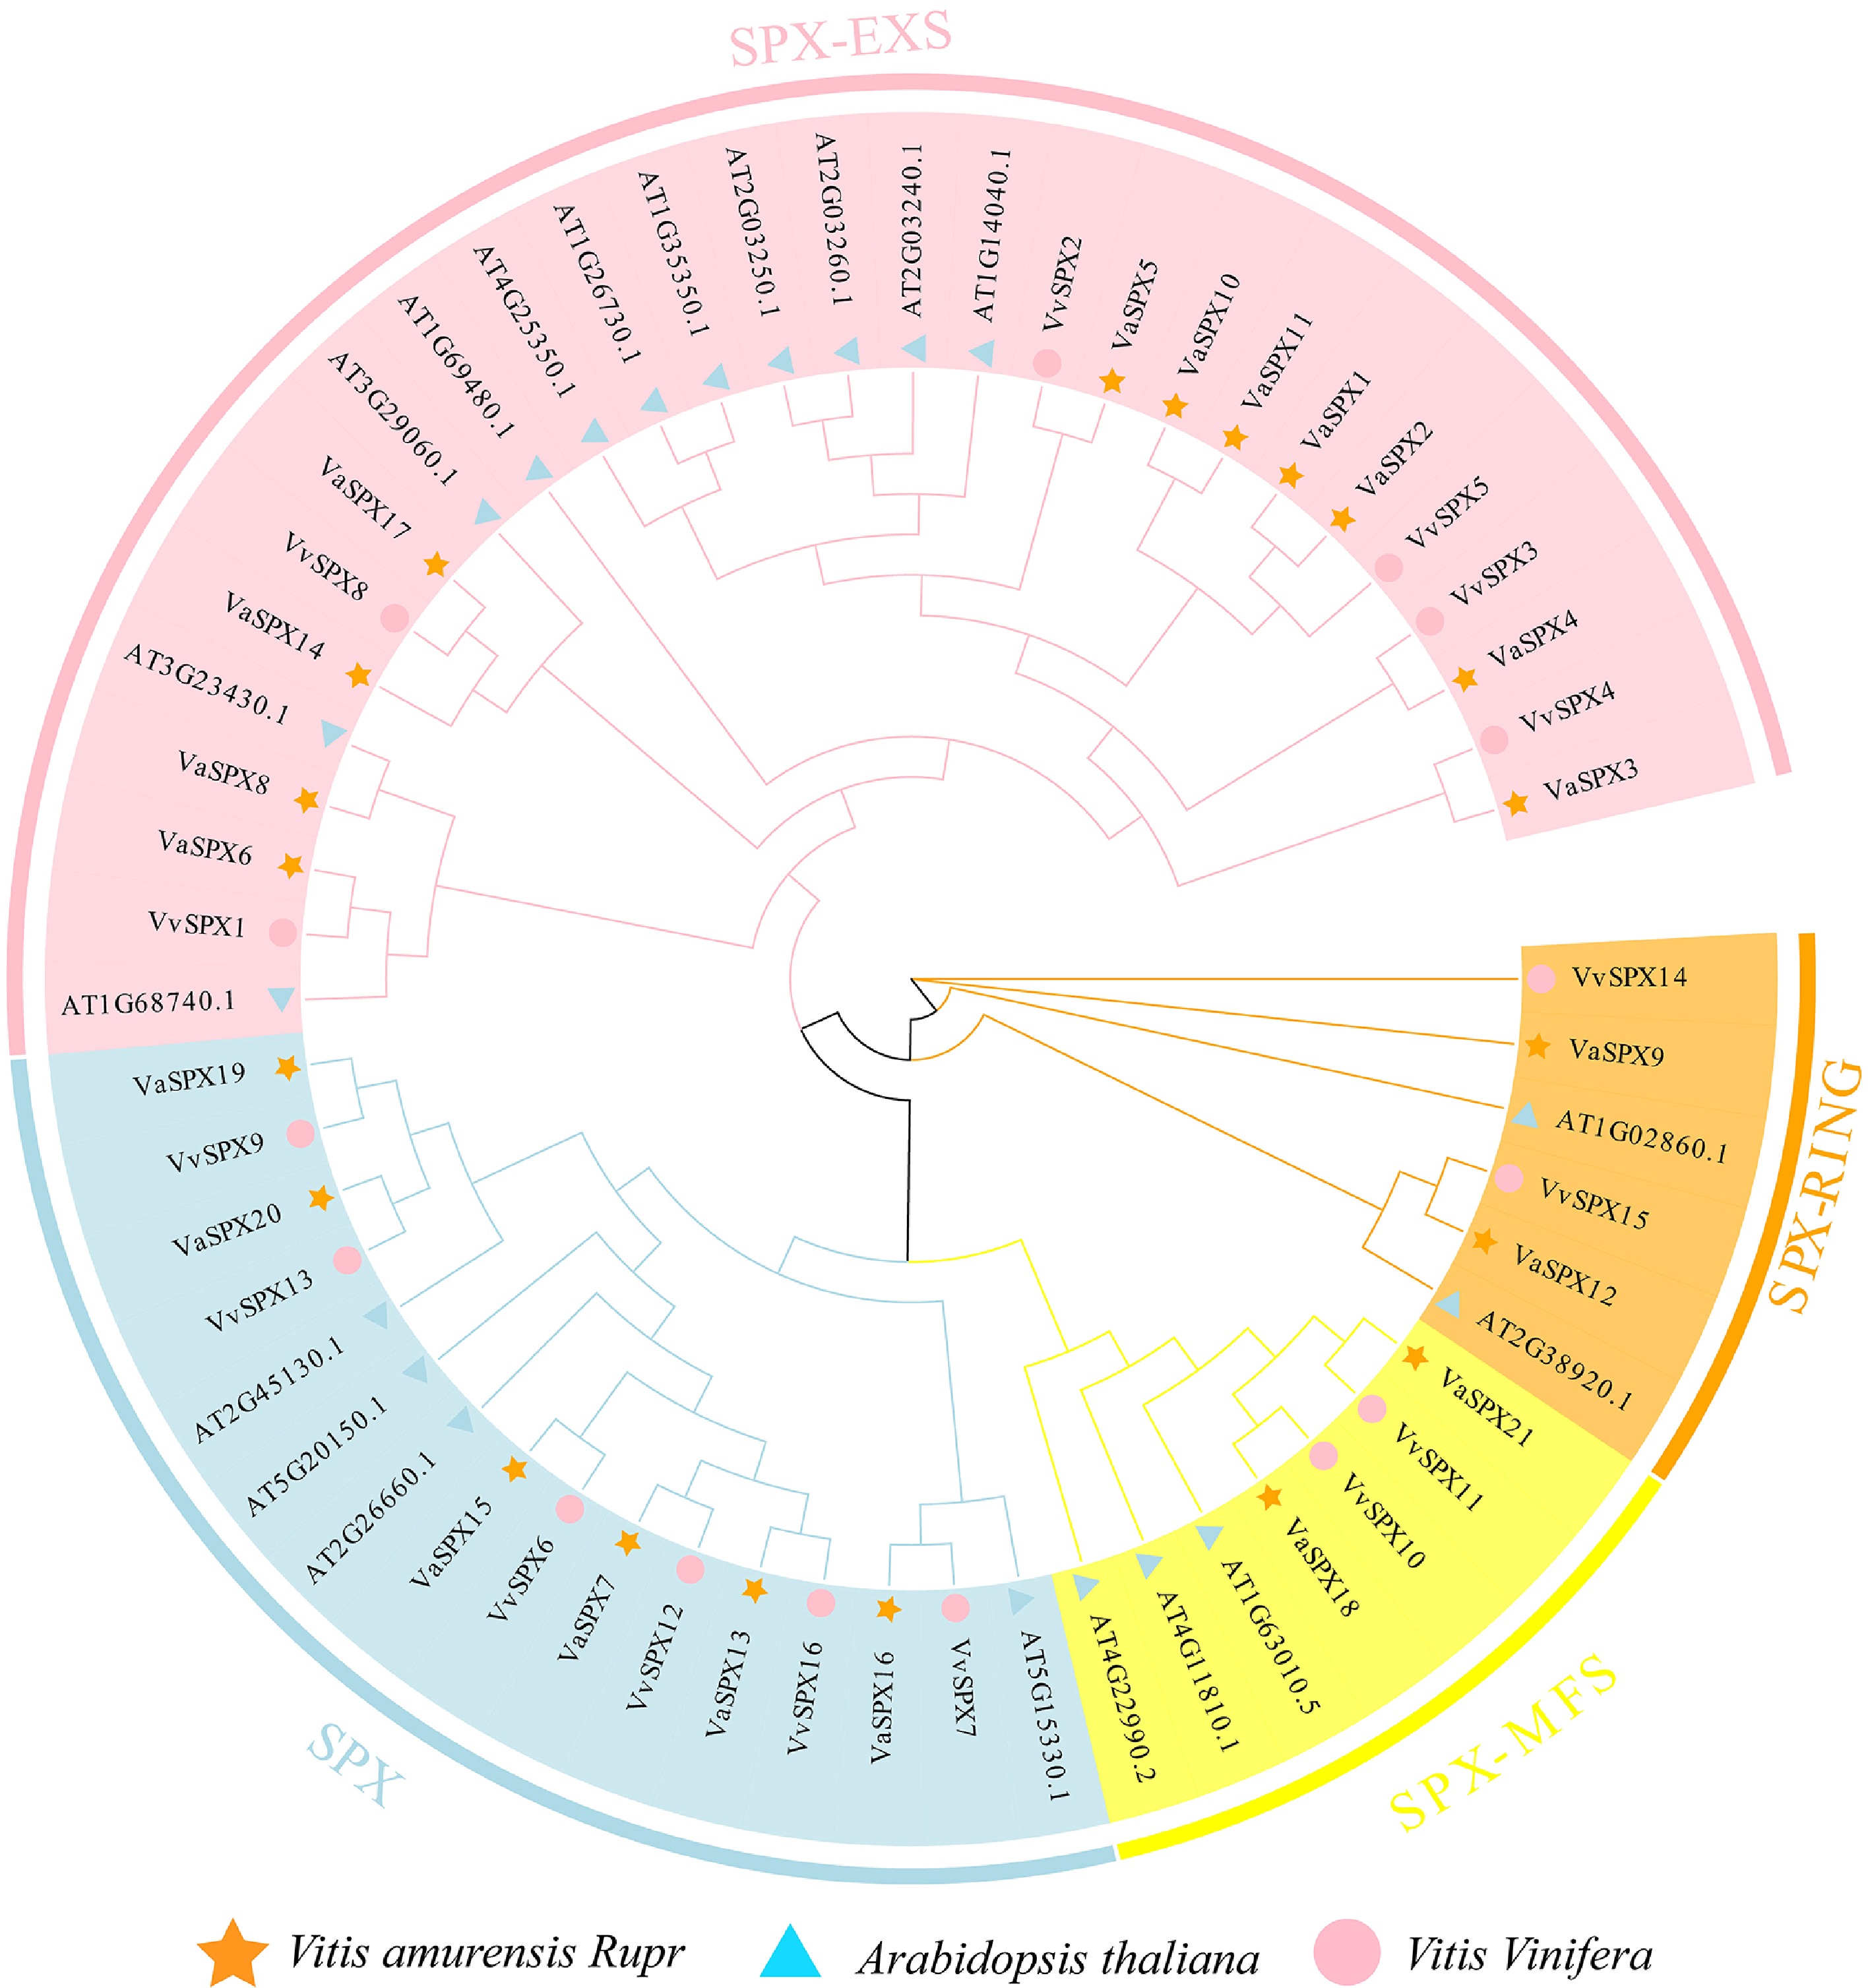
Figure 2.
Phylogenetic analysis of SPX gene families in V. vinifera, V. amurensis, and Arabidopsis thaliana. The SPX protein sequences were used to create phylogenetic trees. The bootstrap value was set at 1,000, and the NJ approach was used.
-

Figure 3.
Sequence, domain, and gene structure analysis of VvSPX and VaSPX genes. (a) Conserved sequence analysis of SPX gene in V. vinifera and V. amurensis. (b) Analysis of conserved domain of SPX gene in V. vinifera and V. amurensis. (c) Exon-intron structure of SPX gene in V. vinifera and V. amurensis.
-
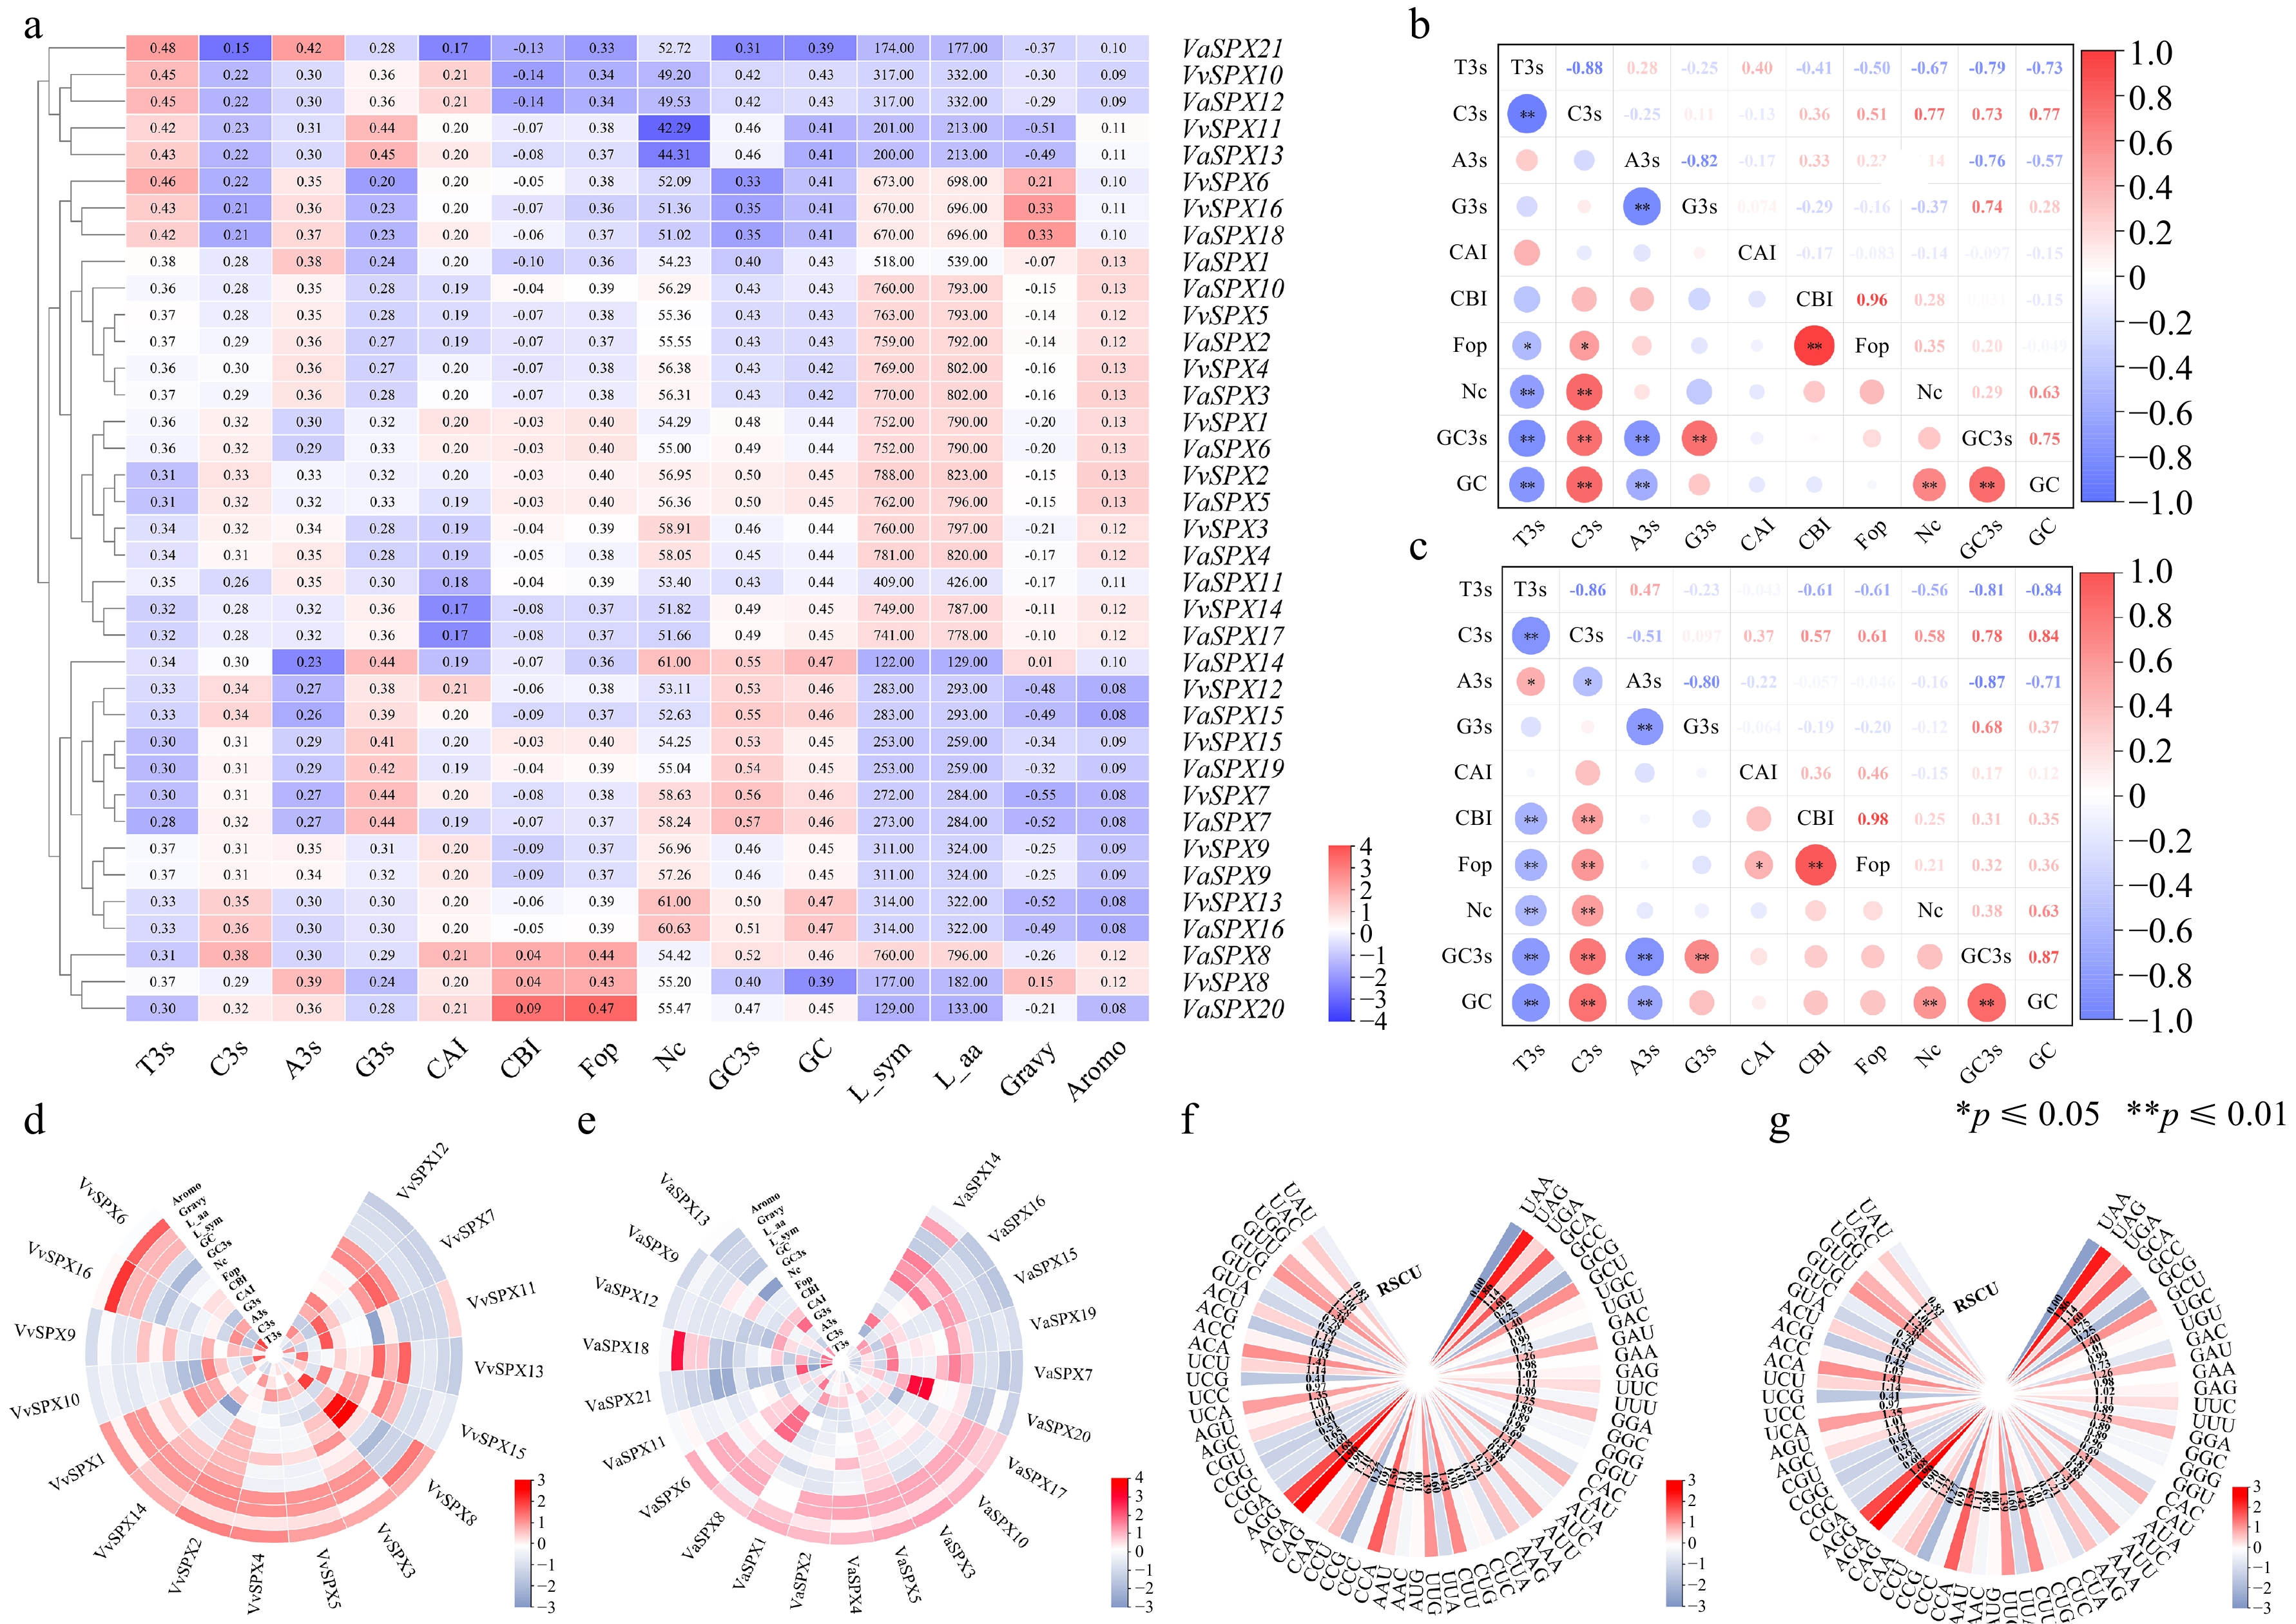
Figure 4.
VvSPX and VaSPX gene codon correlation and use bias analyses. (a) Synonymous codon preference and correlation analyses of VvSPX and VaSPX gene. (b) Correlation analysis of V. vinifera SPX gene codons. (c) Correlation analysis of SPX gene codons in V. amurensis. White denotes no association, blue denotes a negative correlation, and red denotes a positive correlation. The association is stronger and the circle is larger when the color is darker, and vice versa. (d) Analyses of the VvSPX gene's correlation and synonymous codon preference. (e) The VaSPX gene's synonymy codon preference and correlation analysis. The magnitude of the correlation coefficients is shown by different colors; the larger the correlation coefficients are in red, and the smaller numbers are in blue. 'A3s, G3s, C3s, and T3s' denote the matching base frequency of the synonymous codon on the third. CAI, codon adaptation index. CBI, codon preference index. FOP, frequency of optimal codon usage. NC: codon number that is effective. GC content of the synonymous codon for GC3 at position three. GC: the GC content. (f) Relative synonymous codon usage in V. vinifera (RSCU). (g) Relative synonymous codon usage in V. amurensis (RSCU).
-
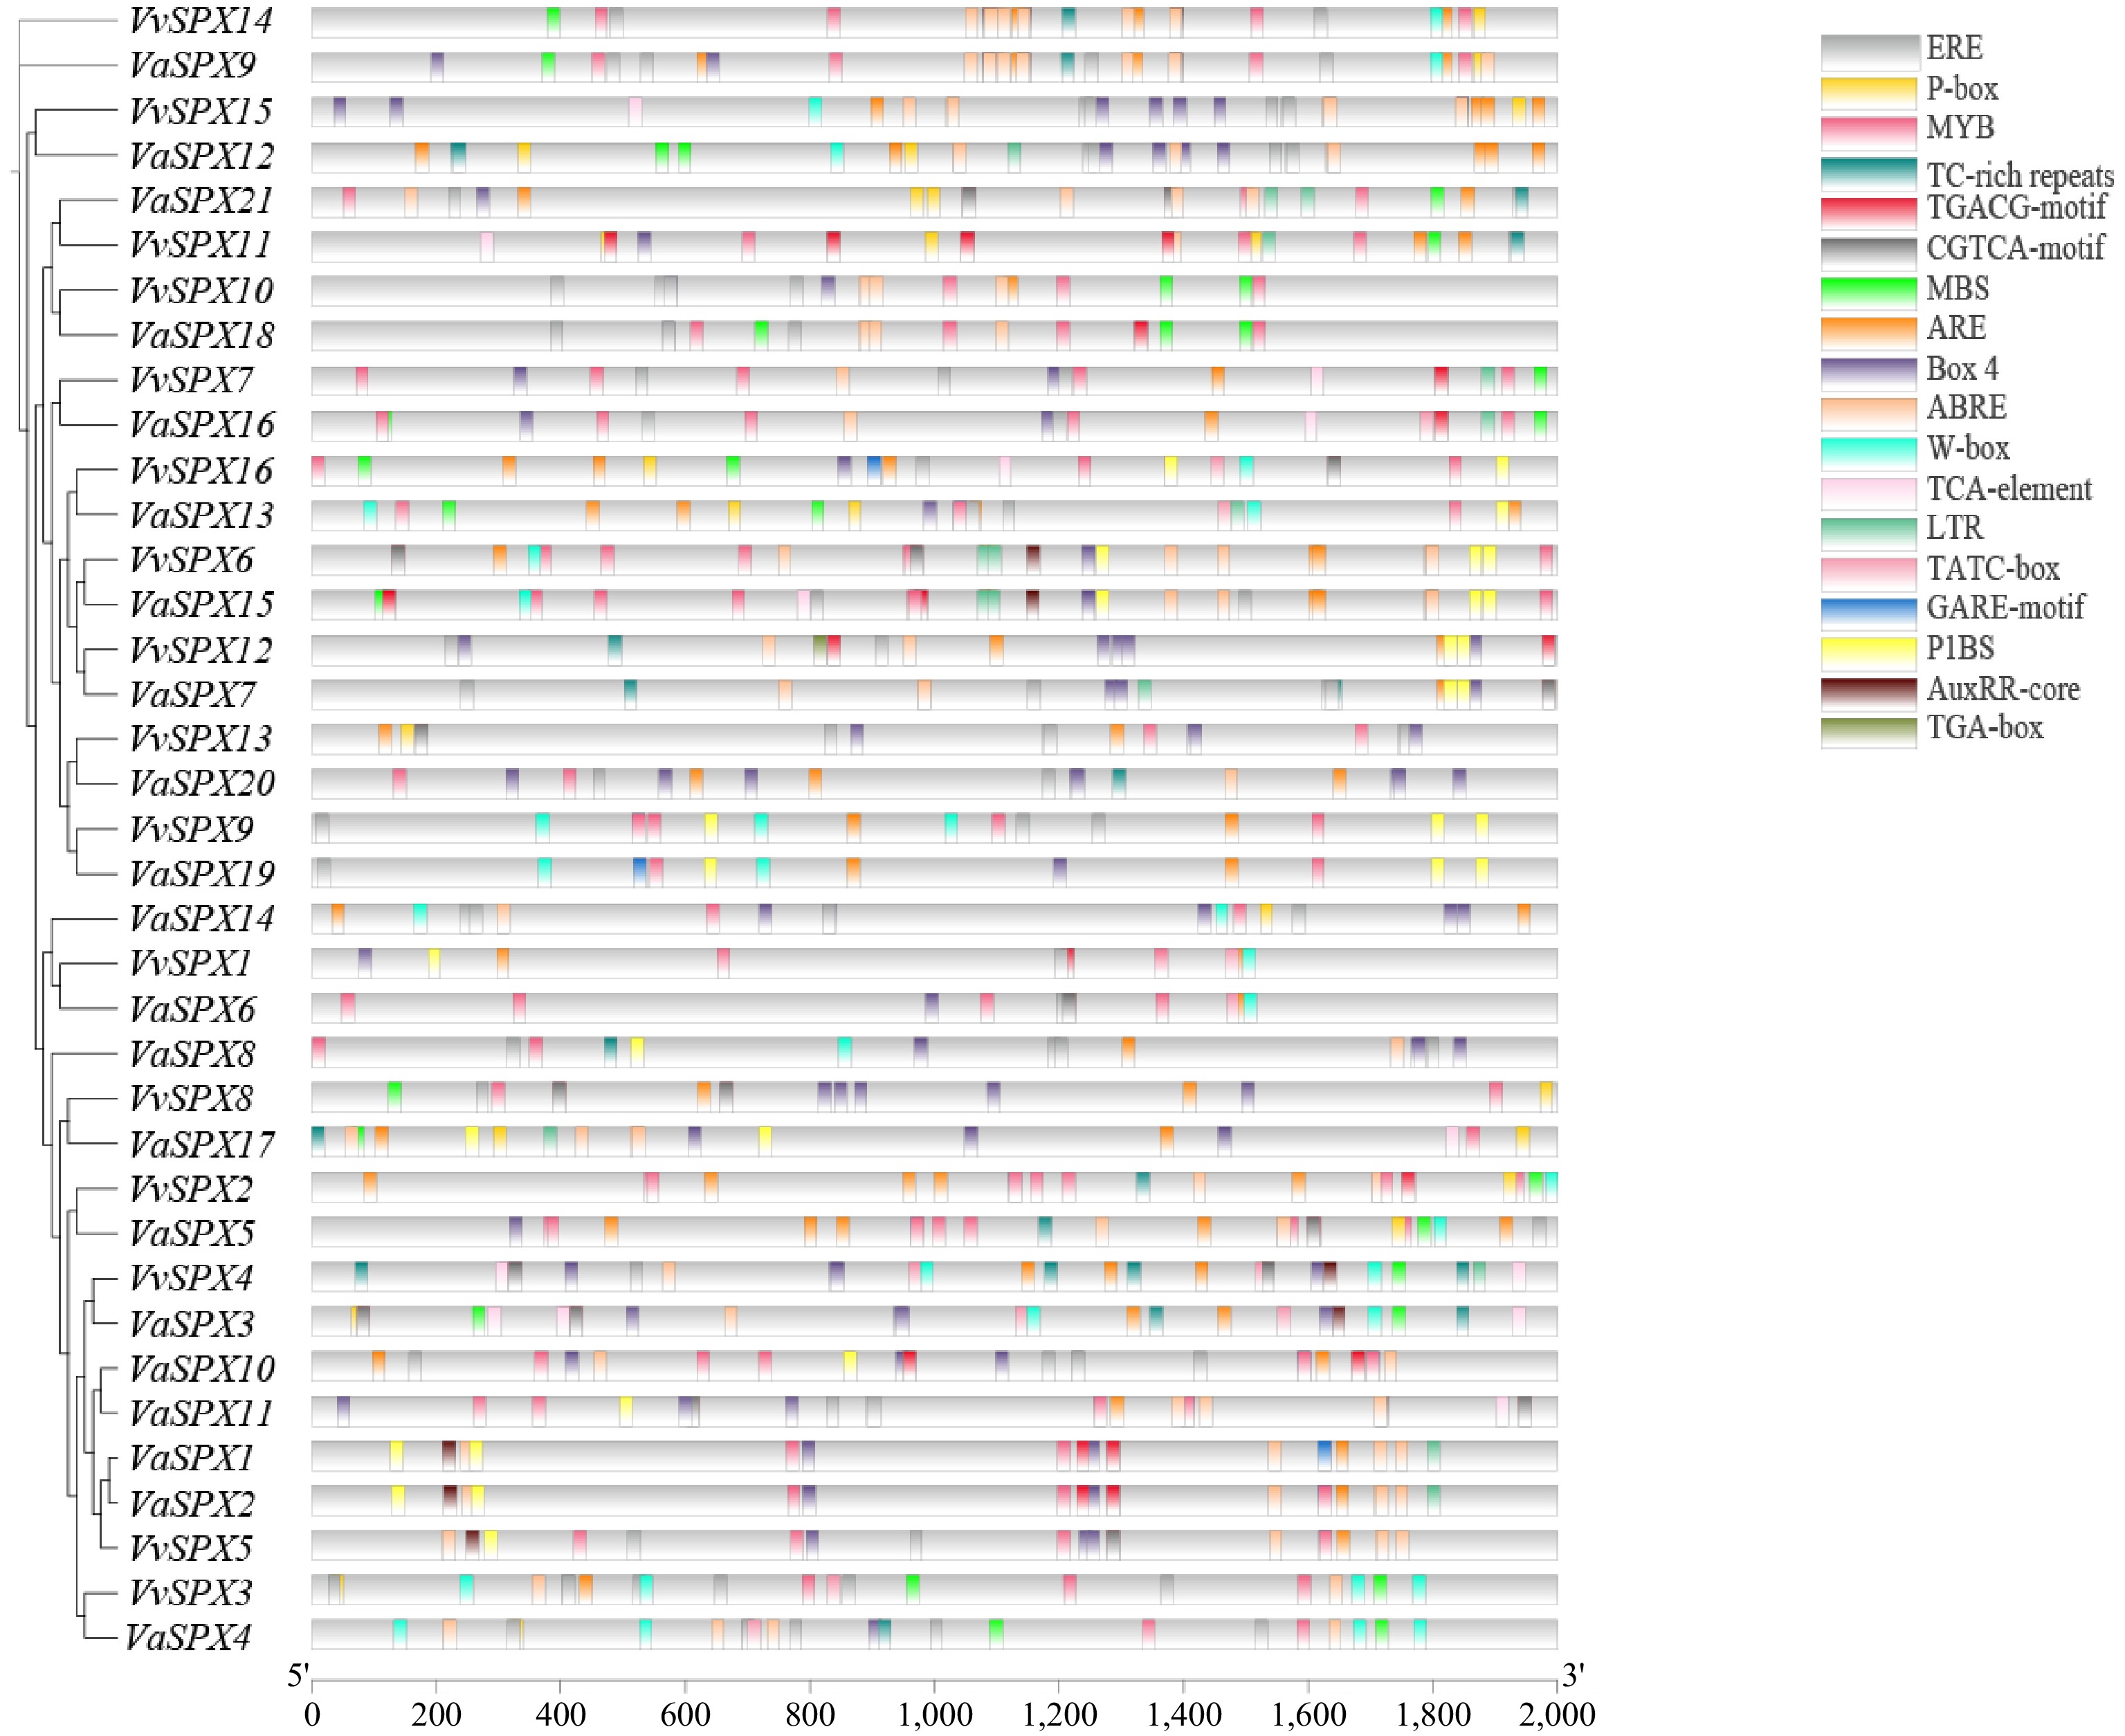
Figure 5.
Cis-regulatory element analysis of the VvSPX and VaSPX genes.
-
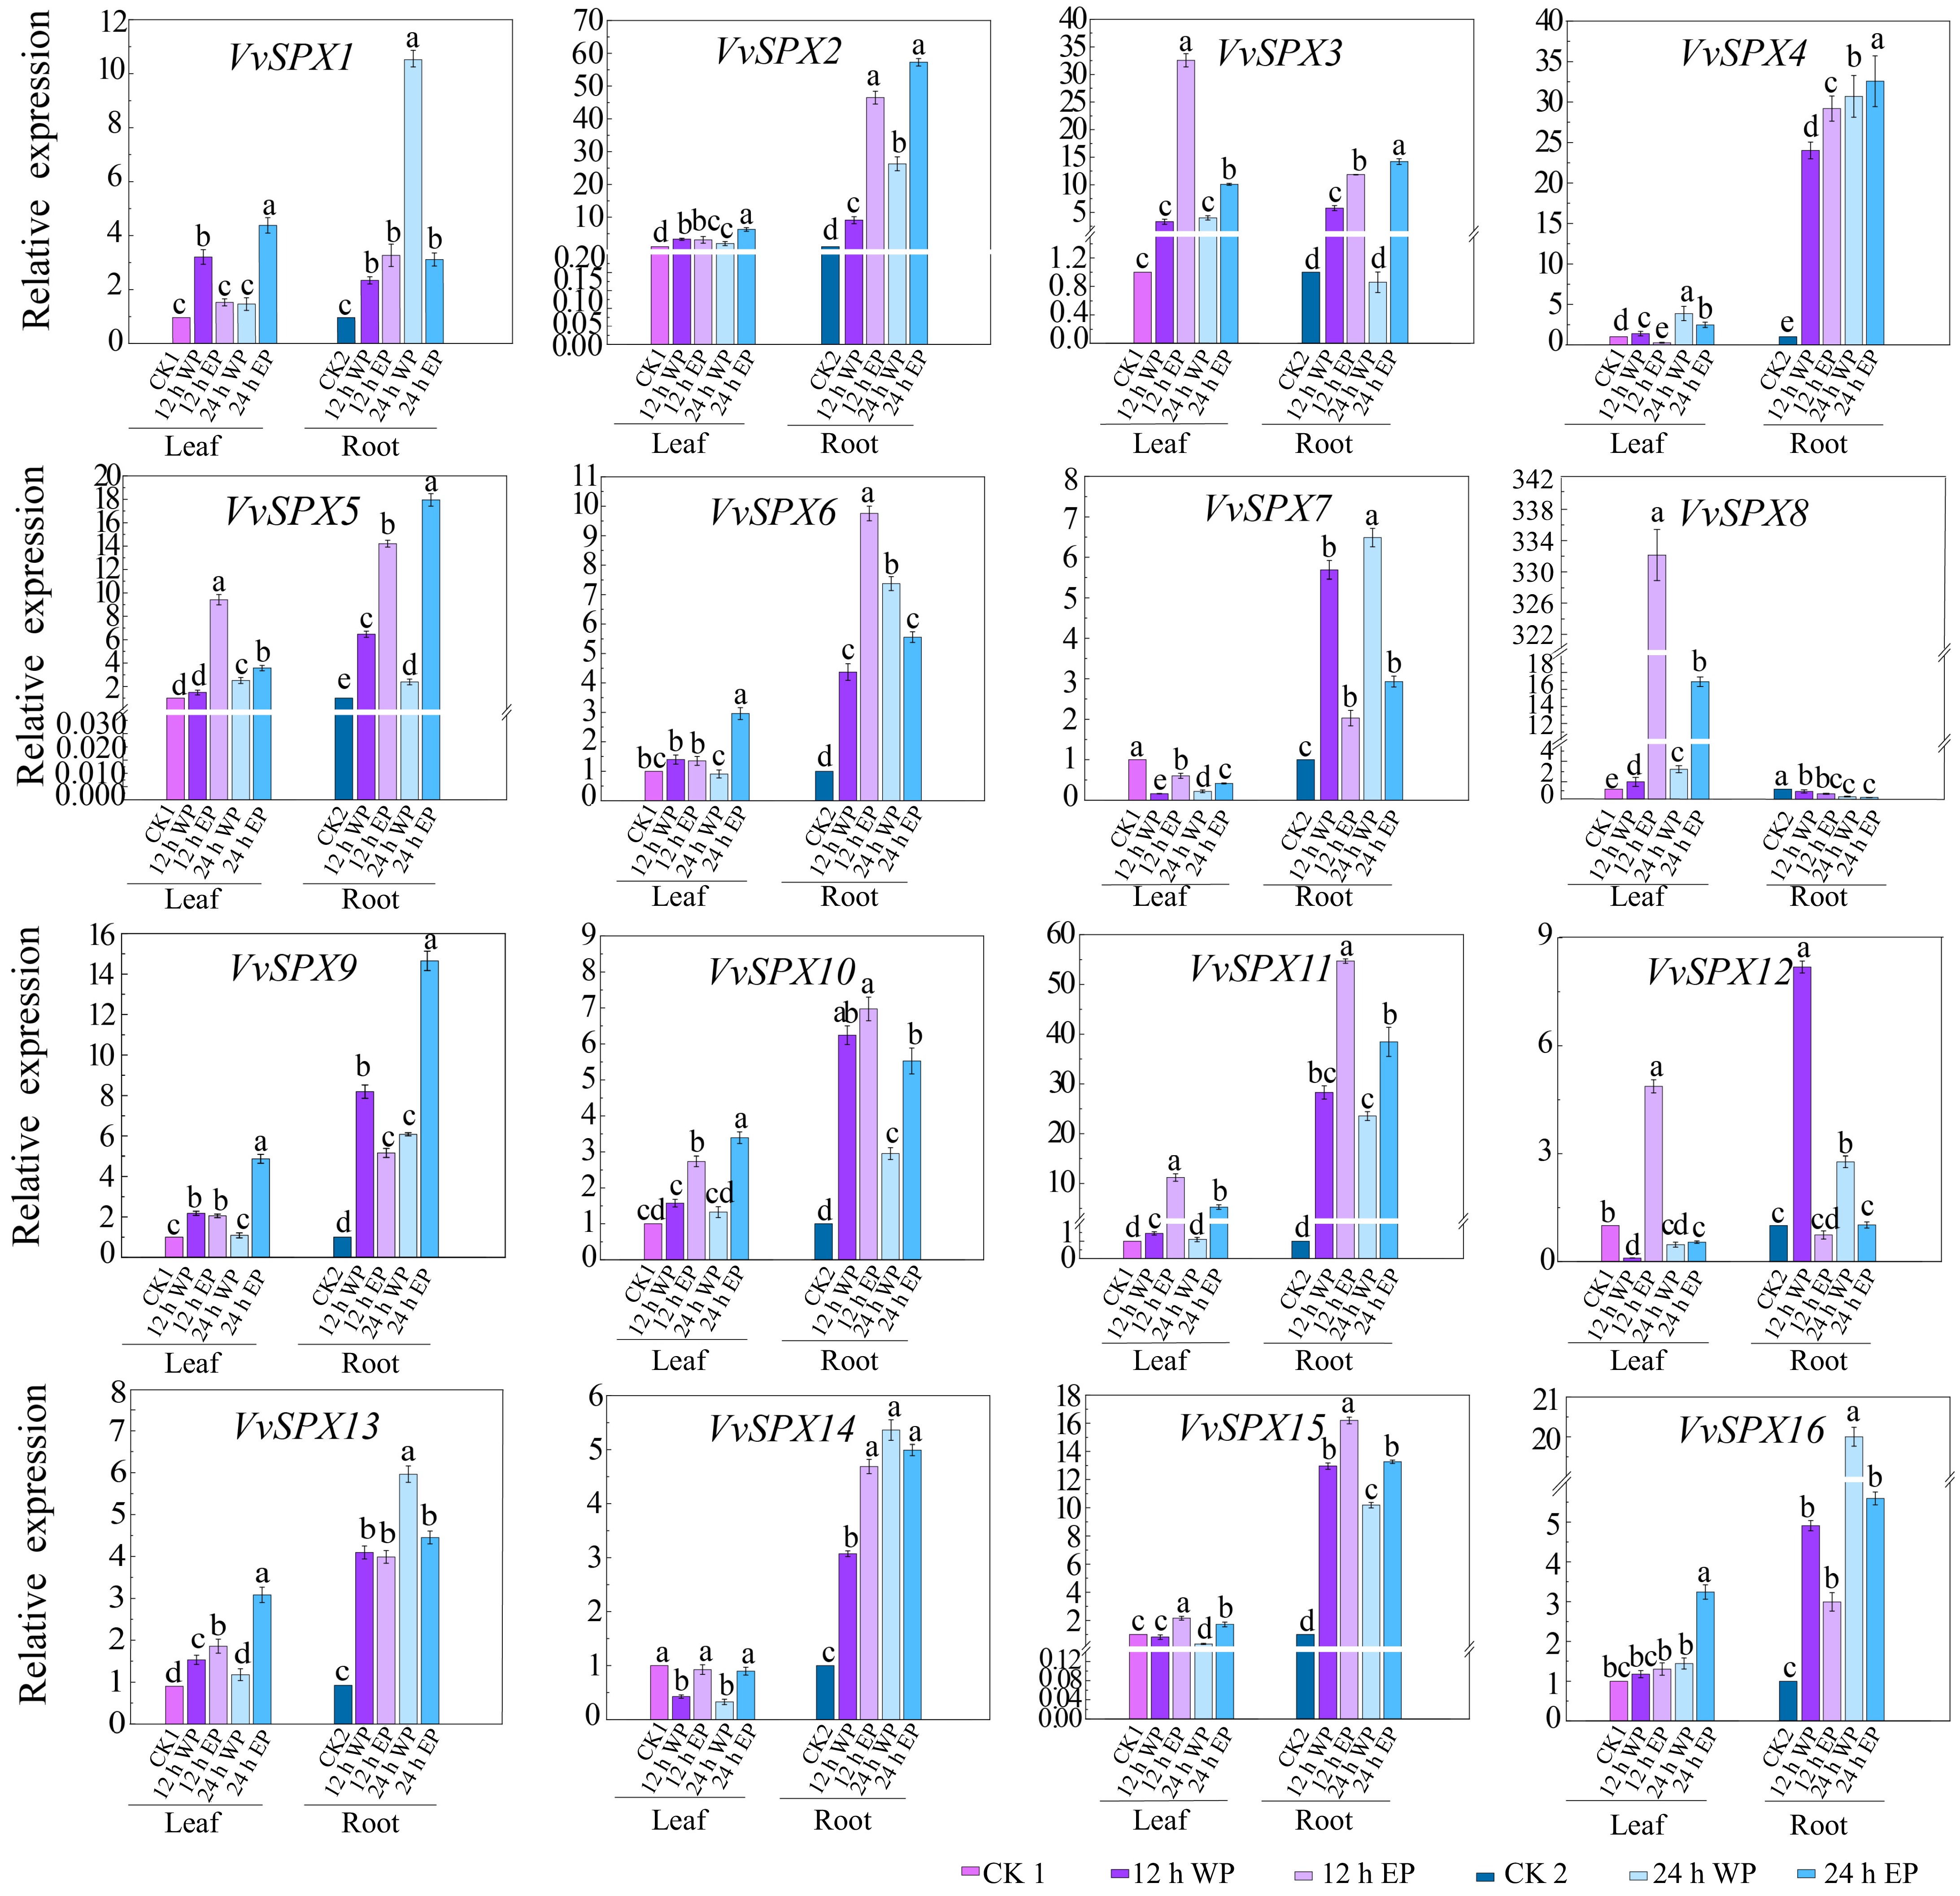
Figure 6.
Relative expression levels of SPX genes in V. vinifera with different phosphorus concentrations and different treatment times. CK1 was used as a control for leaves and CK2 as a control for roots. CK1, 1 mM Pi treated leaves for 0 h; 12 WP, 0 mM Pi treated for 12 h; 12 EP, 2 mM Pi treated for 12 h; 24 WP, 0 mM Pi treated for 24 h; 24 EP, 2 mM Pi treated for 24 h; CK2, 1 mM Pi treated roots for 0 h; WP: without phosphorus (0 mM Pi), EP: excessive phosphorus (2 mM Pi). The relative expression was computed using the 2−ΔΔCᴛ technique[32]. The mean ± SE of three biological repetitions is shown by the error bars. The significance of group differences was assessed using Duncan's test and analysis of variance (ANOVA). While the same lowercase letters indicate no statistical difference (p < 0.05), different letters indicate significant differences.
-
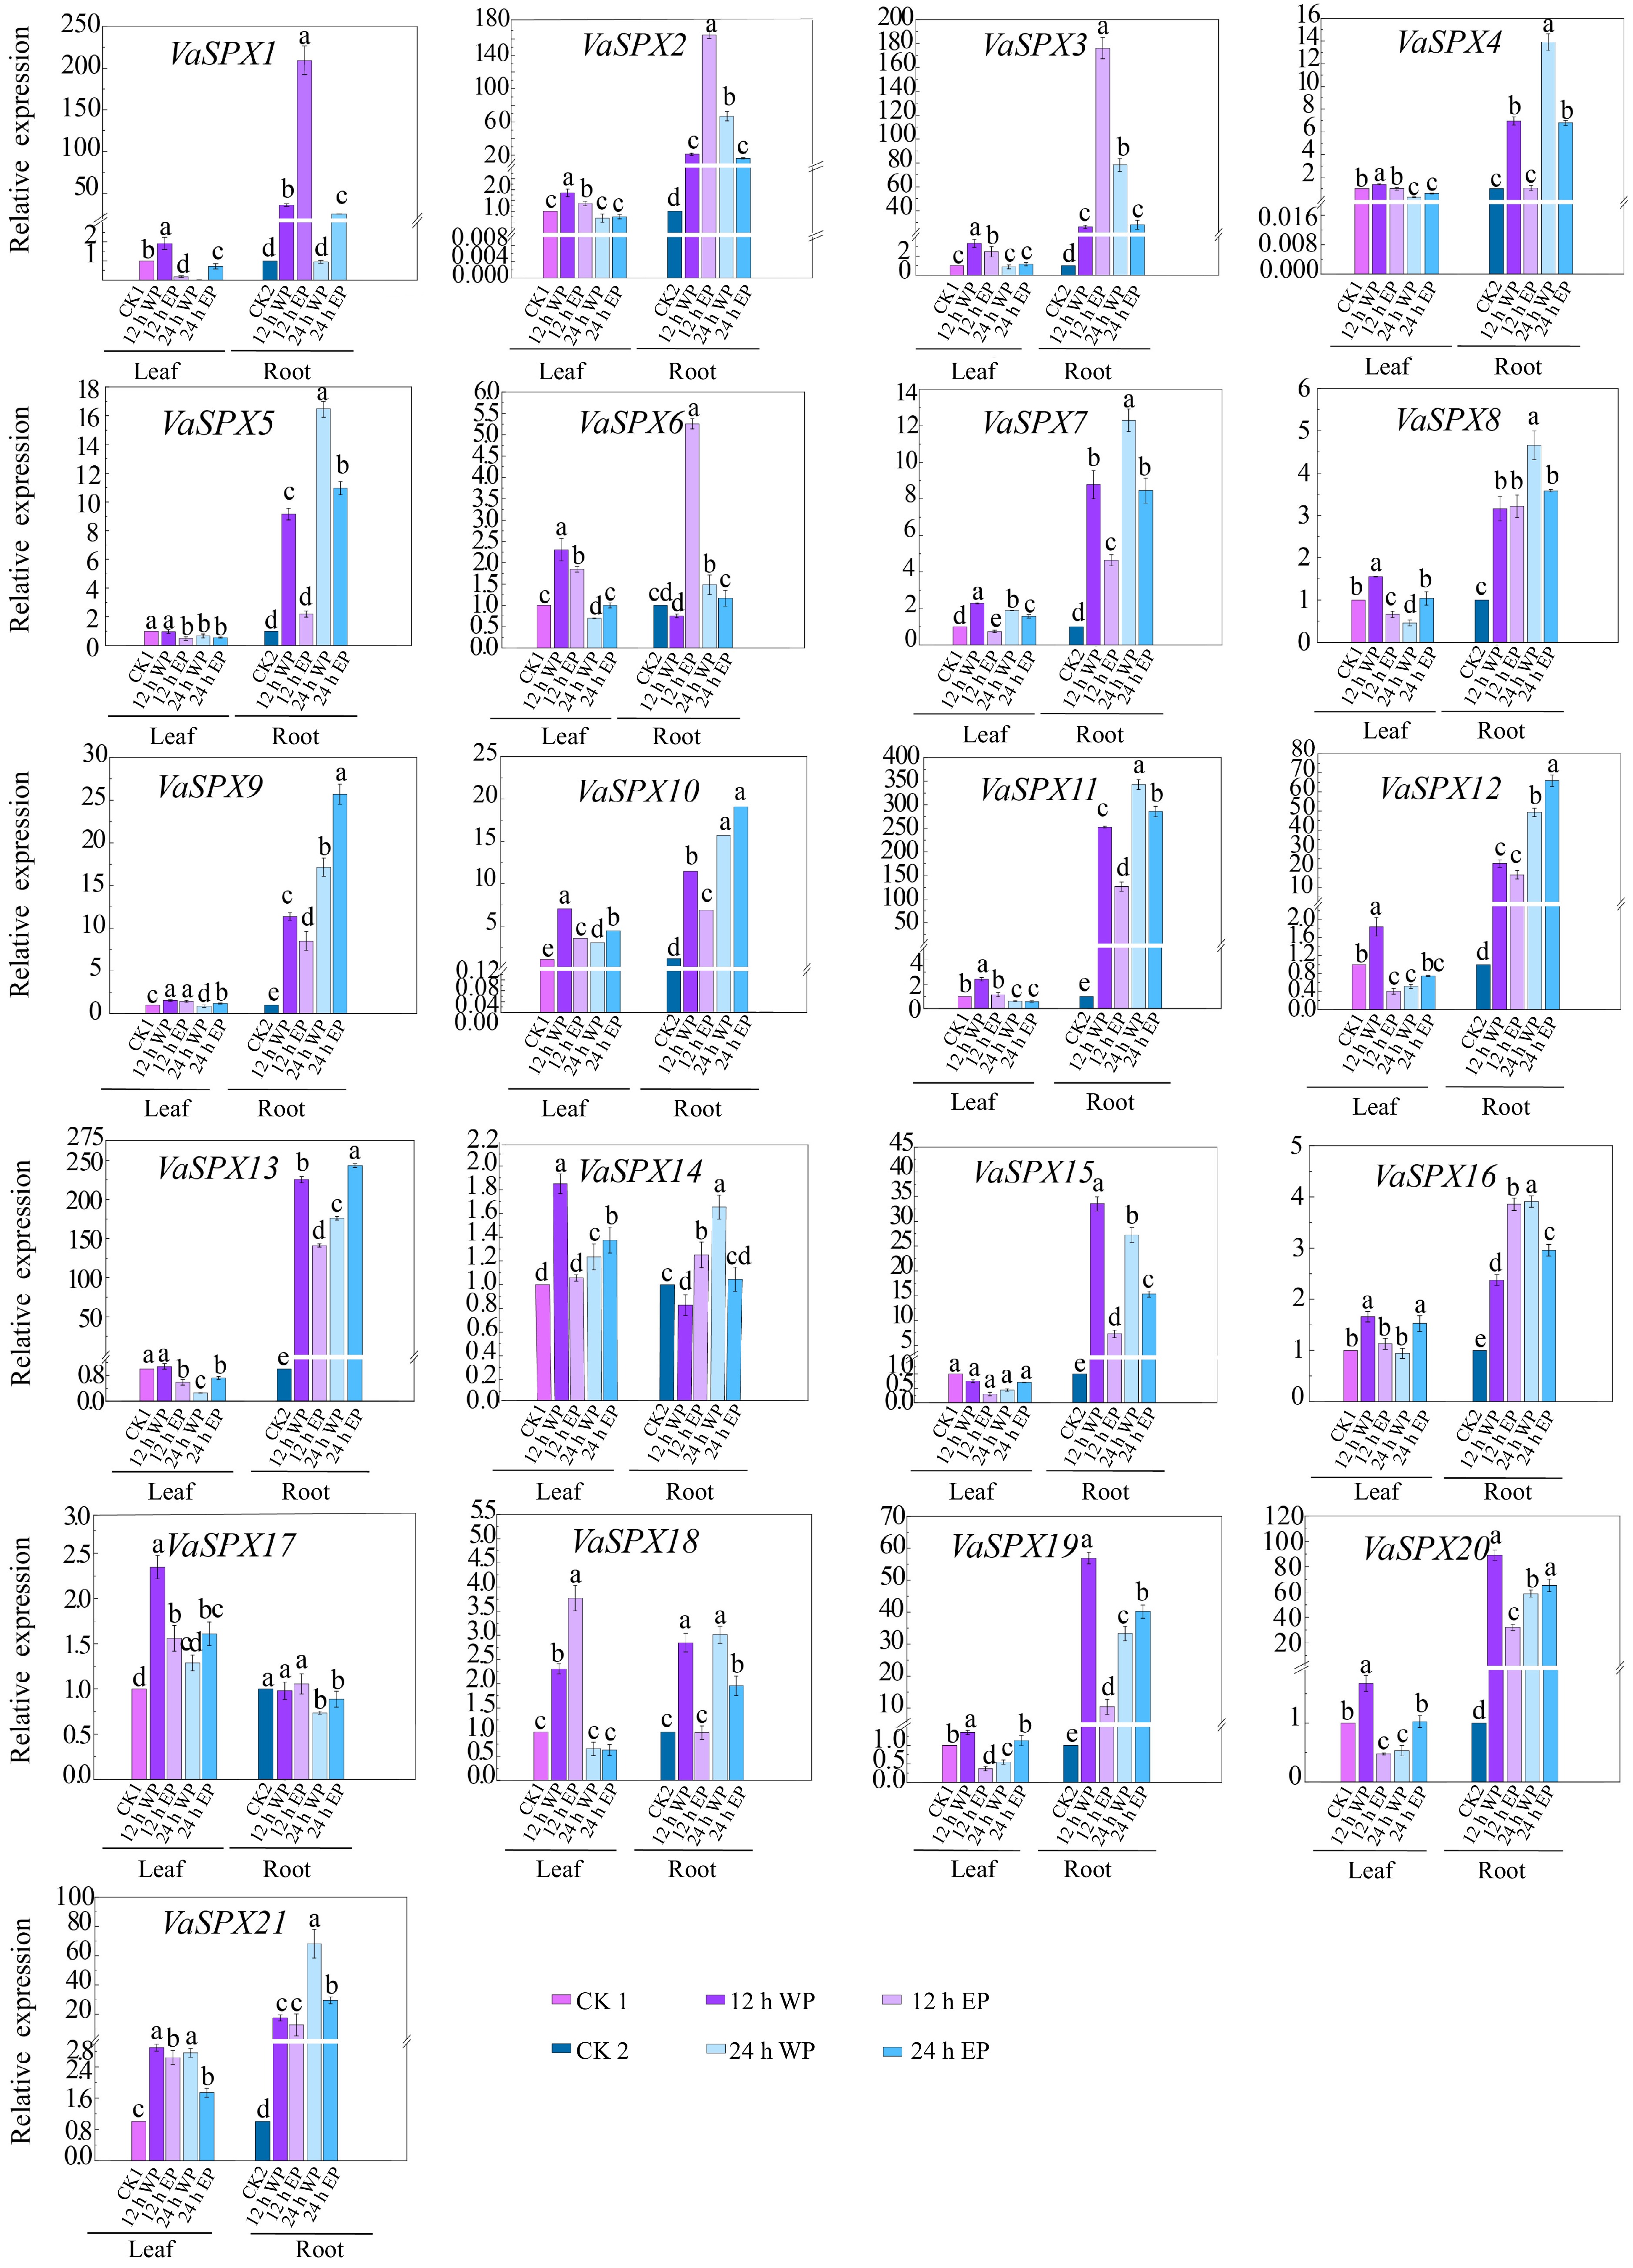
Figure 7.
Relative expression levels of SPX genes in V. amurensis with different phosphorus concentrations and different treatment times. The abbrviations ets are the same as for Fig. 6.
-
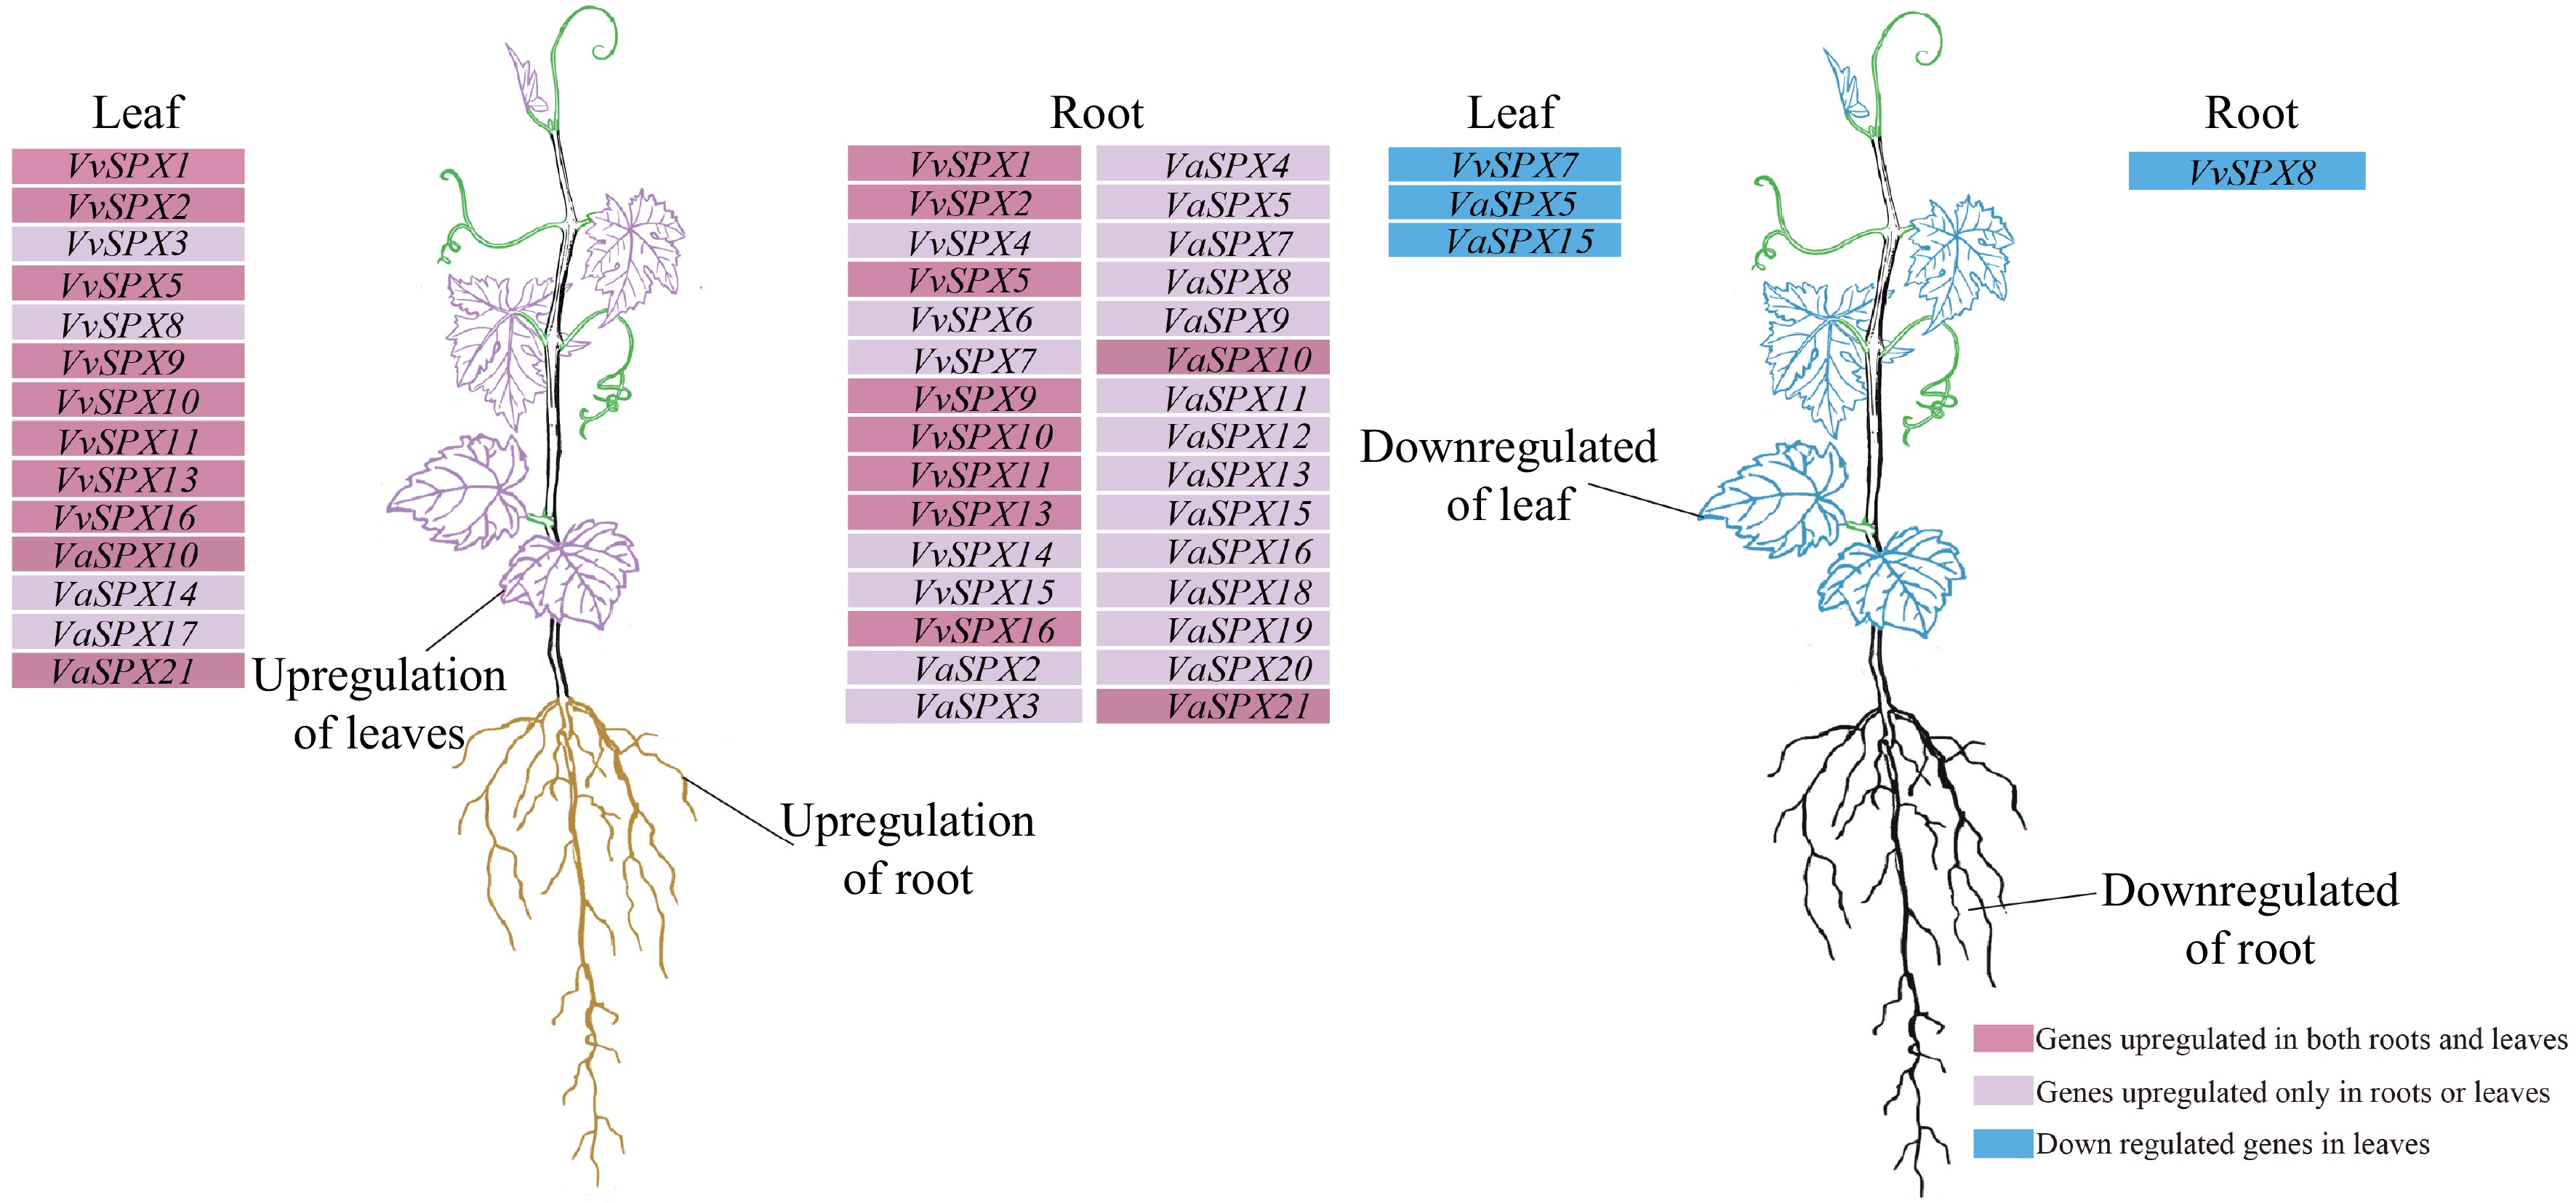
Figure 8.
Cluster analysis of upregulated and downregulated expression trends of VvSPX and VaSPX genes in roots and leaves. The genes in the deep purple background were upregulated in both roots and leaves, the genes in the purple background were upregulated in roots or leaves, and the genes in the blue background were downregulated in roots or leaves following treatment with 0 and 2 mM phosphorus for 12 and 24 h.
Figures
(8)
Tables
(0)