-
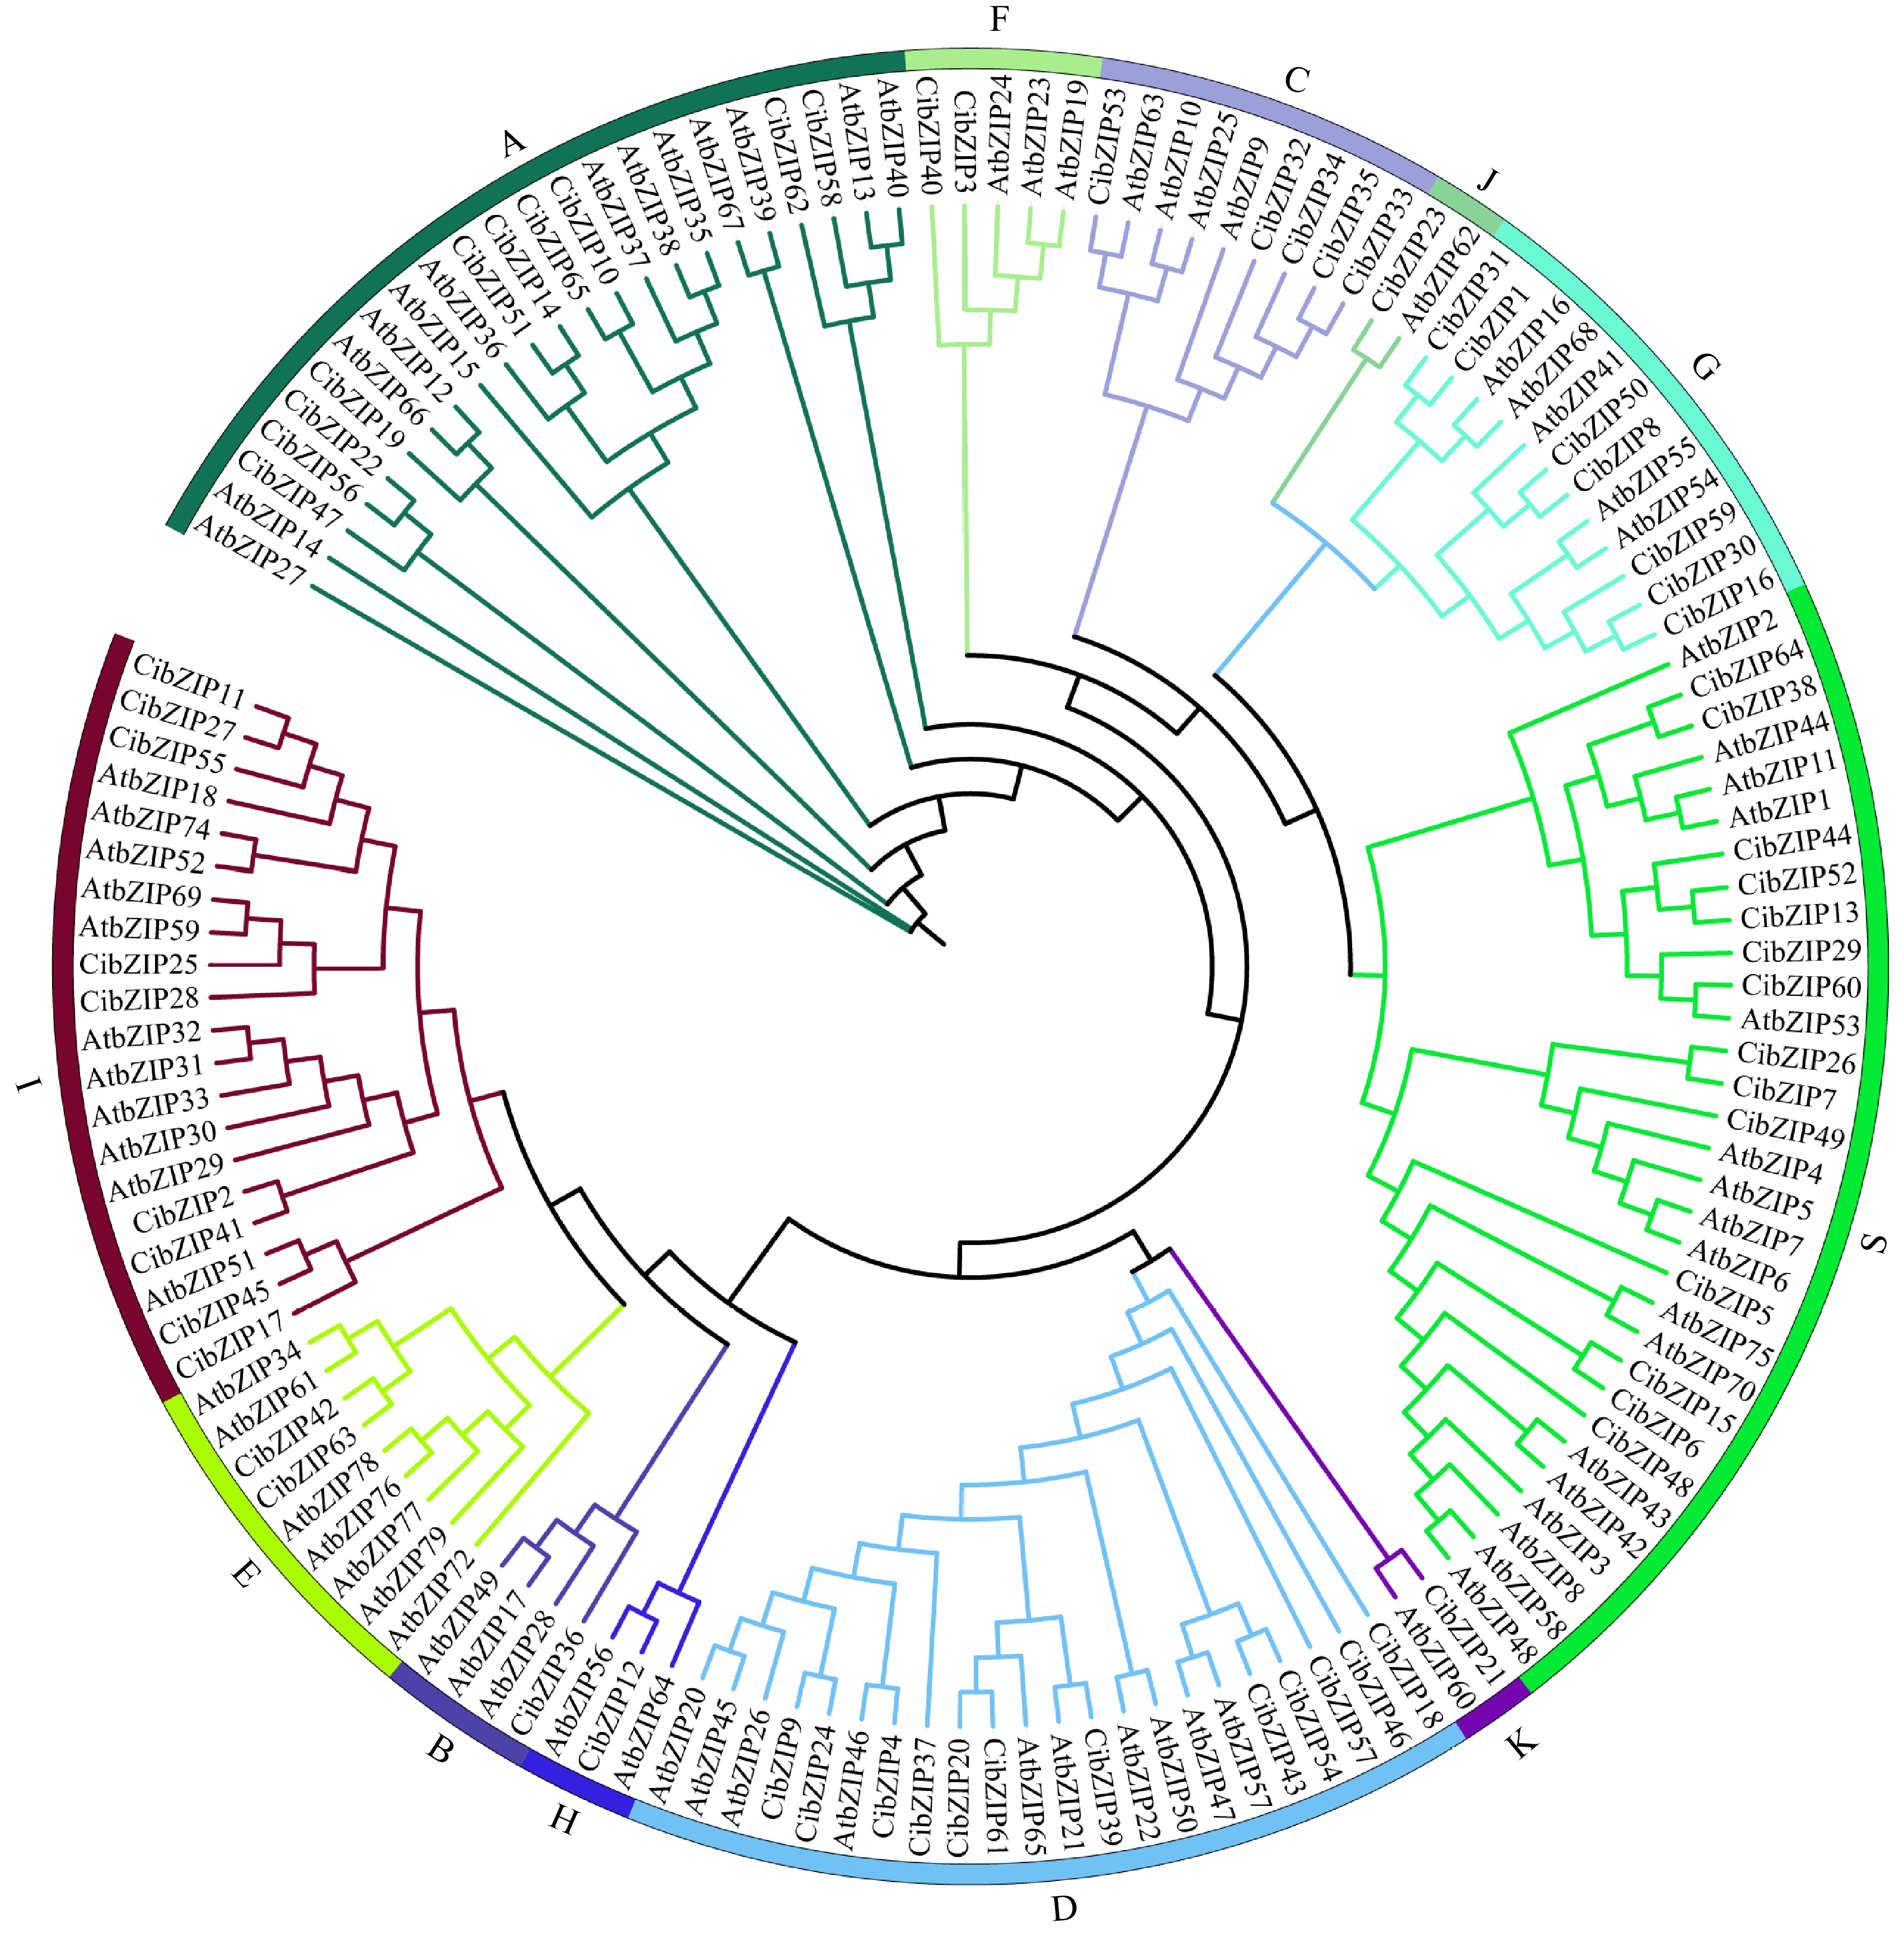
Figure 1.
Phylogenetic tree of bZIP family proteins from A. thaliana (At) and C. indicum (Ci). Different colored dots in the phylogenetic tree represent bZIP proteins from different species.
-
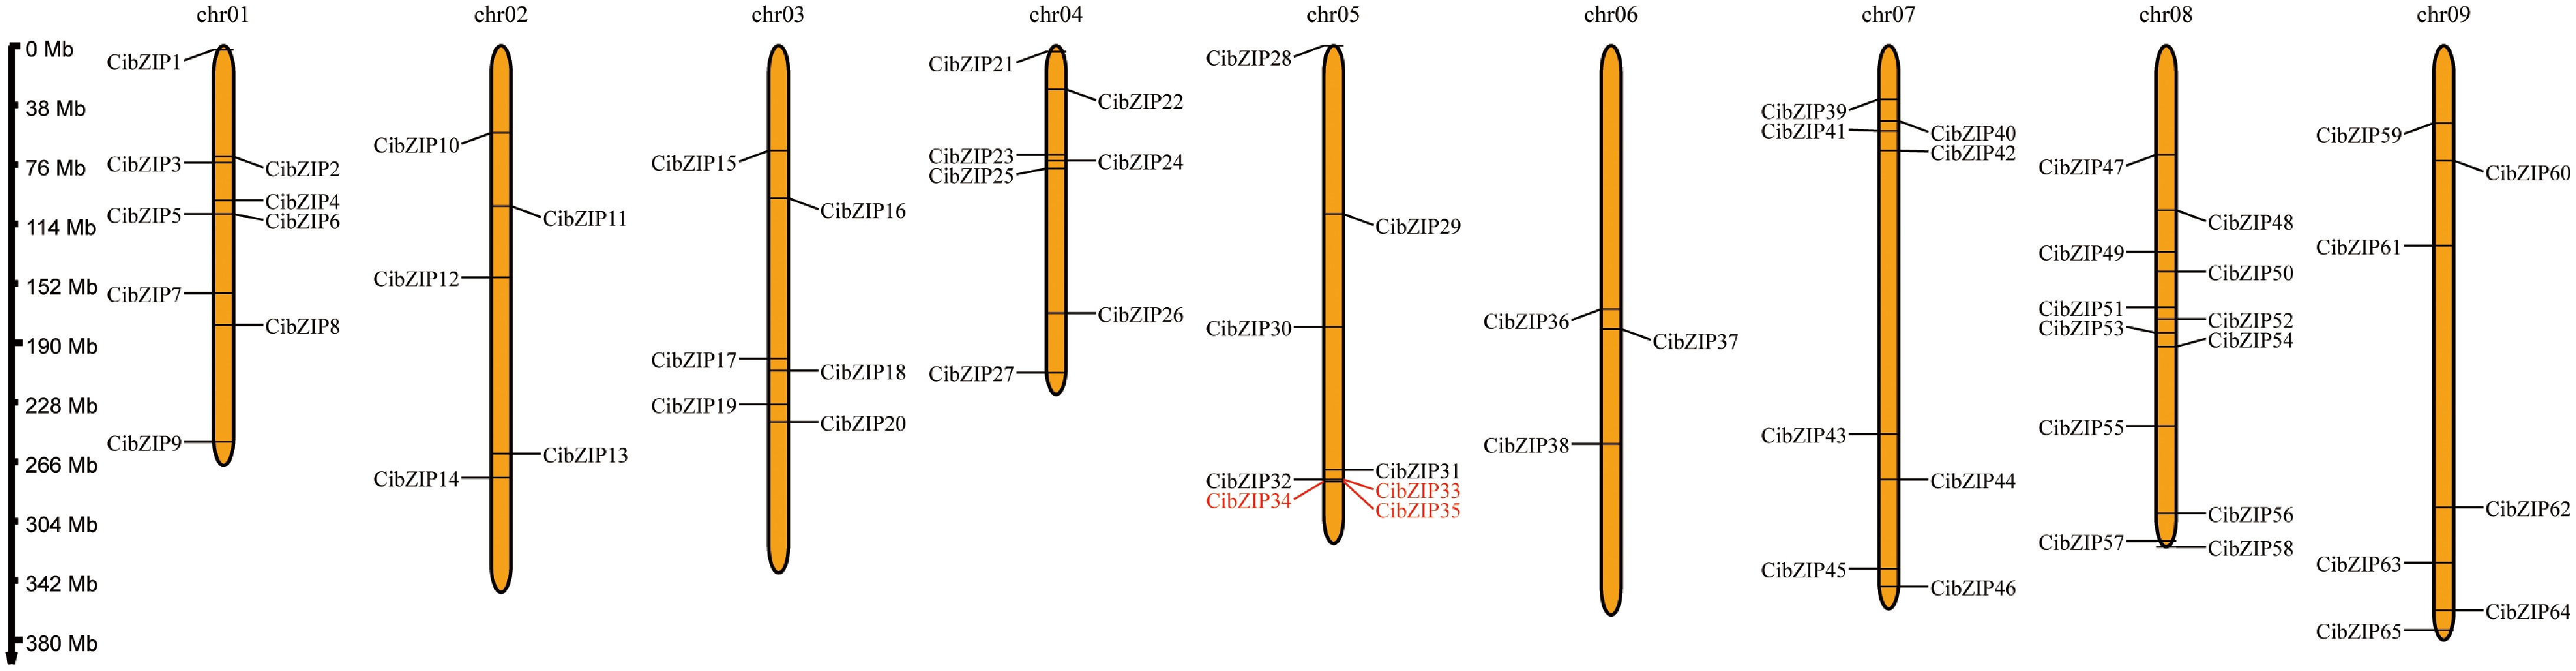
Figure 2.
Chromosome localization of CibZIPs. Each brown bar represents a chromosome, the chromosome number is marked at the top and the ratio on the left represents the chromosome length with the unit for the scale is mega bases (Mb). The red marked genes represent the collinear relationship within the species.
-
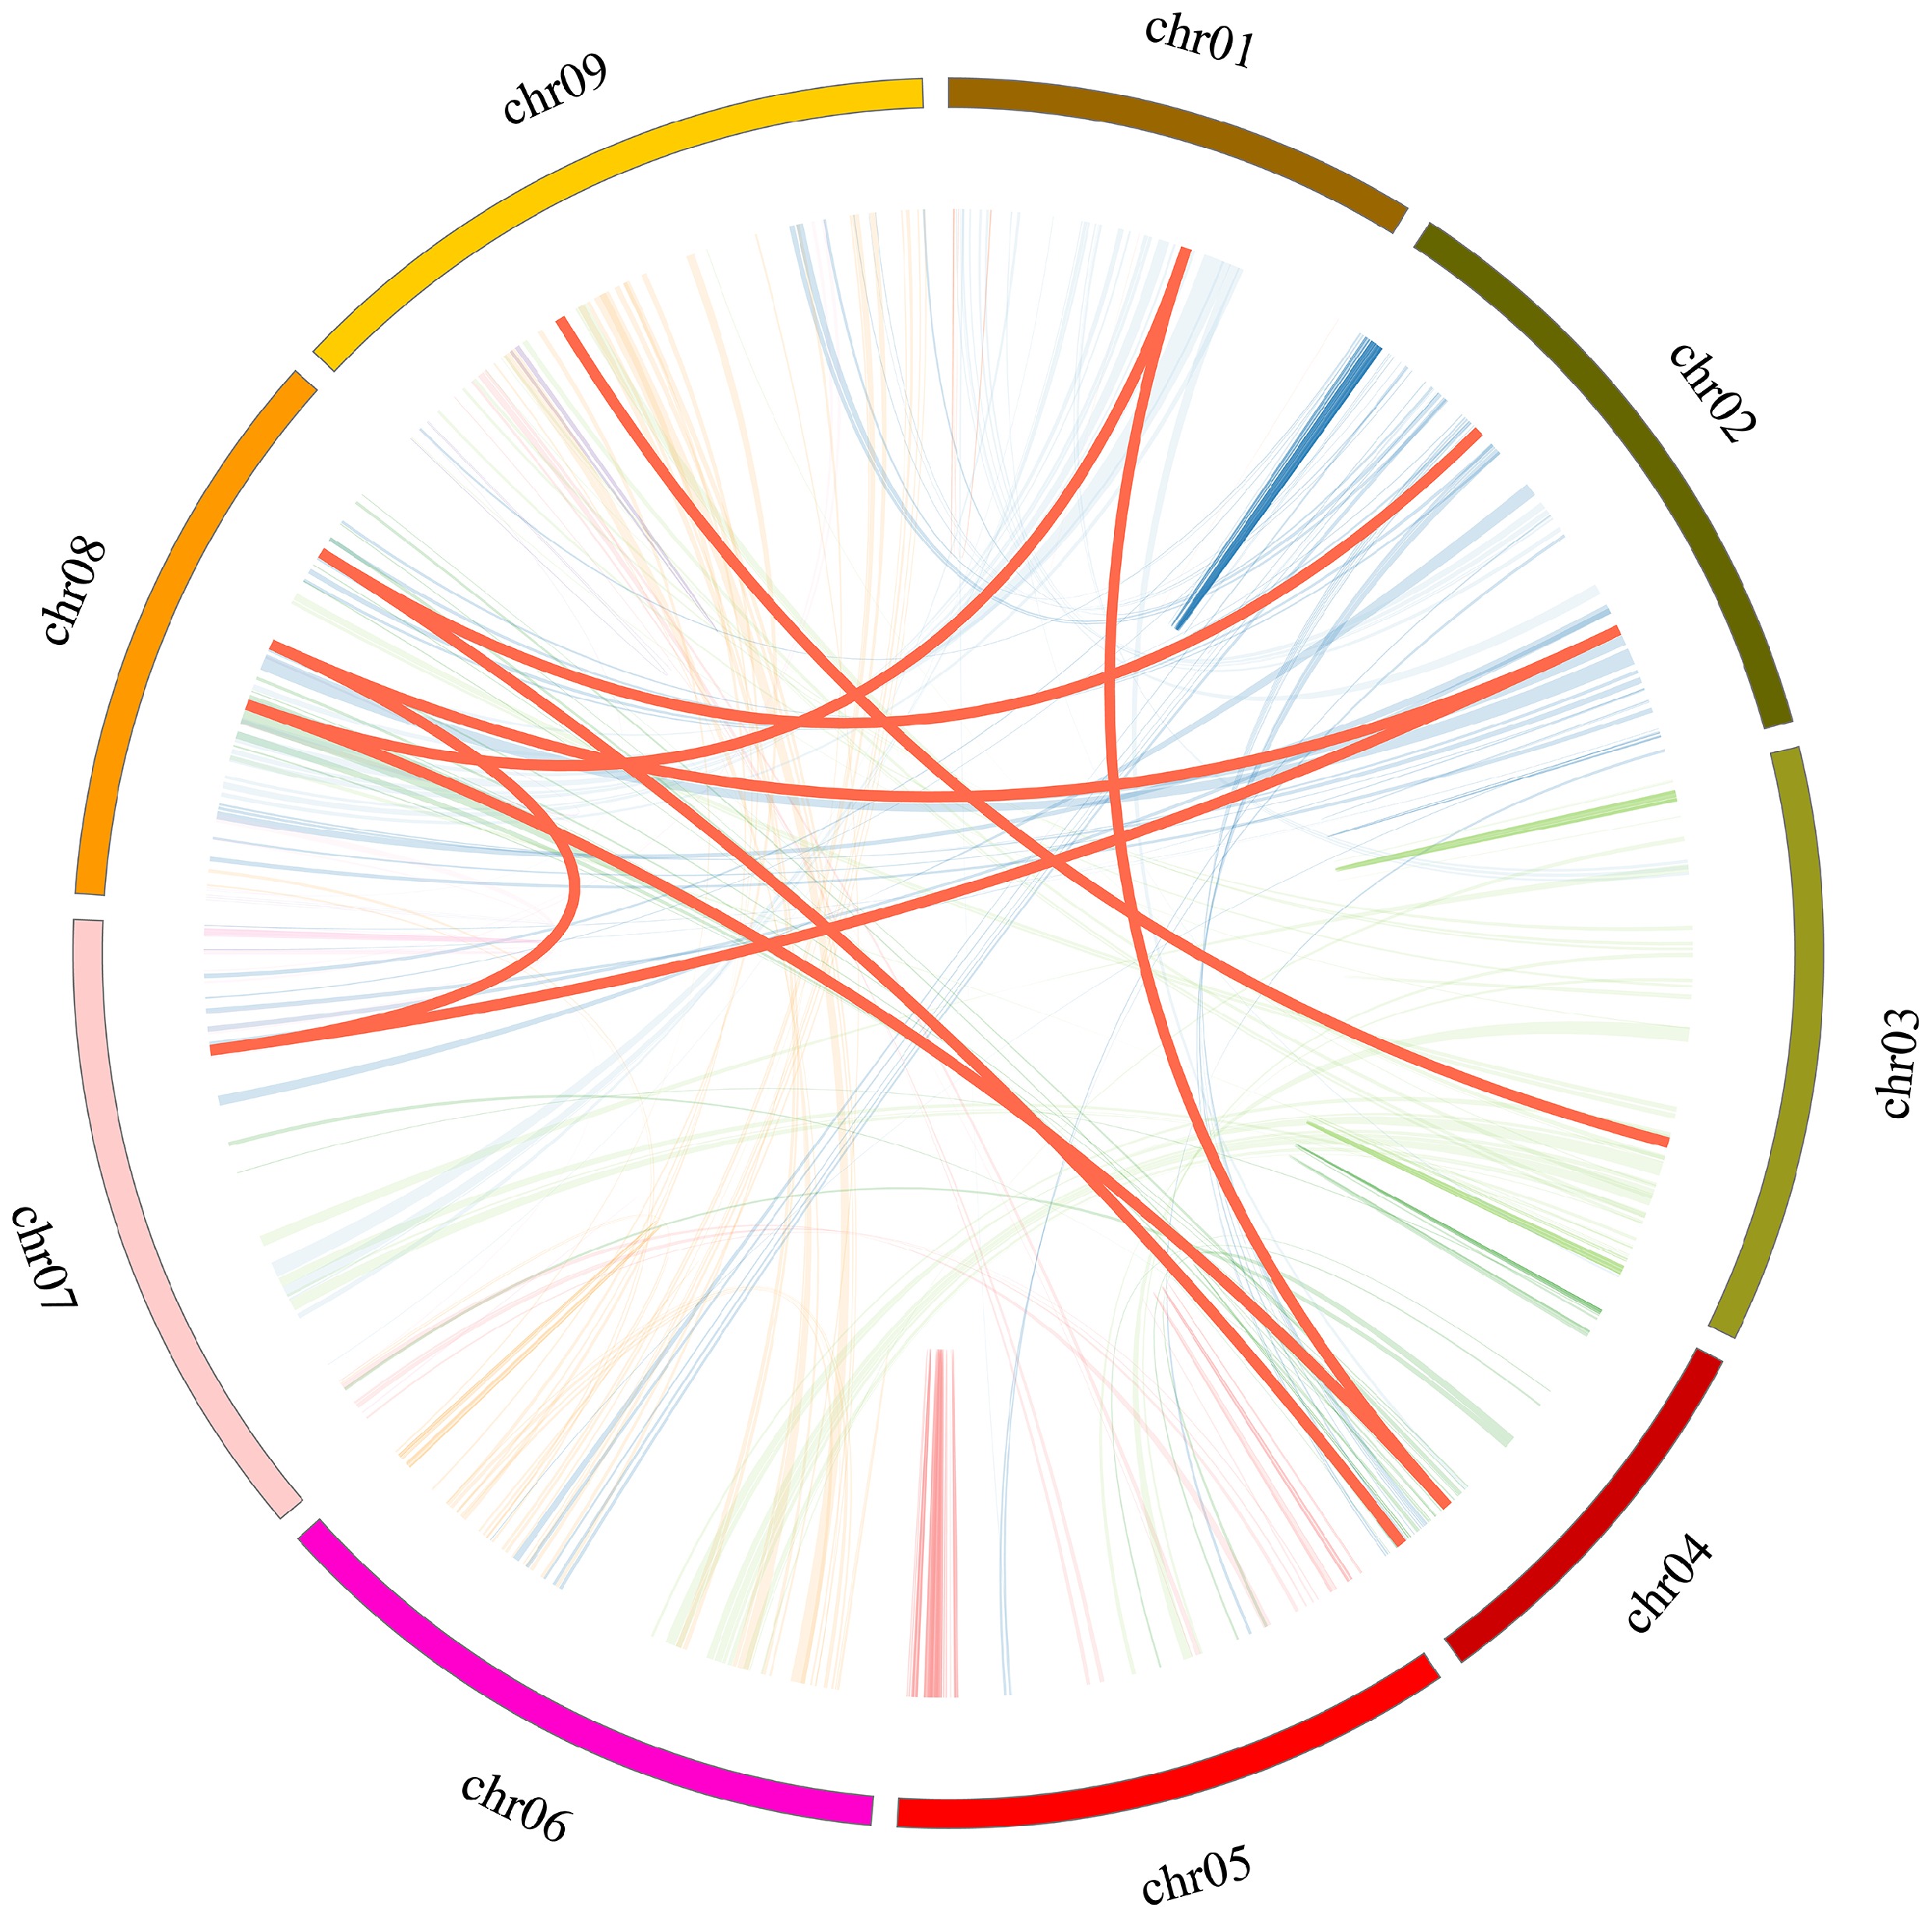
Figure 3.
Collinear relationship of CibZIP genes in C. indicum. Red curves represent homologous gene pairs. Gray lines in the background indicate the synteny blocks within the whole C. indicum.
-
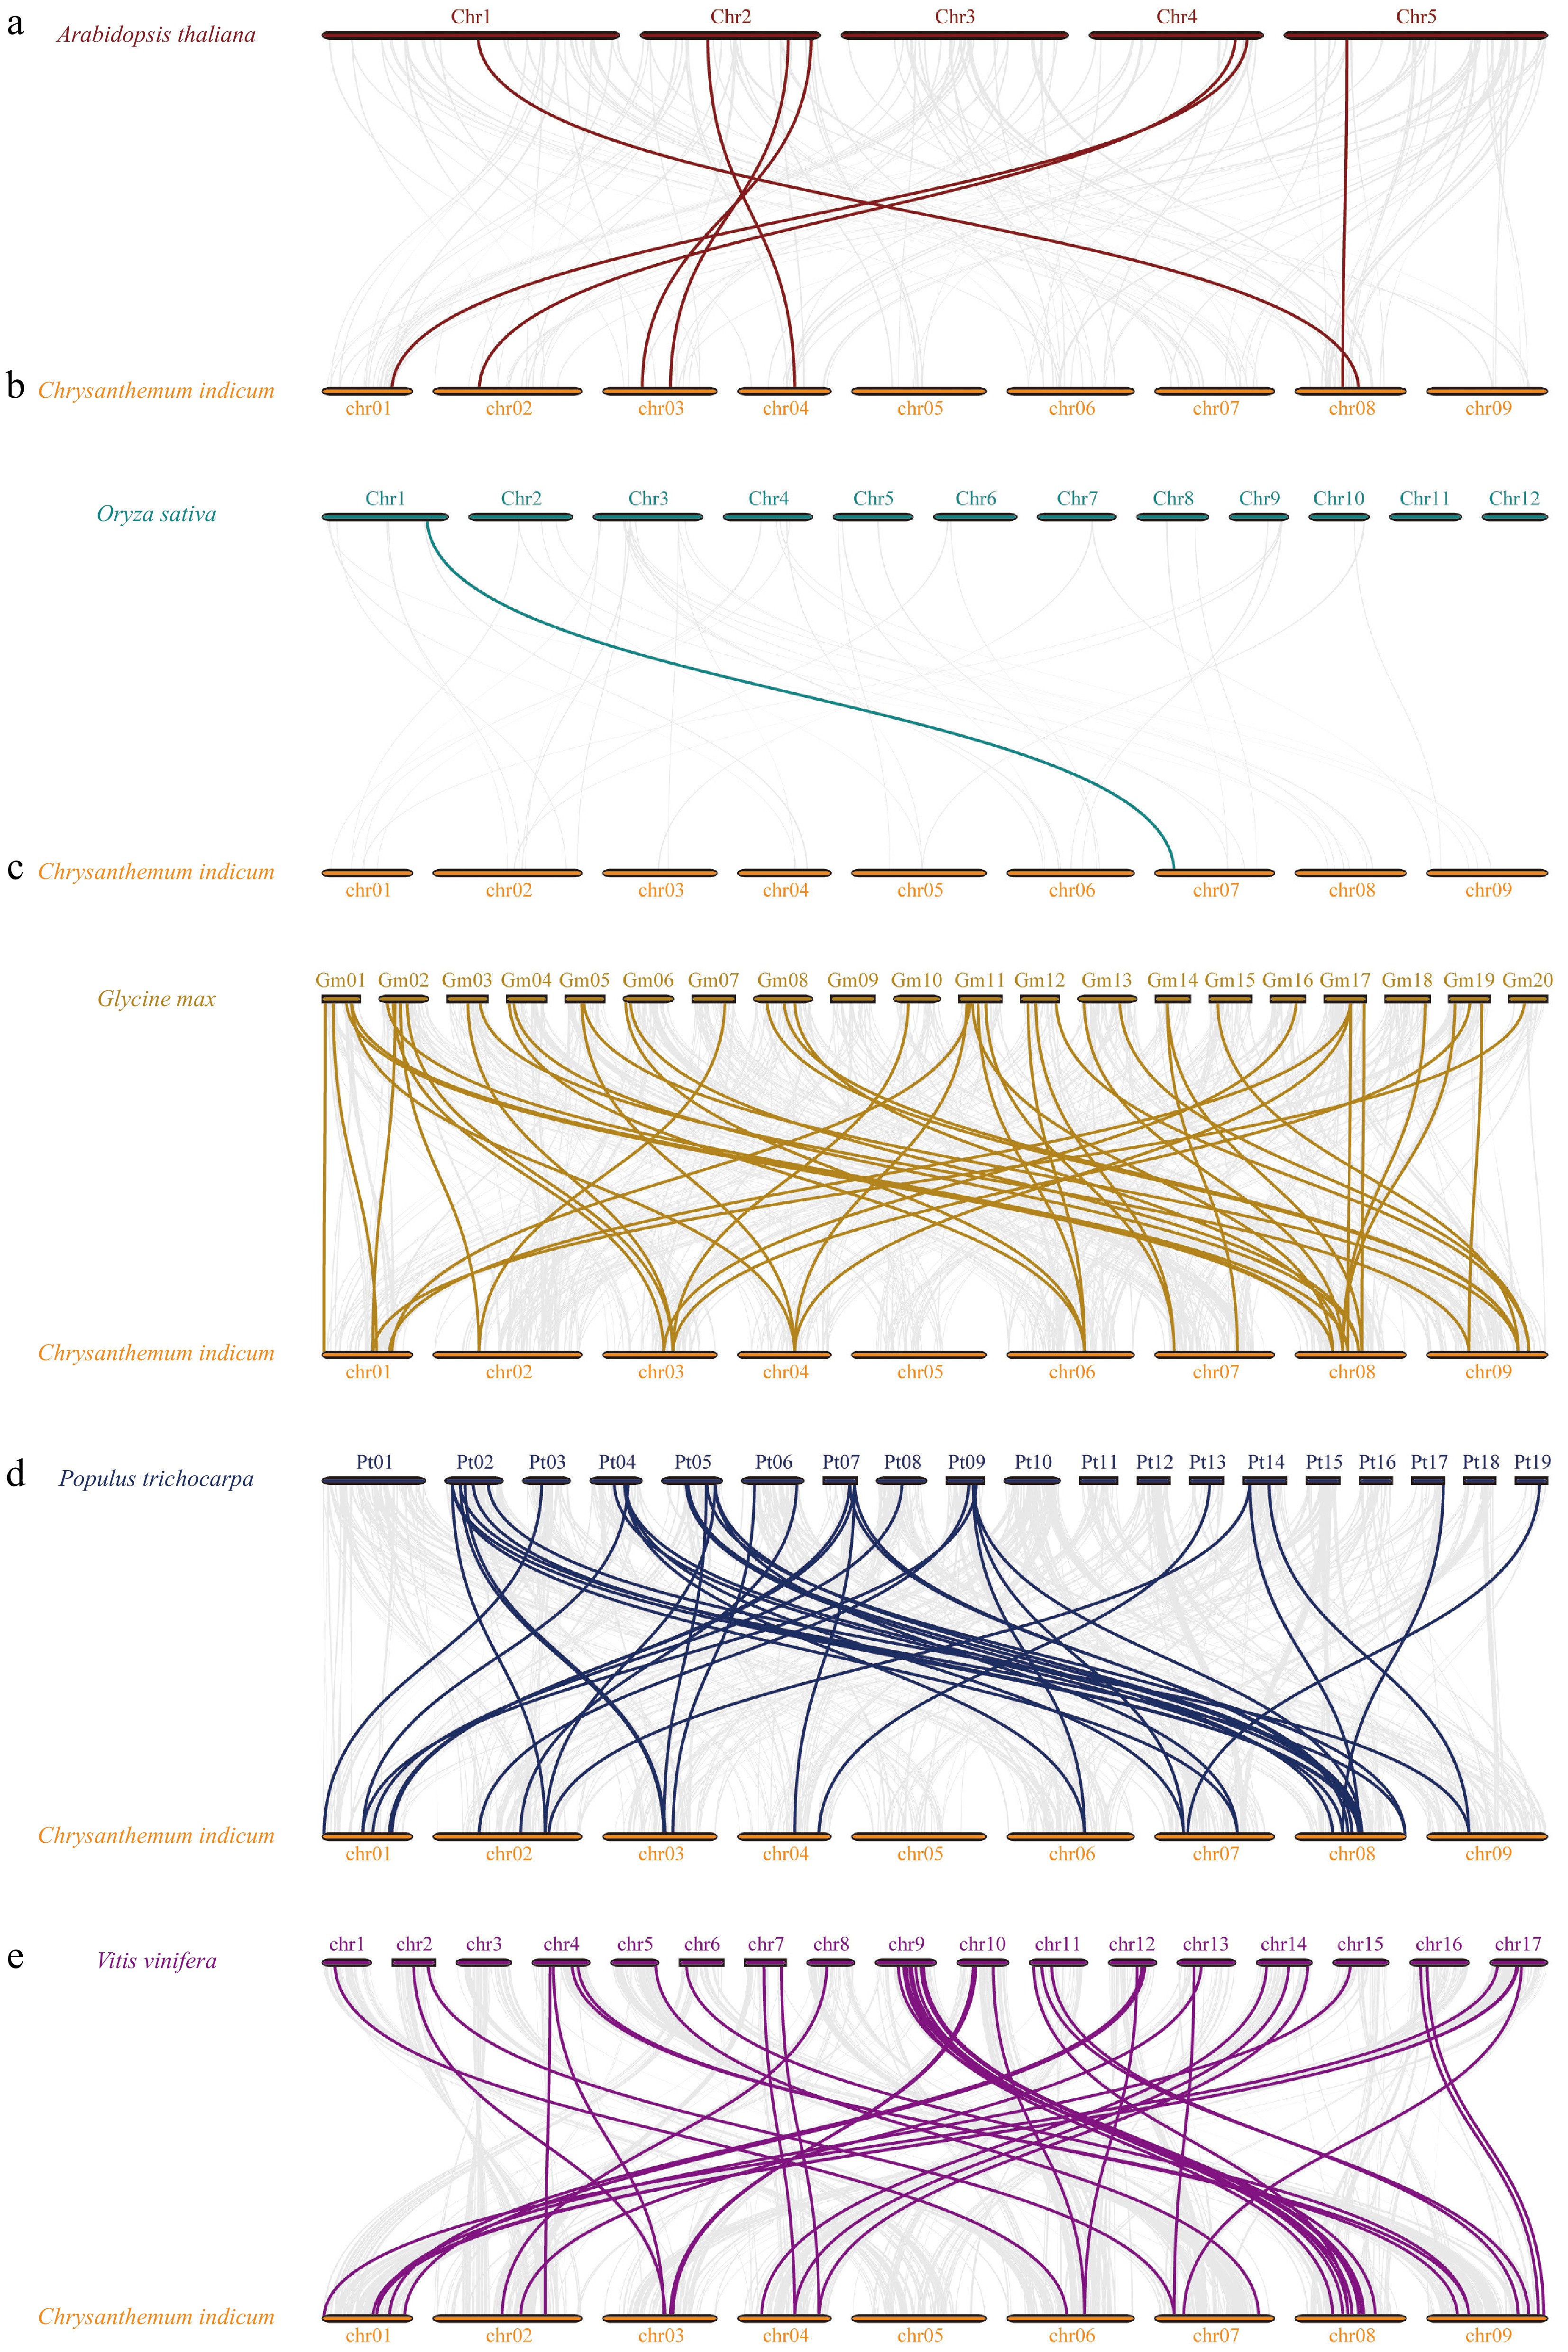
Figure 4.
Collinear analysis of CibZIP genes from C. indicum with five representative species. Synteny relationships of bZIPs between C. indicun with (a) A. thaliana, (b) O. sativa, (c) G. max, (d) P. trichocarpa, and (e) V. vinifera.
-
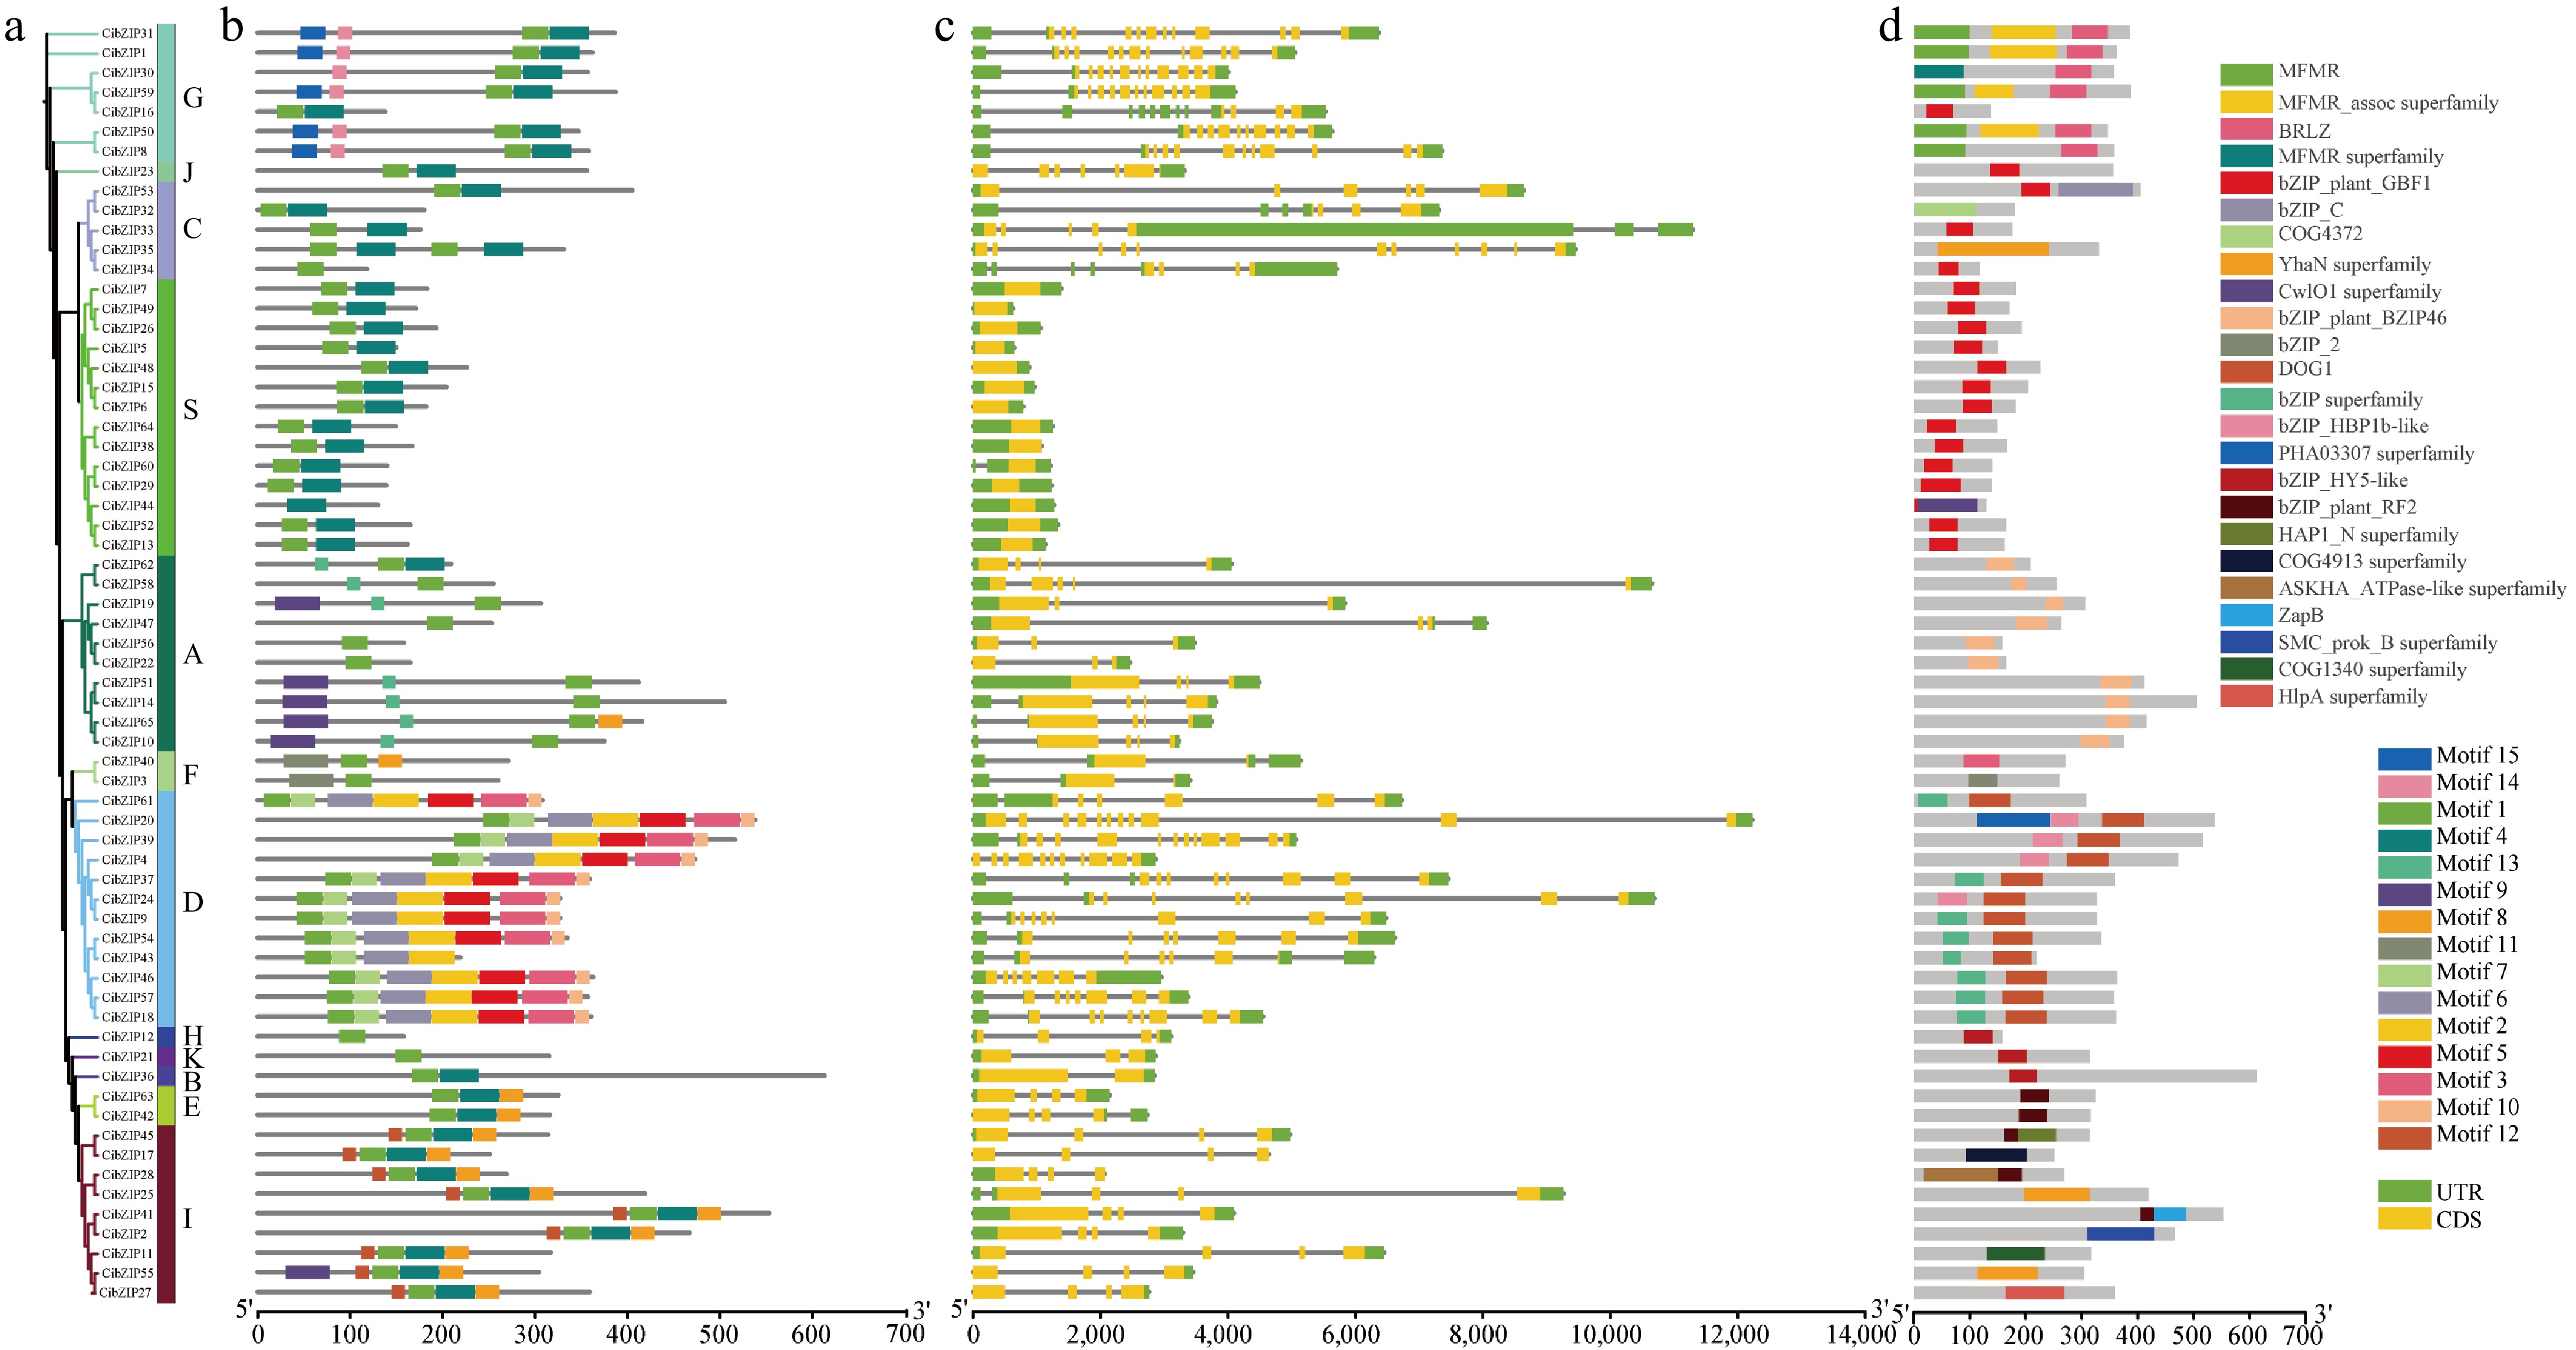
Figure 5.
Phylogenetic relationships, gene structures, conserved motifs and domains of CibZIPs. (a) The phylogenetic tree of 65 CibZIP family members. (b) Composition and distributions of conserved motifs in CibZIP proteins. (c) Exon-intron organization of CibZIP genes. Exons are shown as yellow rectangles; introns are shown as black lines, and the untranslated regions (UTR) are shown as green rectangles. (d) Domains distribution. The conserved domains are represented by different rectangle colors.
-
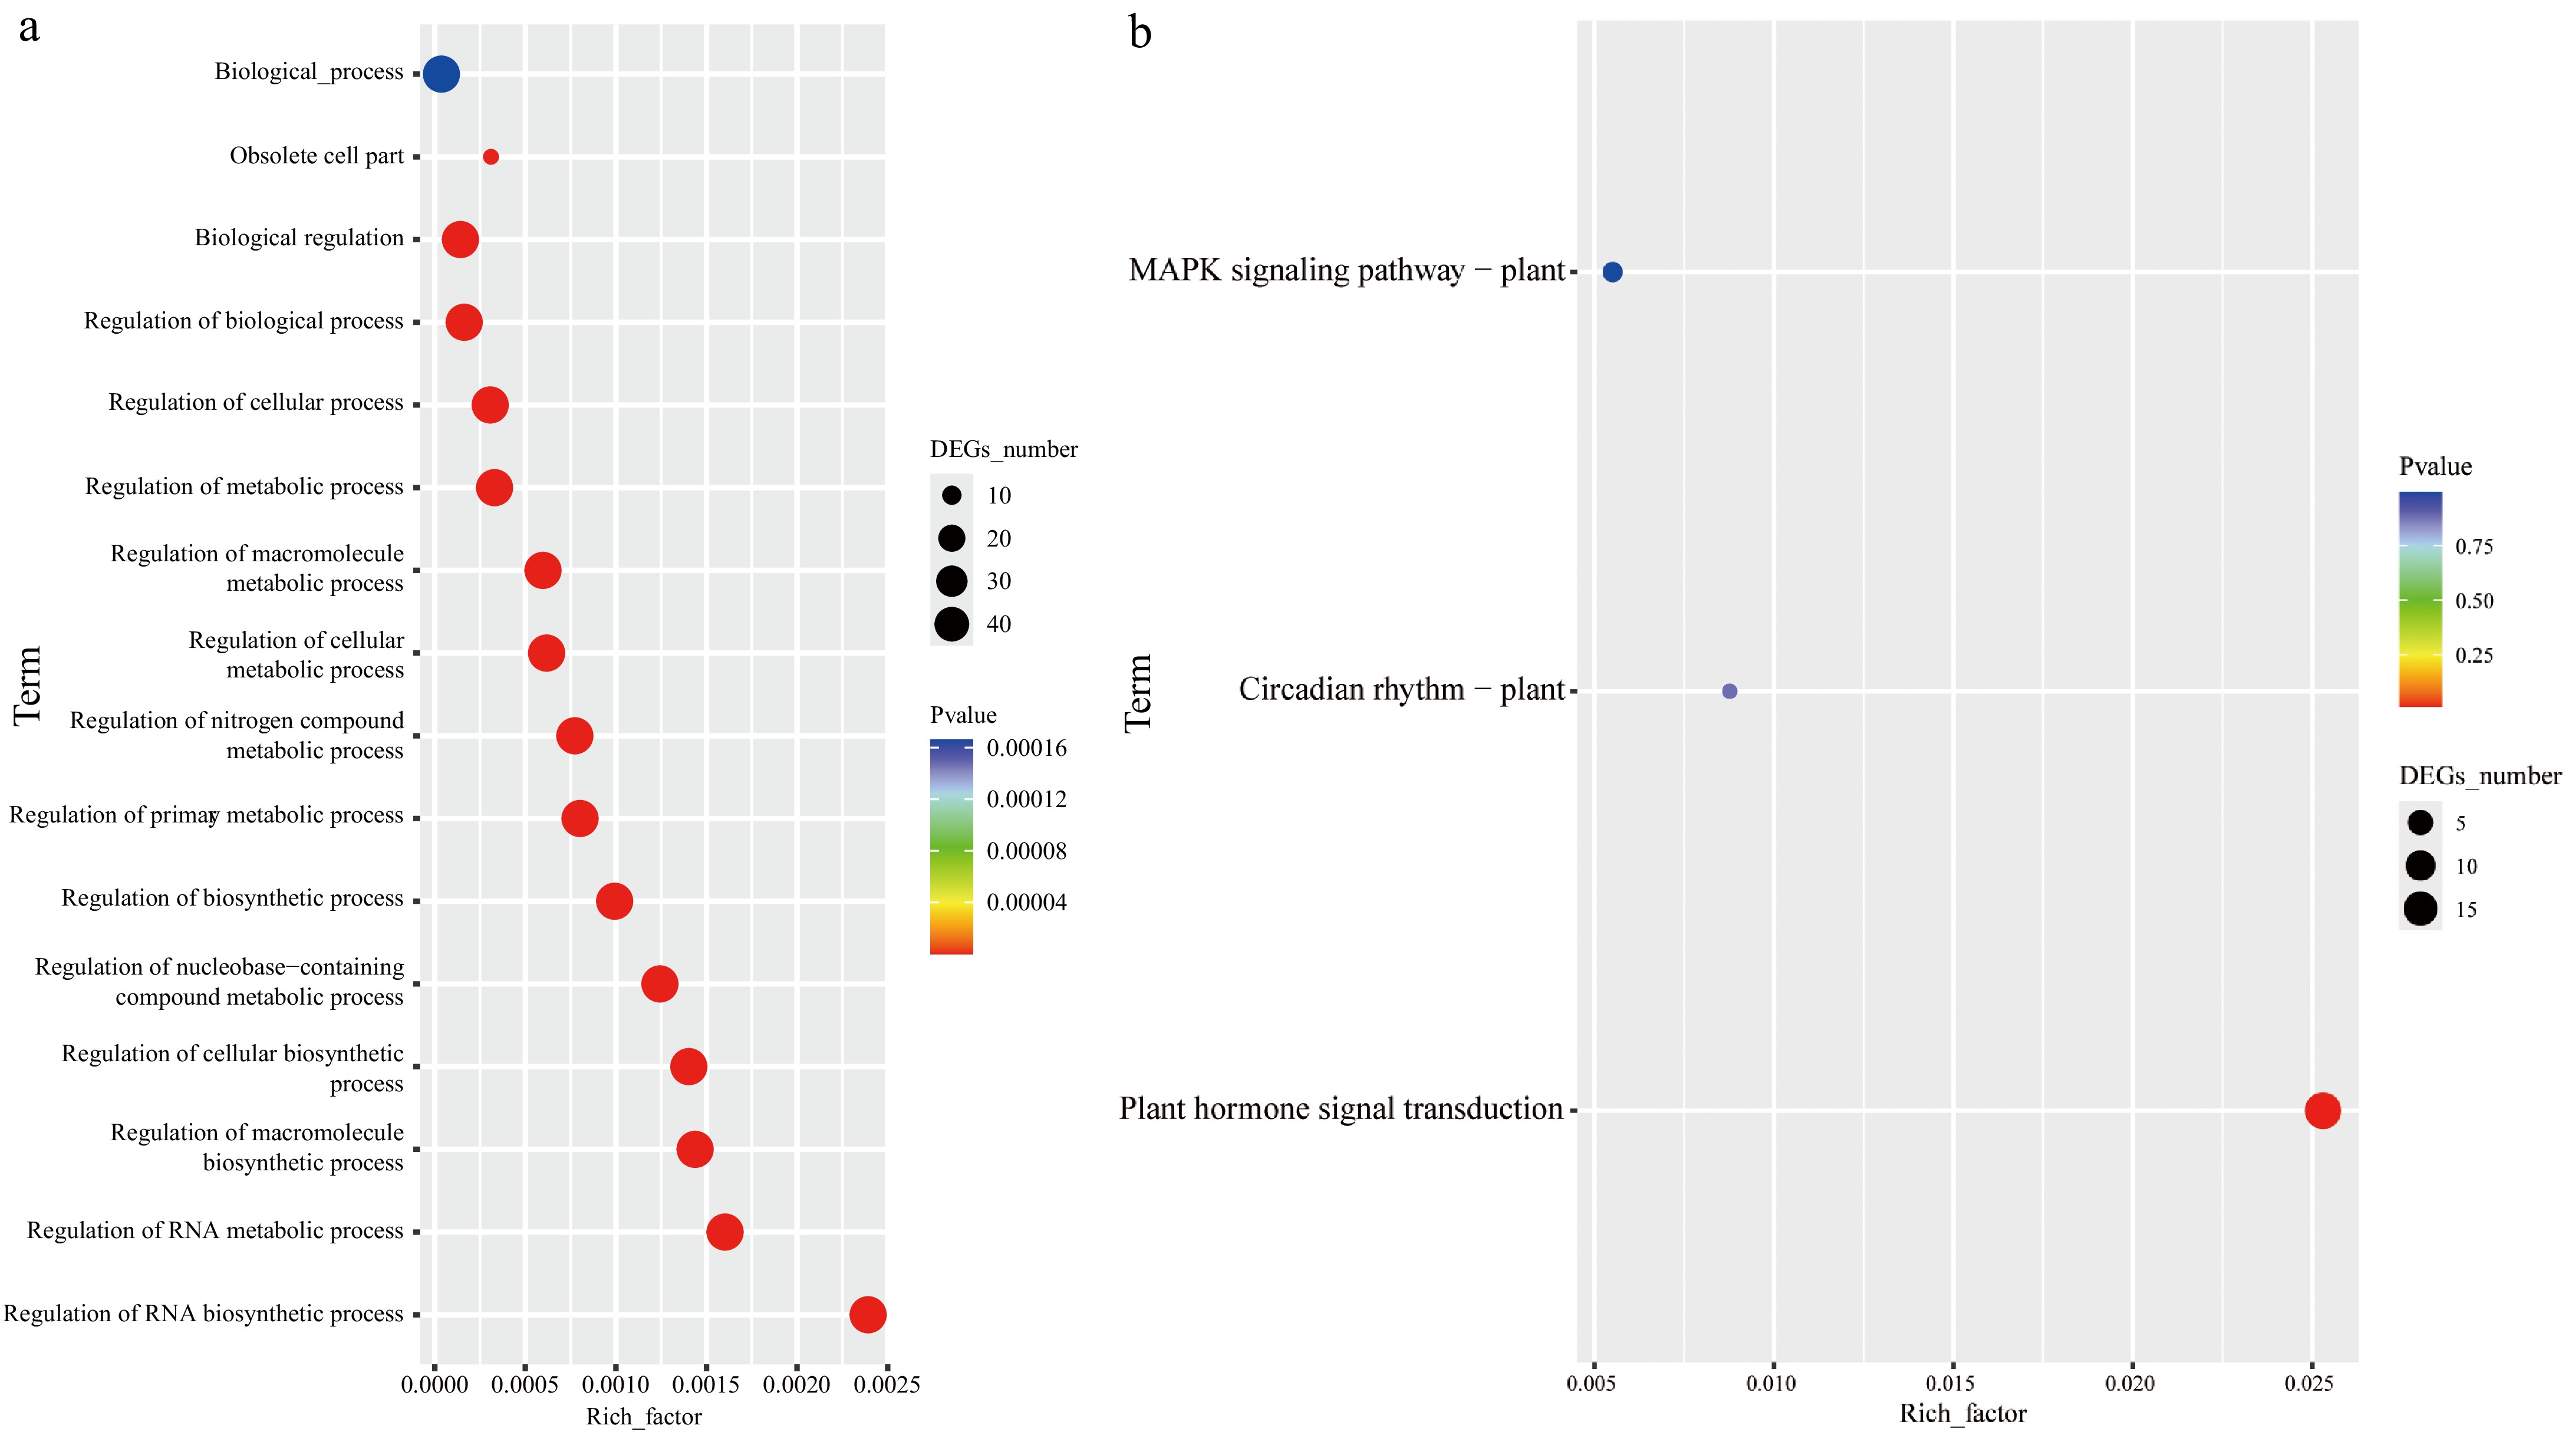
Figure 6.
Functional annotation of CibZIPs. (a) Highly enriched GO terms in CibZIPs; (b) highly enriched KEGG pathways in CibZIPs.
-
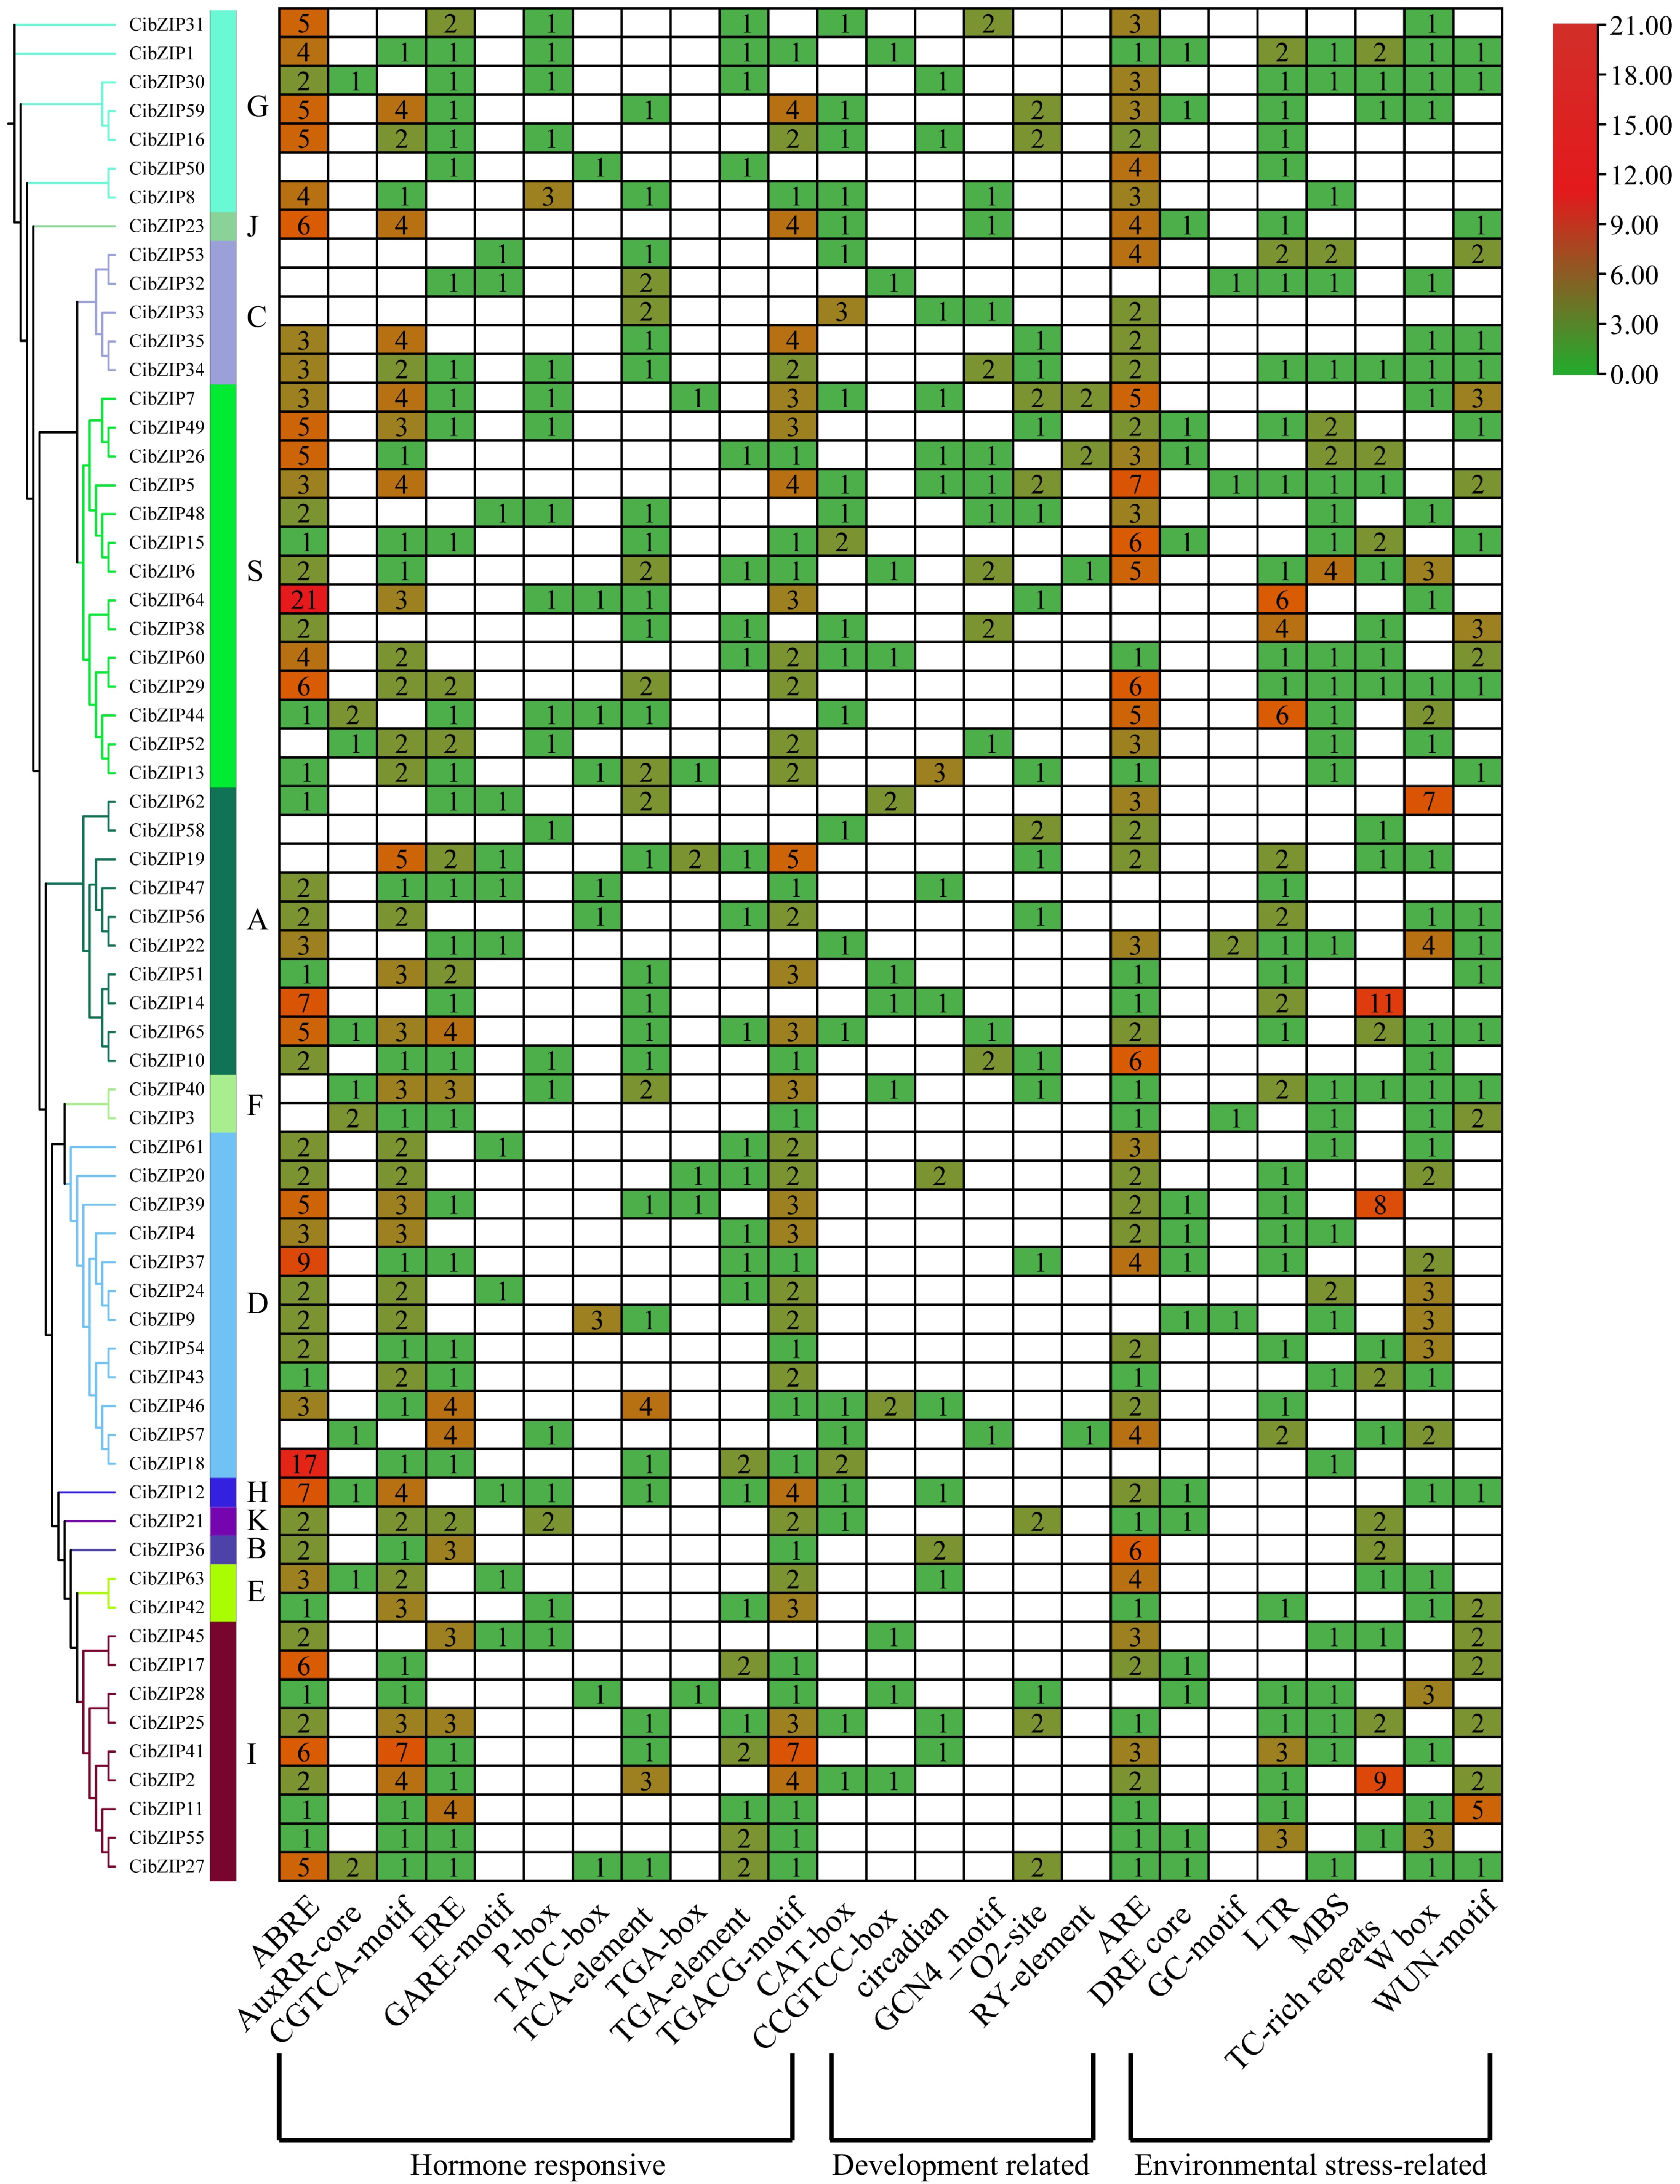
Figure 7.
Analysis of the putative cis-elements in promoters of CibZIP genes. The phylogenetic tree of 65 CibZIPs is presented on the left. The different colors and numbers in the heatmap represent the quantity of cis-acting elements in the promoter region of each CibZIP gene.
-
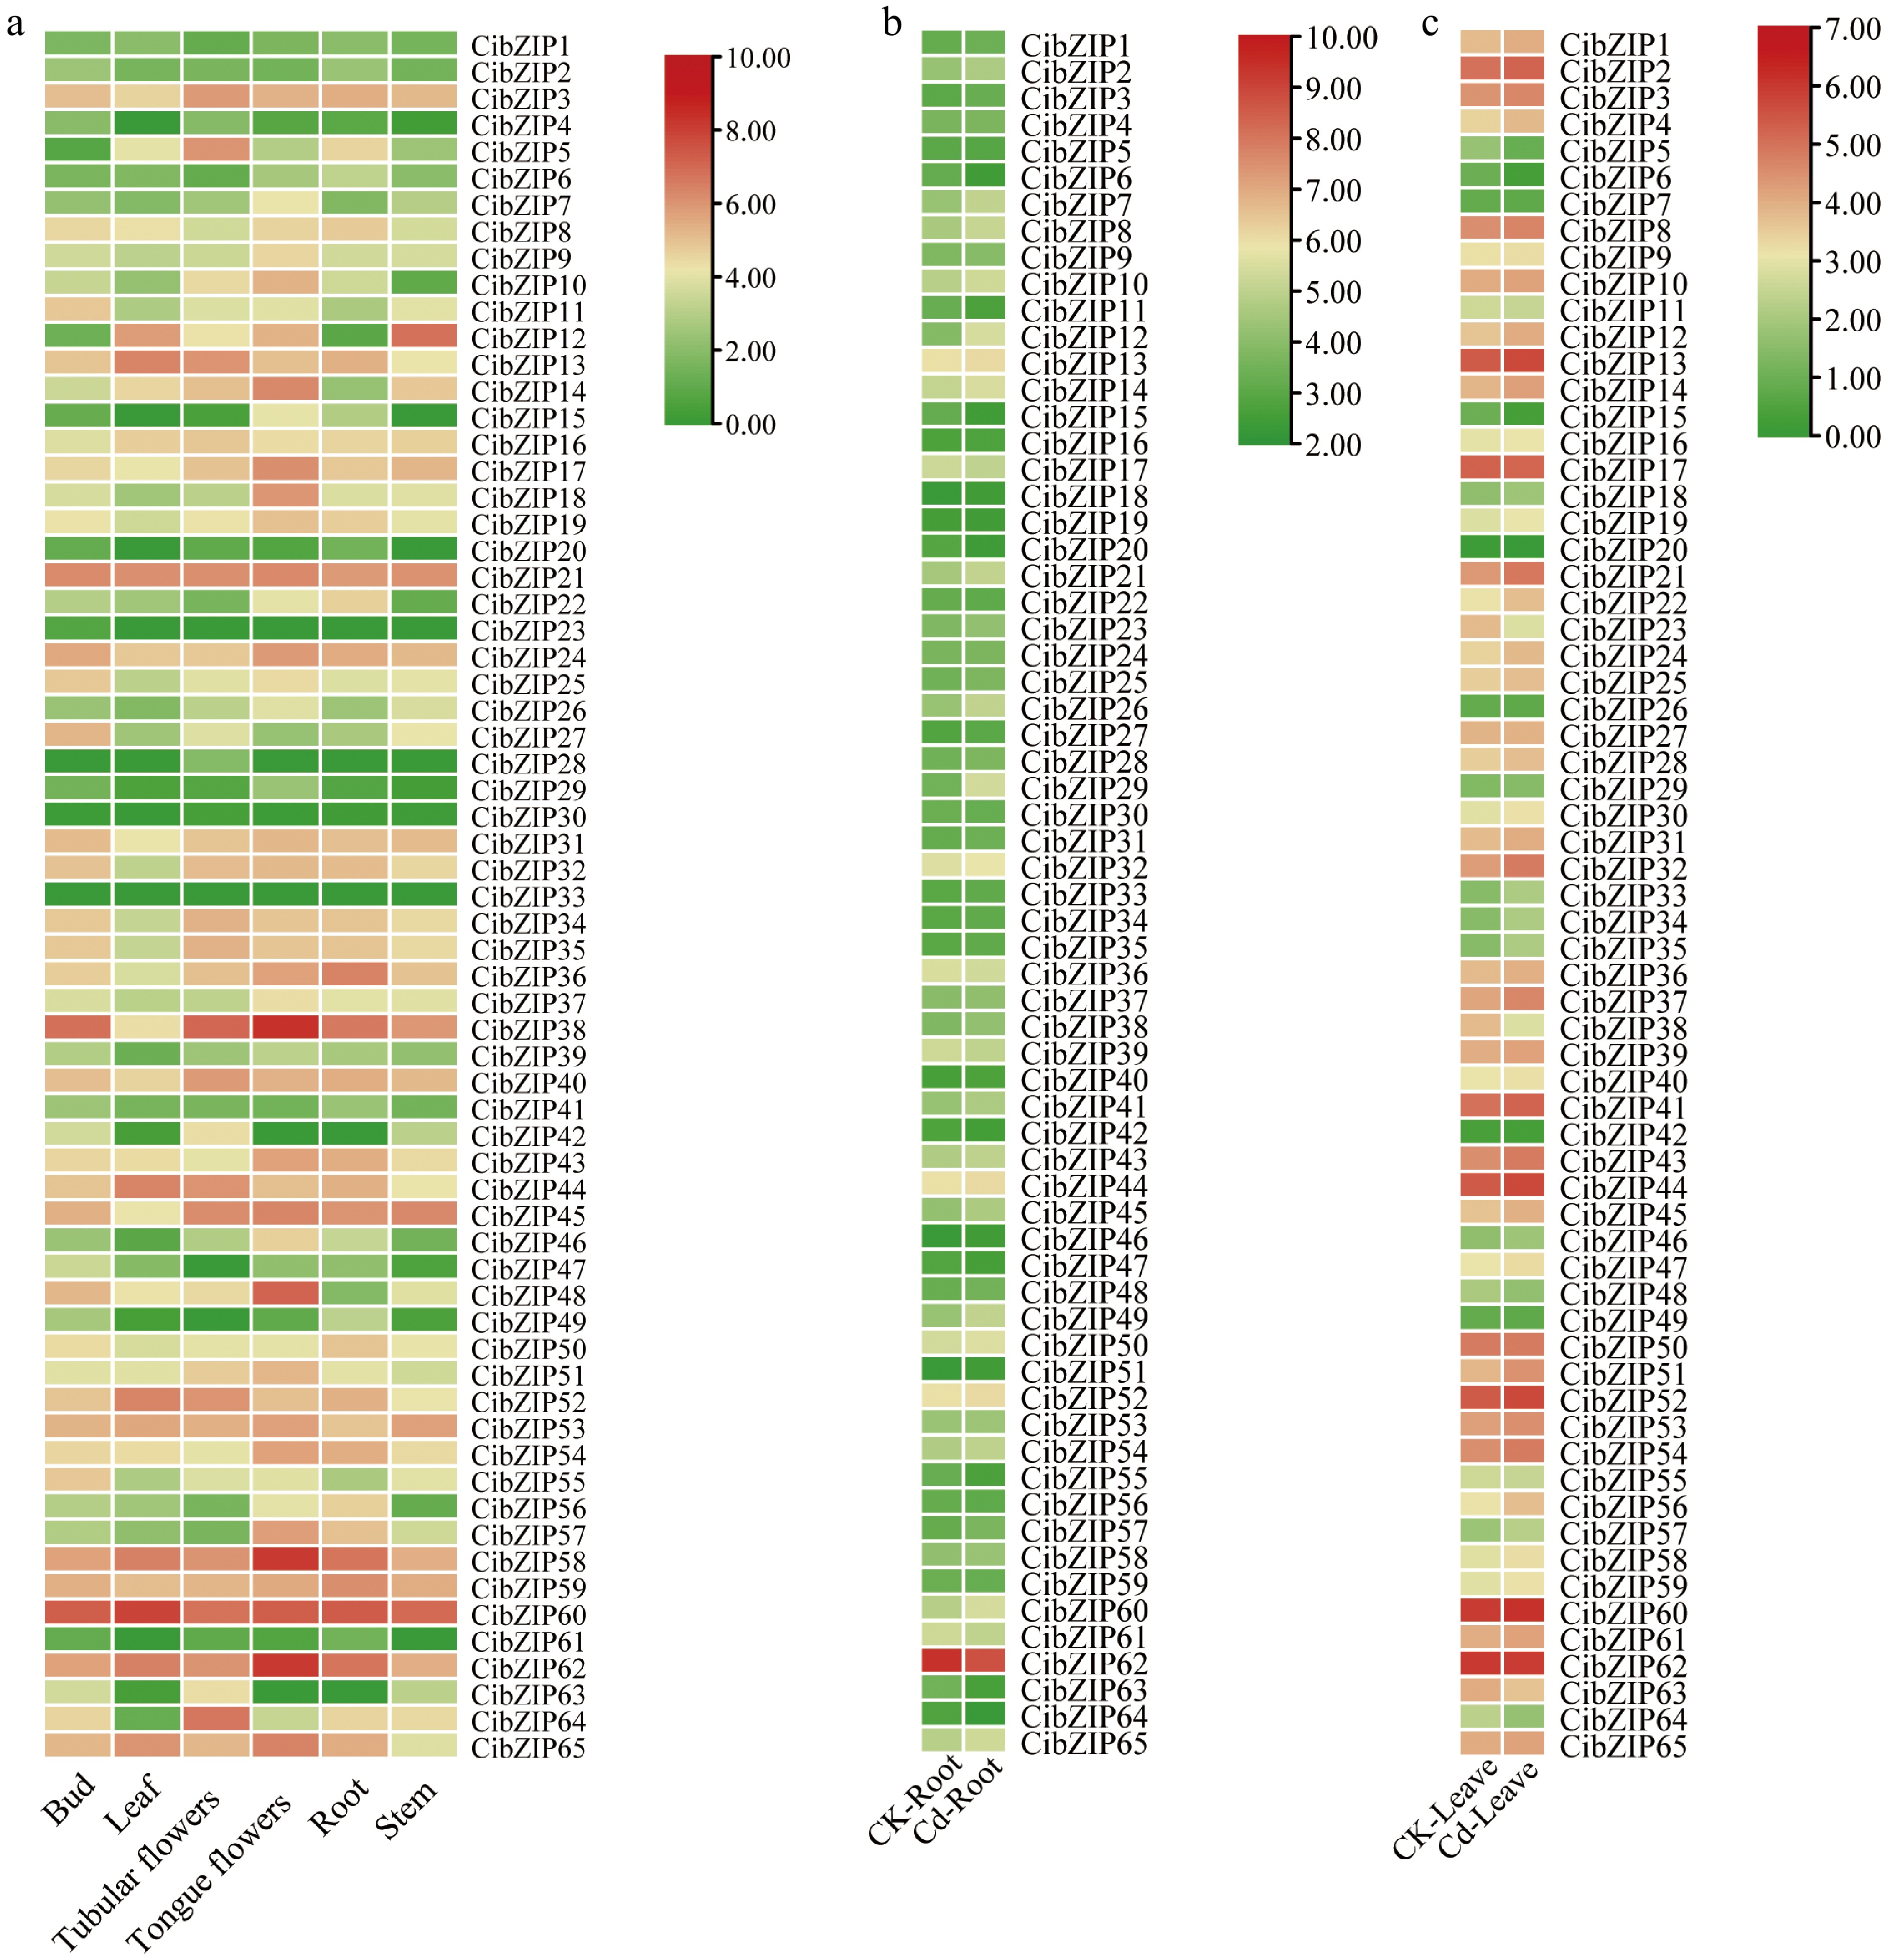
Figure 8.
Expression profiles of CibZIPs in different tissues under (a) normal conditions, and (b), (c) in response to Cd stress from RNA-seq data. Color scale at the right of the heatmap shows the expression level, red indicates high transcript abundance while green indicates low abundance.
-
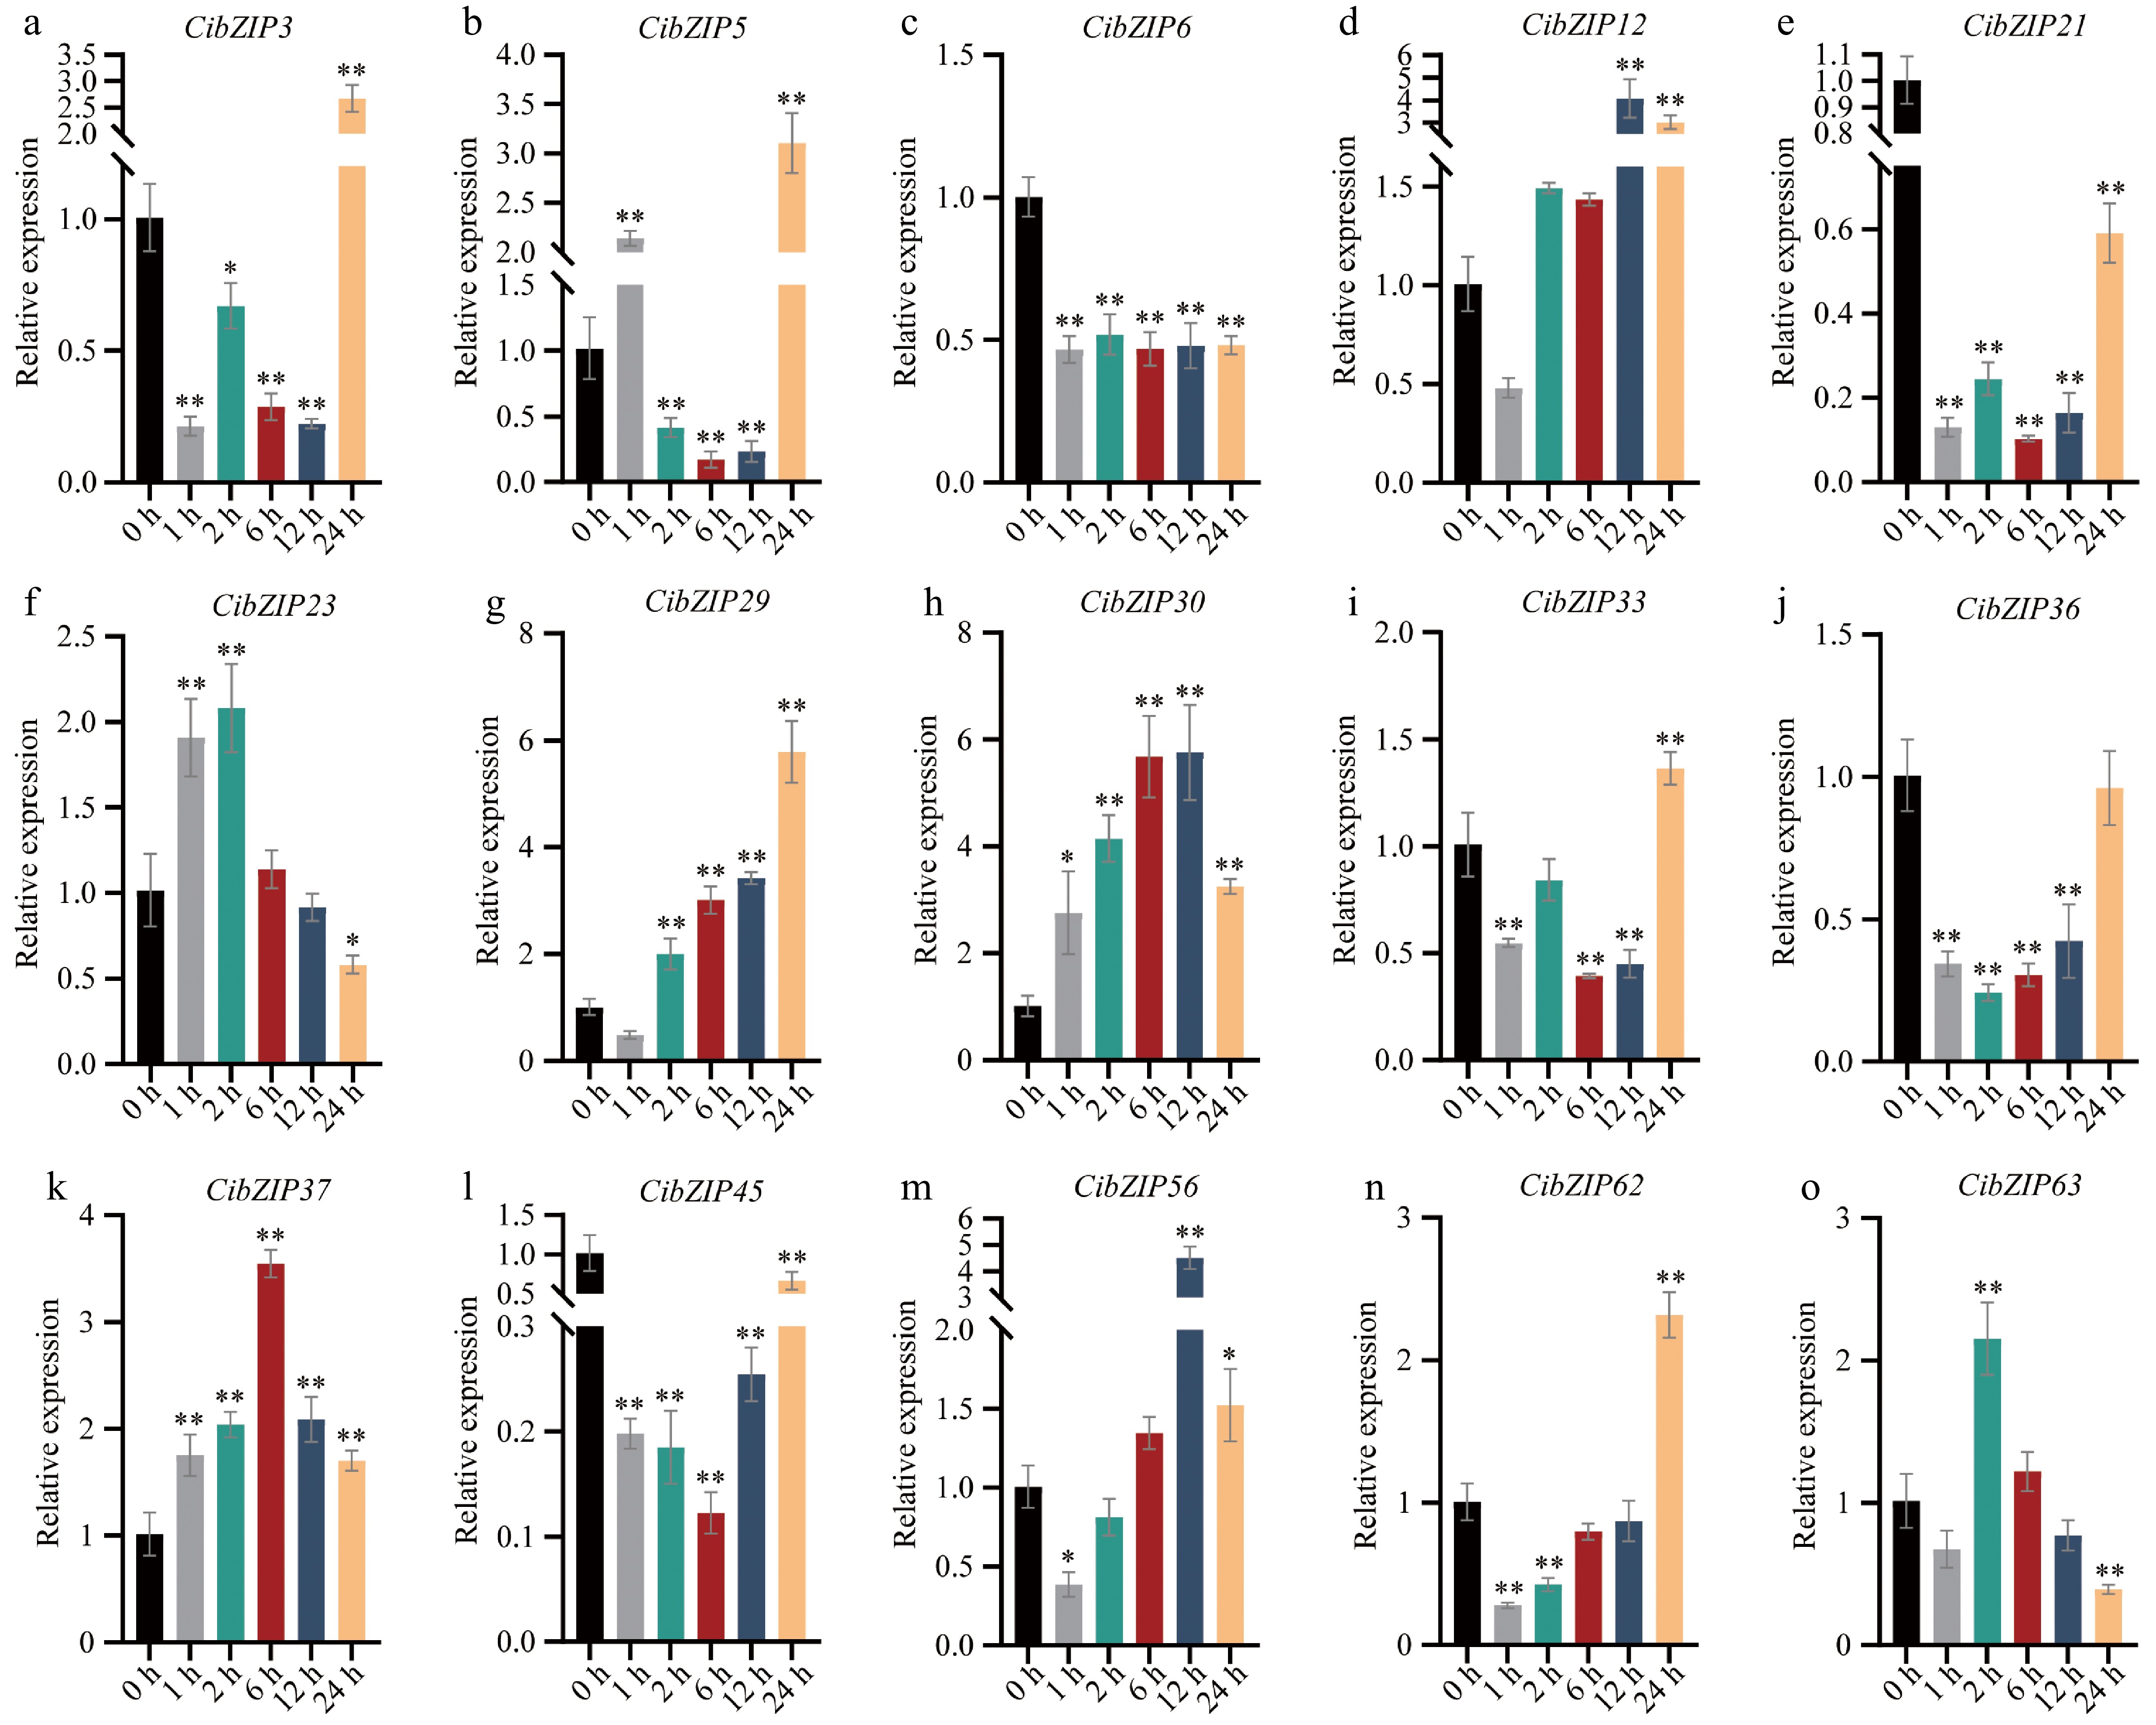
Figure 9.
(a)−(o) Expression pattern of C. indicum bZIPs in response to Cd stress determined by qRT-PCR. RNA from leaves at different points. The Y-axis indicates the relative expression level and the X-axis represents different time points after stress treatment taken for expression analysis. The data presented are the average of three biological replicates, the bar represents the standard deviation (T-test, *p < 0.05, **p < 0.01).
-
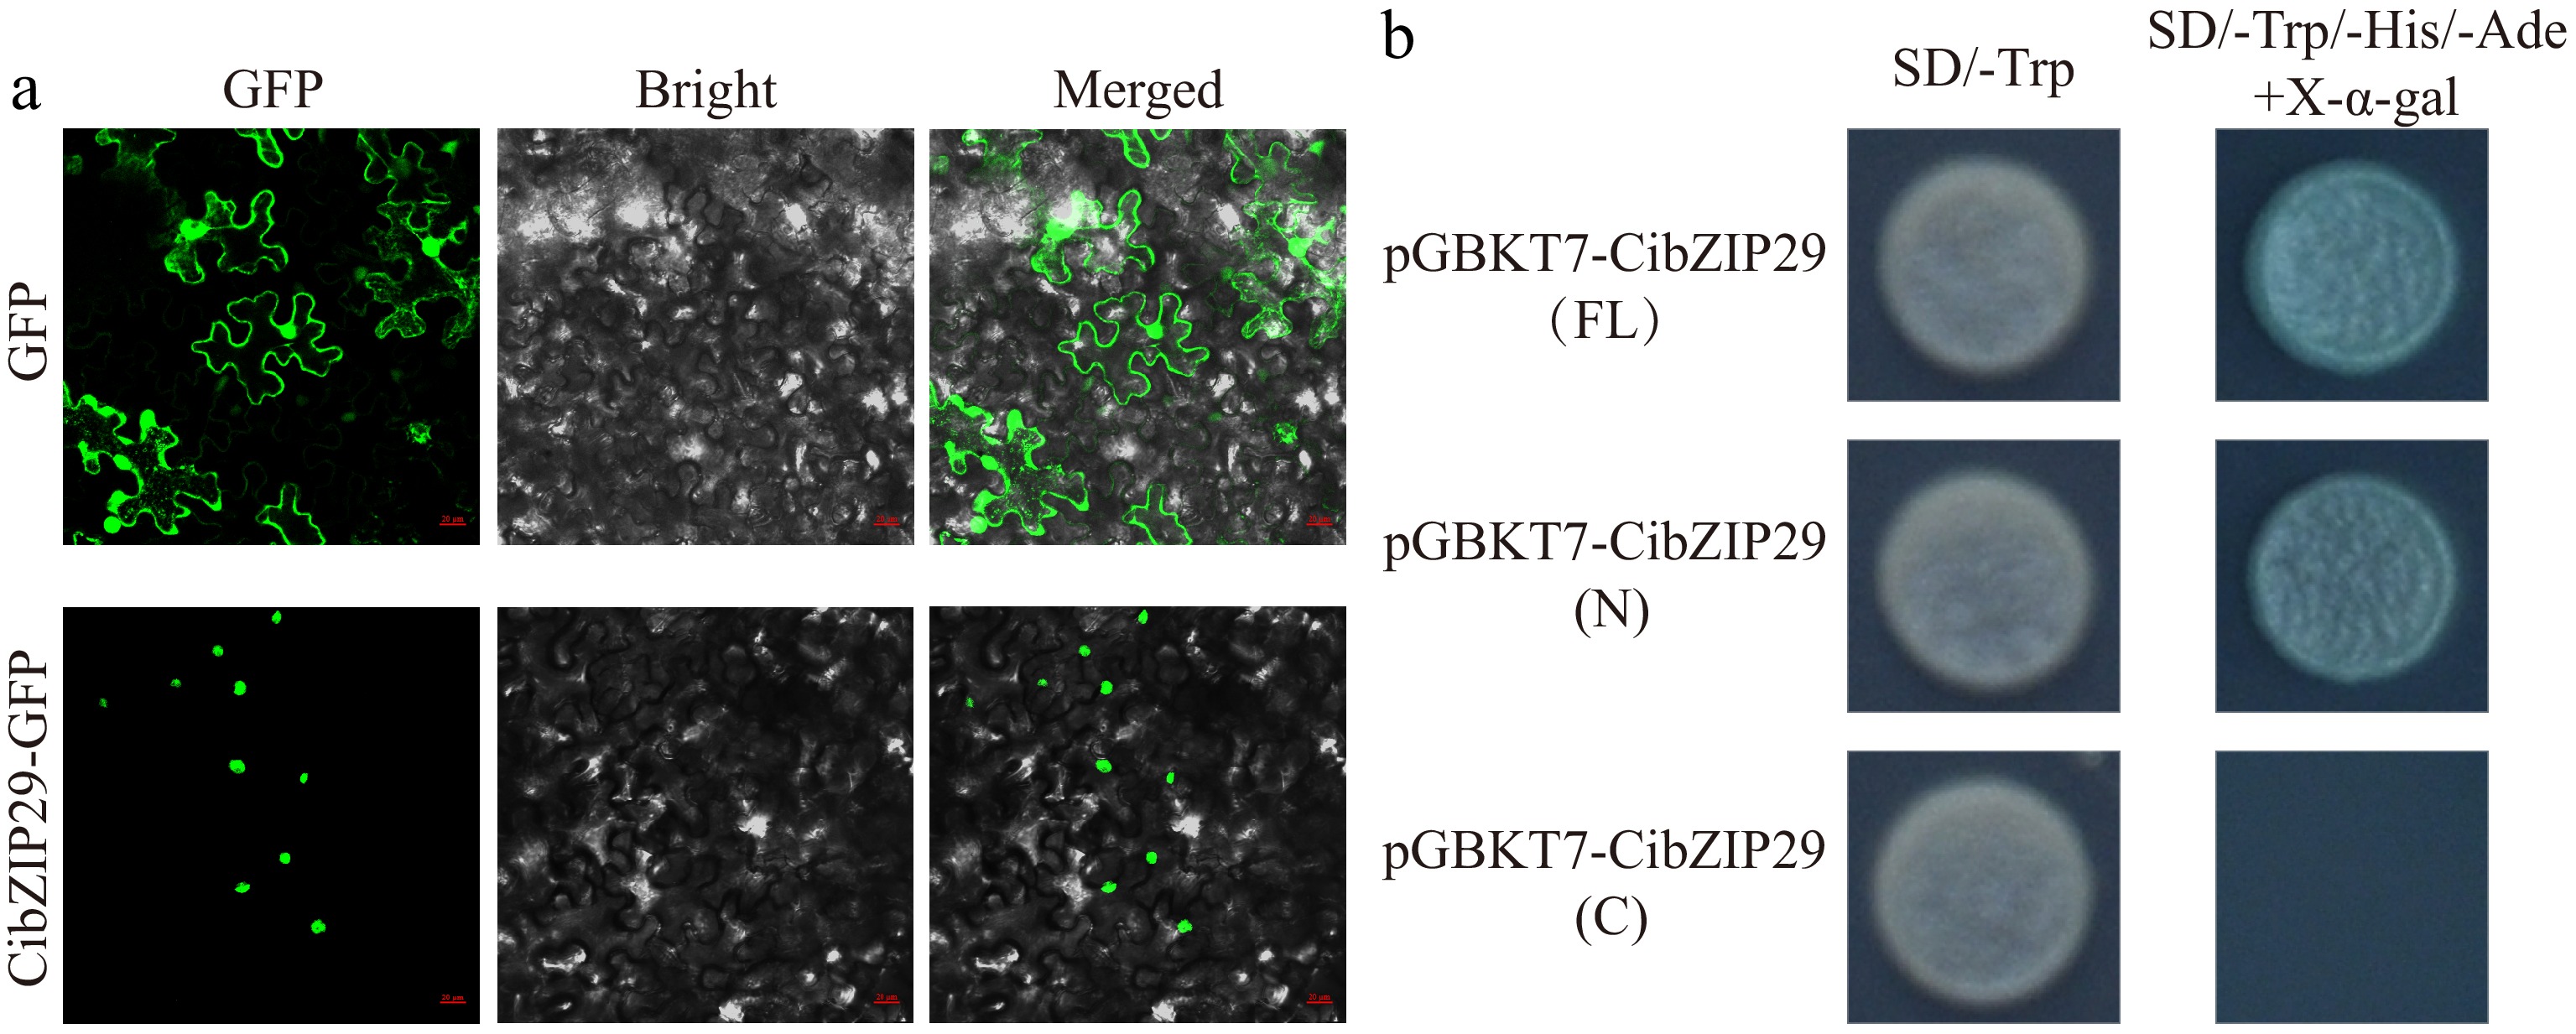
Figure 10.
Subcellular localization and transcriptional activation analysis of CibZIP29 protein. (a) Subcellular localization assay of the CibZIP29 protein. Scale bar: 20 μm; (b) Transcription activation domain identification of CibZIP29 protein in yeast cells.
-
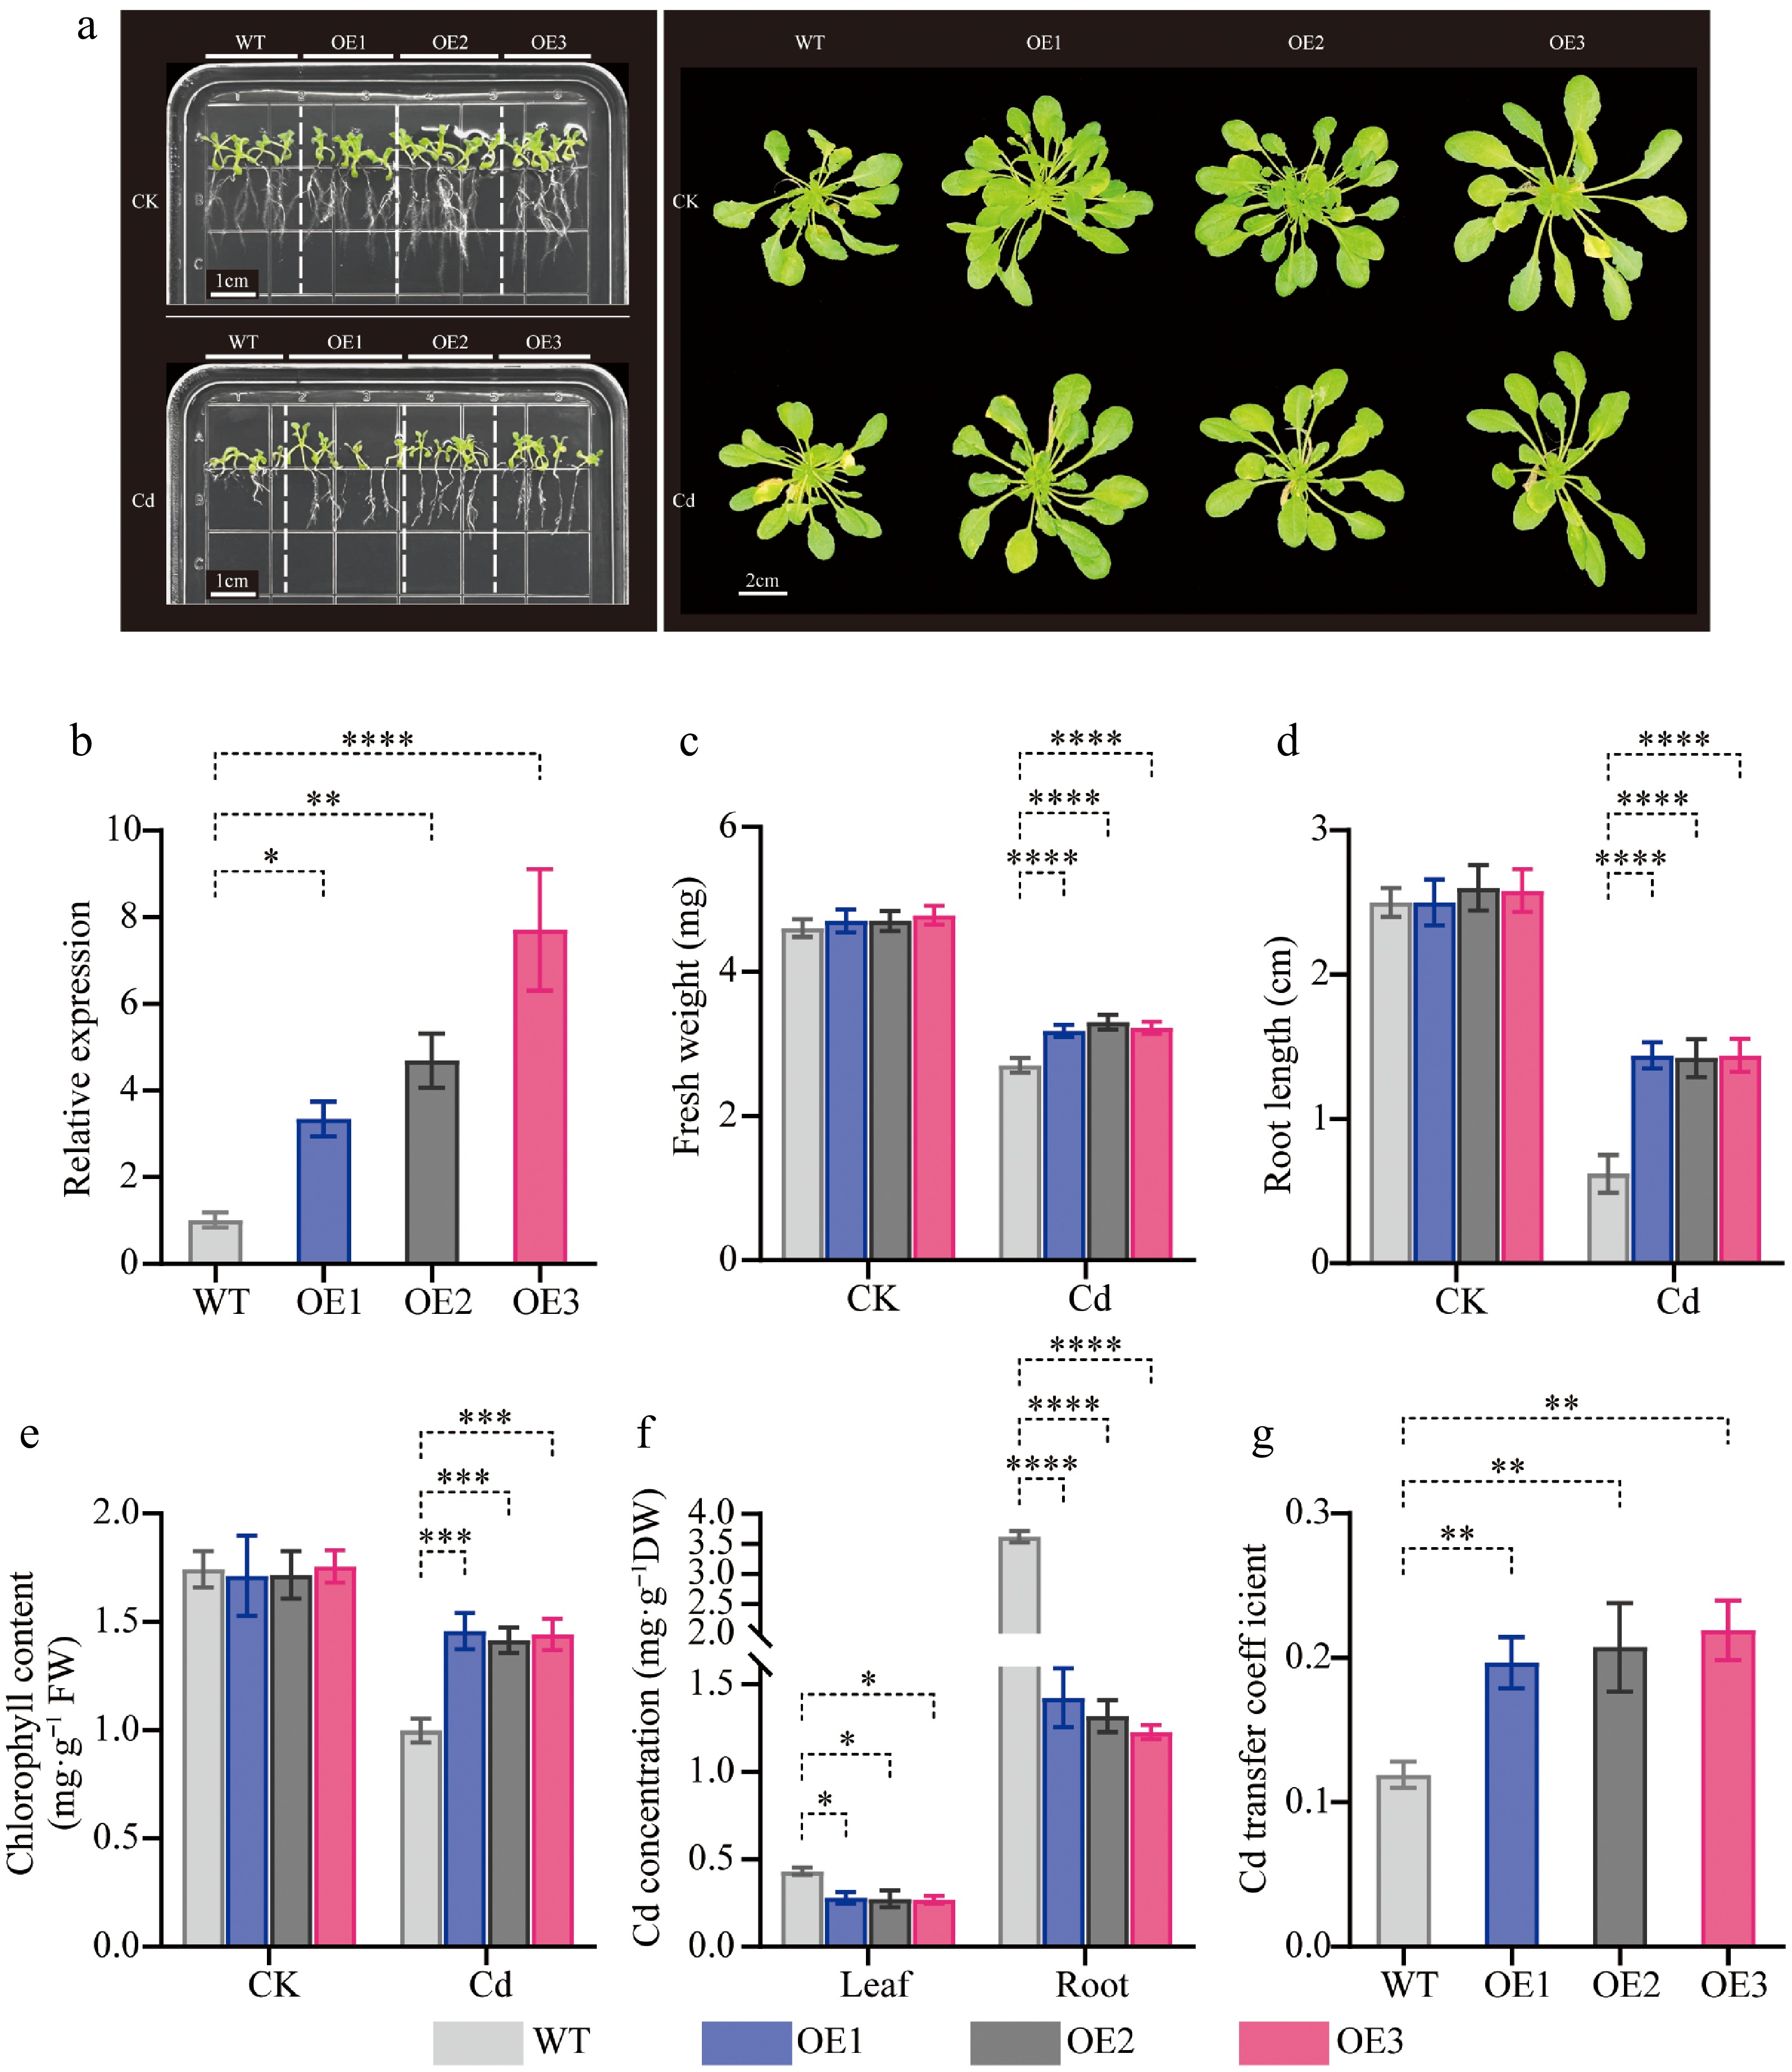
Figure 11.
Phenotypic analysis of transgenic CibZIP29-overexpressing Arabidopsis seedlings under Cd treatment. (a) Phenotype of transgenic Arabidopsis lines and WT plants under Cd stress; (b) The expression level of transgenic lines; (c) Fresh weight; (d) Root length; (e) Total chlorophyll content; (f) Cd concentration; (g) Cd transfer coefficient (T-test, * p < 0.05, ** p < 0.01, *** p < 0.001, **** p < 0.0001).
-
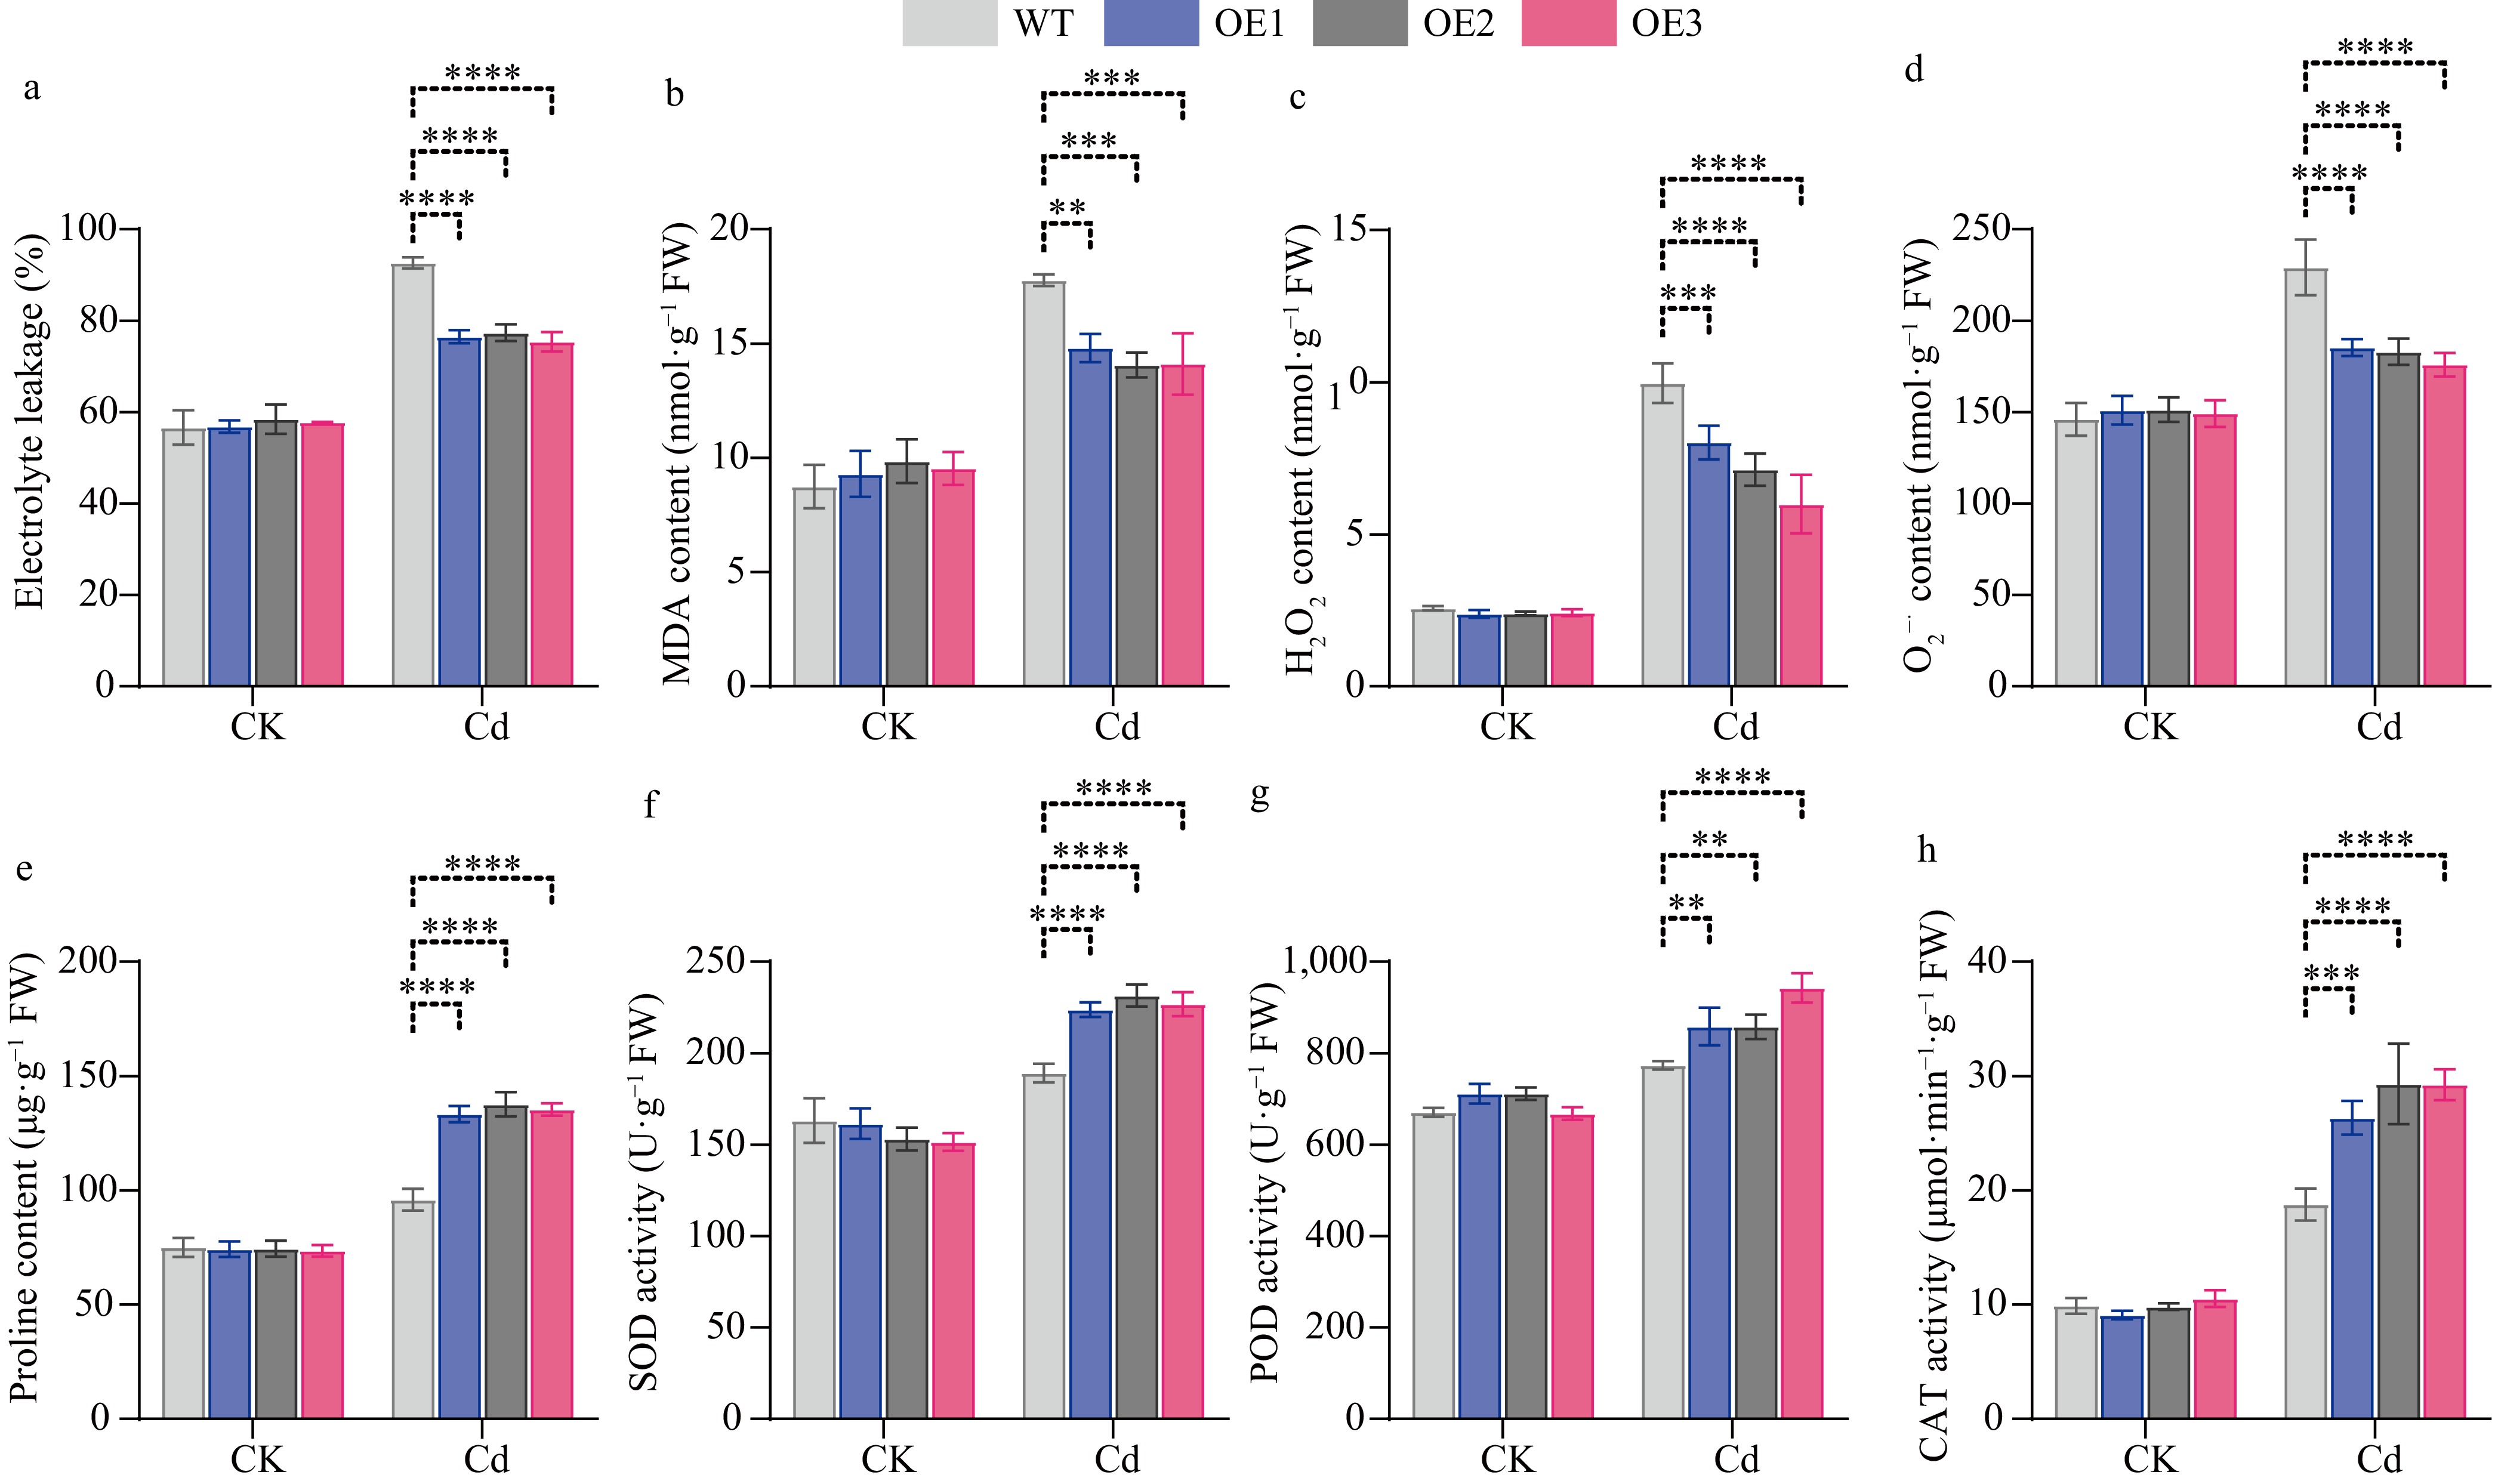
Figure 12.
Physiological indices of WT and transgenic CibZIP29 lines in Arabidopsis. (a) REL; (b) MDA content; (c) H2O2 content; (d) O2−· content; (e) Proline content; (f) SOD activity; (g) POD activity; (h) CAT activity (T-test, * p < 0.05, ** p < 0.01, *** p < 0.001, **** p < 0.0001).
Figures
(12)
Tables
(0)