-
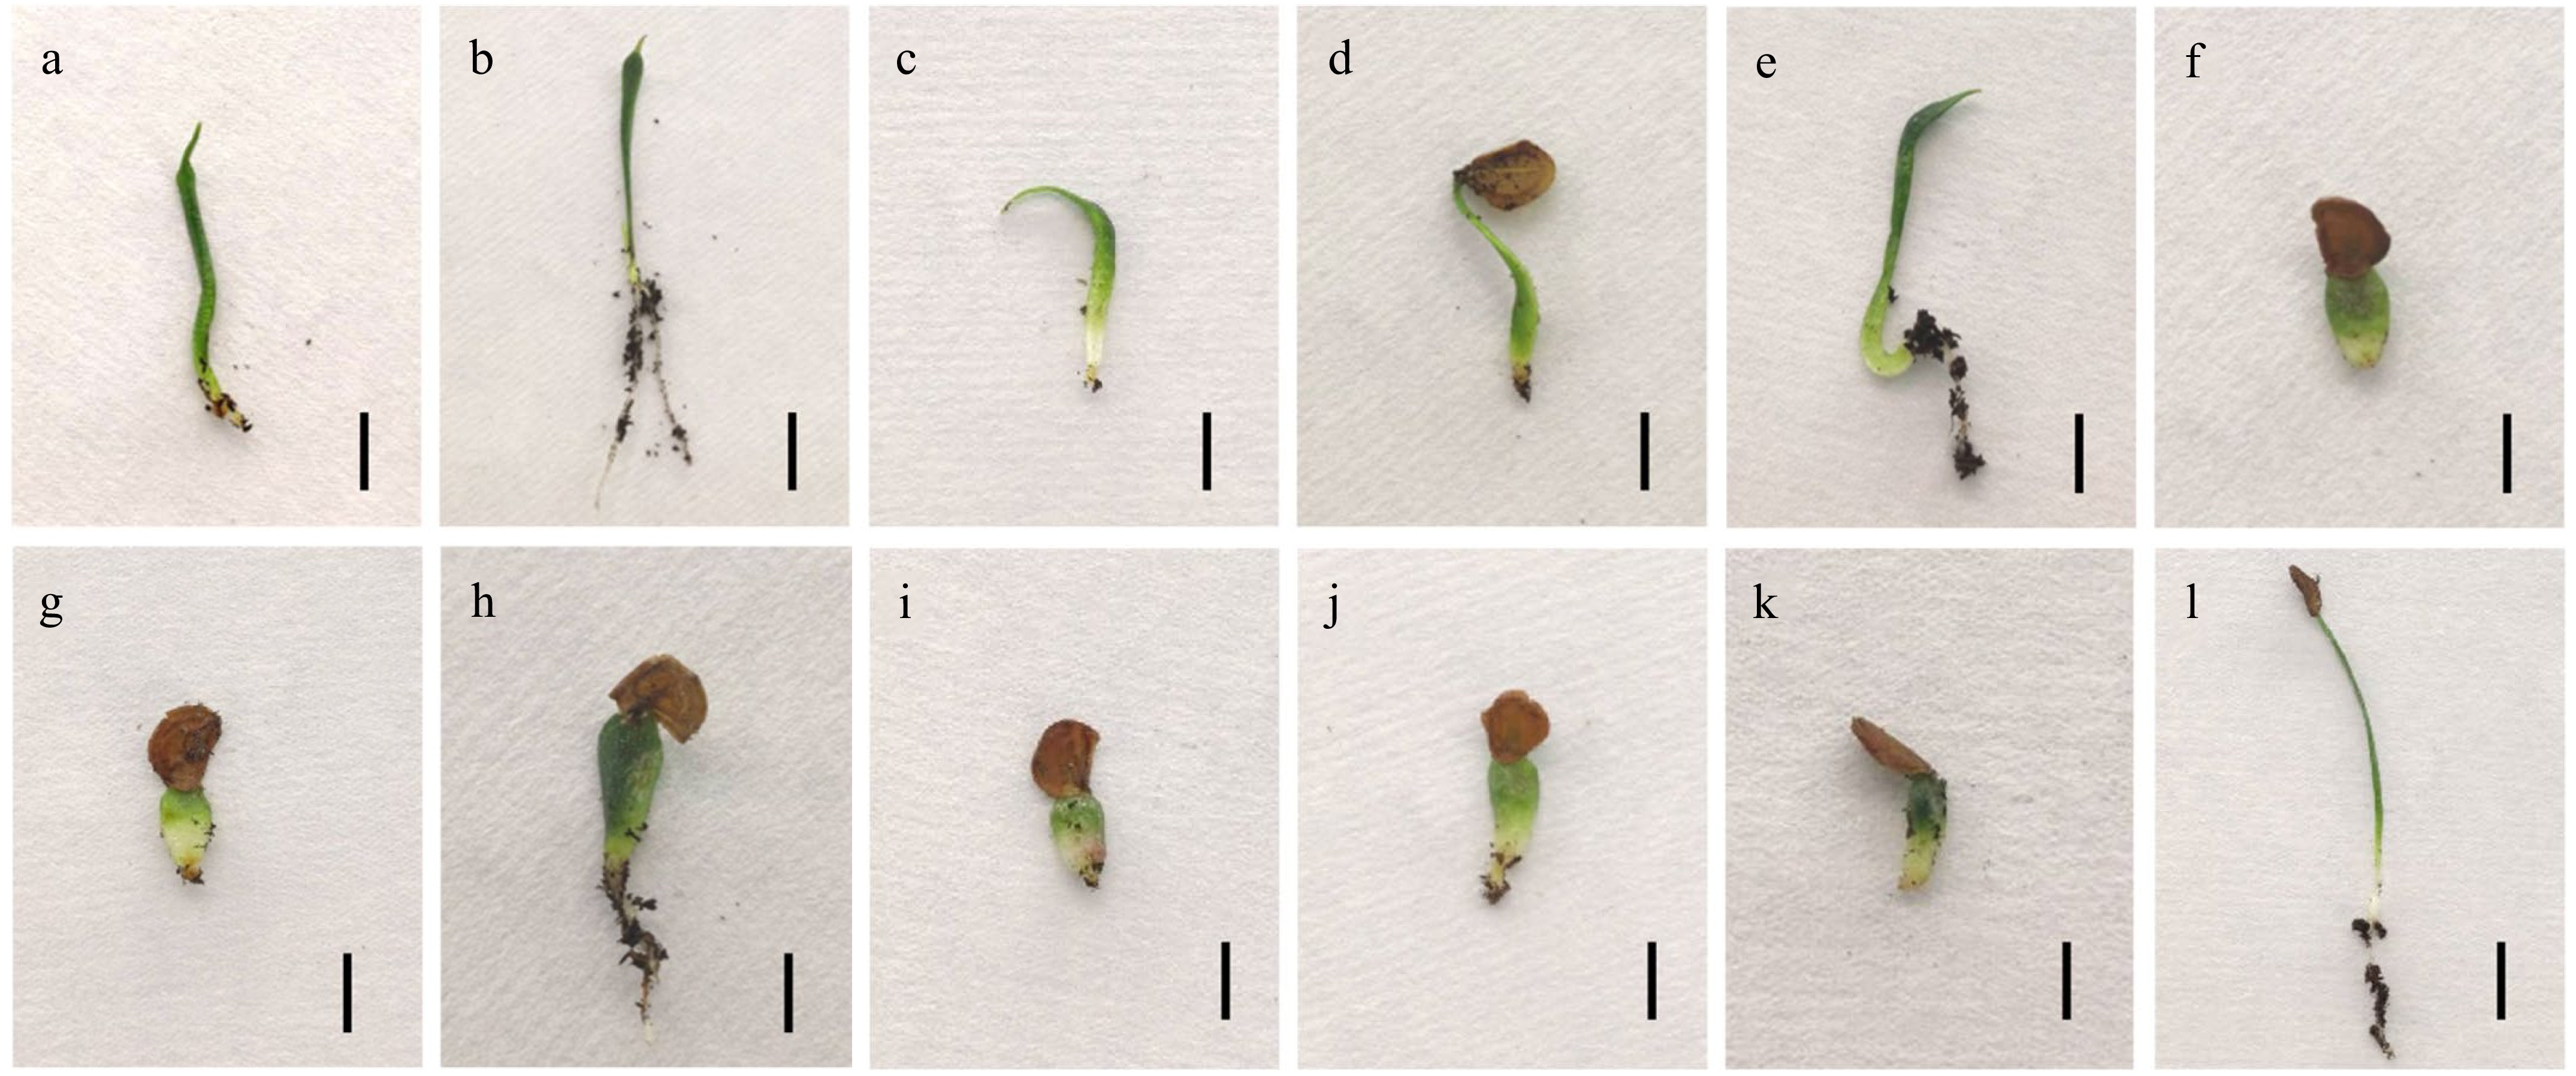
Figure 1.
Colchicine-induced morphological variation in L. leichtlinii var. Maximowiczii seedlings at 42 d. (a) Coarsening and malformed growth of the embryo. (b) Bulging at the tip of the embryo and damage to the growing point. (c) Malformation at the tip of the embryo. (d) Malformation of the lower hypocotyl. (e) Bent and malformed growth of the embryo. (f) Shortening, thickening, and coarsening of the embryo with a rough surface. (g) Imprint. (h) Embryo thickening and darkening in colour. (i) Droplet-shaped. (j) Embryo thickening. (k) Slow growth. (l) Control seedling. Scale bars represent (a)−(k) 8 mm, and (l) 12.8 mm.
-
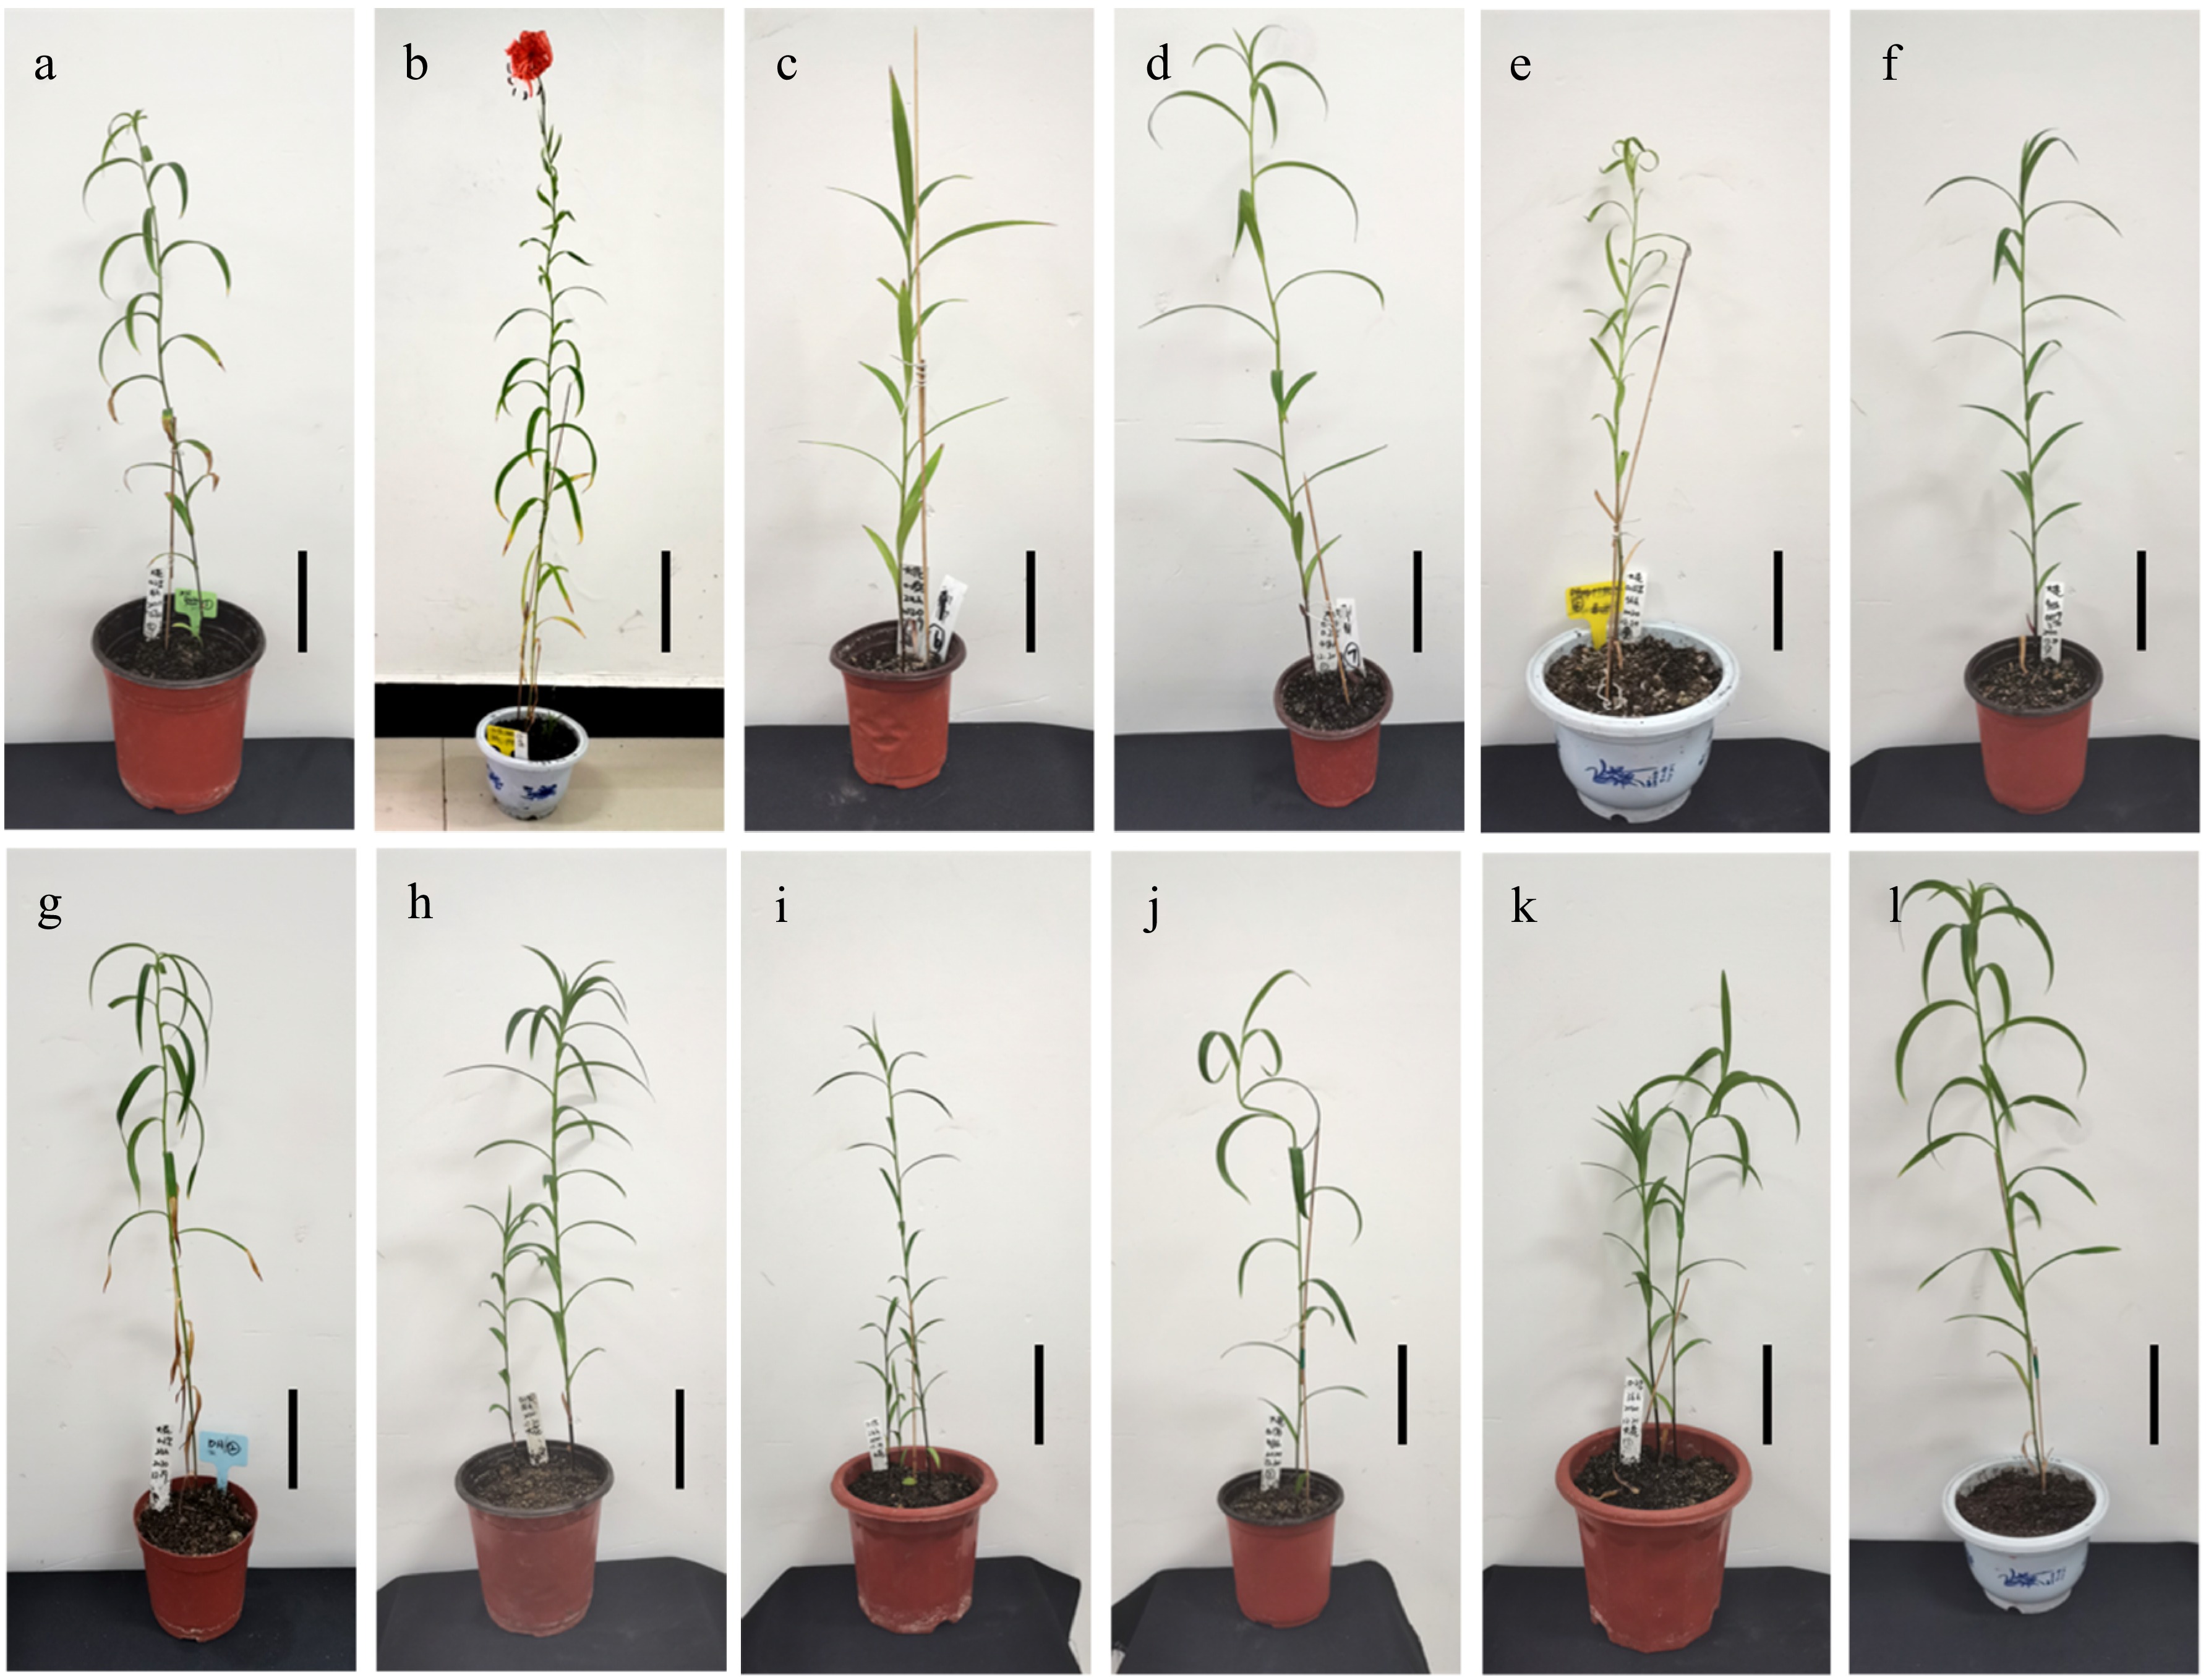
Figure 2.
The plant morphology in suspected mutant plants after growth for 17 months in the greenhouse. (a)−(k) No. 1−No. 11 mutant plants. (l) L. leichtlinii var. Maximowiczii control. Scale bars represent (a, h, i, k, l) 11.25 cm, (b) 15 cm, (c, d, f, g, i) 7.5 cm, and (e) 10 cm, respectively.
-
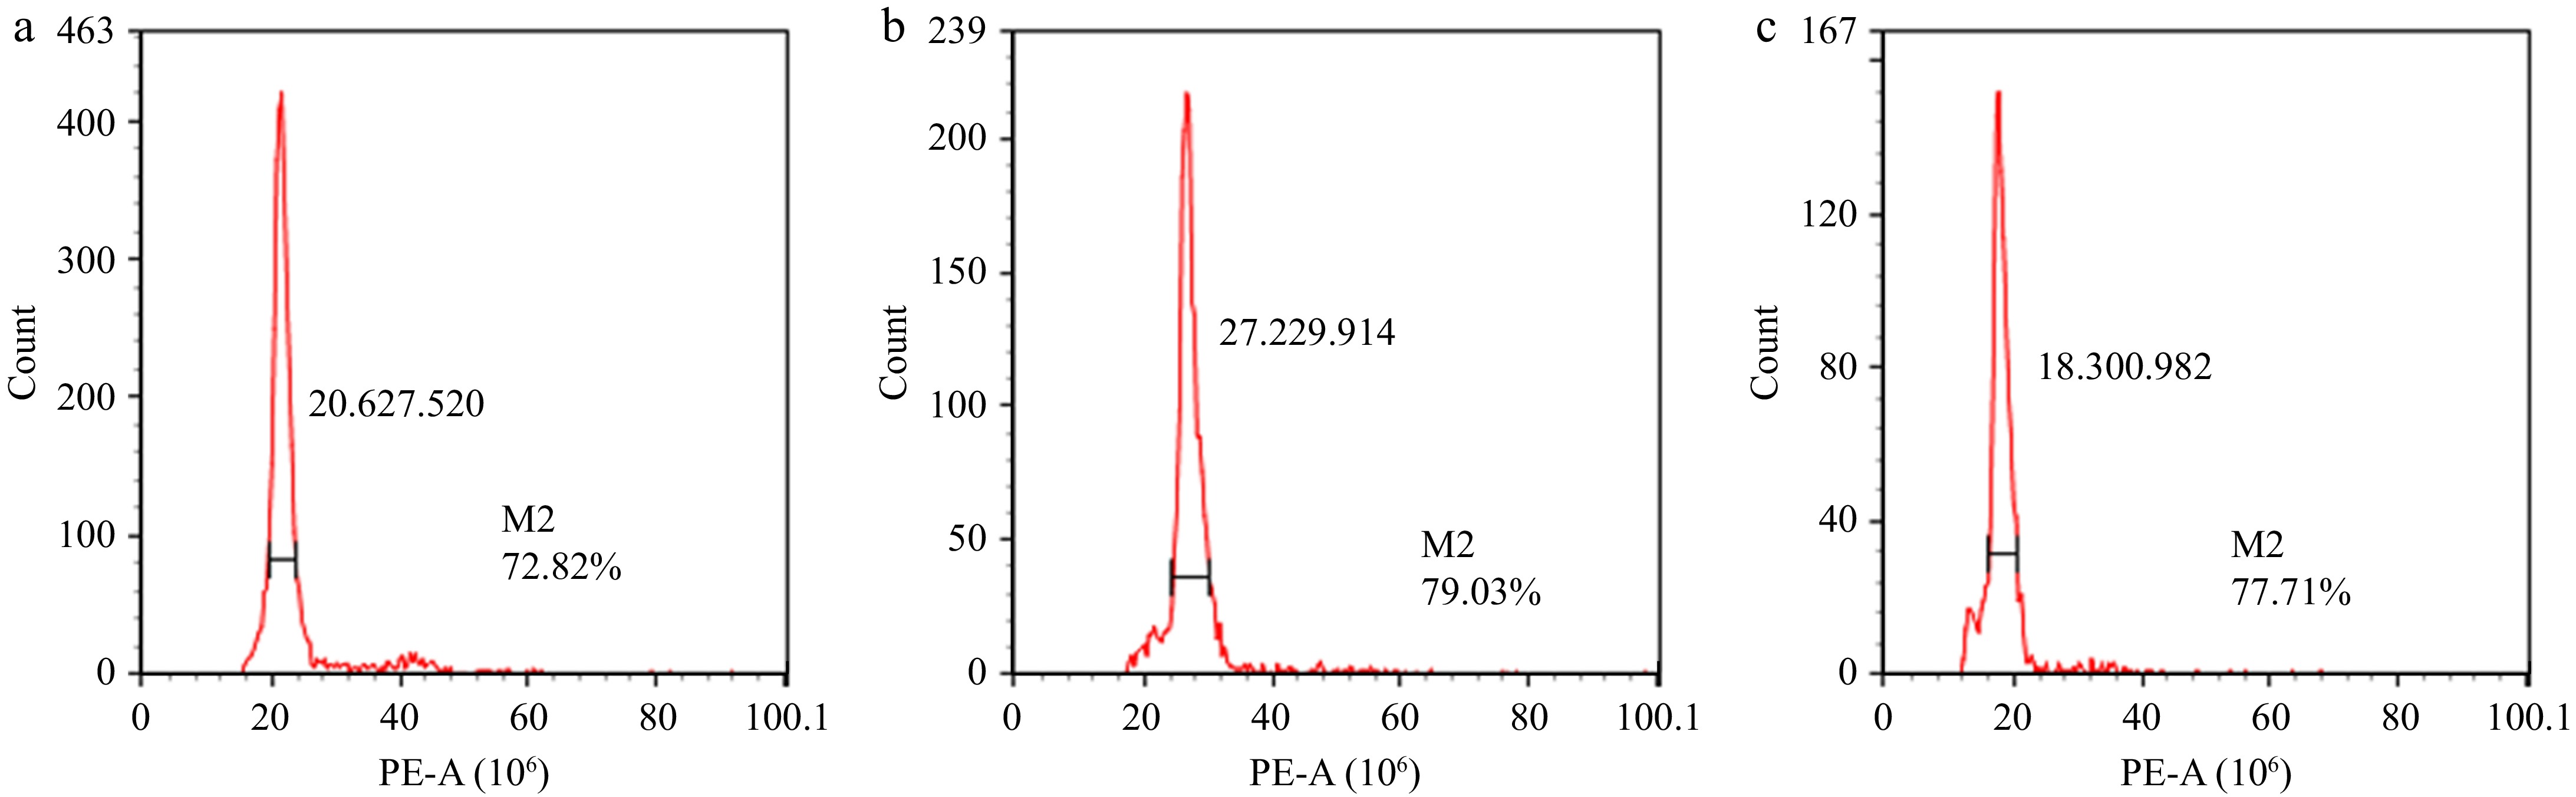
Figure 3.
Analysis of chromosome ploidy in mutant plants by flow cytometry. (a) Diploid control. (b) An aneuploid polyploid. (c) Diploid plant. The values of the horizontal axis corresponding to the peaks are labeled clearly to indicate their ploidy level.
-
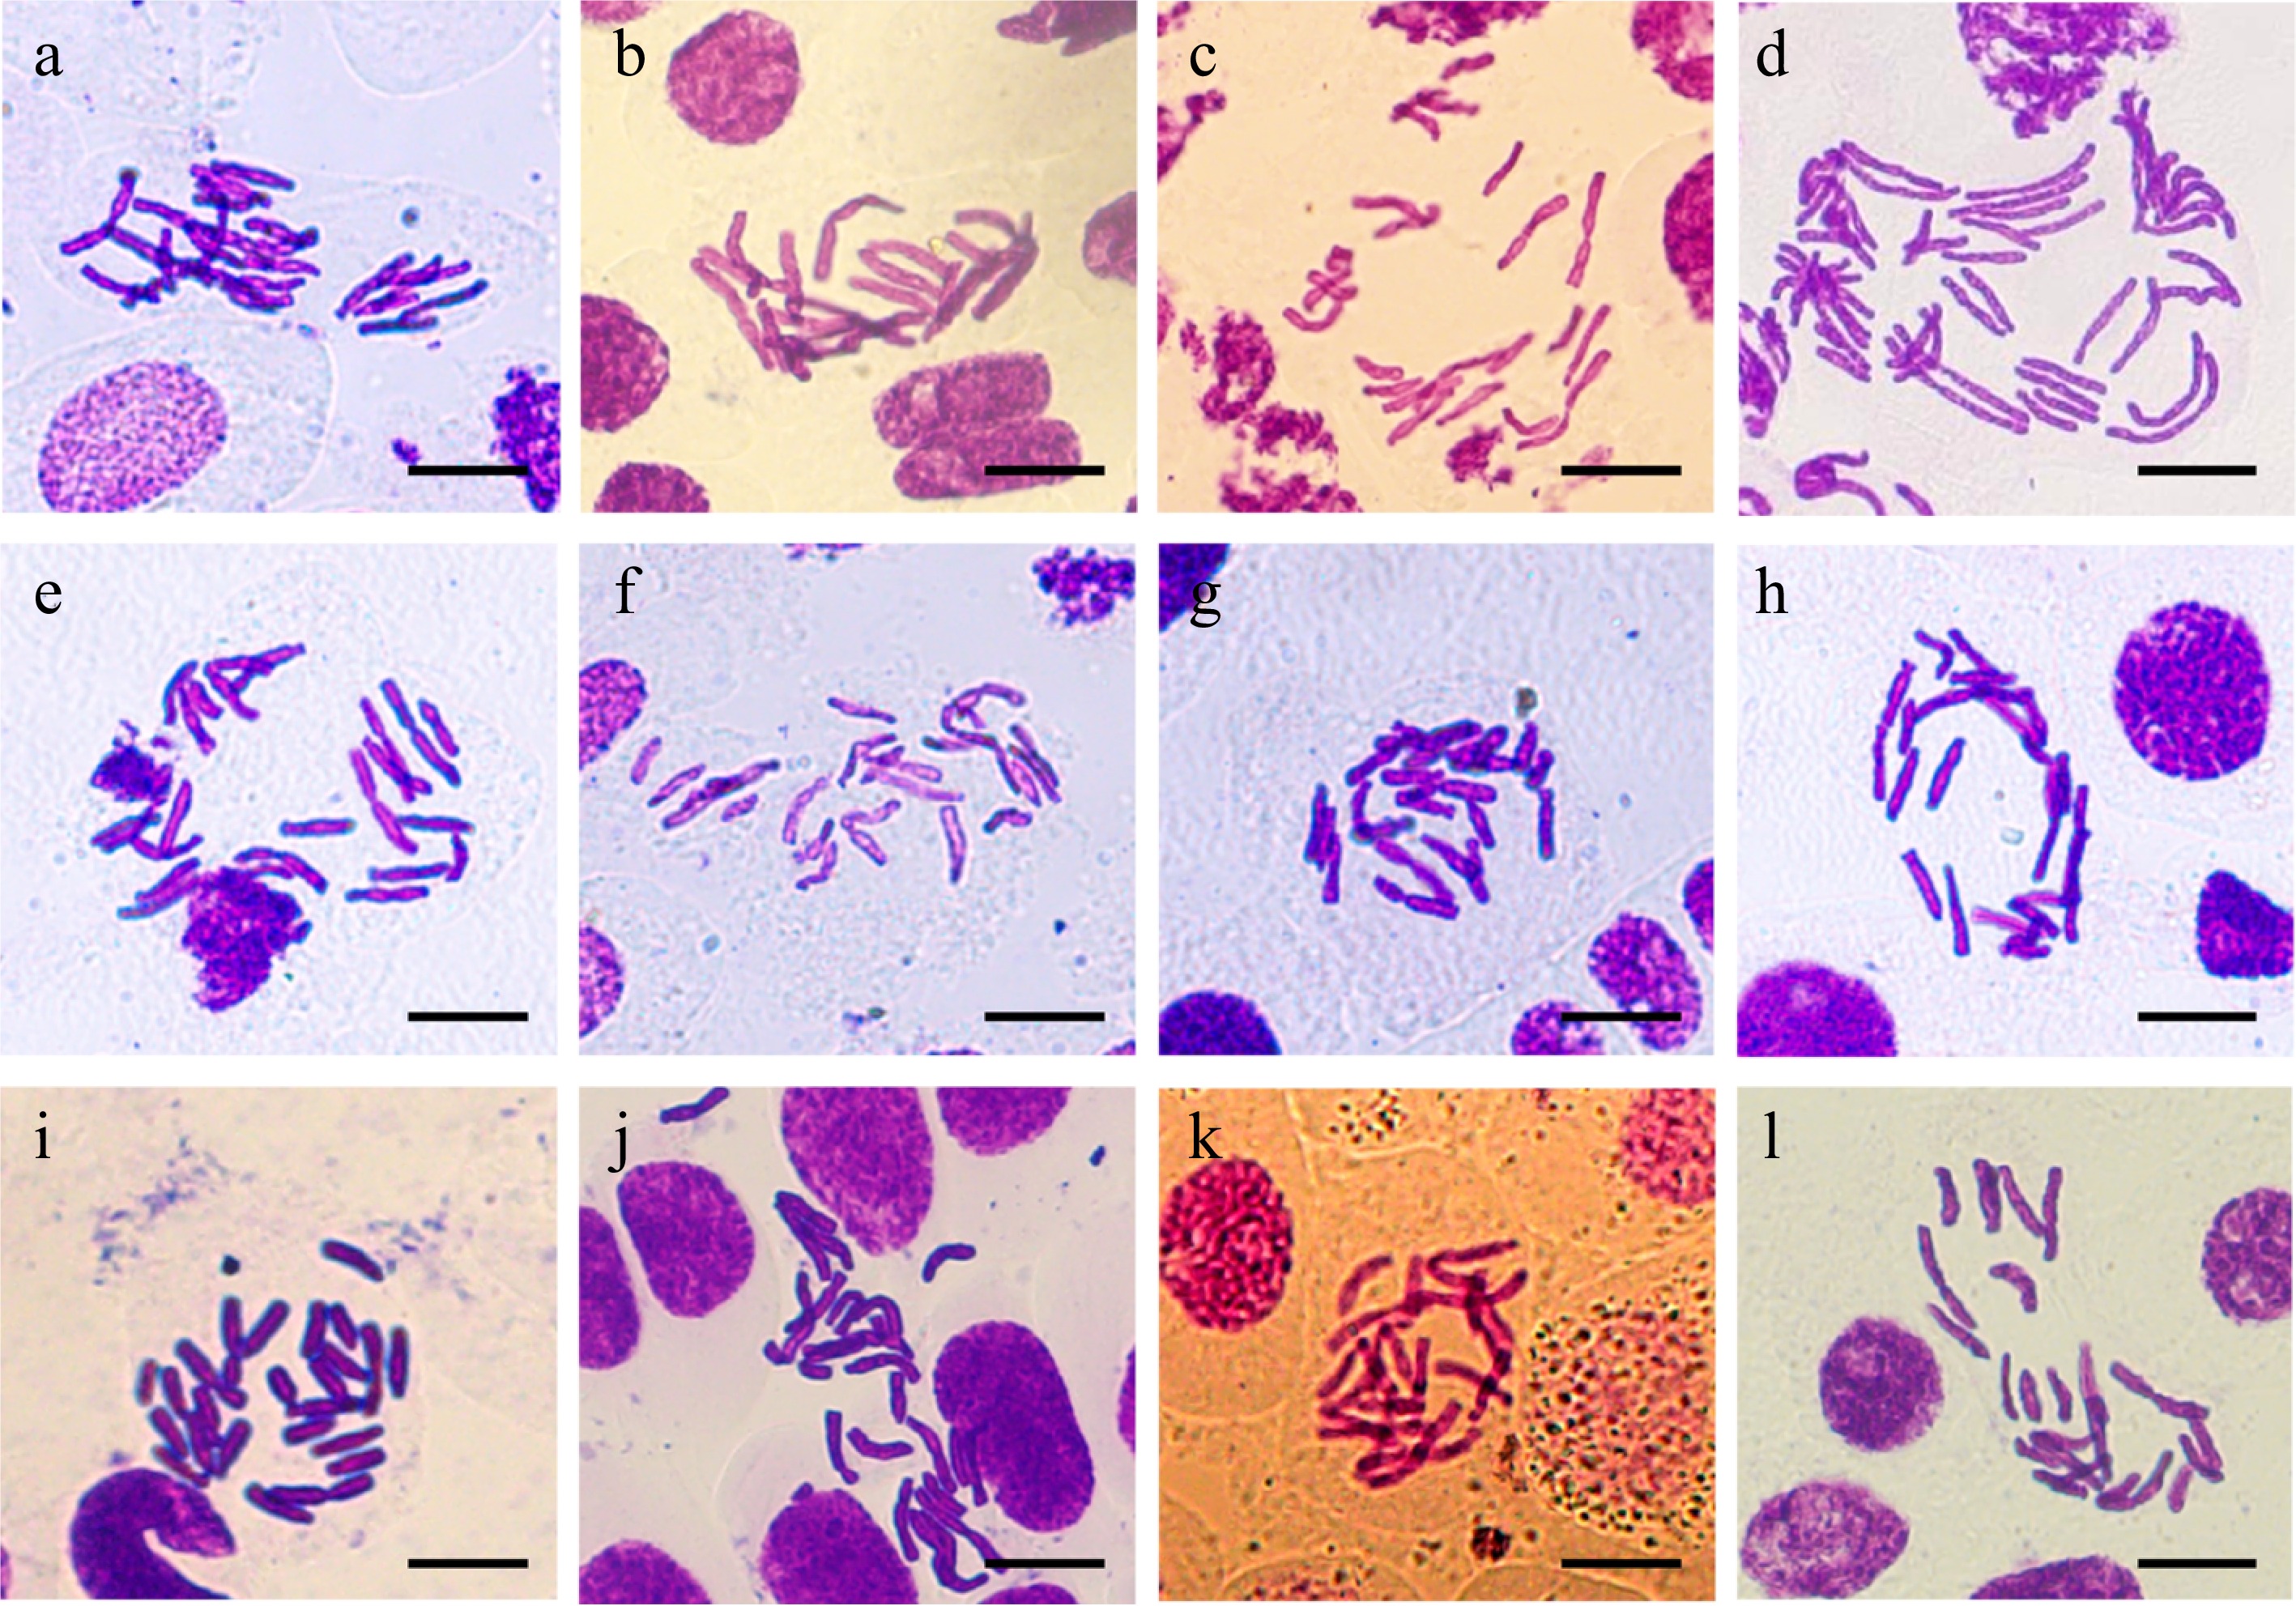
Figure 4.
Analysis of chromosome numbers of root tip cells in suspected mutant plants. (a) Control. (b) No. 1 mutant plant. (c) No. 2 mutant plant. (d) No. 3 mutant plant. (e)−(l) No. 4−No. 11 mutant plants. Scale bars represent 20 μm.
-
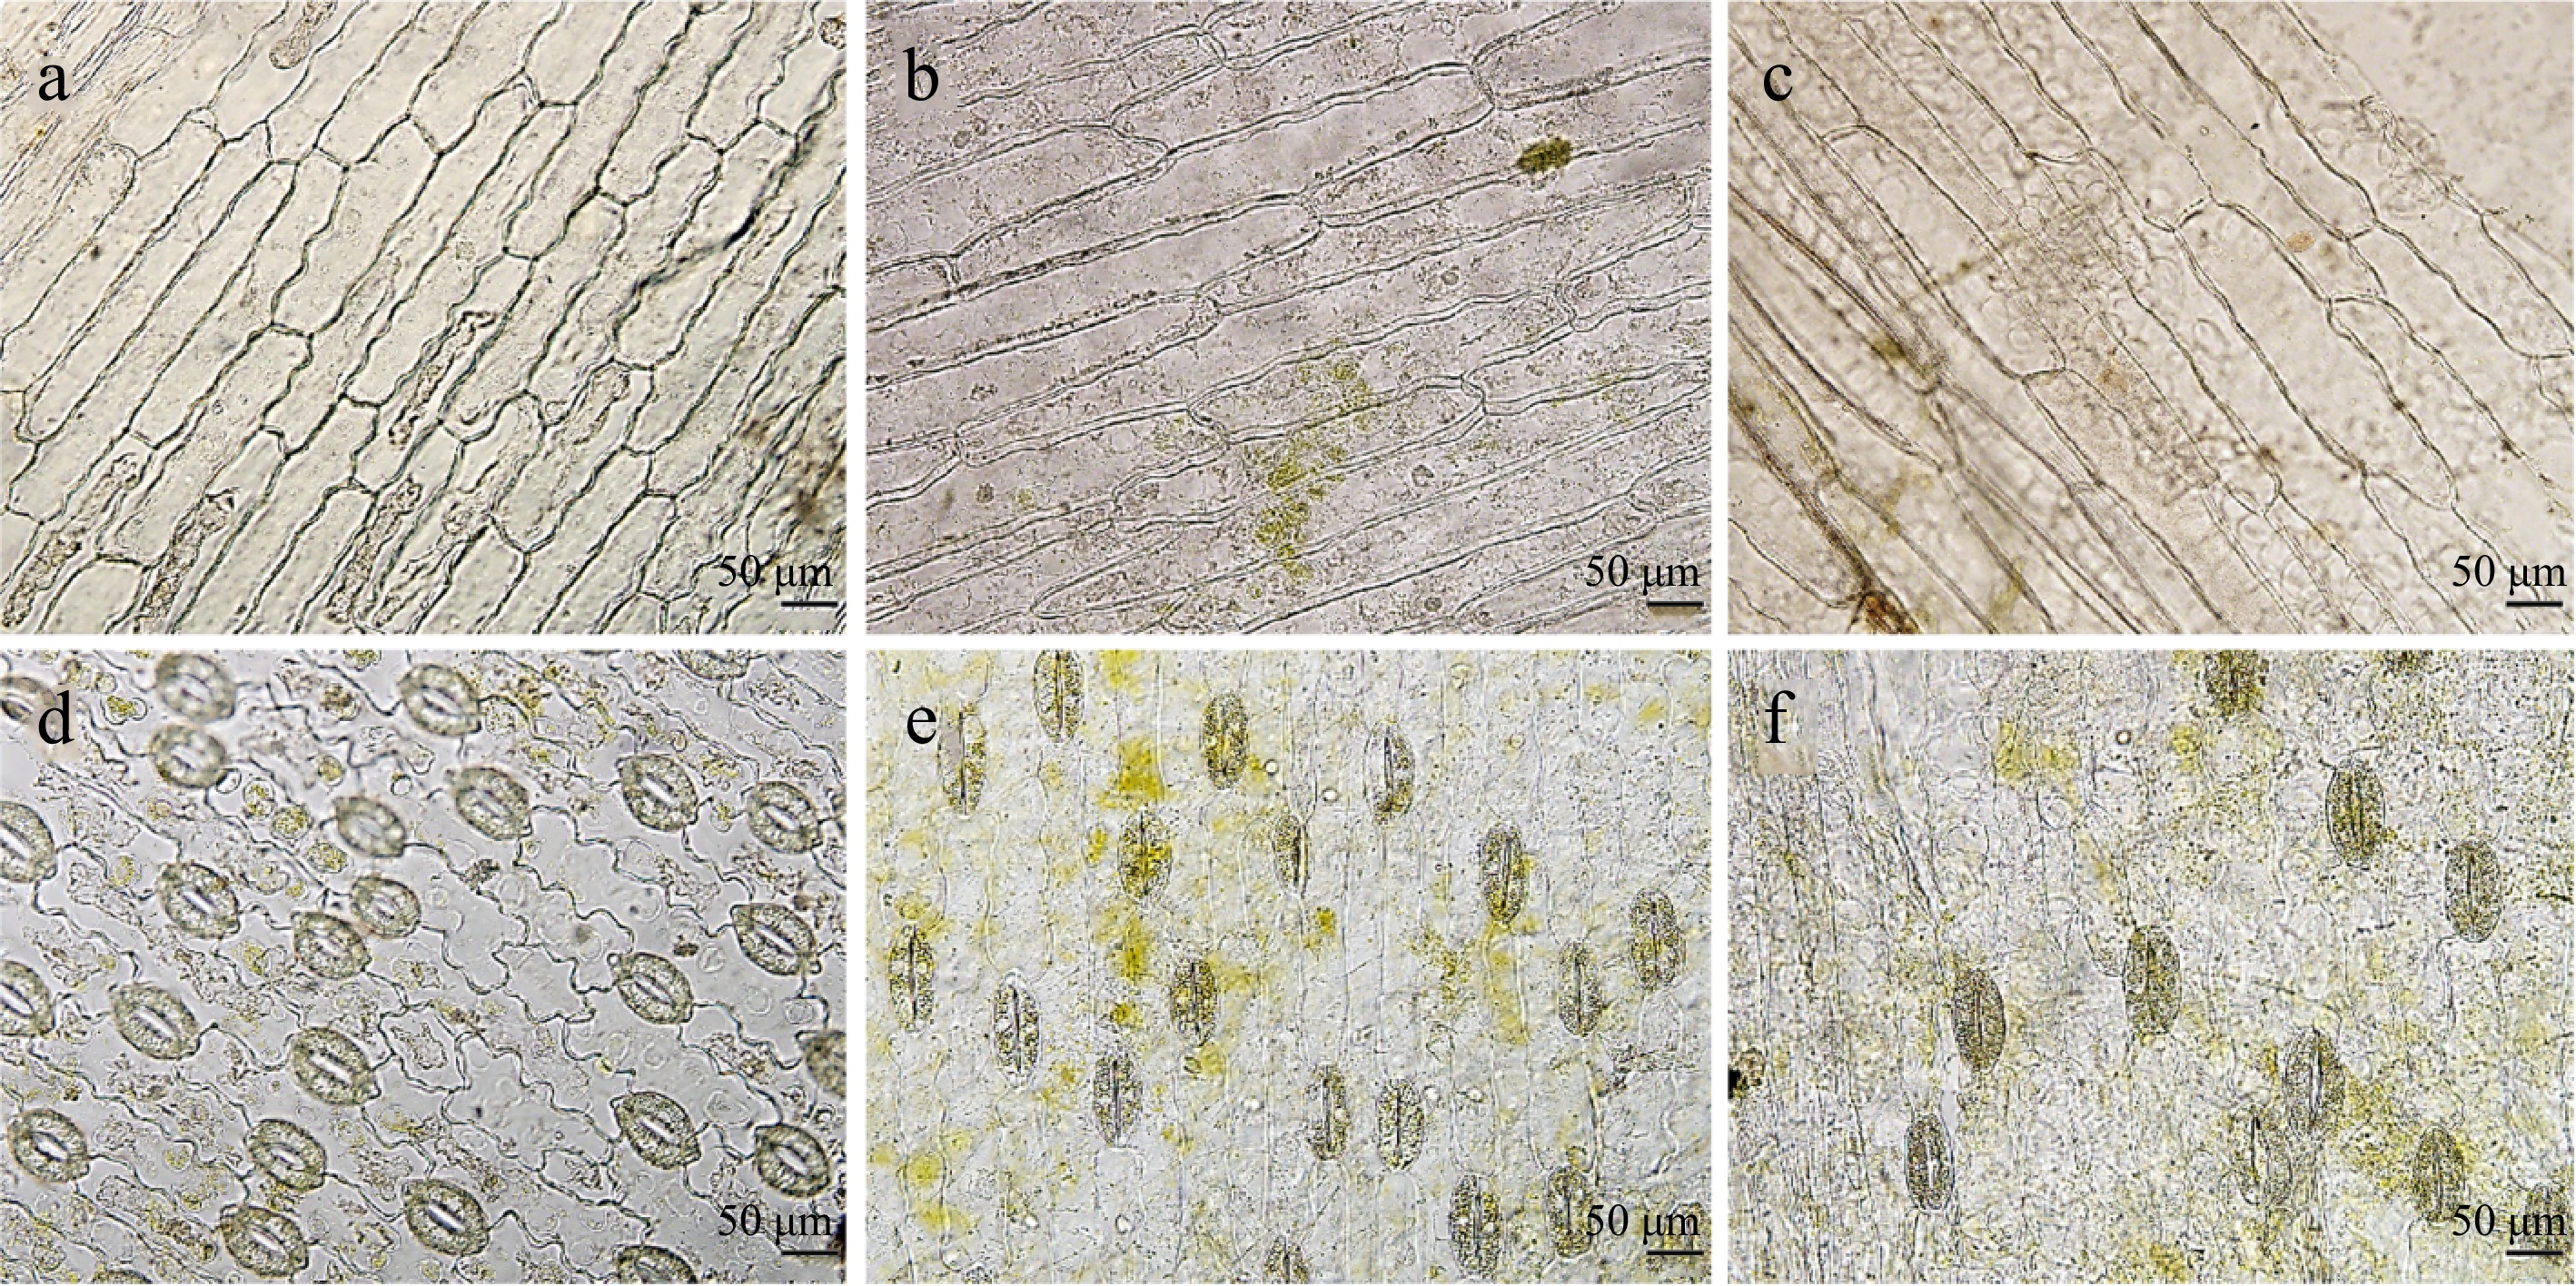
Figure 5.
The observation of leaf epidermal cells and stomatas in No. 2 and No. 3 mutant plants. (a)−(c) The upper epidermal cells in the control of L. leichtlinii var. Maximowiczii, No. 2 and No. 3 mutant plants respectively. (d)−(f) The stomatas of the lower epidermis in the control, No. 2 and No. 3 mutant plants respectively. Scale bars represent 50 μm.
-
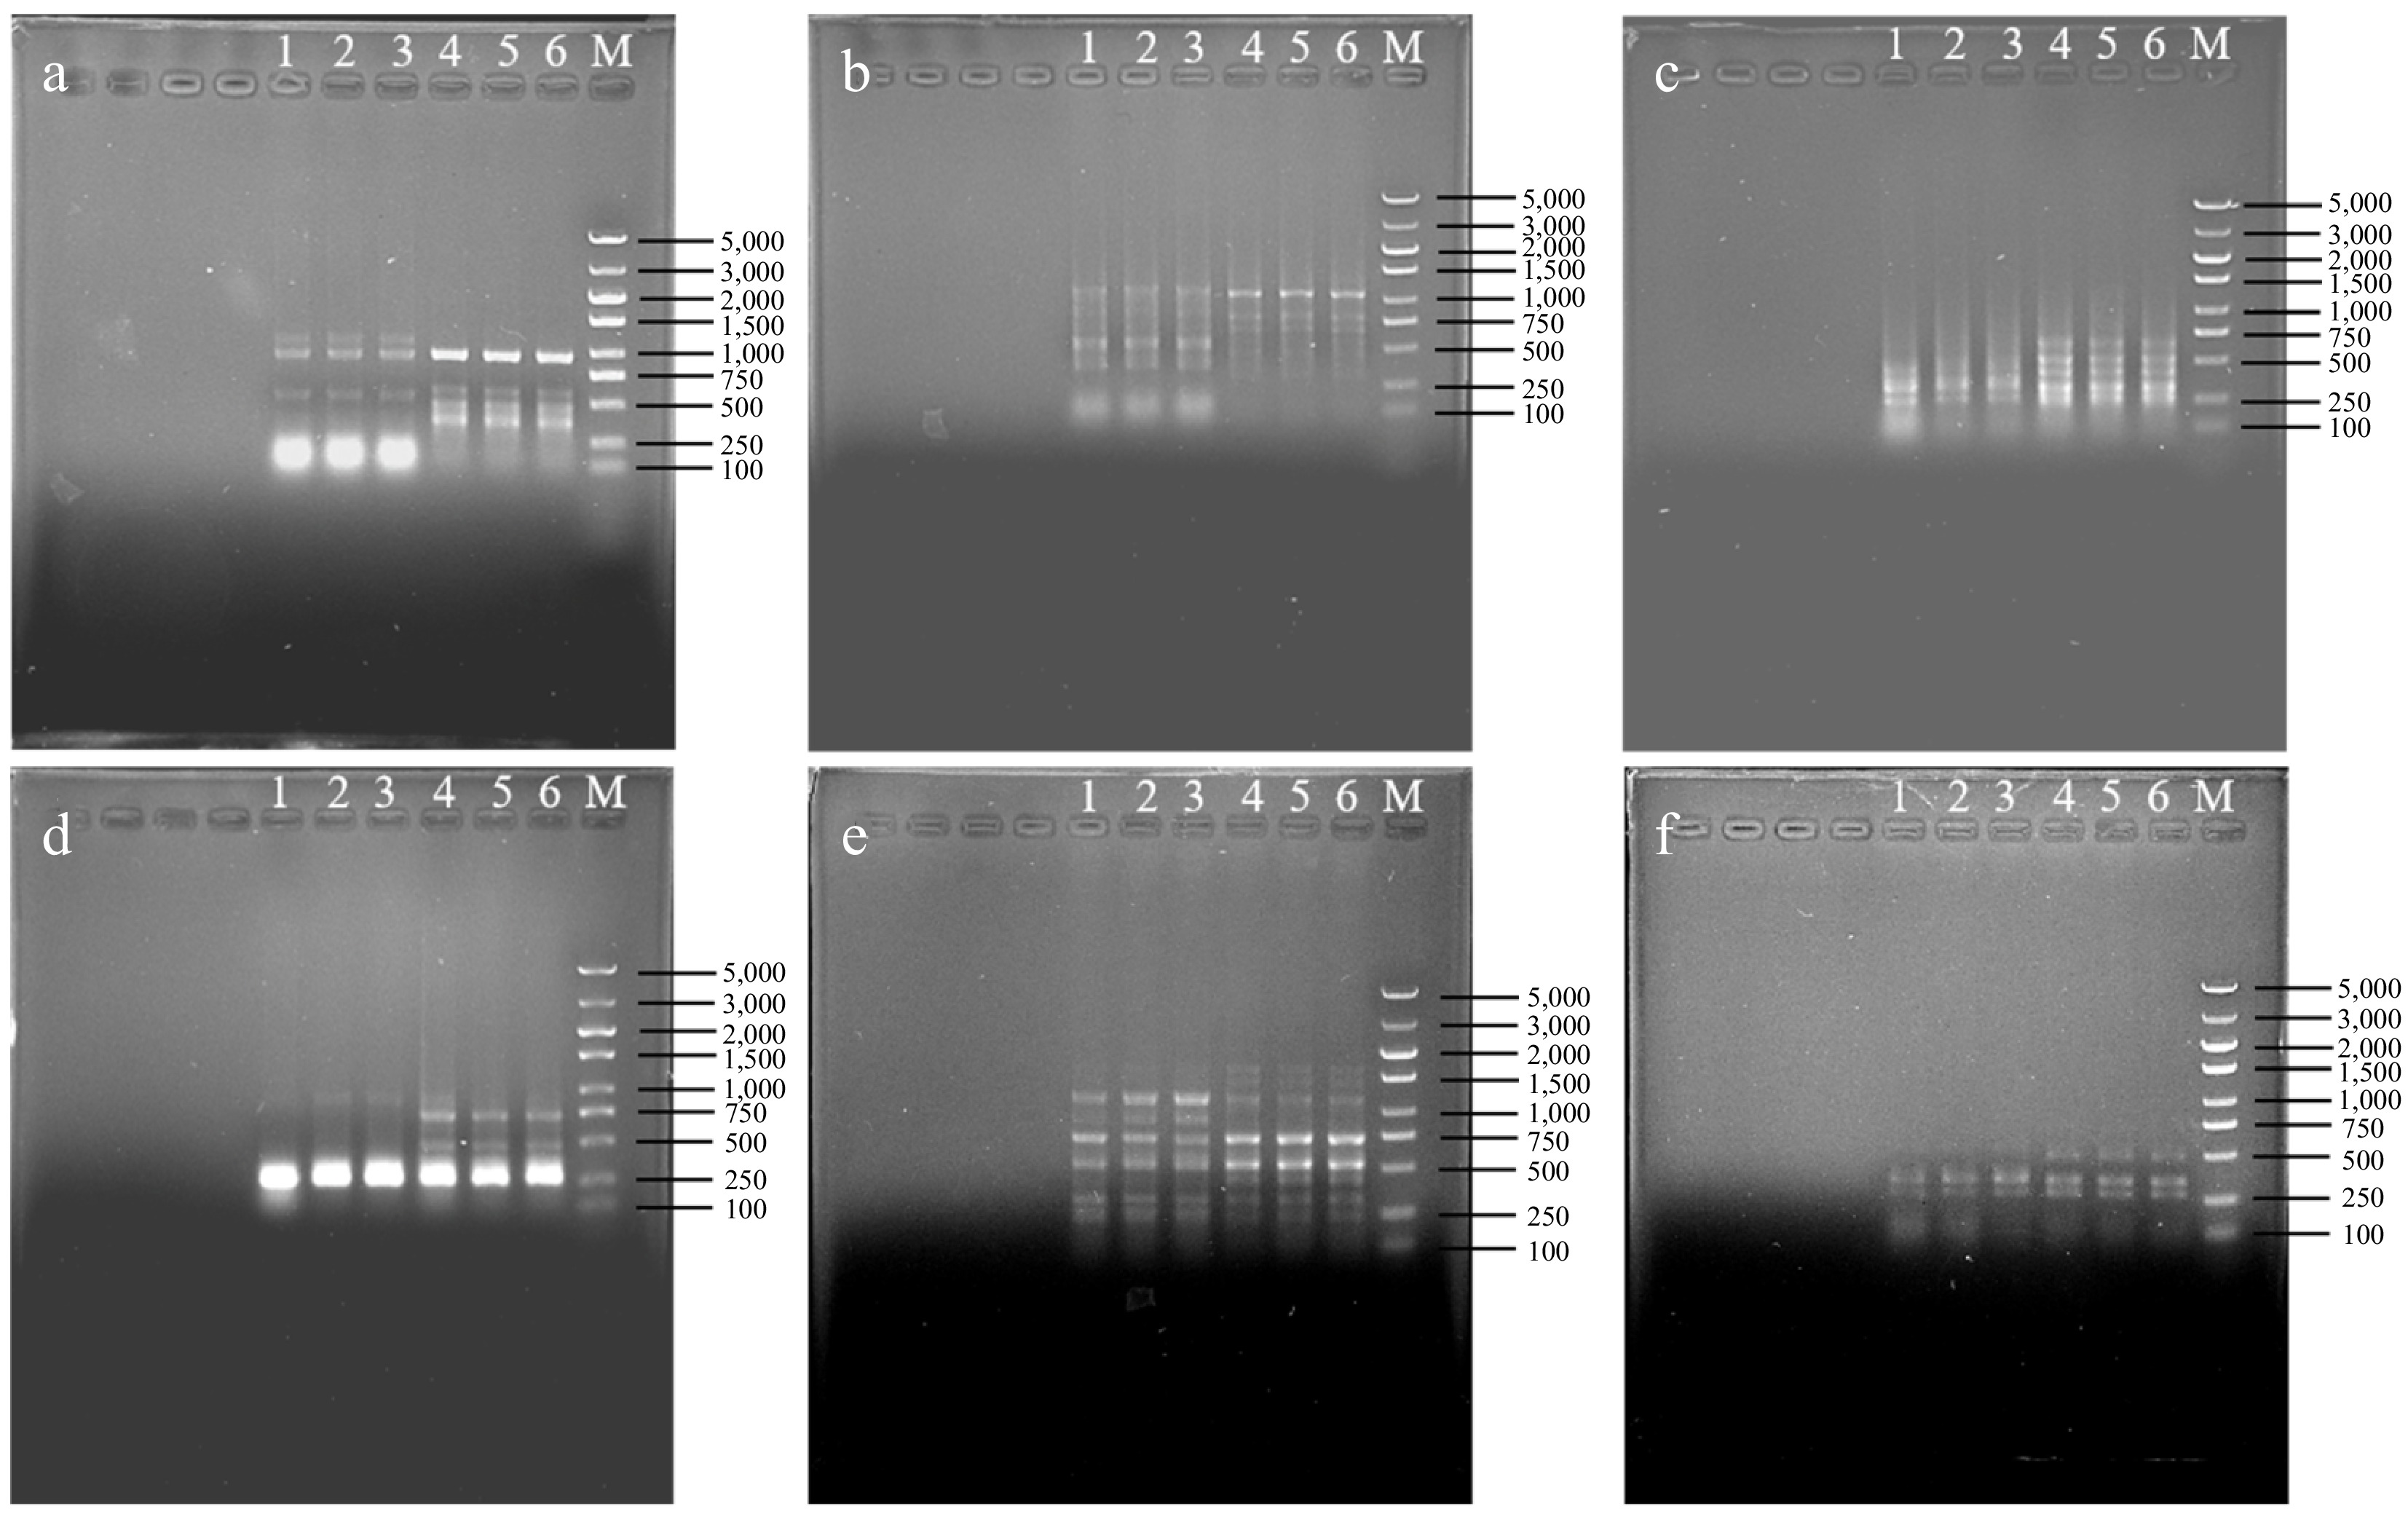
Figure 6.
ISSR detection for No. 2 early flowering plant from L. leichtlinii var. Maximowiczii. (a) Primer UBC815. (b) Primer UBC820. (c) Primer UBC825. (d) Primer UBC844. (e) Primer UBC845. (f) Primer UBC857. 1−3: Three independent samples of No. 2 mutant plant. 4−6: Three independent control samples; M: Marker 5,000 (bp).
-
Concentration (%) Treatment time (h) No. of seeds No. of survivors Survival rate (%) Variance Mutation rate (%) 0.10 24 60 31 51.67 17 28.33 36 60 27 45.00 14 23.33 48 60 27 45.00 16 26.67 0.15 24 60 25 41.67 9 15.00 36 60 30 50.00 14 23.33 48 60 26 43.33 19 31.67 0.20 24 60 26 43.33 16 26.67 36 60 21 35.00 15 25.00 48 60 23 38.33 18 30.00 Table 1.
Effects of colchicine concentration and treatment time combinations on the seeds of L. leichtlinii var. Maximowiczii.
-
Sample Plant height (cm) Stem diameter (mm) Stem perimeter (mm) Leaf length (cm) Leaf width (cm) Control 68.62 ± 0.00 b 3.09 ± 0.00 b 9.70 ± 0.00 b 14.98 ± 0.73 bc 0.65 ± 0.03 b No. 1 plant 61.32 ± 0.00 c 3.04 ± 0.00 c 9.52 ± 0.01 c 15.37 ± 0.90 b 0.47 ± 0.04 cd No. 2 plant 102.50 ± 0.00 a 3.31 ± 0.00 a 10.41 ± 0.01 a 18.06 ± 0.97 a 0.54 ± 0.03 bc No. 3 plant 34.51 ± 0.00 i 2.56 ± 0.00 d 8.04 ± 0.01 e 10.83 ± 0.86 de 0.79 ± 0.07 a No. 4 plant 48.745 ± 0.01 g 2.19 ± 0.00 e 6.90 ± 0.00 f 12.75 ± 0.84 bcd 0.65 ± 0.08 b No. 5 plant 52.81 ± 0.01 f 3.10 ± 0.00 b 9.75 ± 0.00 b 11.95 ± 0.46 d 0.59 ± 0.05 bc No. 6 plant 39.74 ± 0.01 h 2.60 ± 0.00 d 8.19 ± 0.01 d 10.72 ± 0.96 de 0.41 ± 0.02 d No. 7 plant 40.51 ± 0.01 h 3.05 ± 0.00 c 9.60 ± 0.00 c 12.91 ± 0.43 bcd 0.55 ± 0.03 bc No. 8 plant 59.62 ± 0.00 d 3.31 ± 0.00 a 10.40 ± 0.01 a 13.26 ± 0.81 bcd 0.55 ± 0.04 bc No. 9 plant 49.51 ± 0.01 g 2.09 ± 0.00 f 6.61 ± 0.00 g 8.63 ± 0.68 e 0.63 ± 0.02 b No. 10 plant 39.01 ± 0.01 h 2.20 ± 0.00 e 6.93 ± 0.00 f 12.79 ± 0.98 bcd 0.54 ± 0.08 bc No. 11 plant 55.12 ± 0.01 e 3.11 ± 0.00 b 9.78 ± 0.01 b 12.35 ± 0.76 cd 0.64 ± 0.02 b The data in each column are mean ± standard error, different letters represent significant difference using Duncan's test (p < 0.05). Table 2.
Comparison of morphological indicators in L. leichtlinii var. Maximowiczii and suspected mutant plants.
-
Sample Adaxial cell
length (μm)Adaxial cell
width (μm)Abaxial cell
length (μm)Abaxial cell
width (μm)Guard cell
length (μm)Guard cell
width (μm)Stomatal frequency
(No./mm2)Control 259.49 ± 4.79 a 51.97 ± 1.25 a 218.98 ± 4.70 a 53.14 ± 0.65 b 78.81 ± 0.53 a 51.01 ± 0.17 b 59.36 ± 0.56 a No. 2 plant 496.63 ± 8.57 b 54.52 ± 1.10 a 300.98 ± 10.68 b 47.36 ± 0.86 a 96.66 ± 0.63 b 46.97 ± 0.16 a 46.19 ± 0.82 b No. 3 plant 472.53 ± 22.41 b 66.90 ± 2.43 b 317.49 ± 11.97 b 55.06 ± 1.32 b 92.16 ± 0.47 b 50.58 ± 0.20 b 35.97 ± 1.21 c The data are mean ± standard error, different letters represent significant difference using Duncan's test (p < 0.05). Table 3.
Comparison of leaf epidermis, guard cells, and stomata in L. leichtlinii var. Maximowiczii, No. 2 and No. 3 mutant plants.
Figures
(6)
Tables
(3)