-
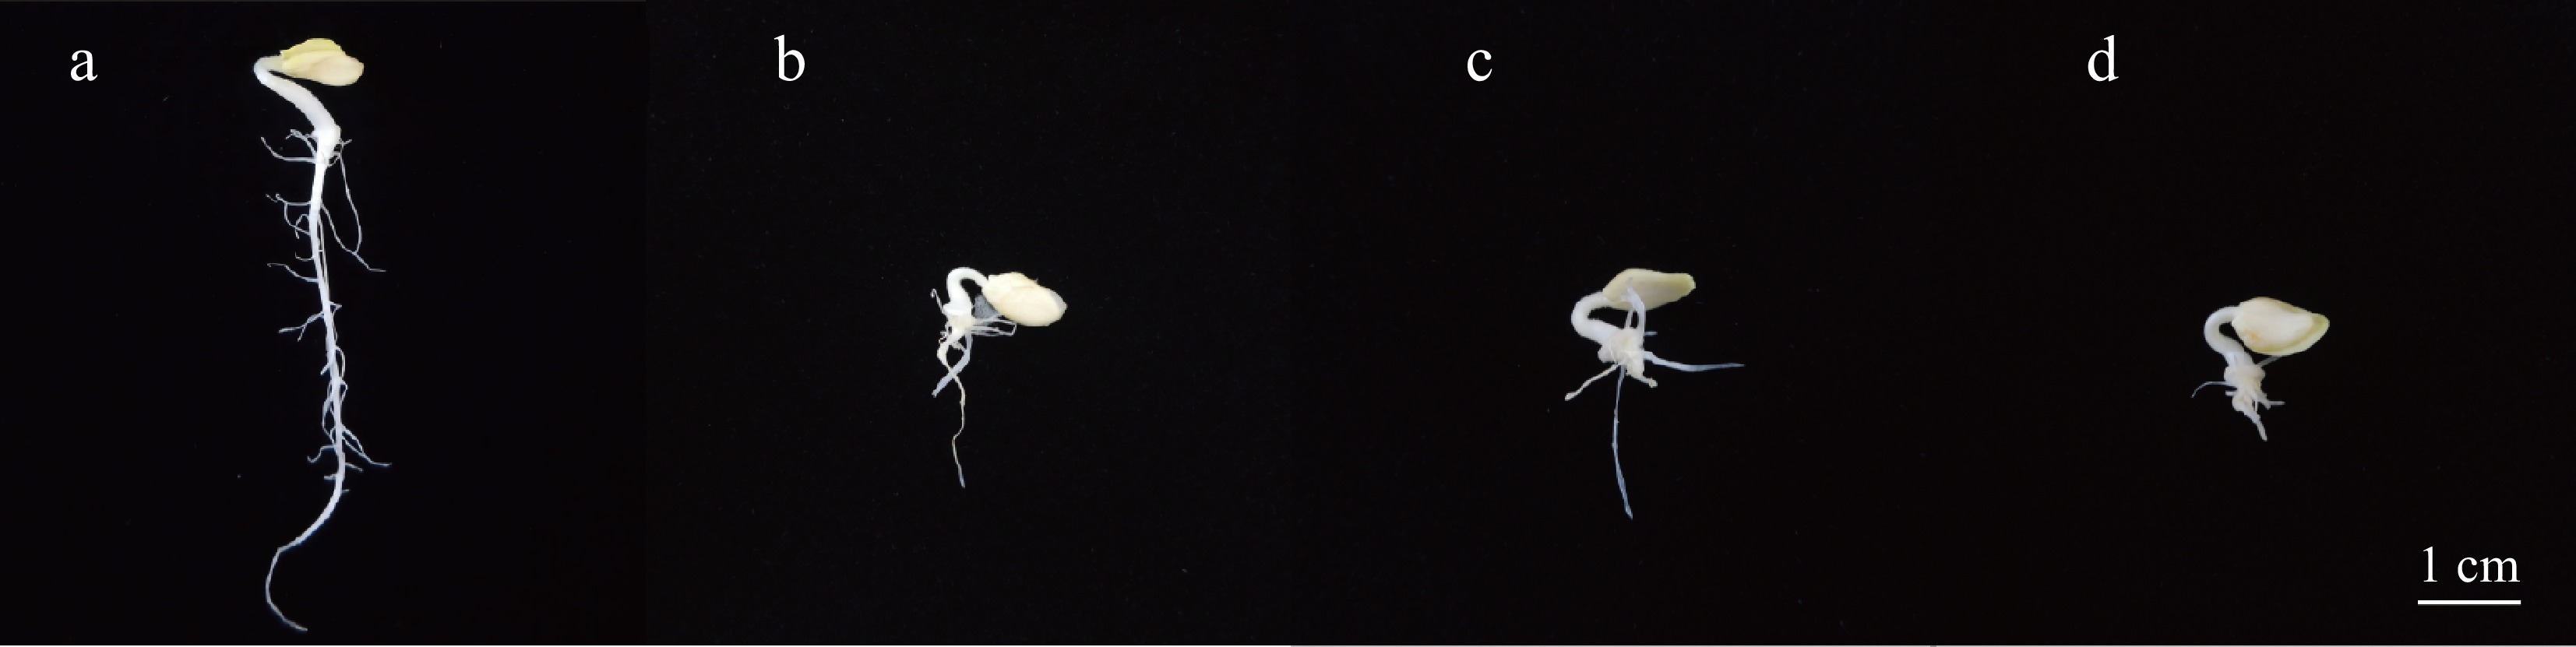
Figure 1.
Phenotype of wax gourd seedlings treated with different concentrations of IAA. (a) Control, (b) treatment with 600 μM IAA, (c) treatment with 800 μM IAA, (d) treatment with 1,000 μM IAA. Scale bar = 1cm.
-
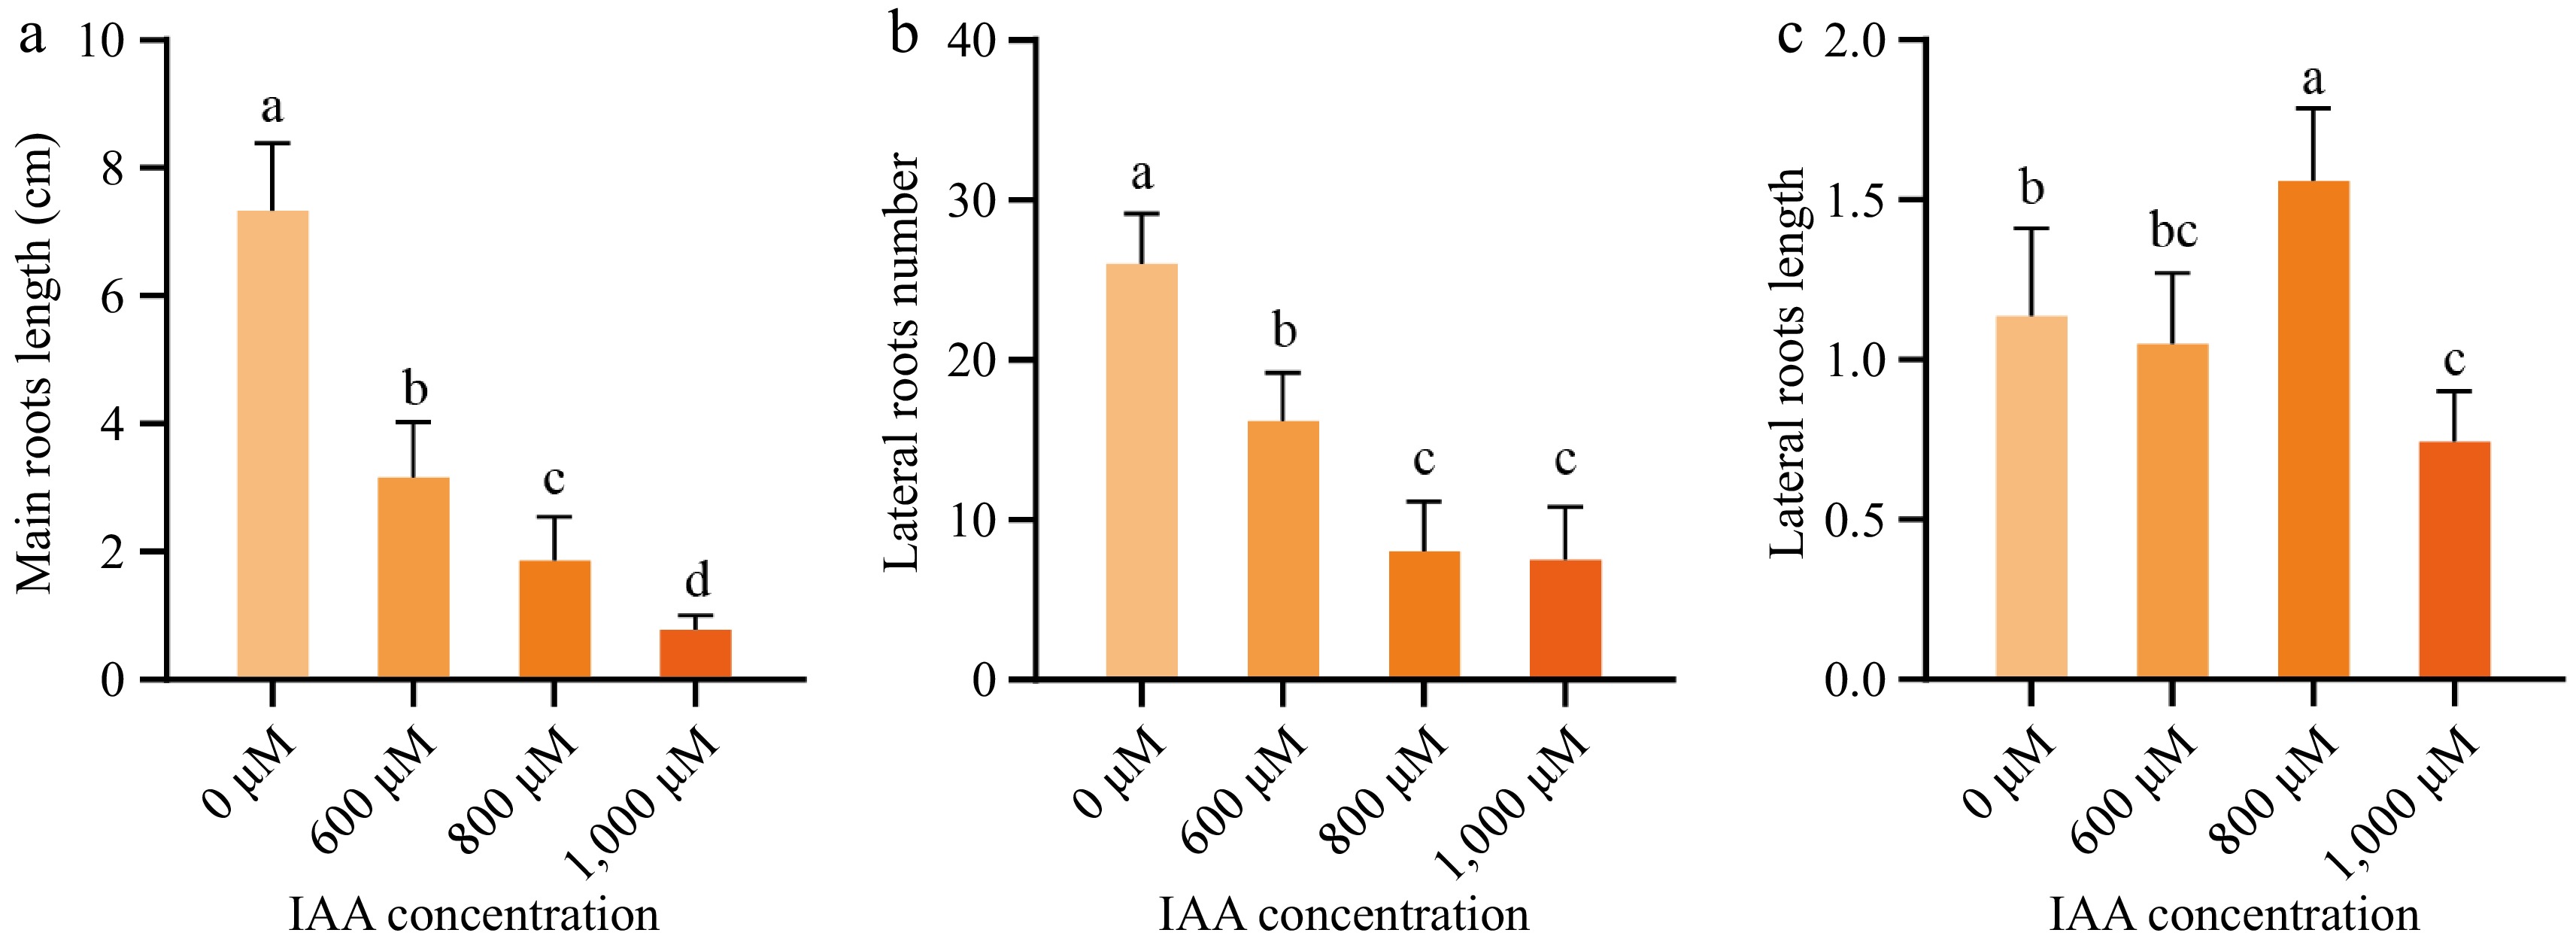
Figure 2.
Morphological changes during early roots development in different concentrations of IAA. (a) Main root length, (b) lateral root length, and (c) the number of lateral roots of wax gourd seed embryonic treated with 0, 600, 800, and 1,000 μM IAA. Data are presented as mean ± standard error (n = 6). Different lowercase letters on the bars indicate significant differences at p < 0.05 (Duncan's multiple range test).
-
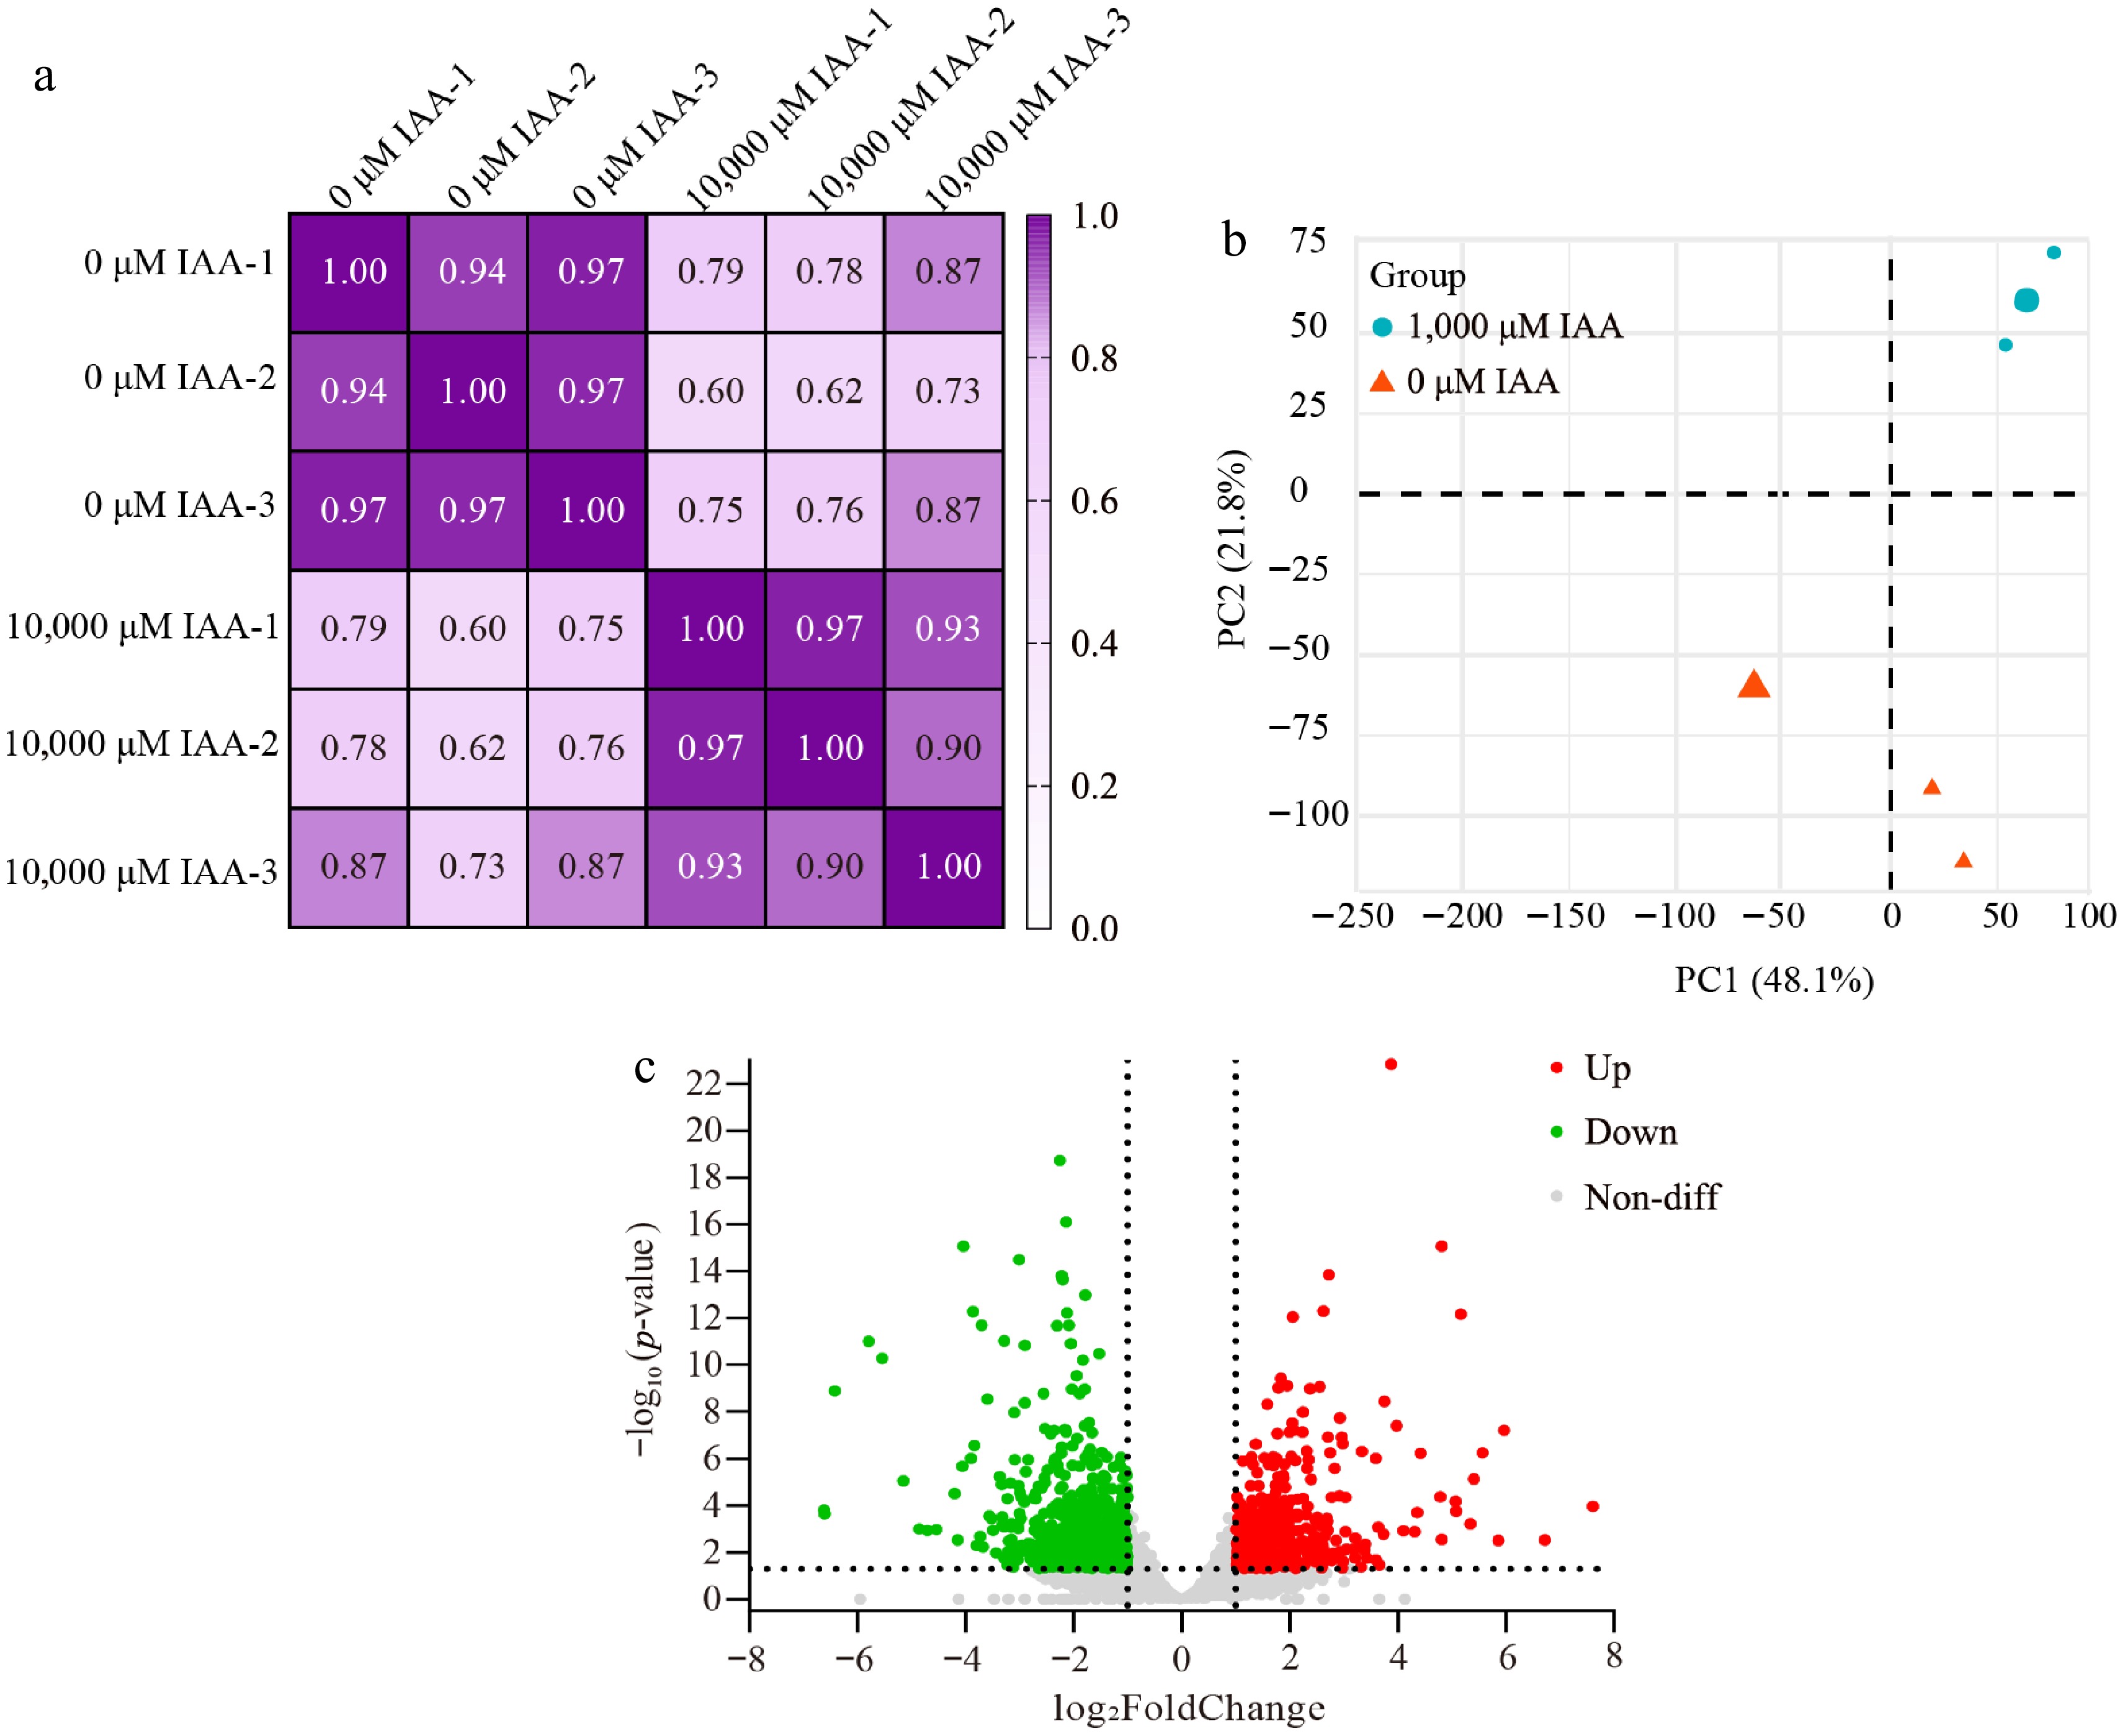
Figure 3.
Pearson correlation, PCA analysis, and Volcano plot of differentially expressed genes. (a) Correlation matrix and cluster dendrogram of the whole dataset. The analysis compared the transcriptomes of all samples with three biological replicates. Dark purple indicates strong correlations, while light purple indicates weaker correlations. (b) PCA of samples grouped by treatment. Blue dots represent 1,000 μM IAA-treated samples, and orange triangles represent 0 μM IAA-treated samples. (c) Volcano plot showing DEGs between the two treatment groups. The x-axis represents the log2FoldChange of gene expression levels, while the y-axis represents the significance of the DEGs. Red dots indicate upregulated genes, green dots indicate downregulated genes, and gray dots indicate non-differentially expressed genes.
-
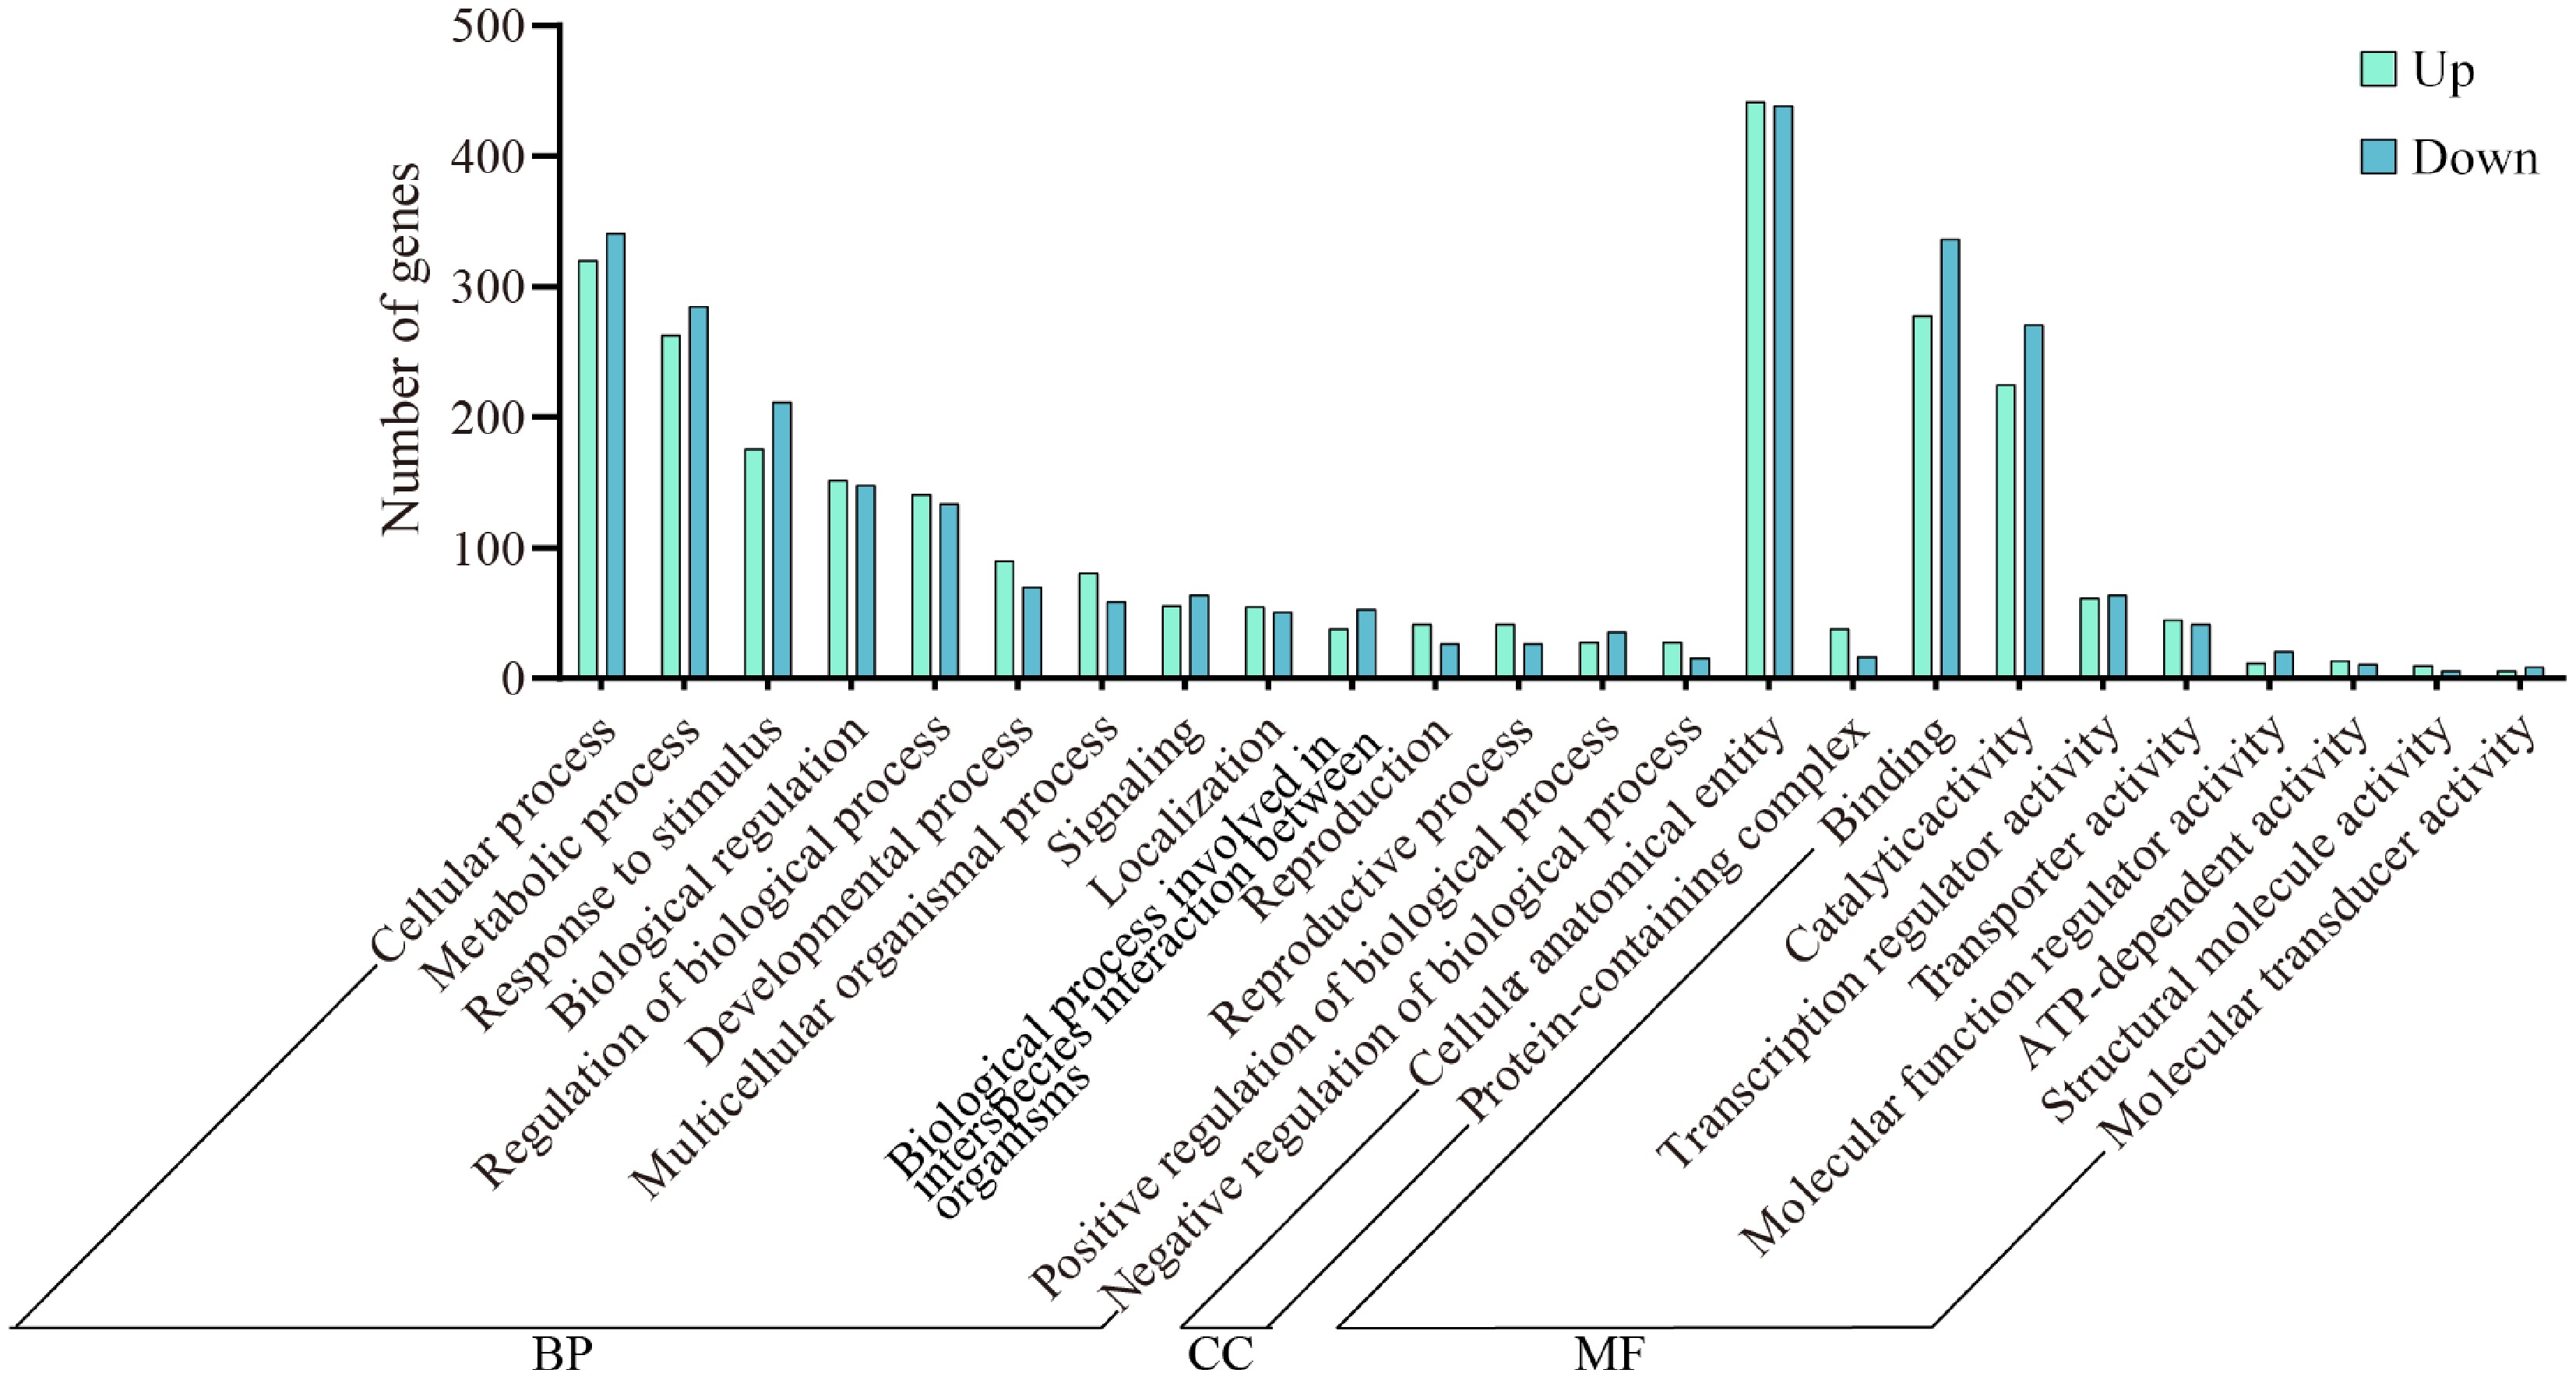
Figure 4.
Enrichment analysis of GO differentially expressed gene in wax gourd embryonic roots. BP represents biological process, CC represents cellular component, and MF represents molecular function.
-
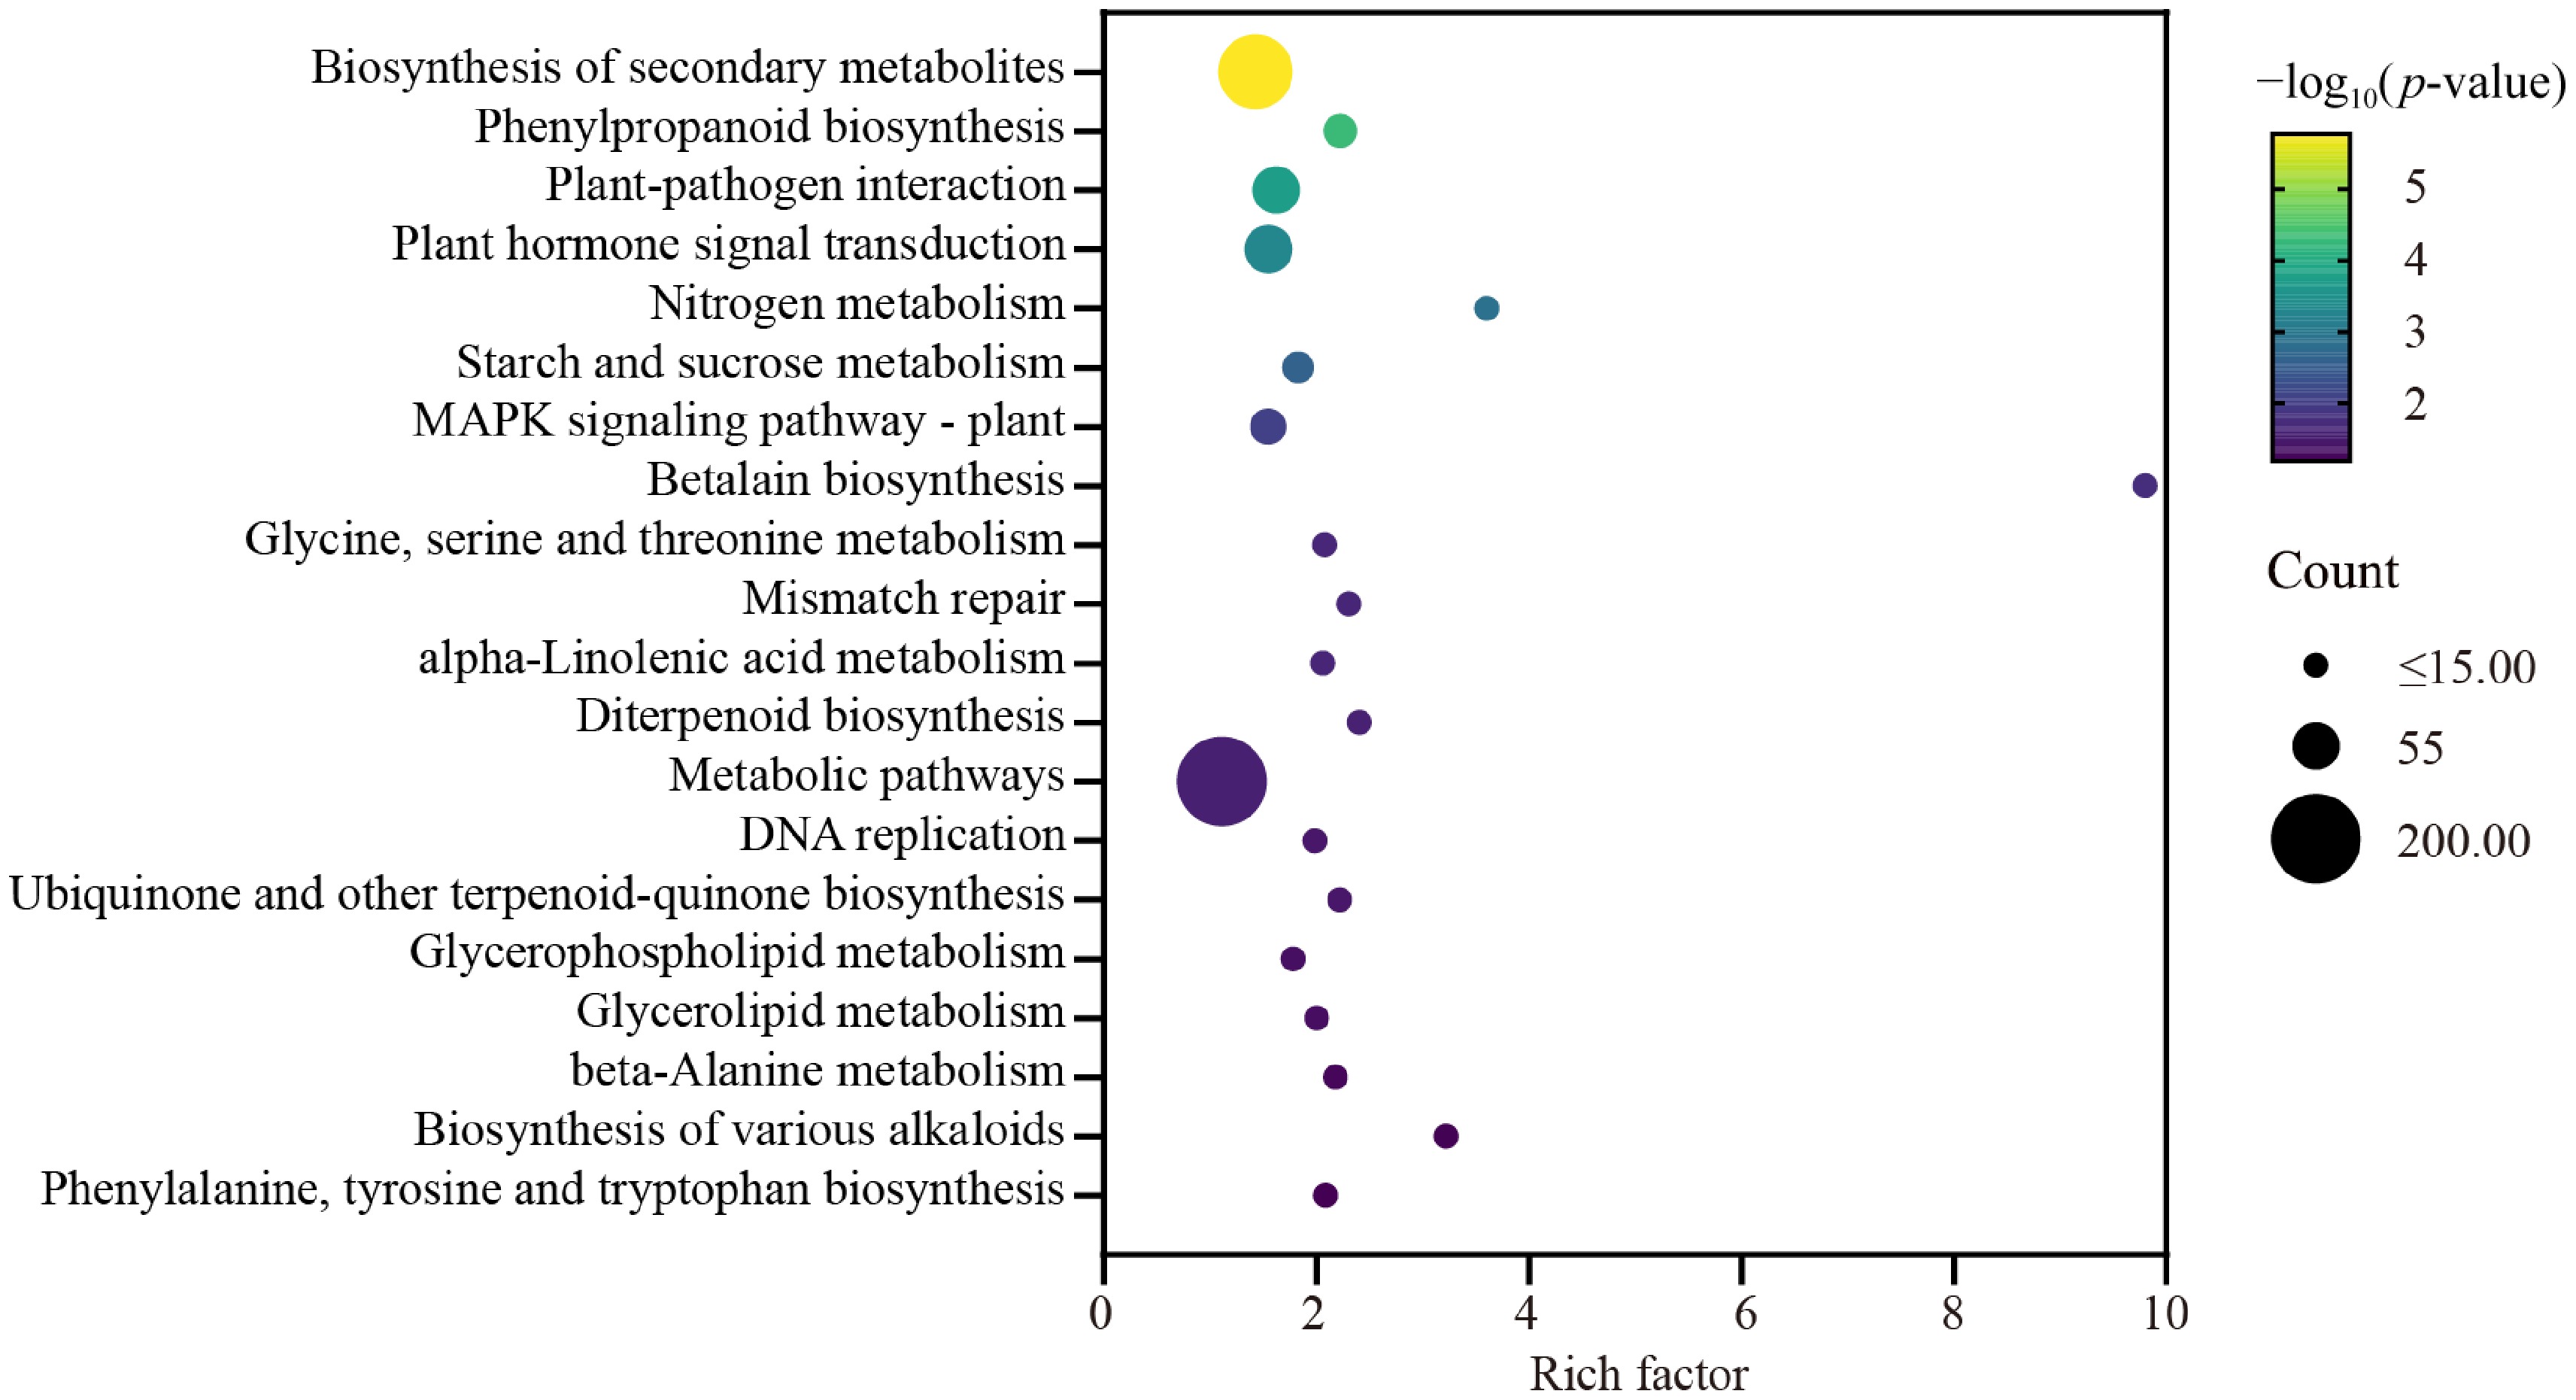
Figure 5.
KEGG enrichment analysis of differentially expressed gene in wax gourd embryonic roots. The X-axis represents the enrichment factor of different KEGG pathways and the Y-axis represents different KEGG pathways. Dot colors indicate different p values, while dot sizes represent the number of genes associated with each pathway.
-
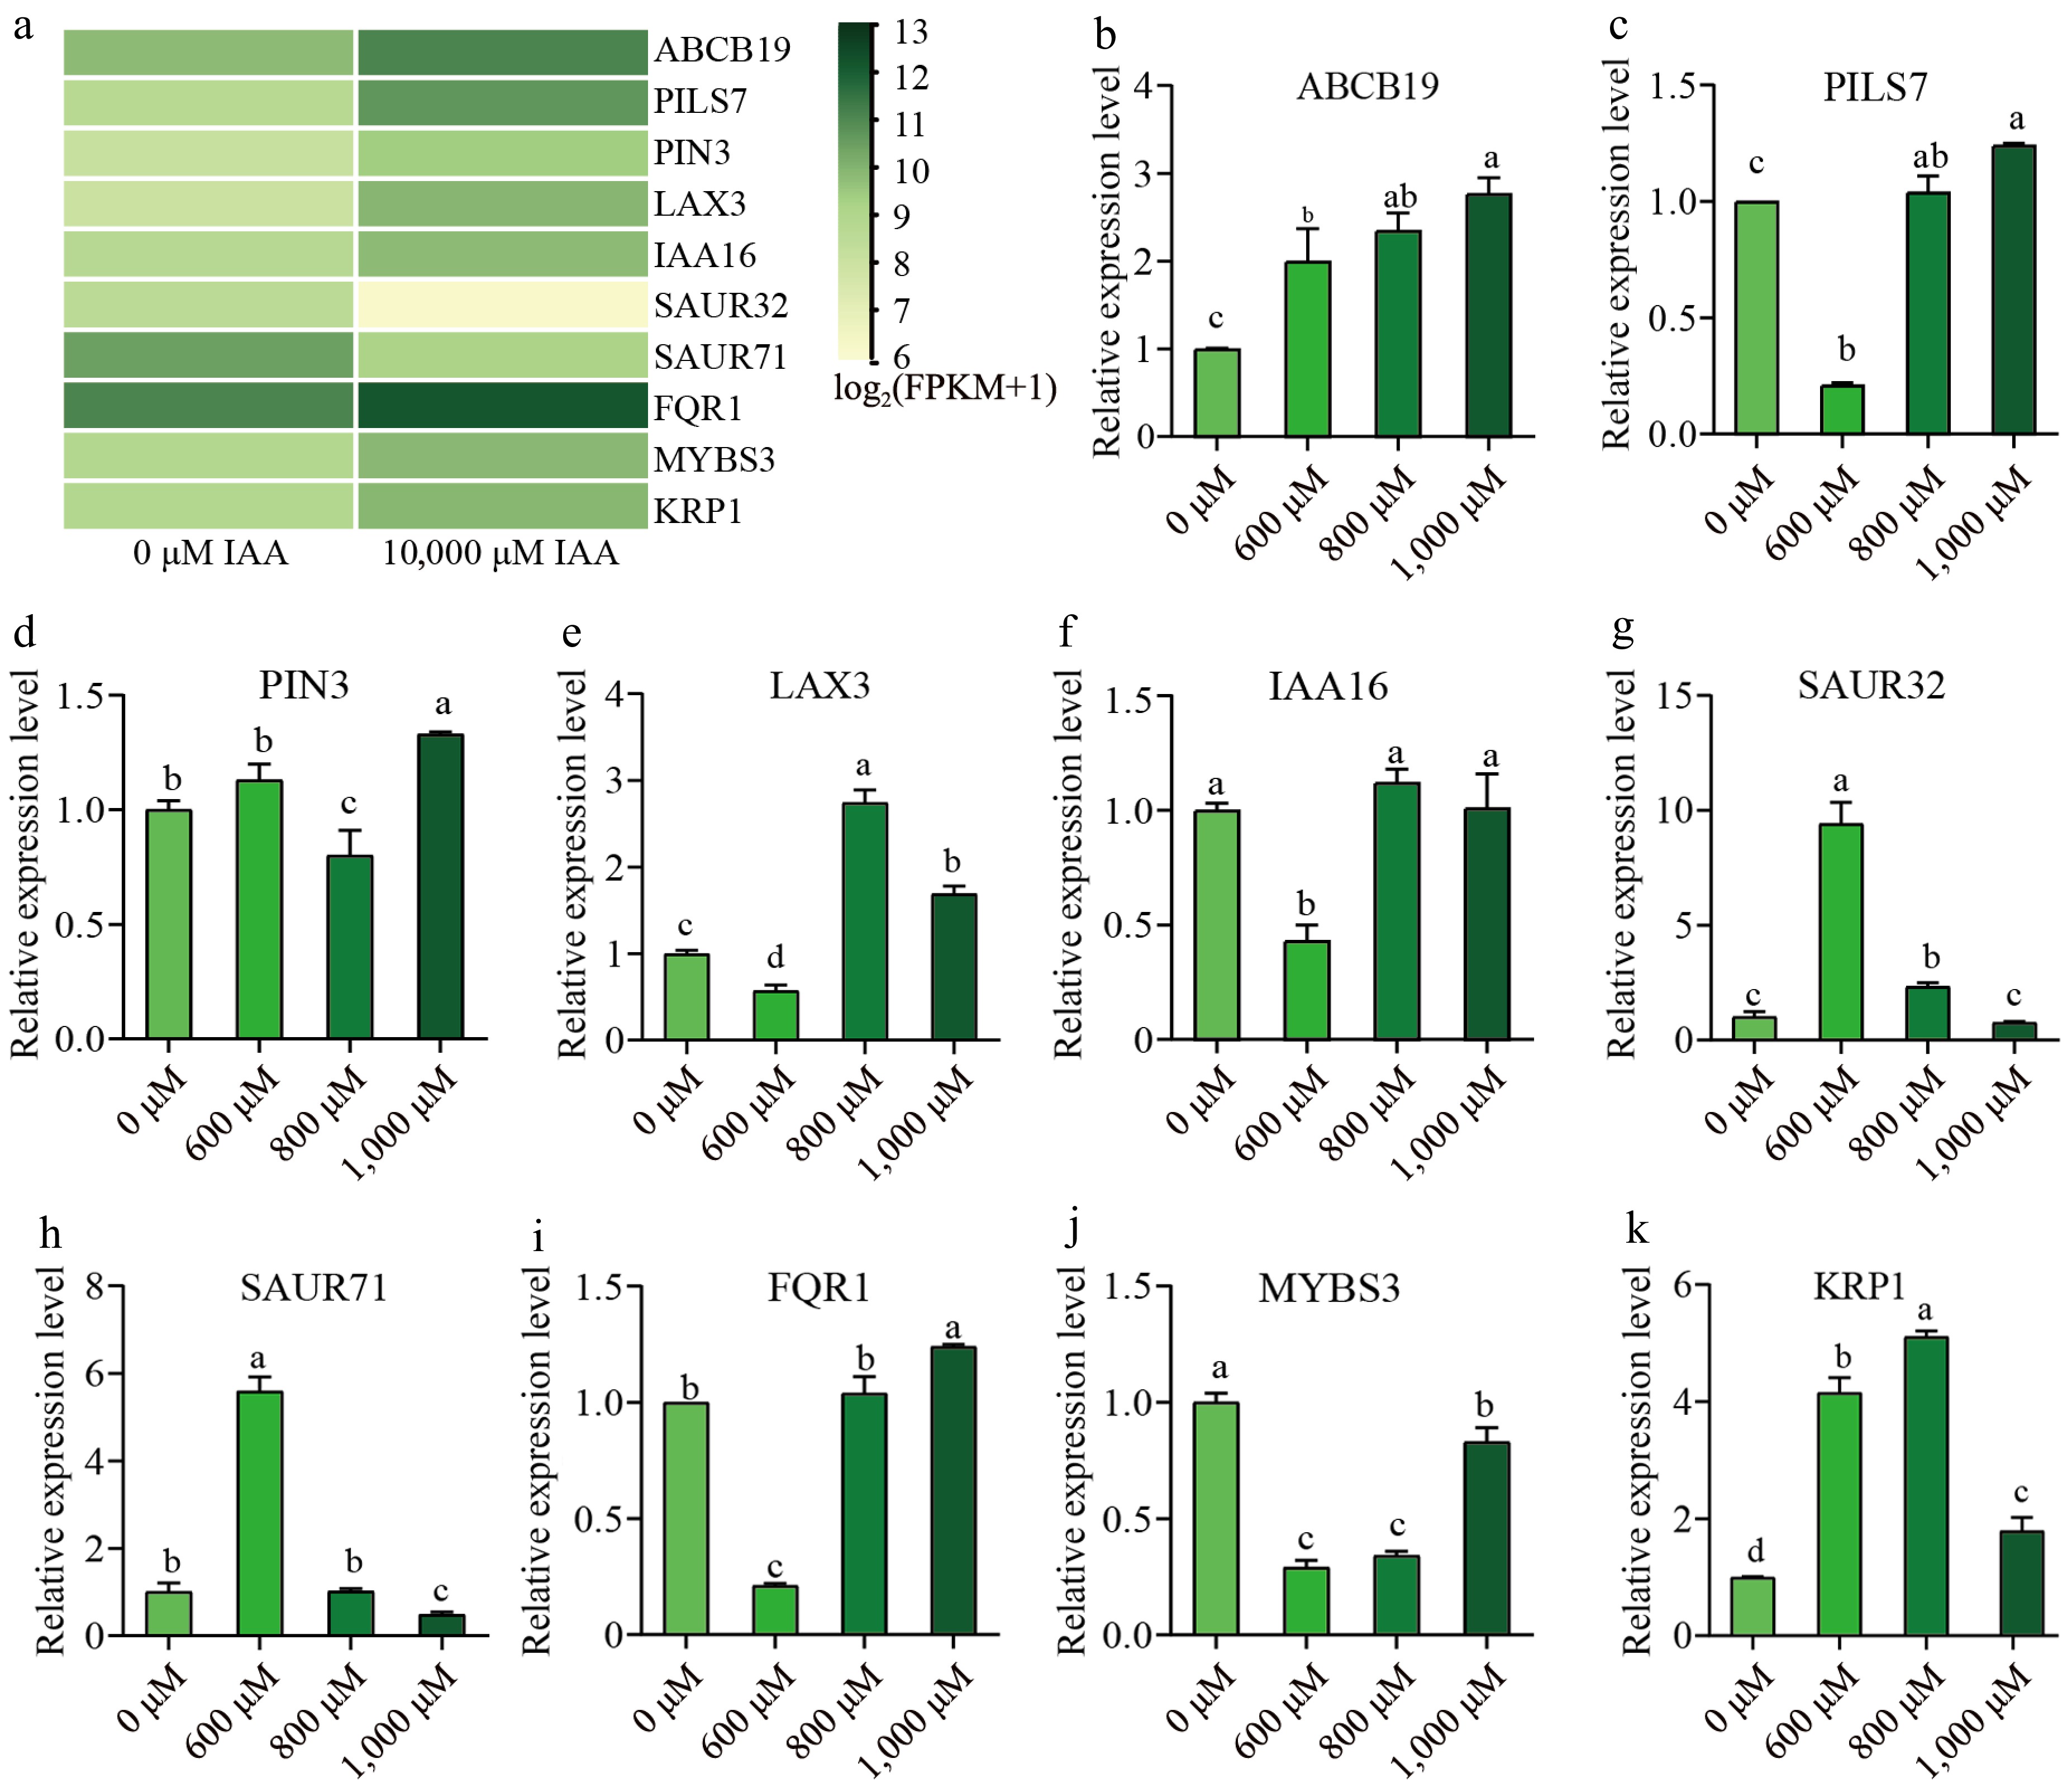
Figure 6.
Validation of RNA-Seq data using qRT-PCR analysis. (a) Heat map of 10 selected DEGs based on RNA-seq data. (b)−(k) Expression pattern validation analysis by qRT-PCR after 600, 800, and 1,000 μM IAA treatment. X-axis indicates treatment with different IAA concentrations, Y-axis indicates gene relatively exprssion level. Expression levels were represented as mean ± SE. Error bars indicate the standard error calculated from three replicates. Different lowercase letters above the bars indicate significant differences (p < 0.05, Duncan's multiple range test).
Figures
(6)
Tables
(0)