-
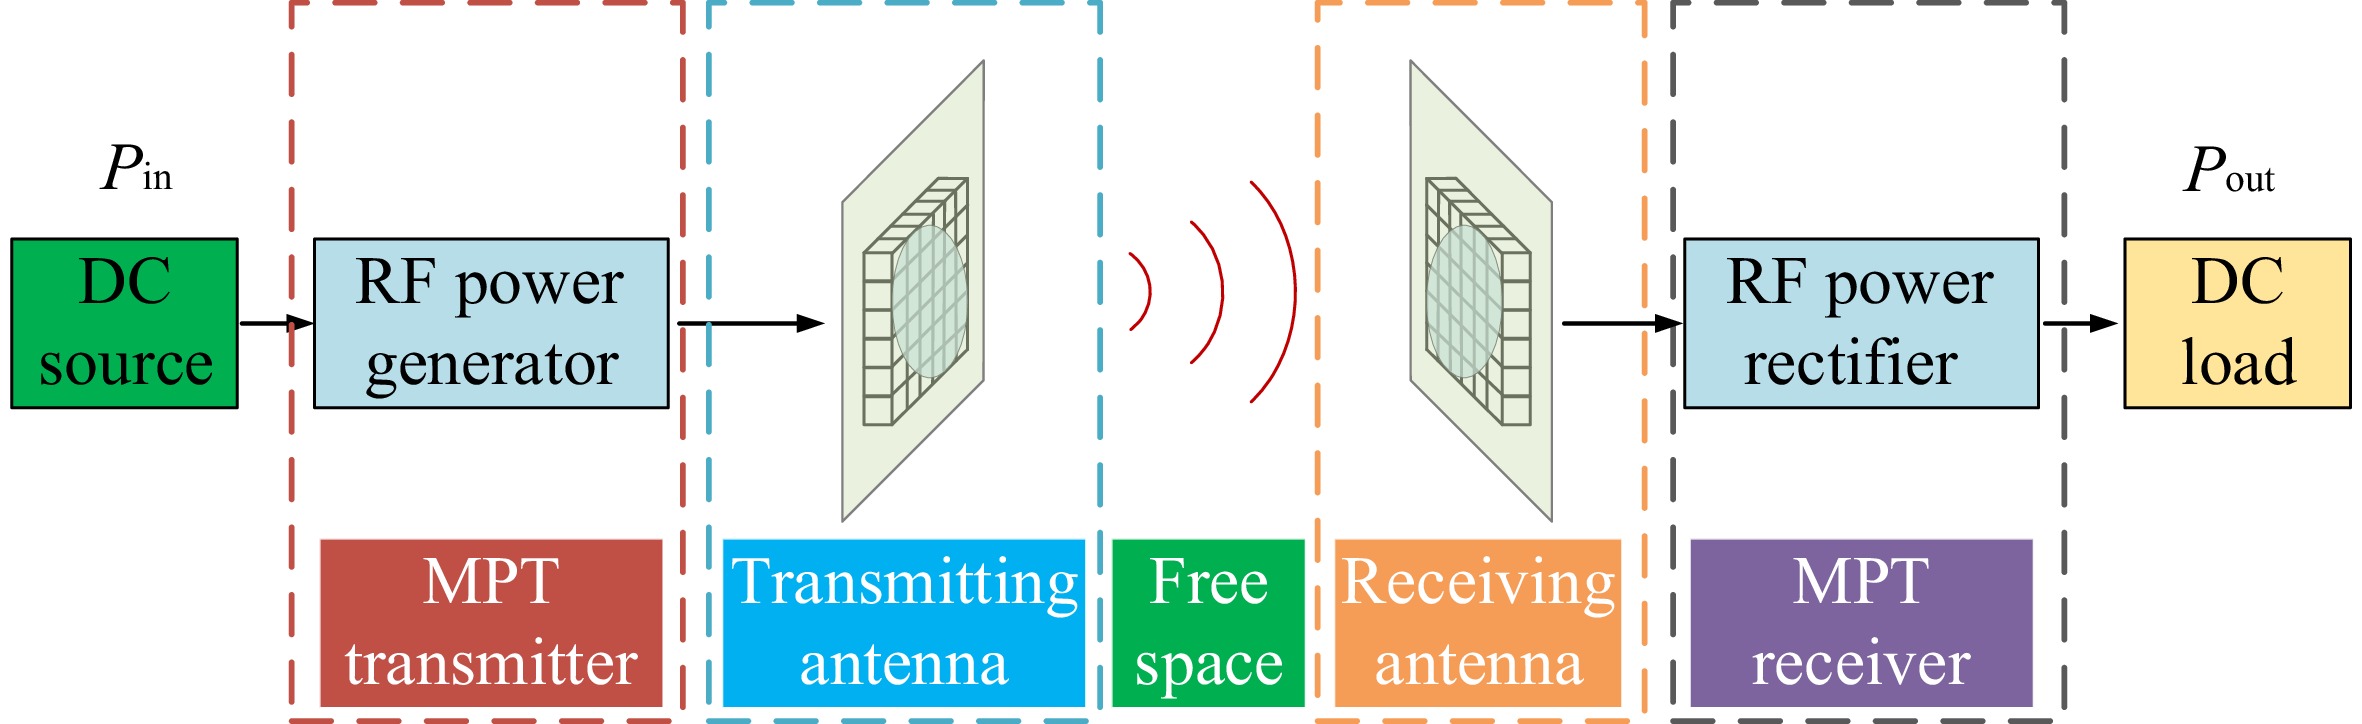
Figure 1.
The structure of a microwave wireless power transfer system.
-
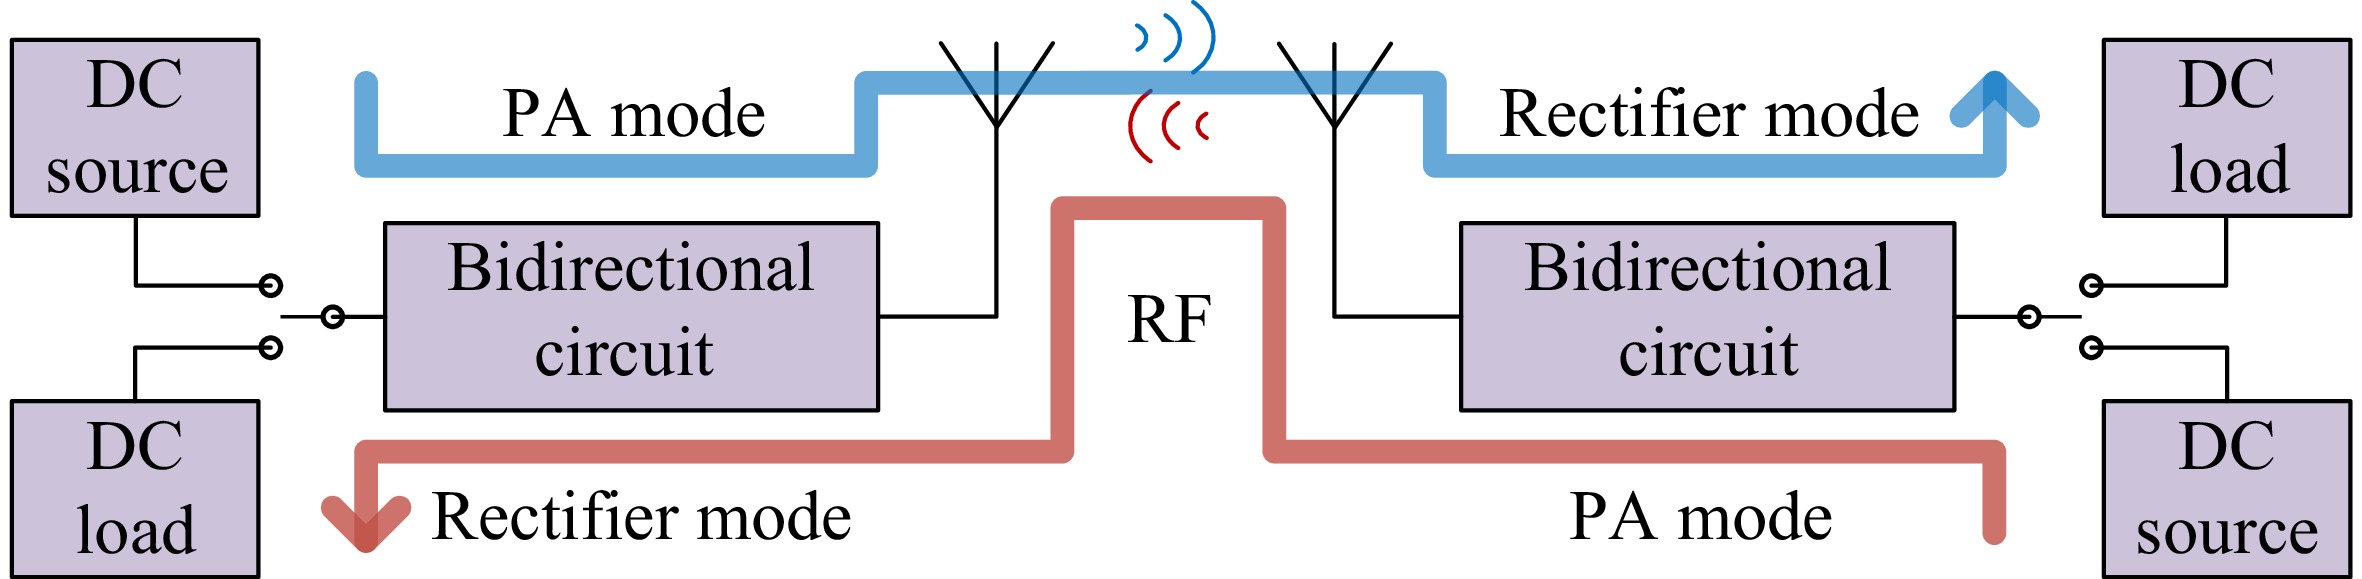
Figure 2.
Structure of the bidirectional microwave wireless power transfer system. Blue lines represent forward power flow, red lines represent reverse power flow.
-
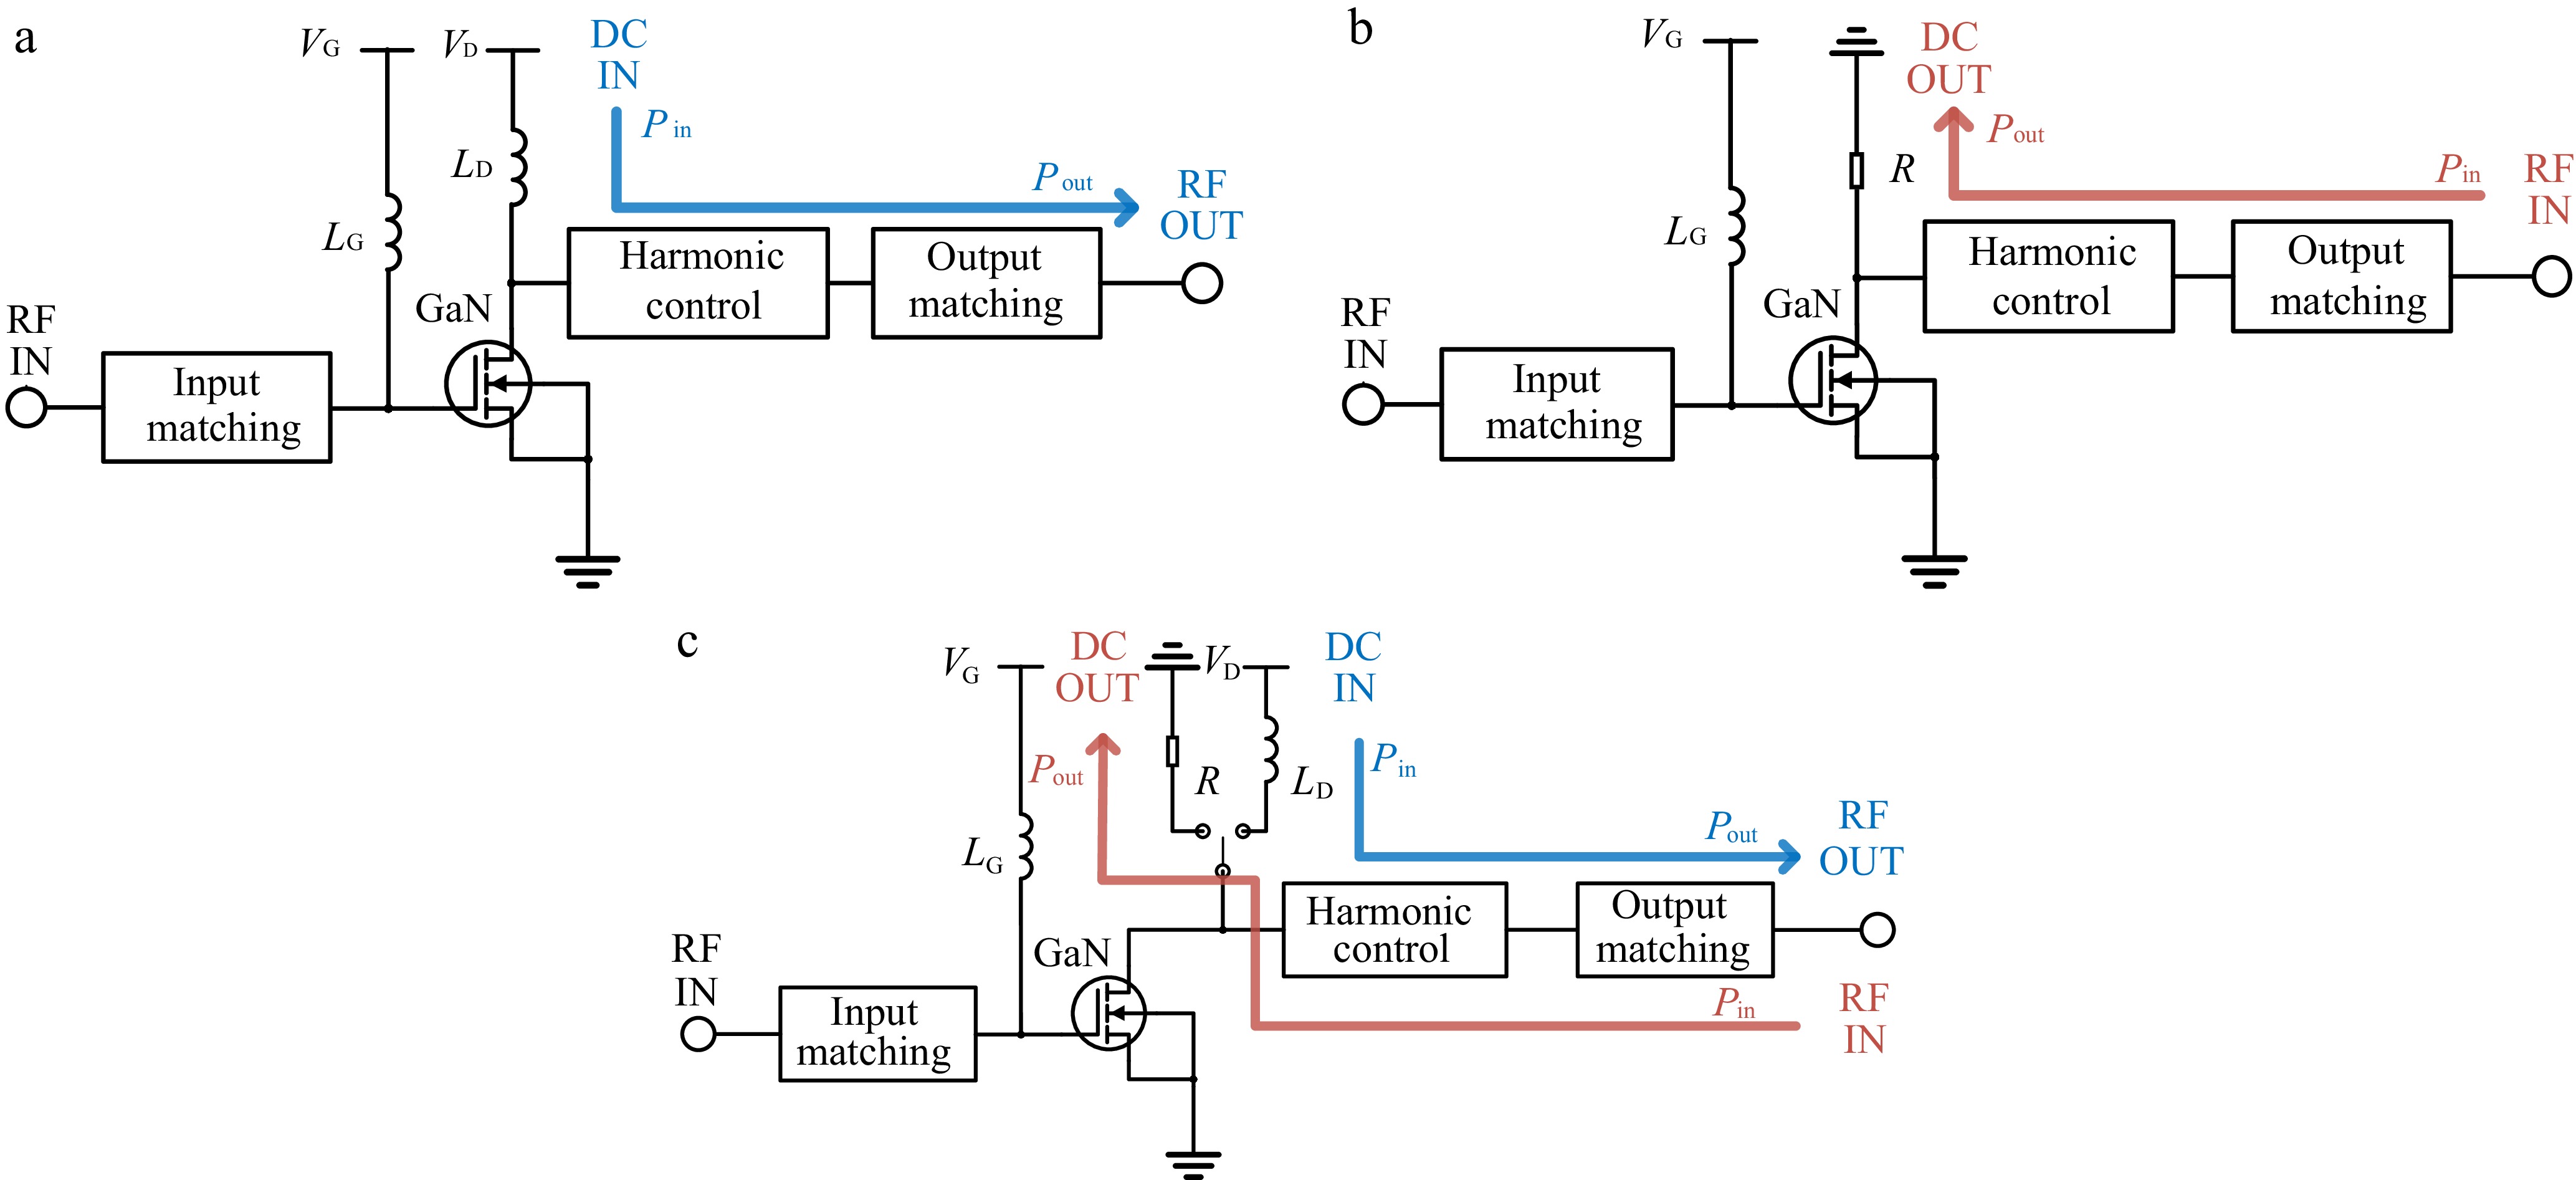
Figure 3.
System diagrams. (a) Power amplifier, (b) rectifier, (c) bidirectional circuit.
-
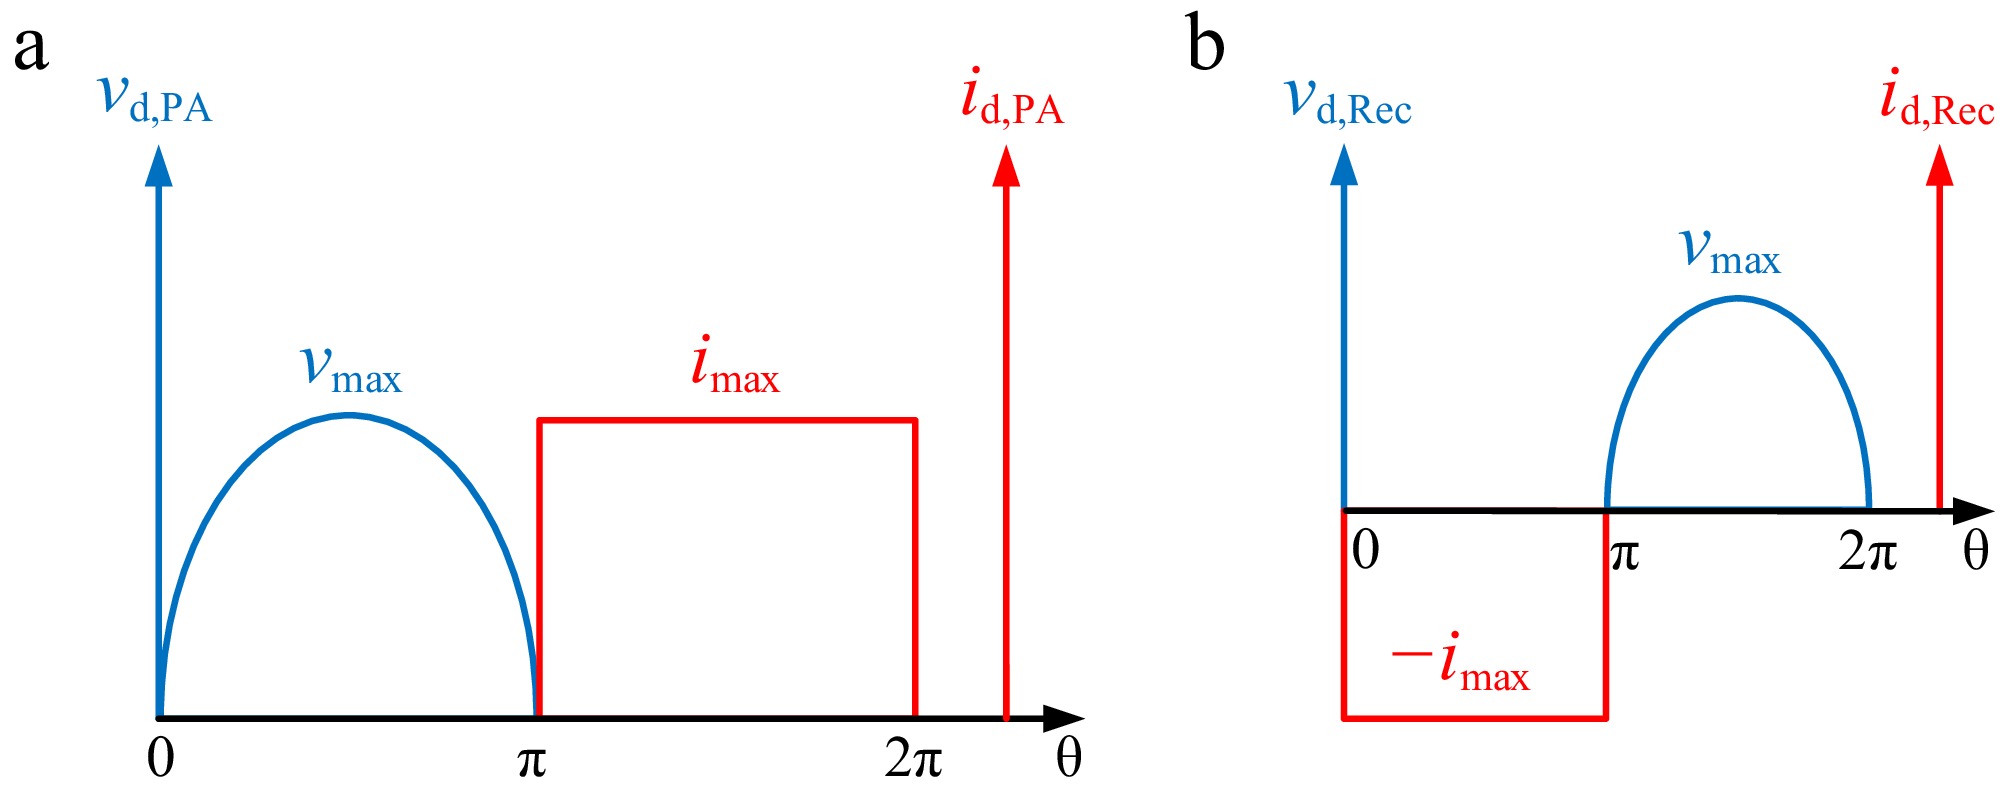
Figure 4.
Ideal drain voltage and current waveforms of (a) PA, and (b) rectifier.
-
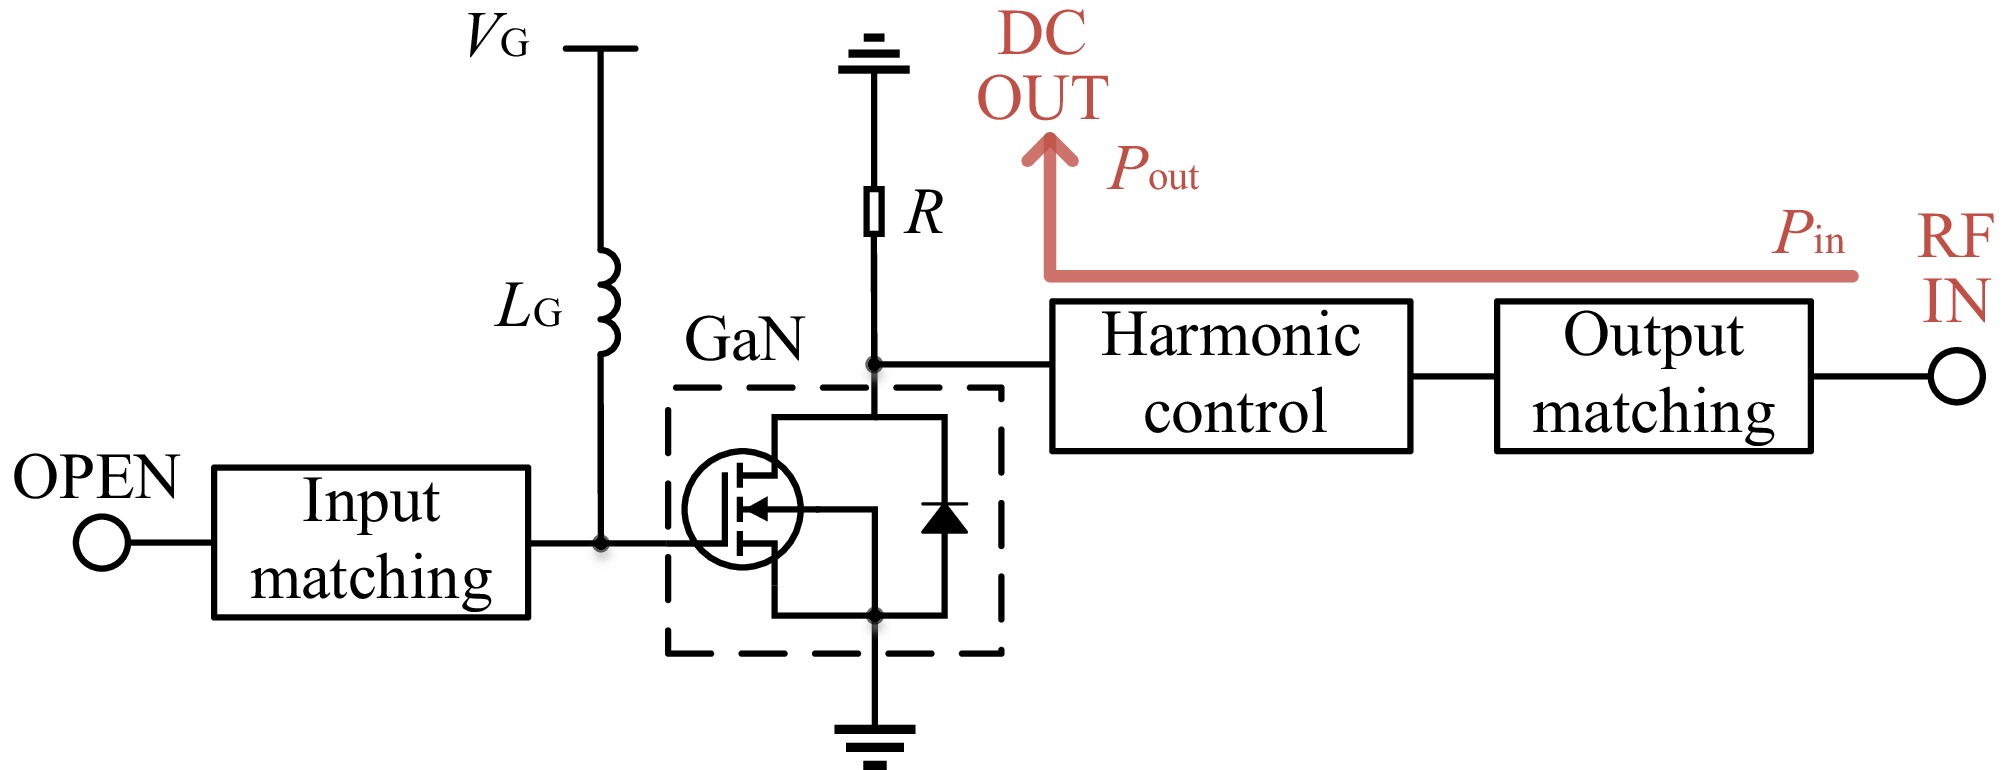
Figure 5.
Compact rectifier mode with the GaN HEMT.
-
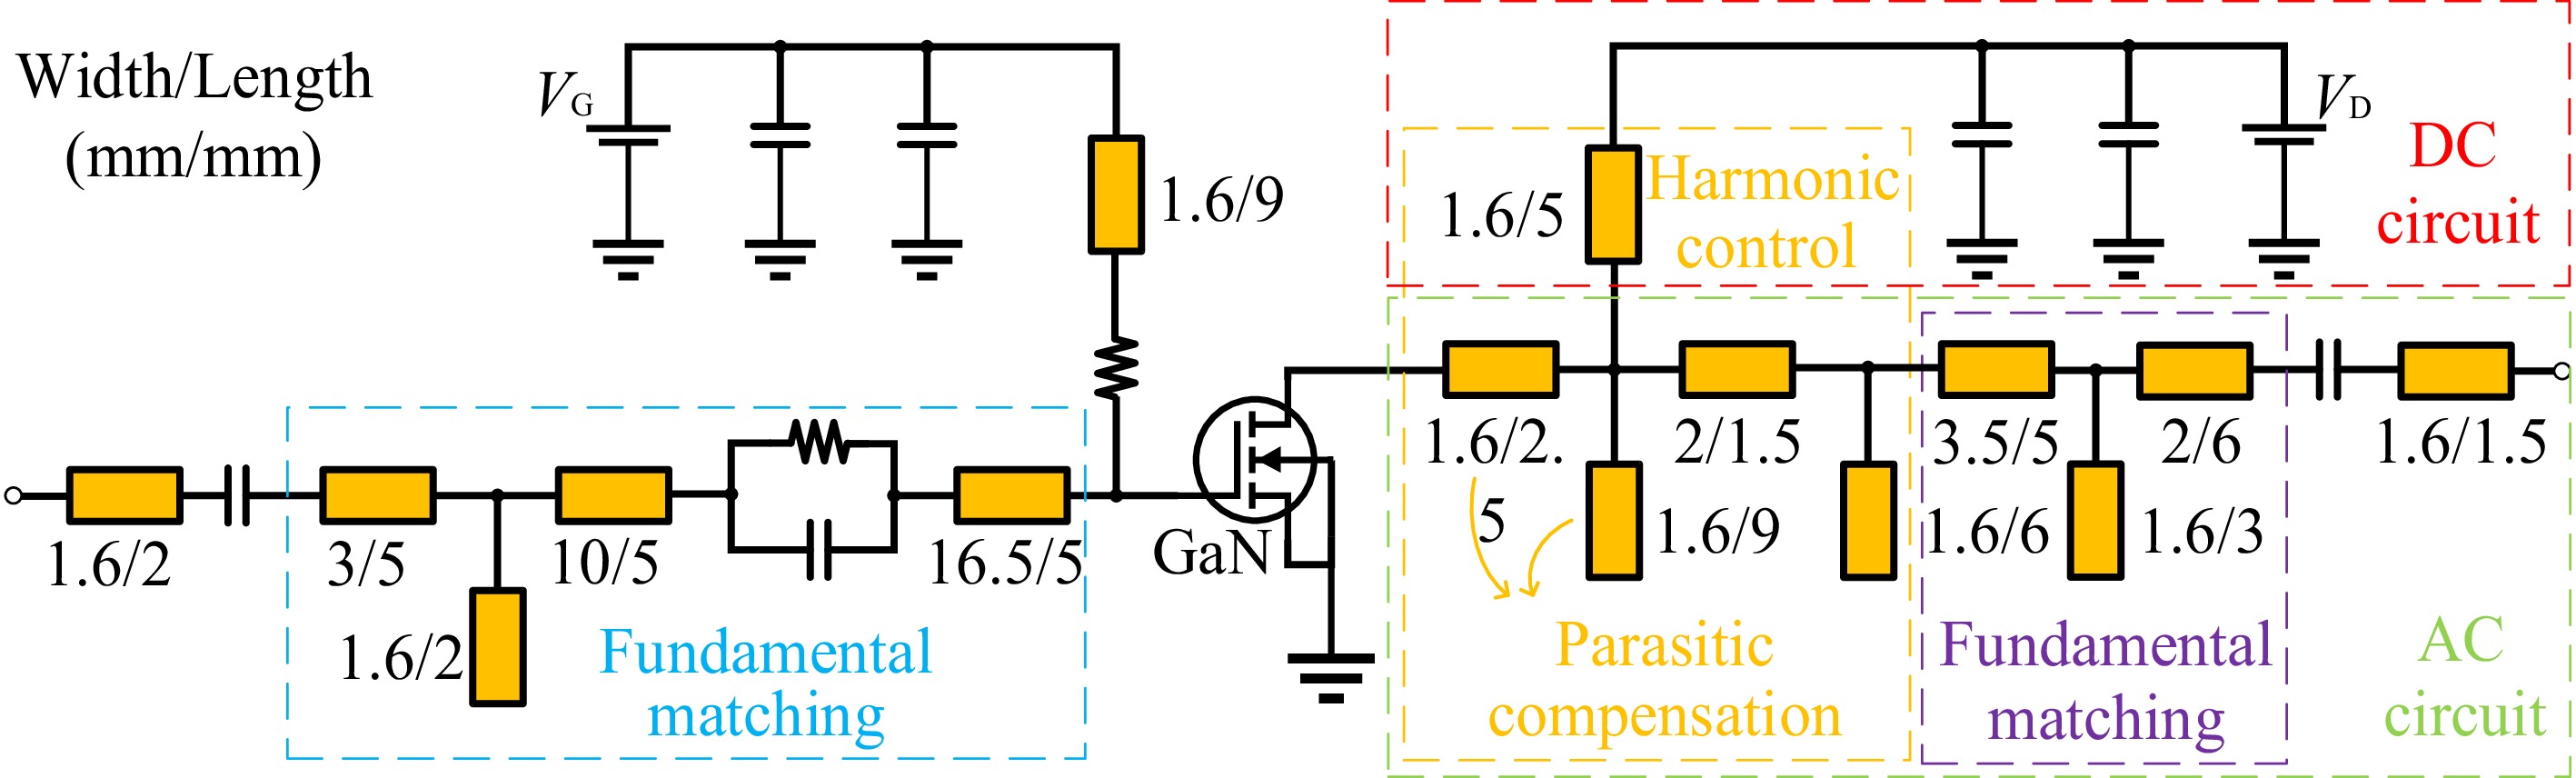
Figure 6.
System architecture diagram with equivalent parameters.
-
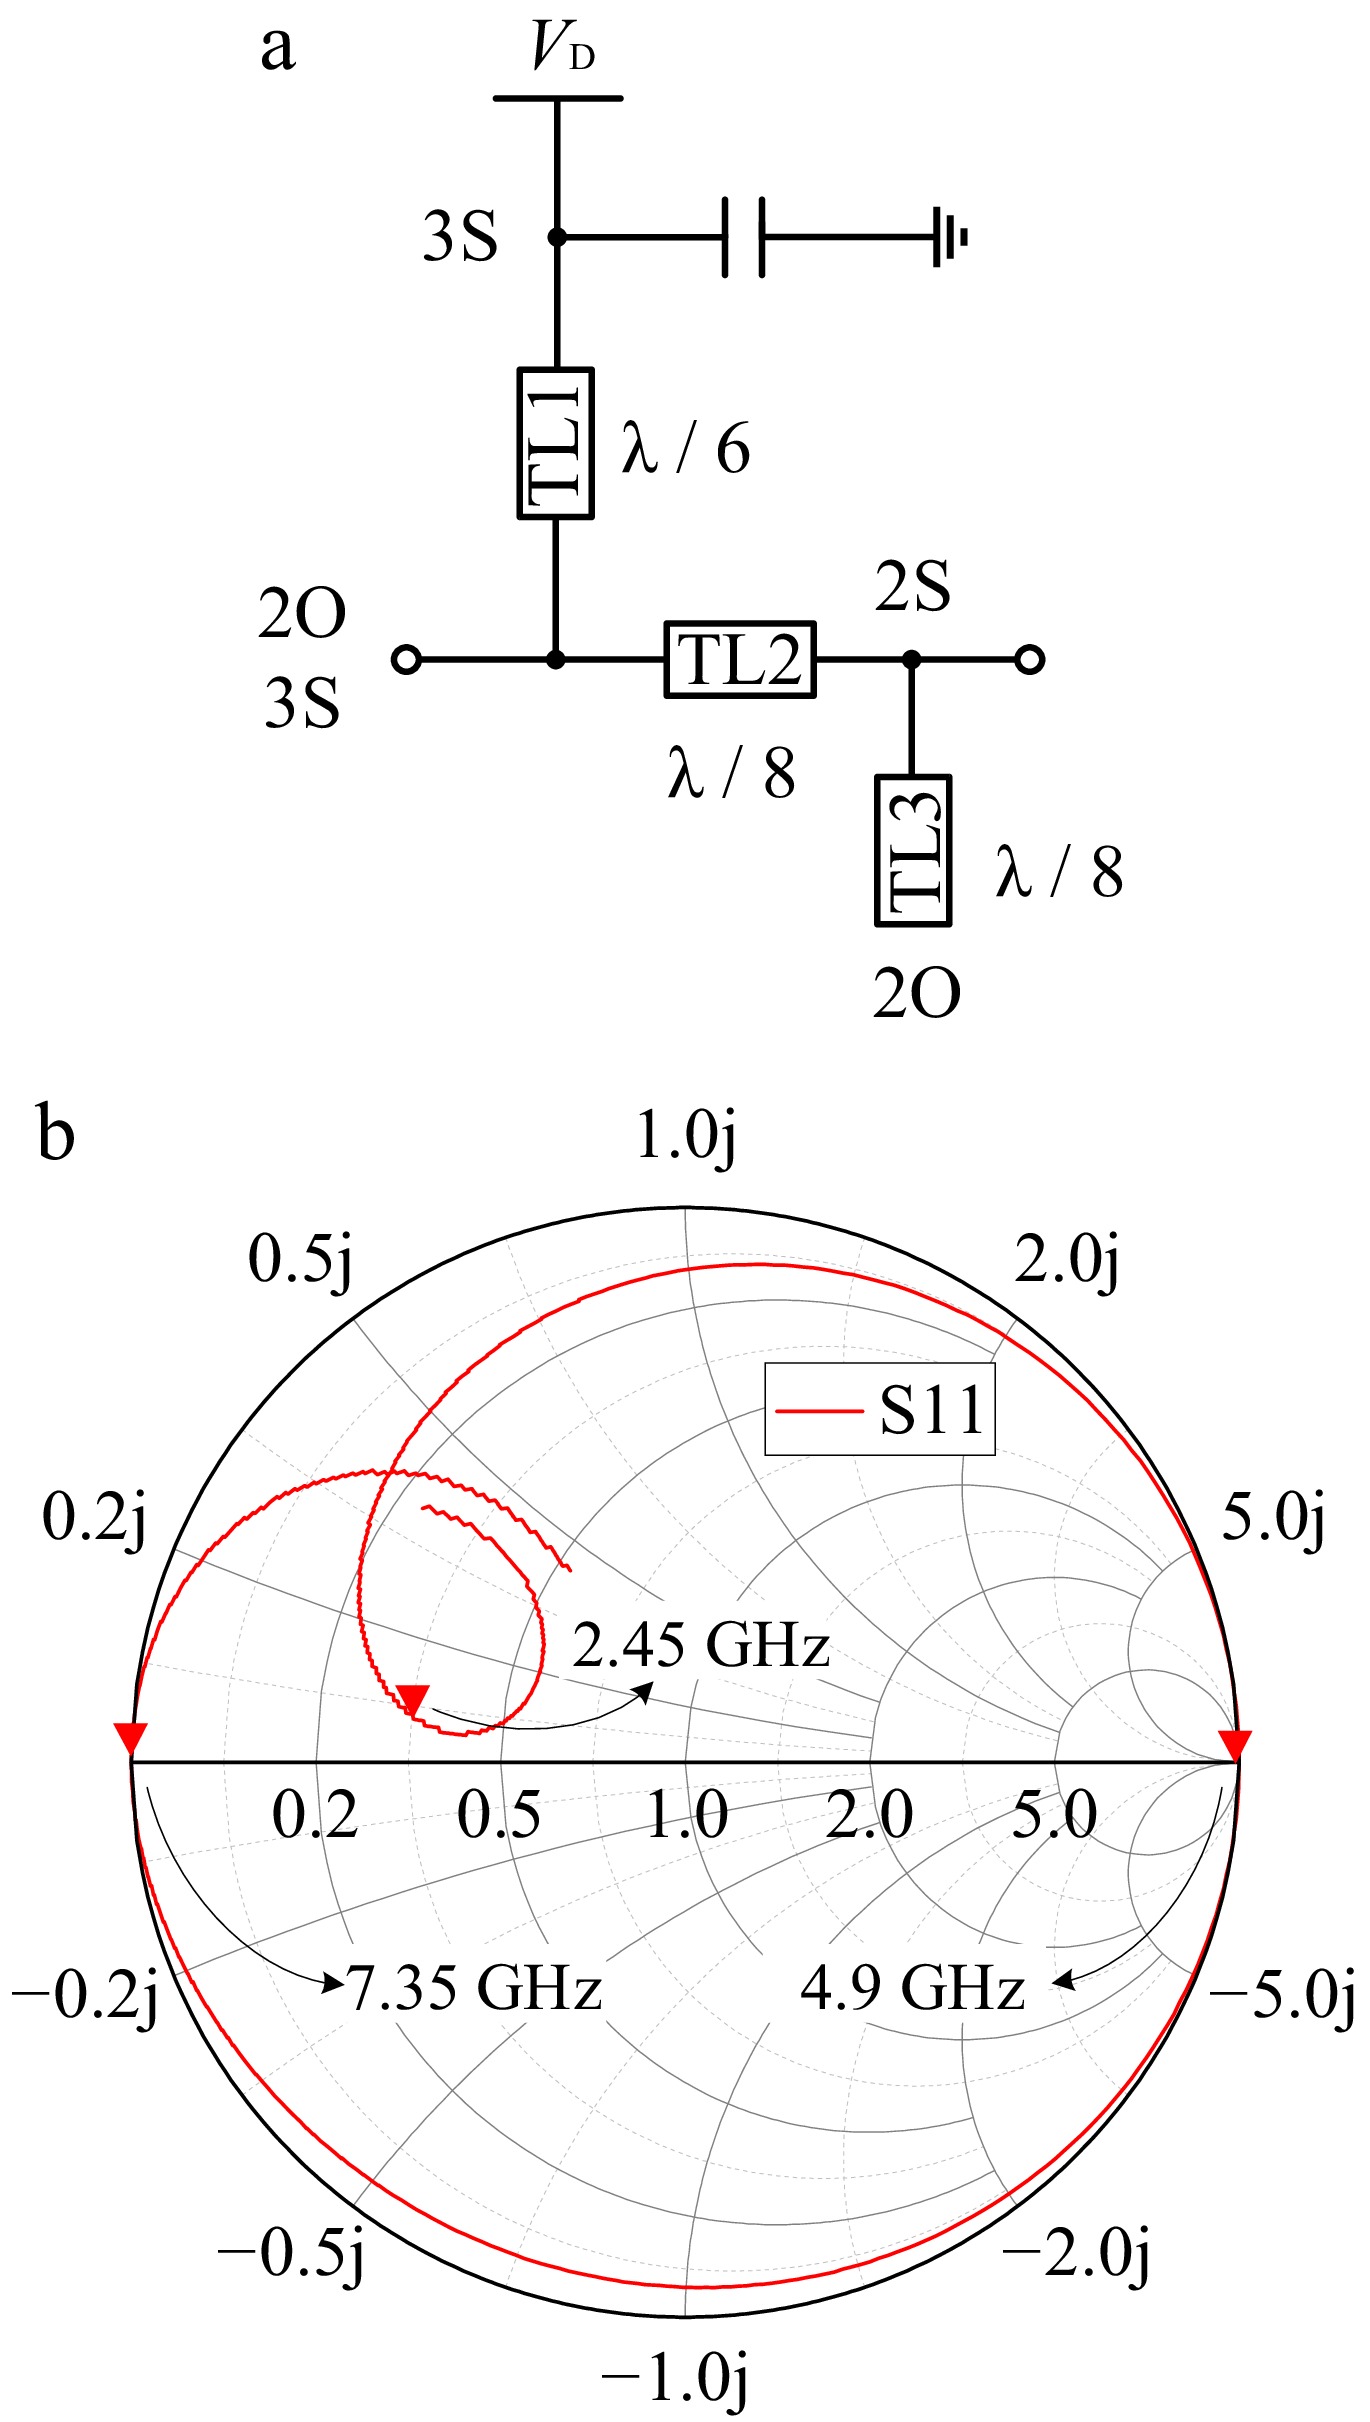
Figure 7.
(a) Schematic of the harmonic network. (b) Calculated results of the input impedance of the harmonic network on on the Smith chart.
-
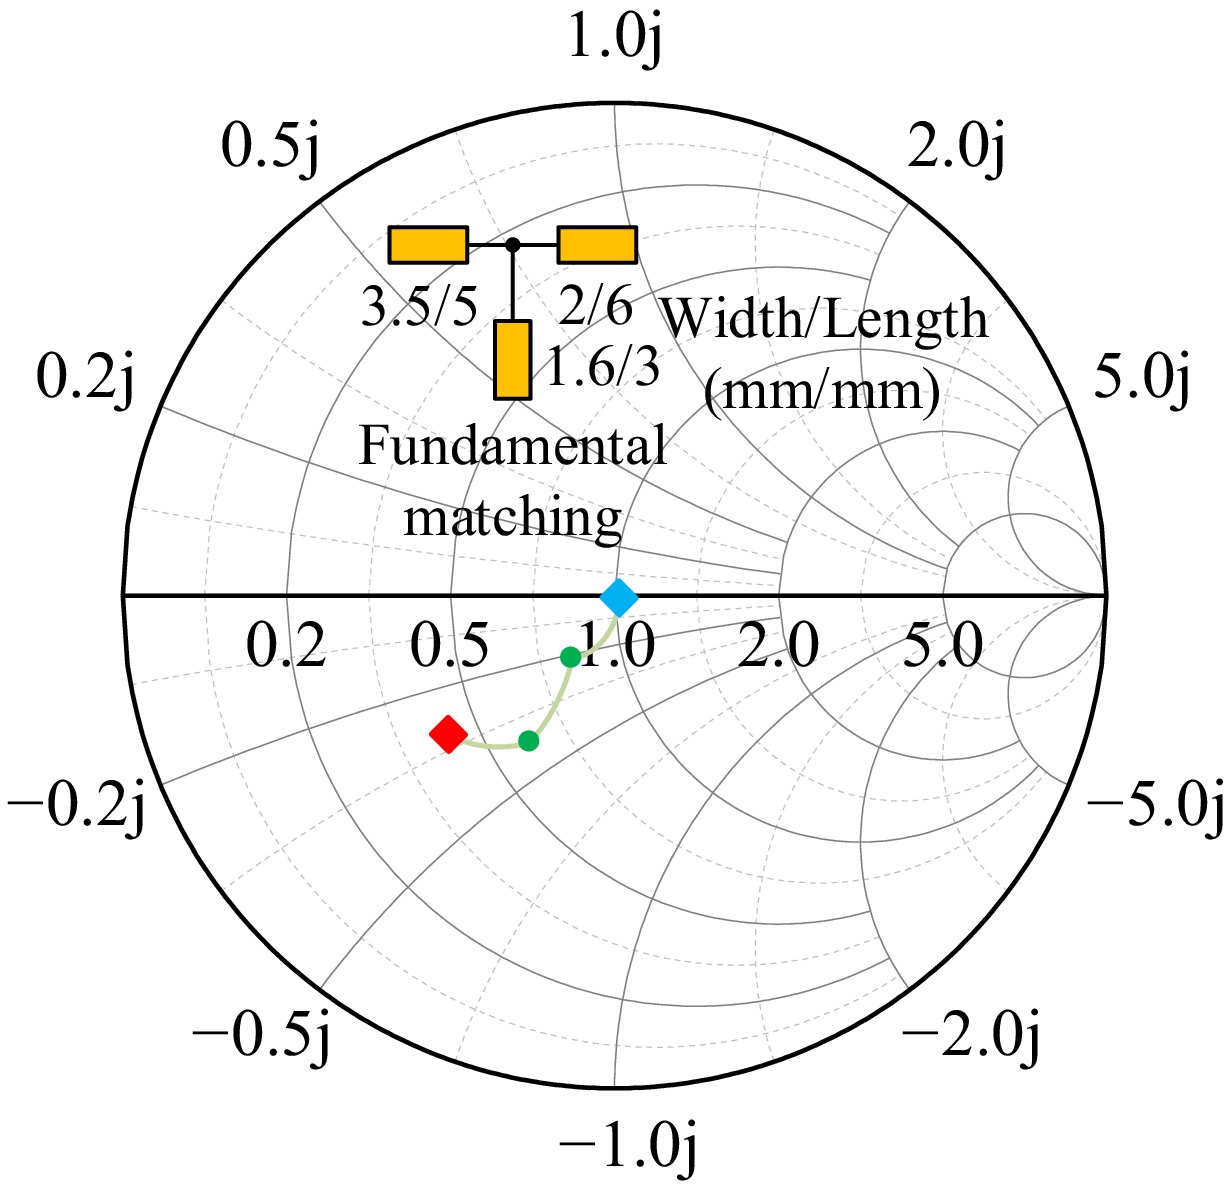
Figure 8.
Smith chart for output impedance matching.
-
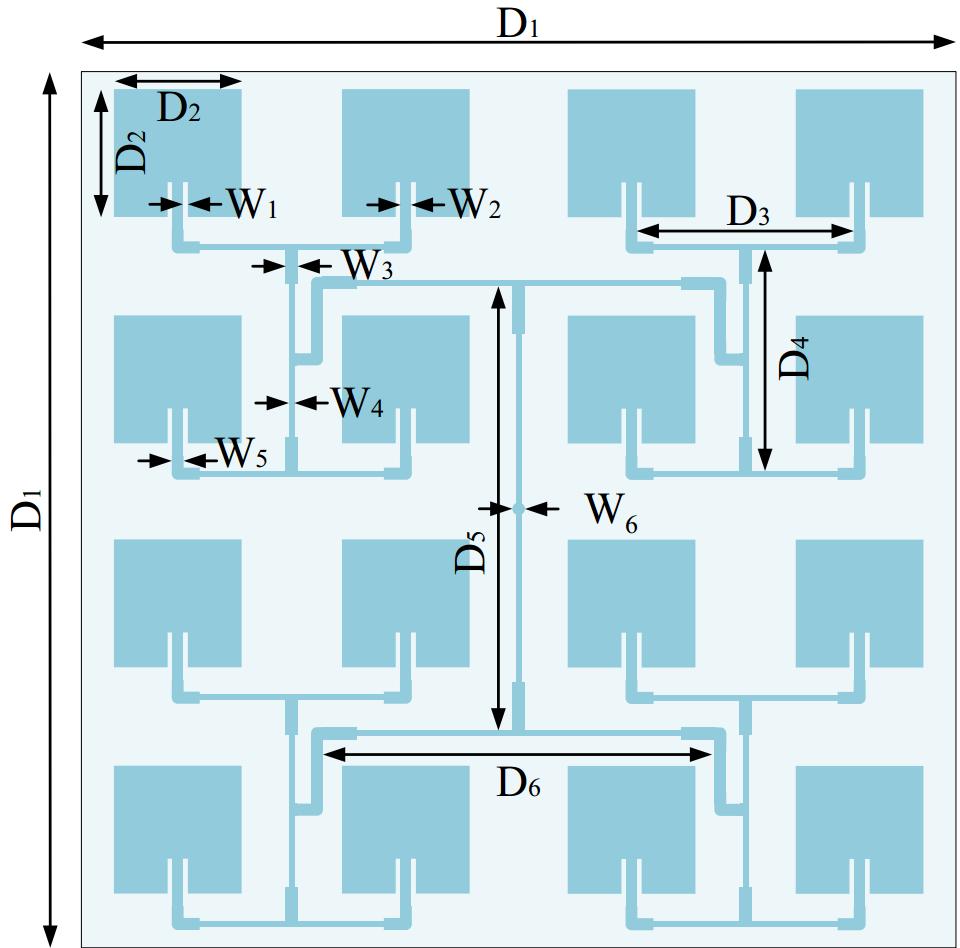
Figure 9.
Structure of the antenna unit.
-
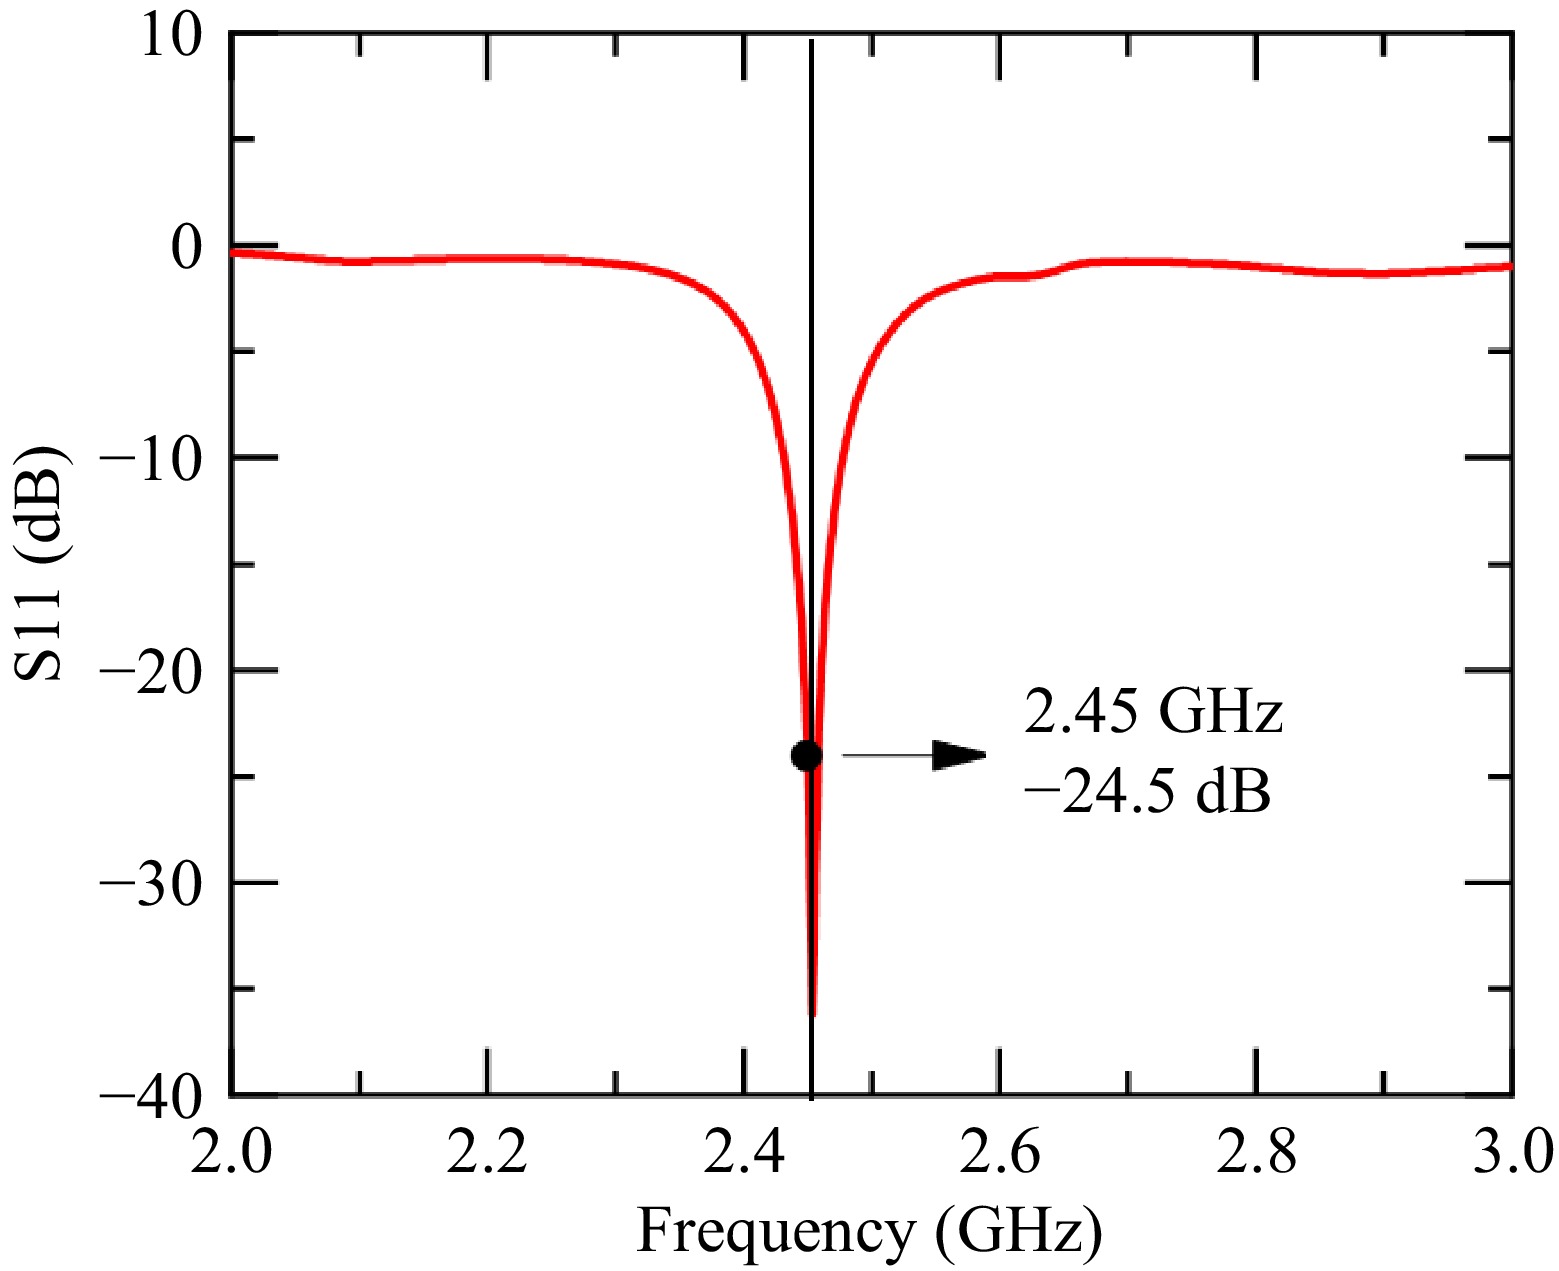
Figure 10.
S11 parameter of the microstrip array antenna.
-
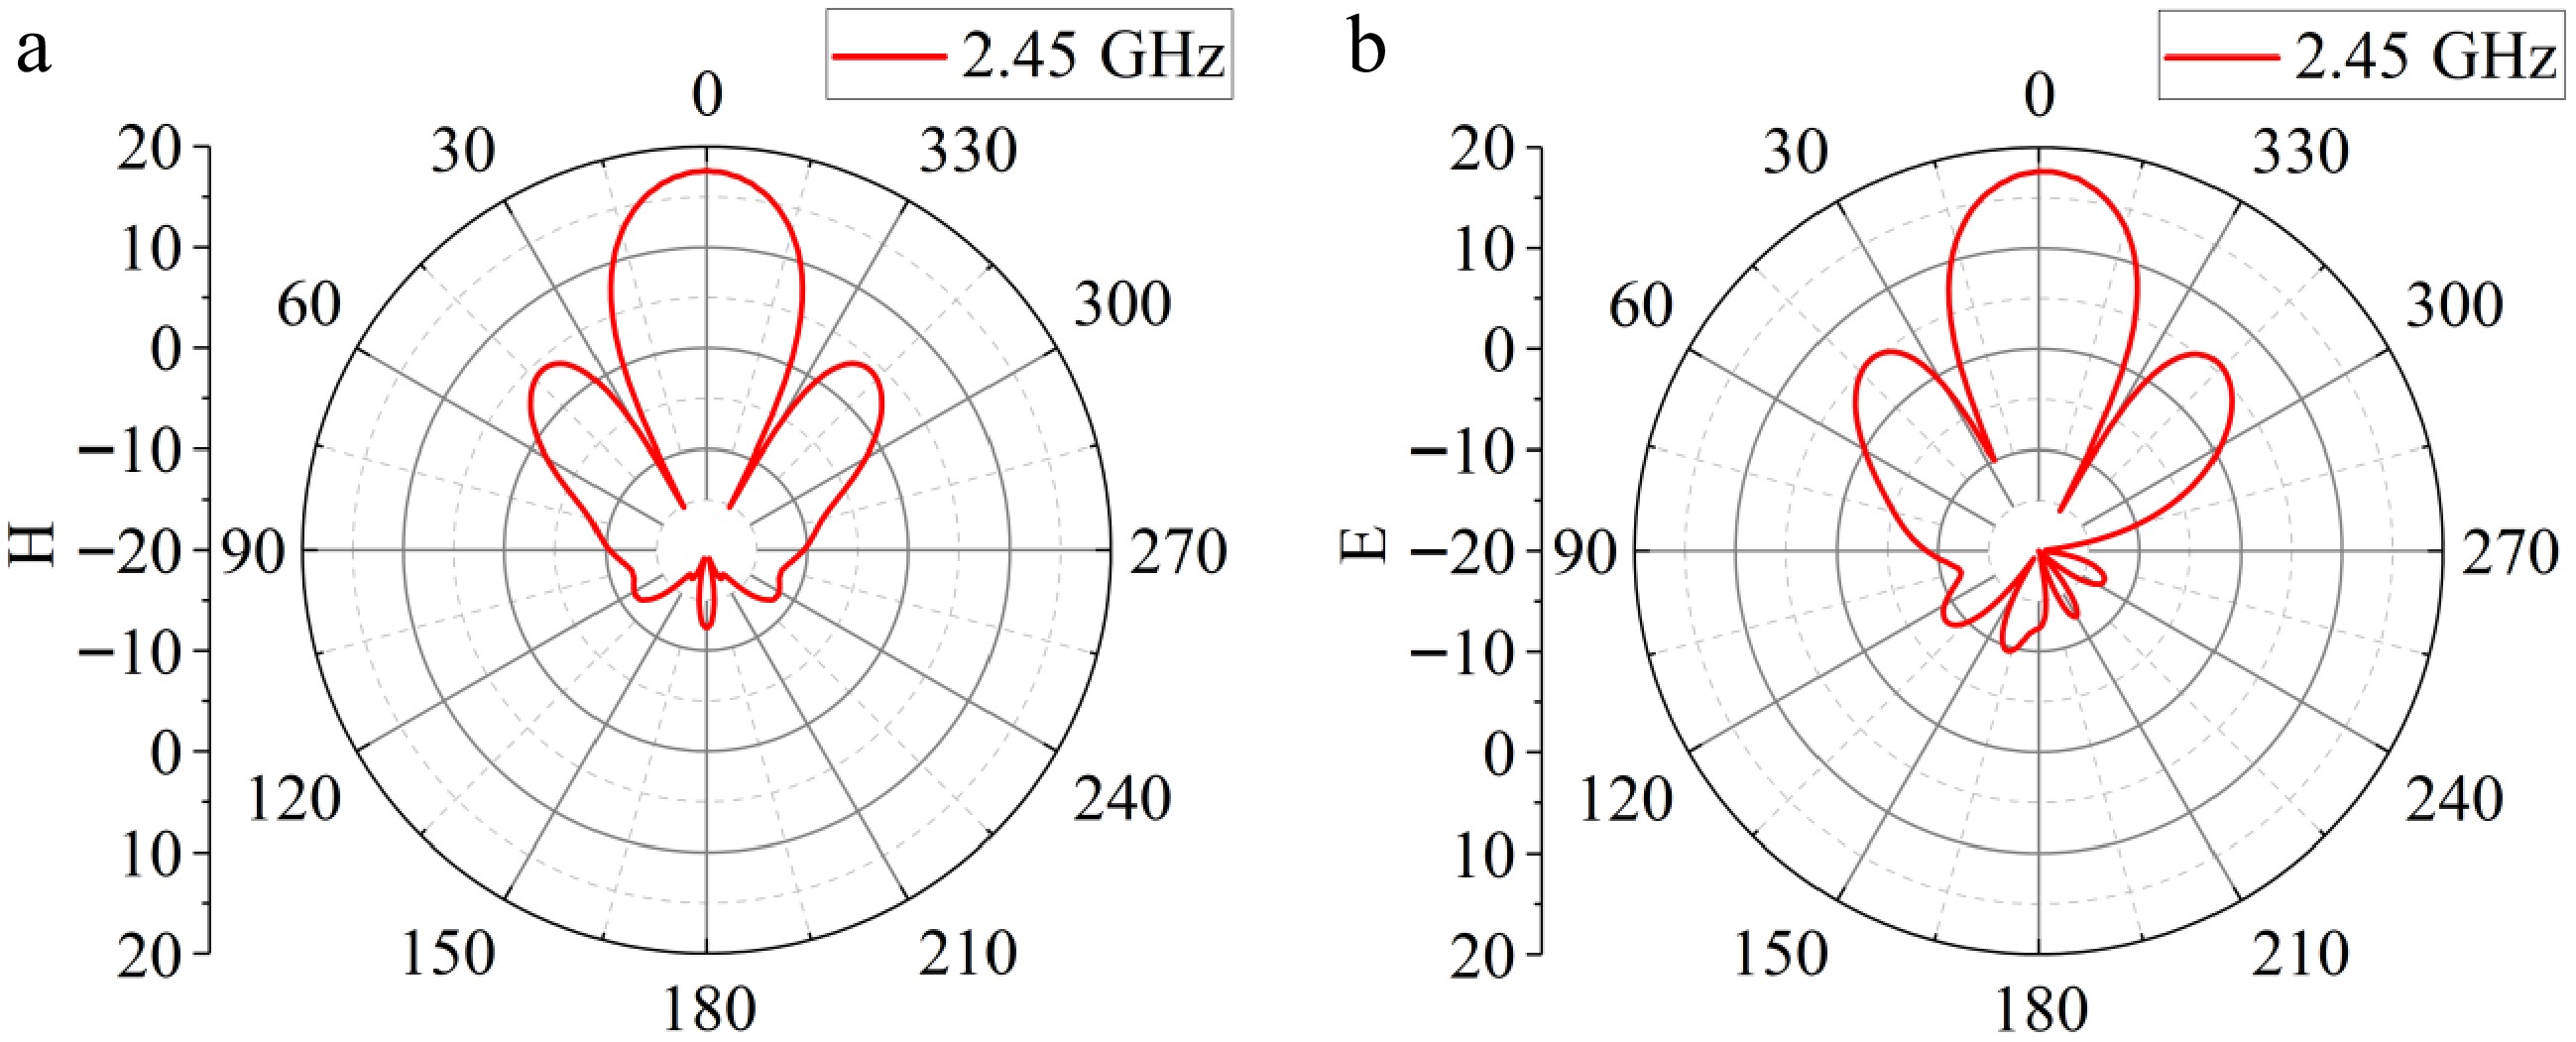
Figure 11.
Radiation patterns of the microstrip array antenna. (a) H-plane, (b) E-plane.
-
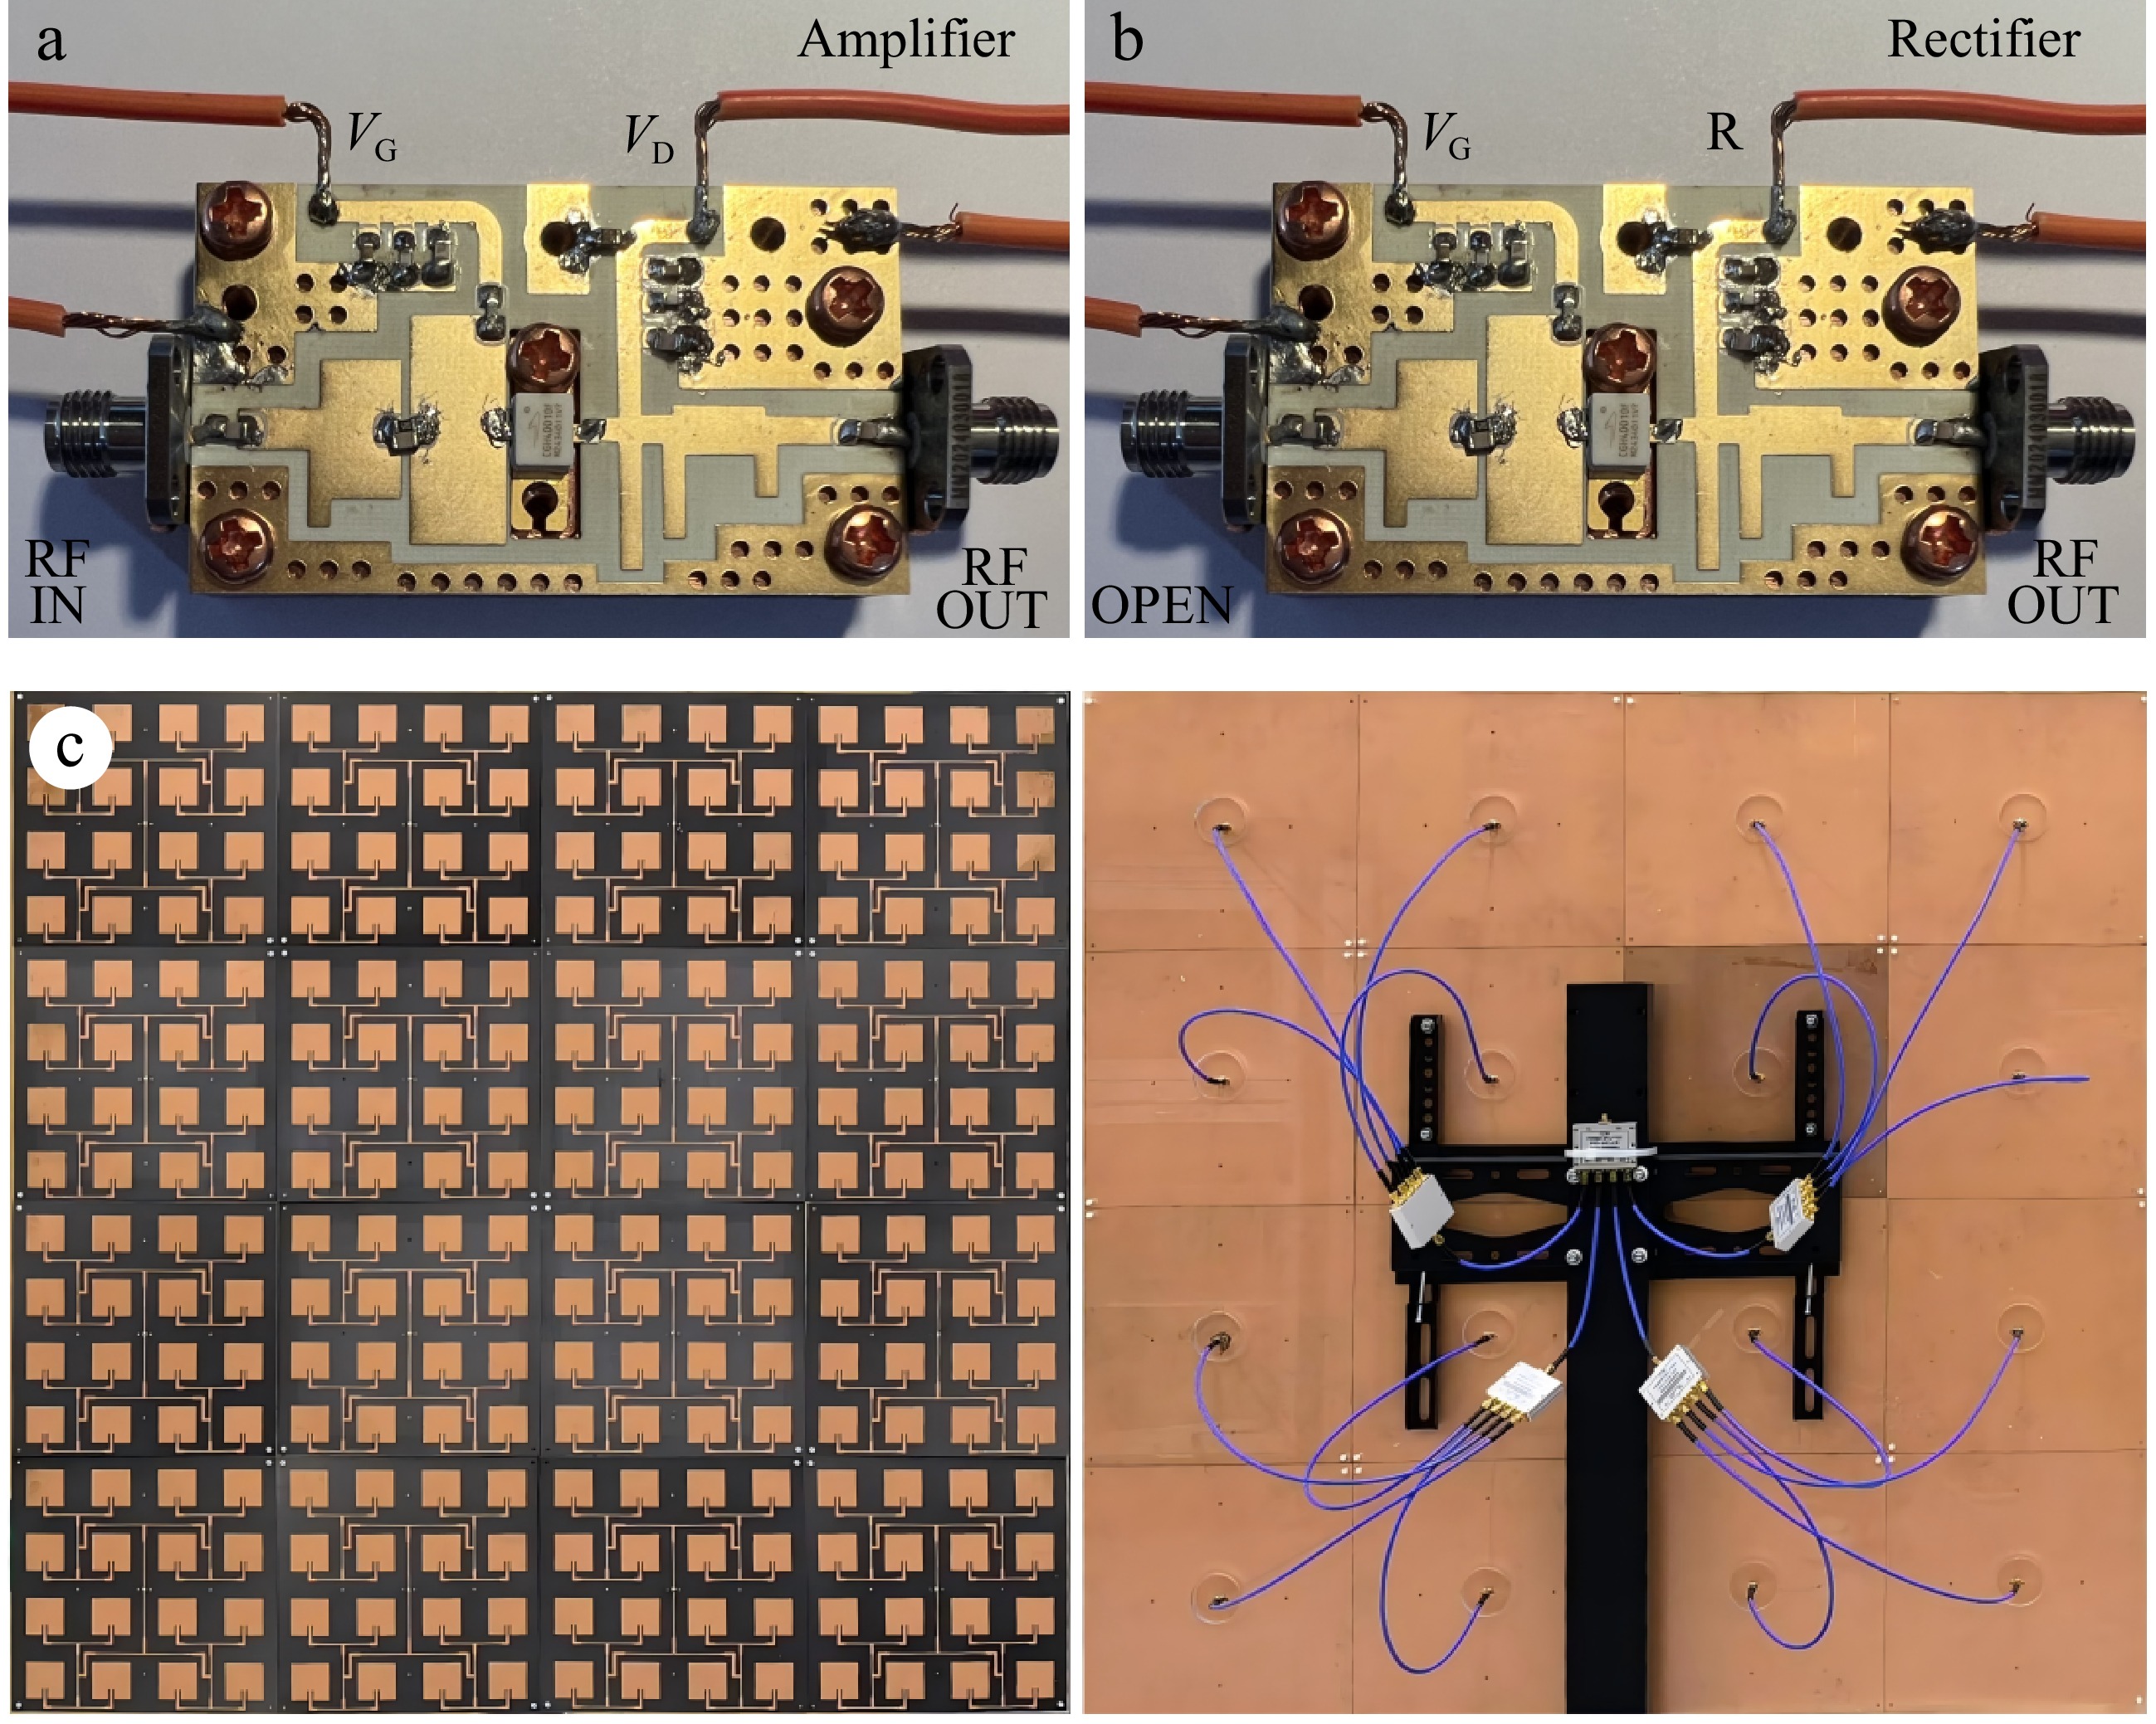
Figure 12.
Fabricated prototypes. (a) PA, (b) rectifier, and (c) microstrip array antenna.
-
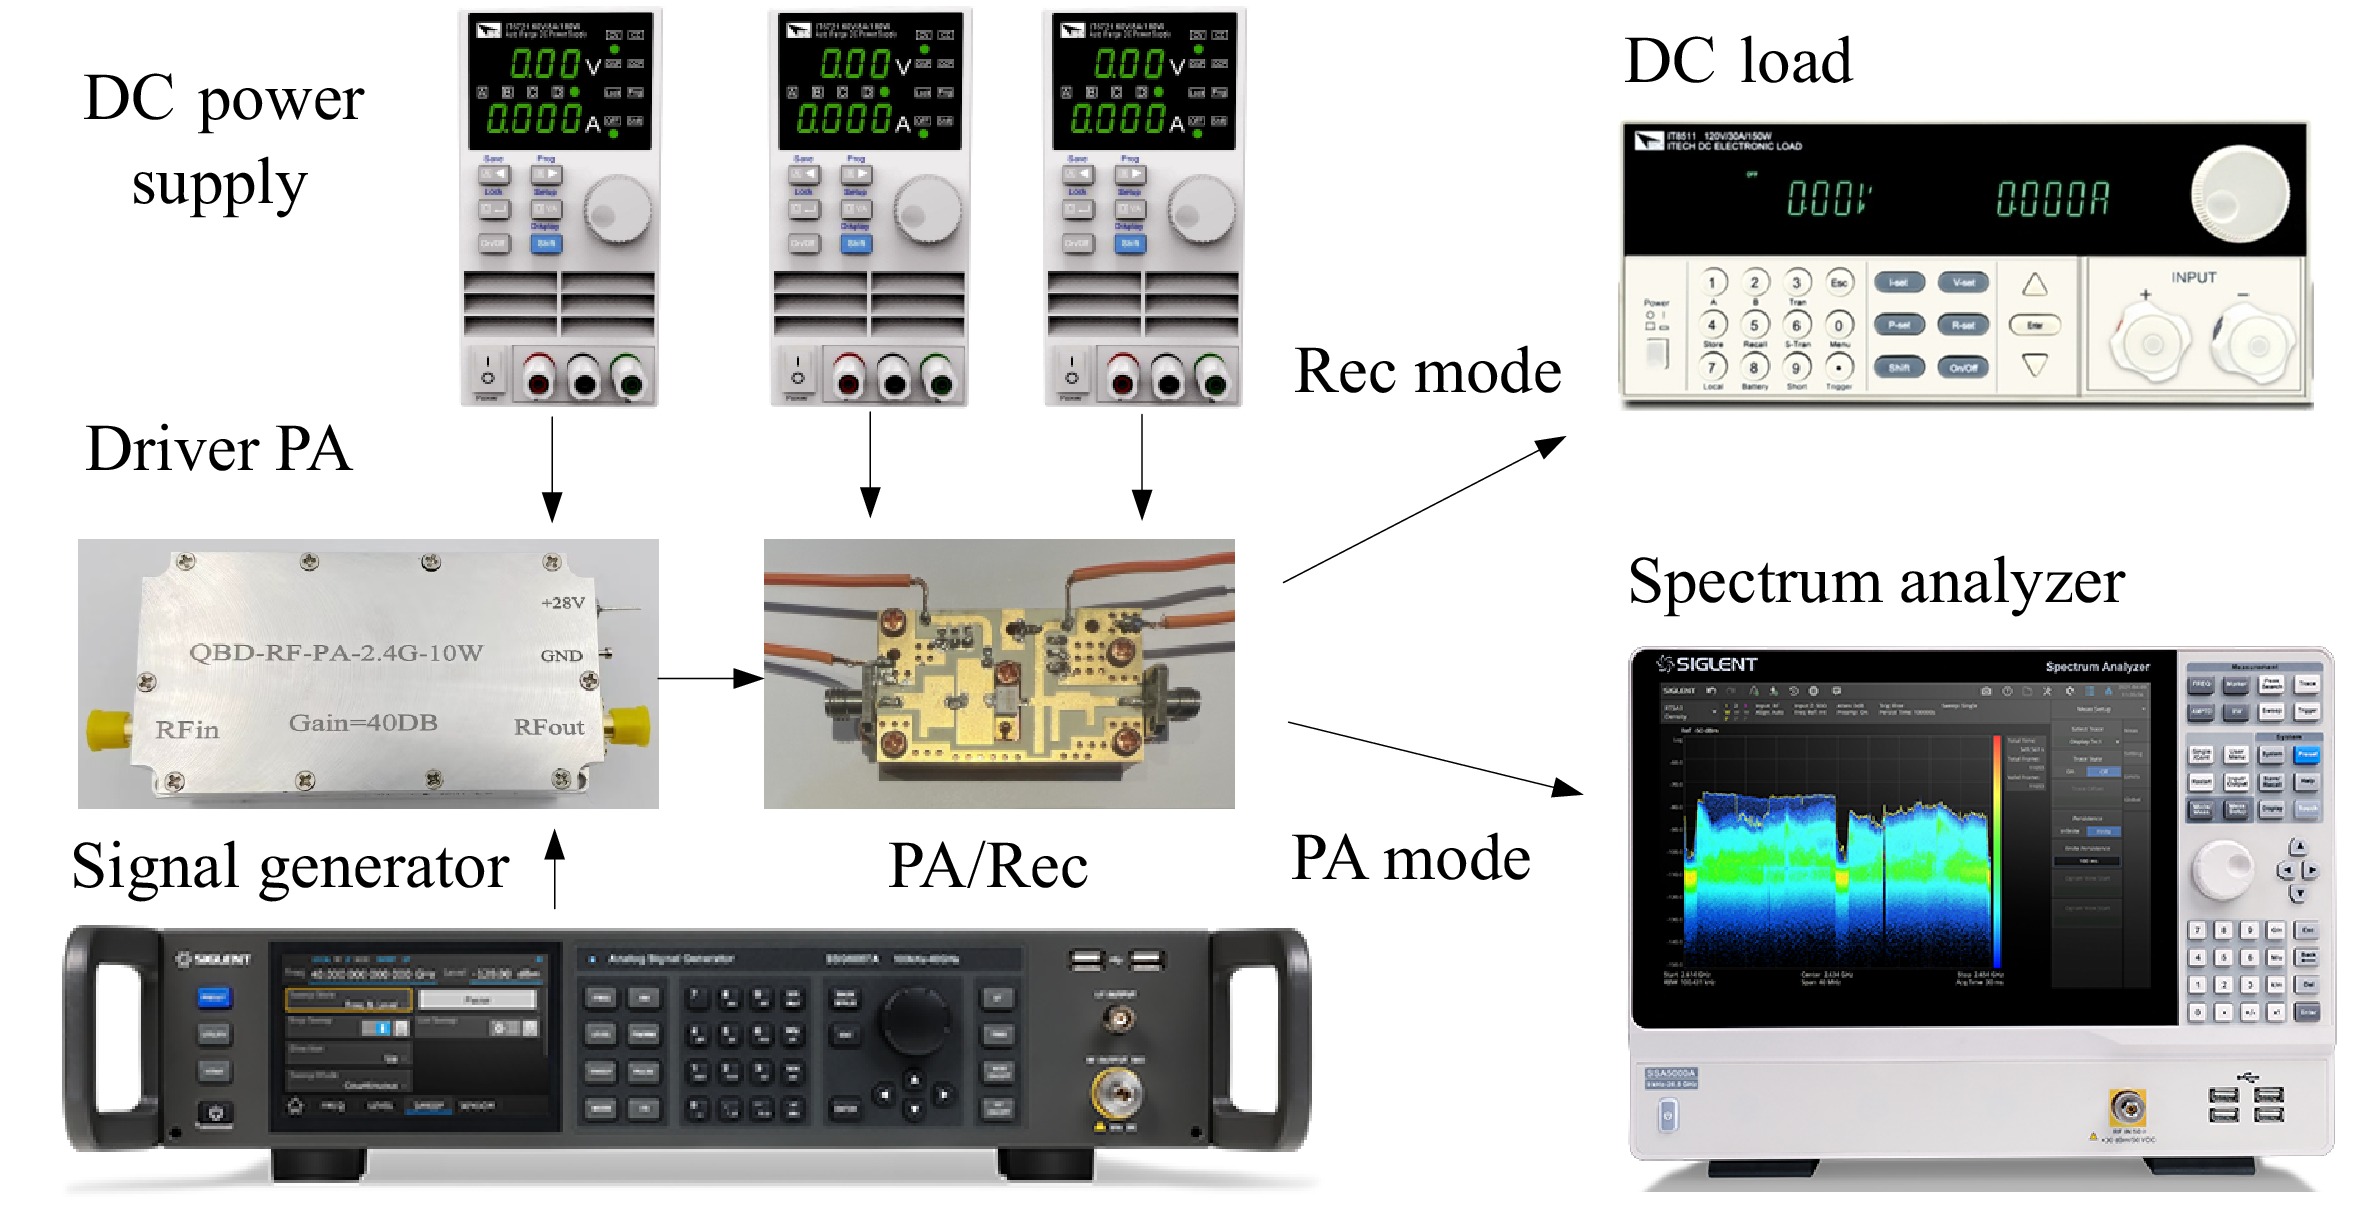
Figure 13.
Experimental setup for evaluating bidirectional system performance.
-
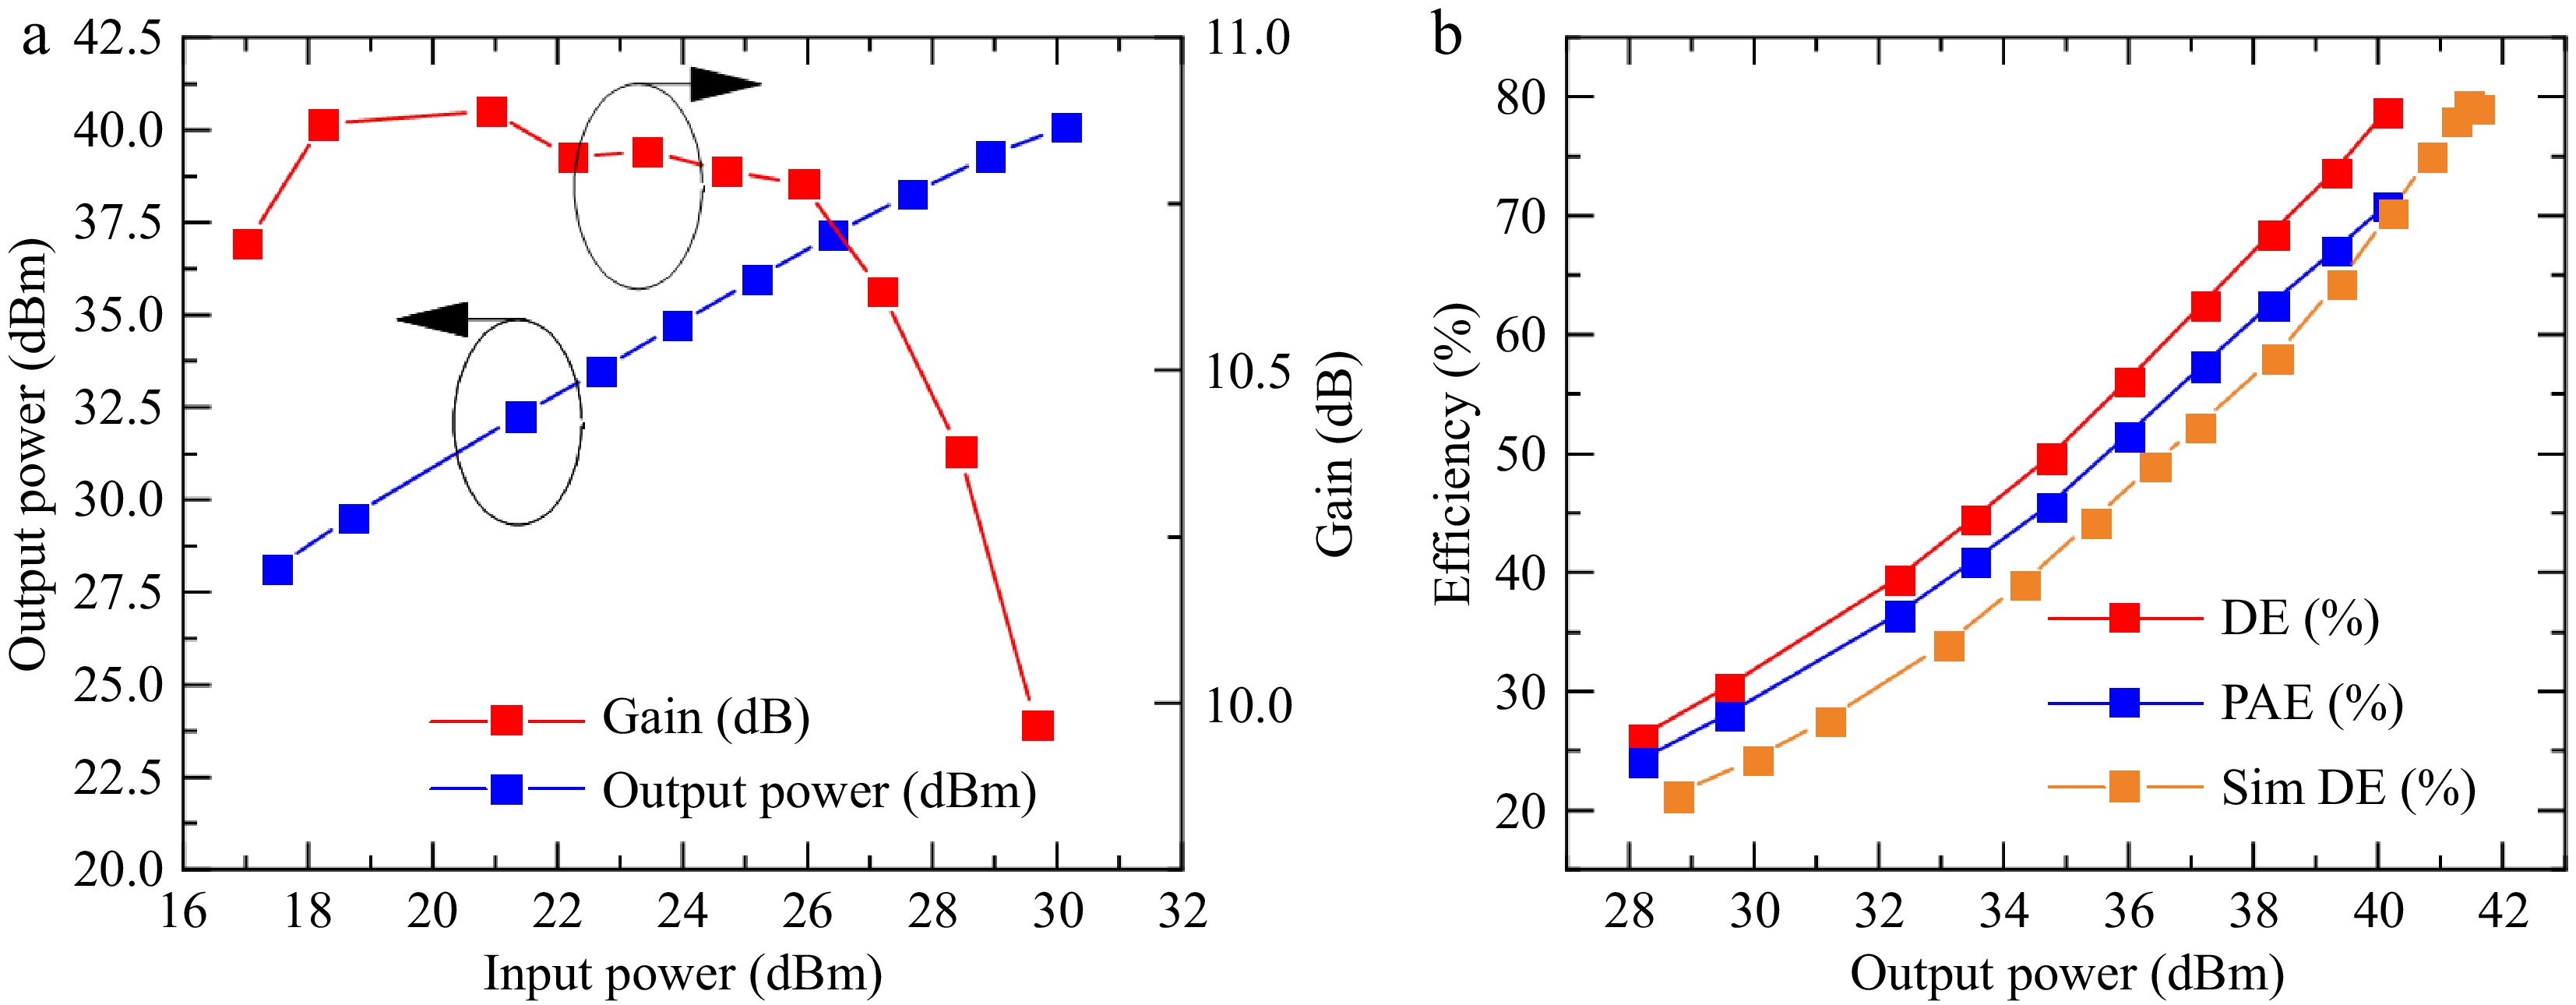
Figure 14.
Measured PA performance. (a) Output power and gain. (b) Drain efficiency and power-added efficiency.
-
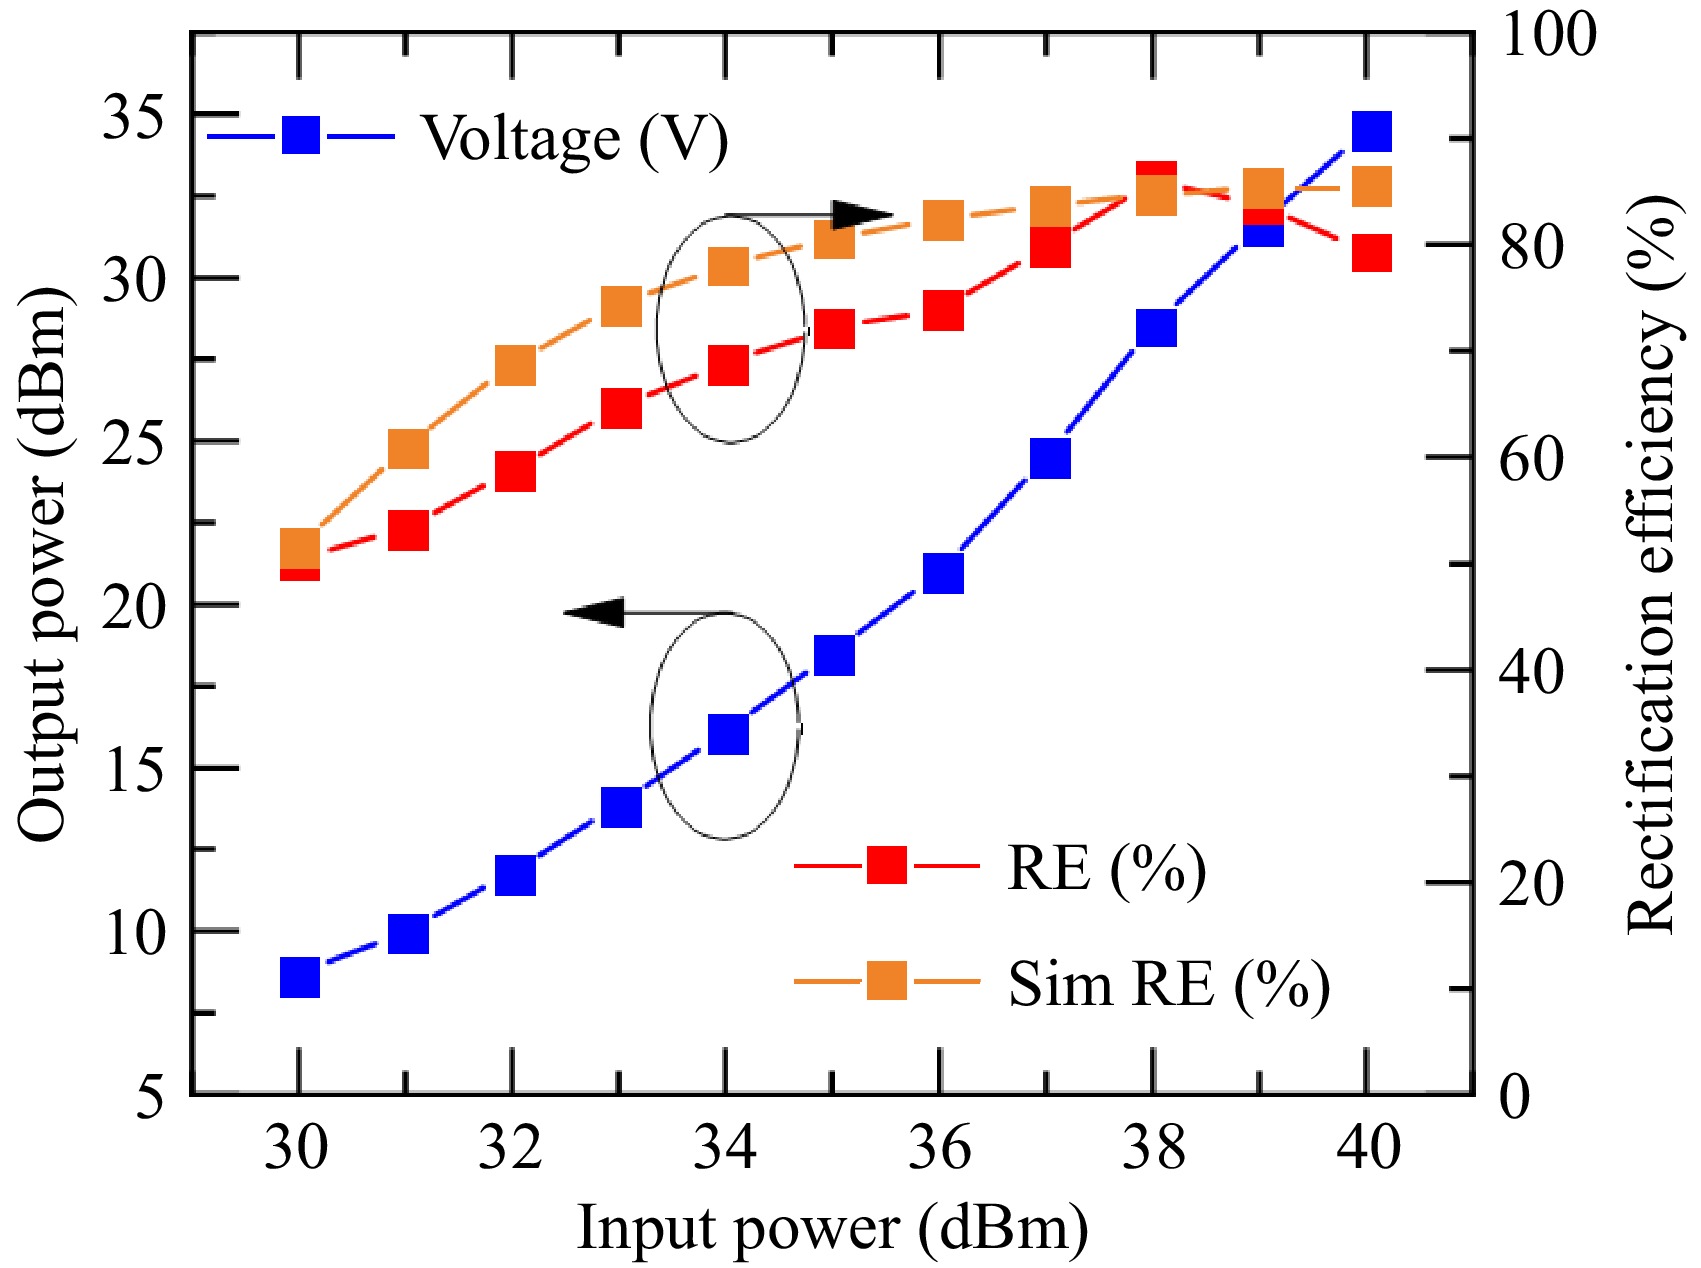
Figure 15.
Measured rectifier performance vs input power.
-
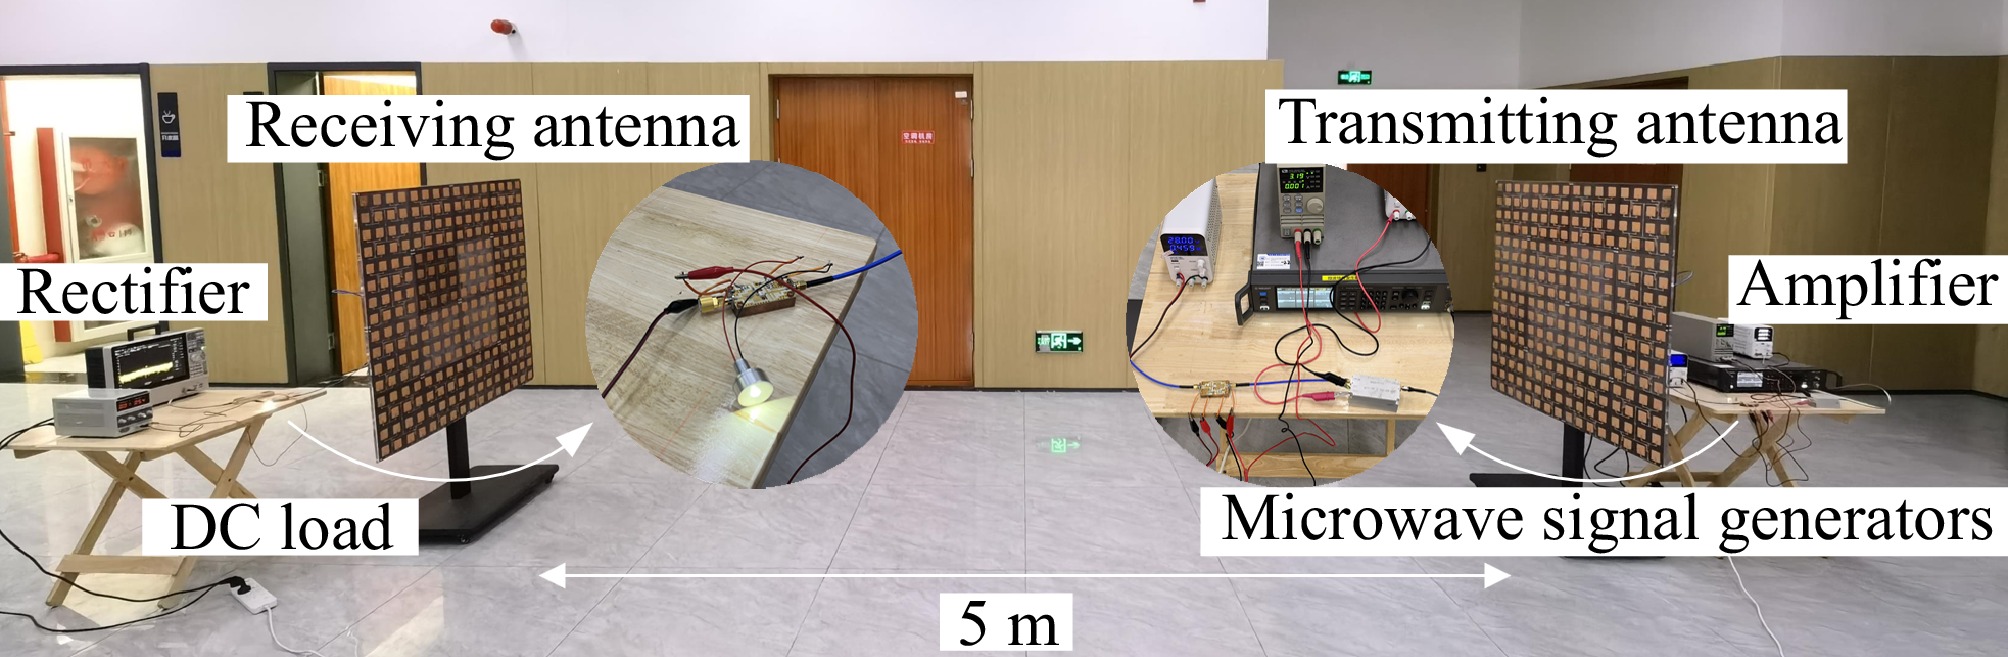
Figure 16.
Scaled-down prototype with bidirectional power transmission at a distance of 5 m.
-
Variables Unit (mm) Variables Unit (mm) D1 268.0 W1 1.7 D2 37.4 W2 2.5 D3 63.8 W3 3.2 D4 65.5 W4 1.5 D5 131.8 W5 3.2 D6 116.1 W6 4.0 Table 1.
Dimensions of the antenna unit
-
PA
modeRectifier
modeFrequency
(GHz)Power
(dBm)Gain
(dB)DE
(%)RE
(%)Ref. Yes No 2.6 40 12 76 NA [14] No Yes 2.85 40 NA NA 84.94 [18] No Yes 1.85 40 NA NA 83.6 [20] No Yes 2.4 15 NA NA 82.2 [21] No Yes 2.45 31 NA NA 81.3 [22] Yes No 2.6 41.4 10.7 74.7 NA [23] Yes No 1.6 42.5 12.5 82 NA [24] Yes No 2.4 27.4 11.2 82 NA [25] Yes Yes 2.45 40.1 10.1 78.68 85.95 This work Table 2.
Benchmarking performance of power amplifiers and rectifiers.
Figures
(16)
Tables
(2)