-
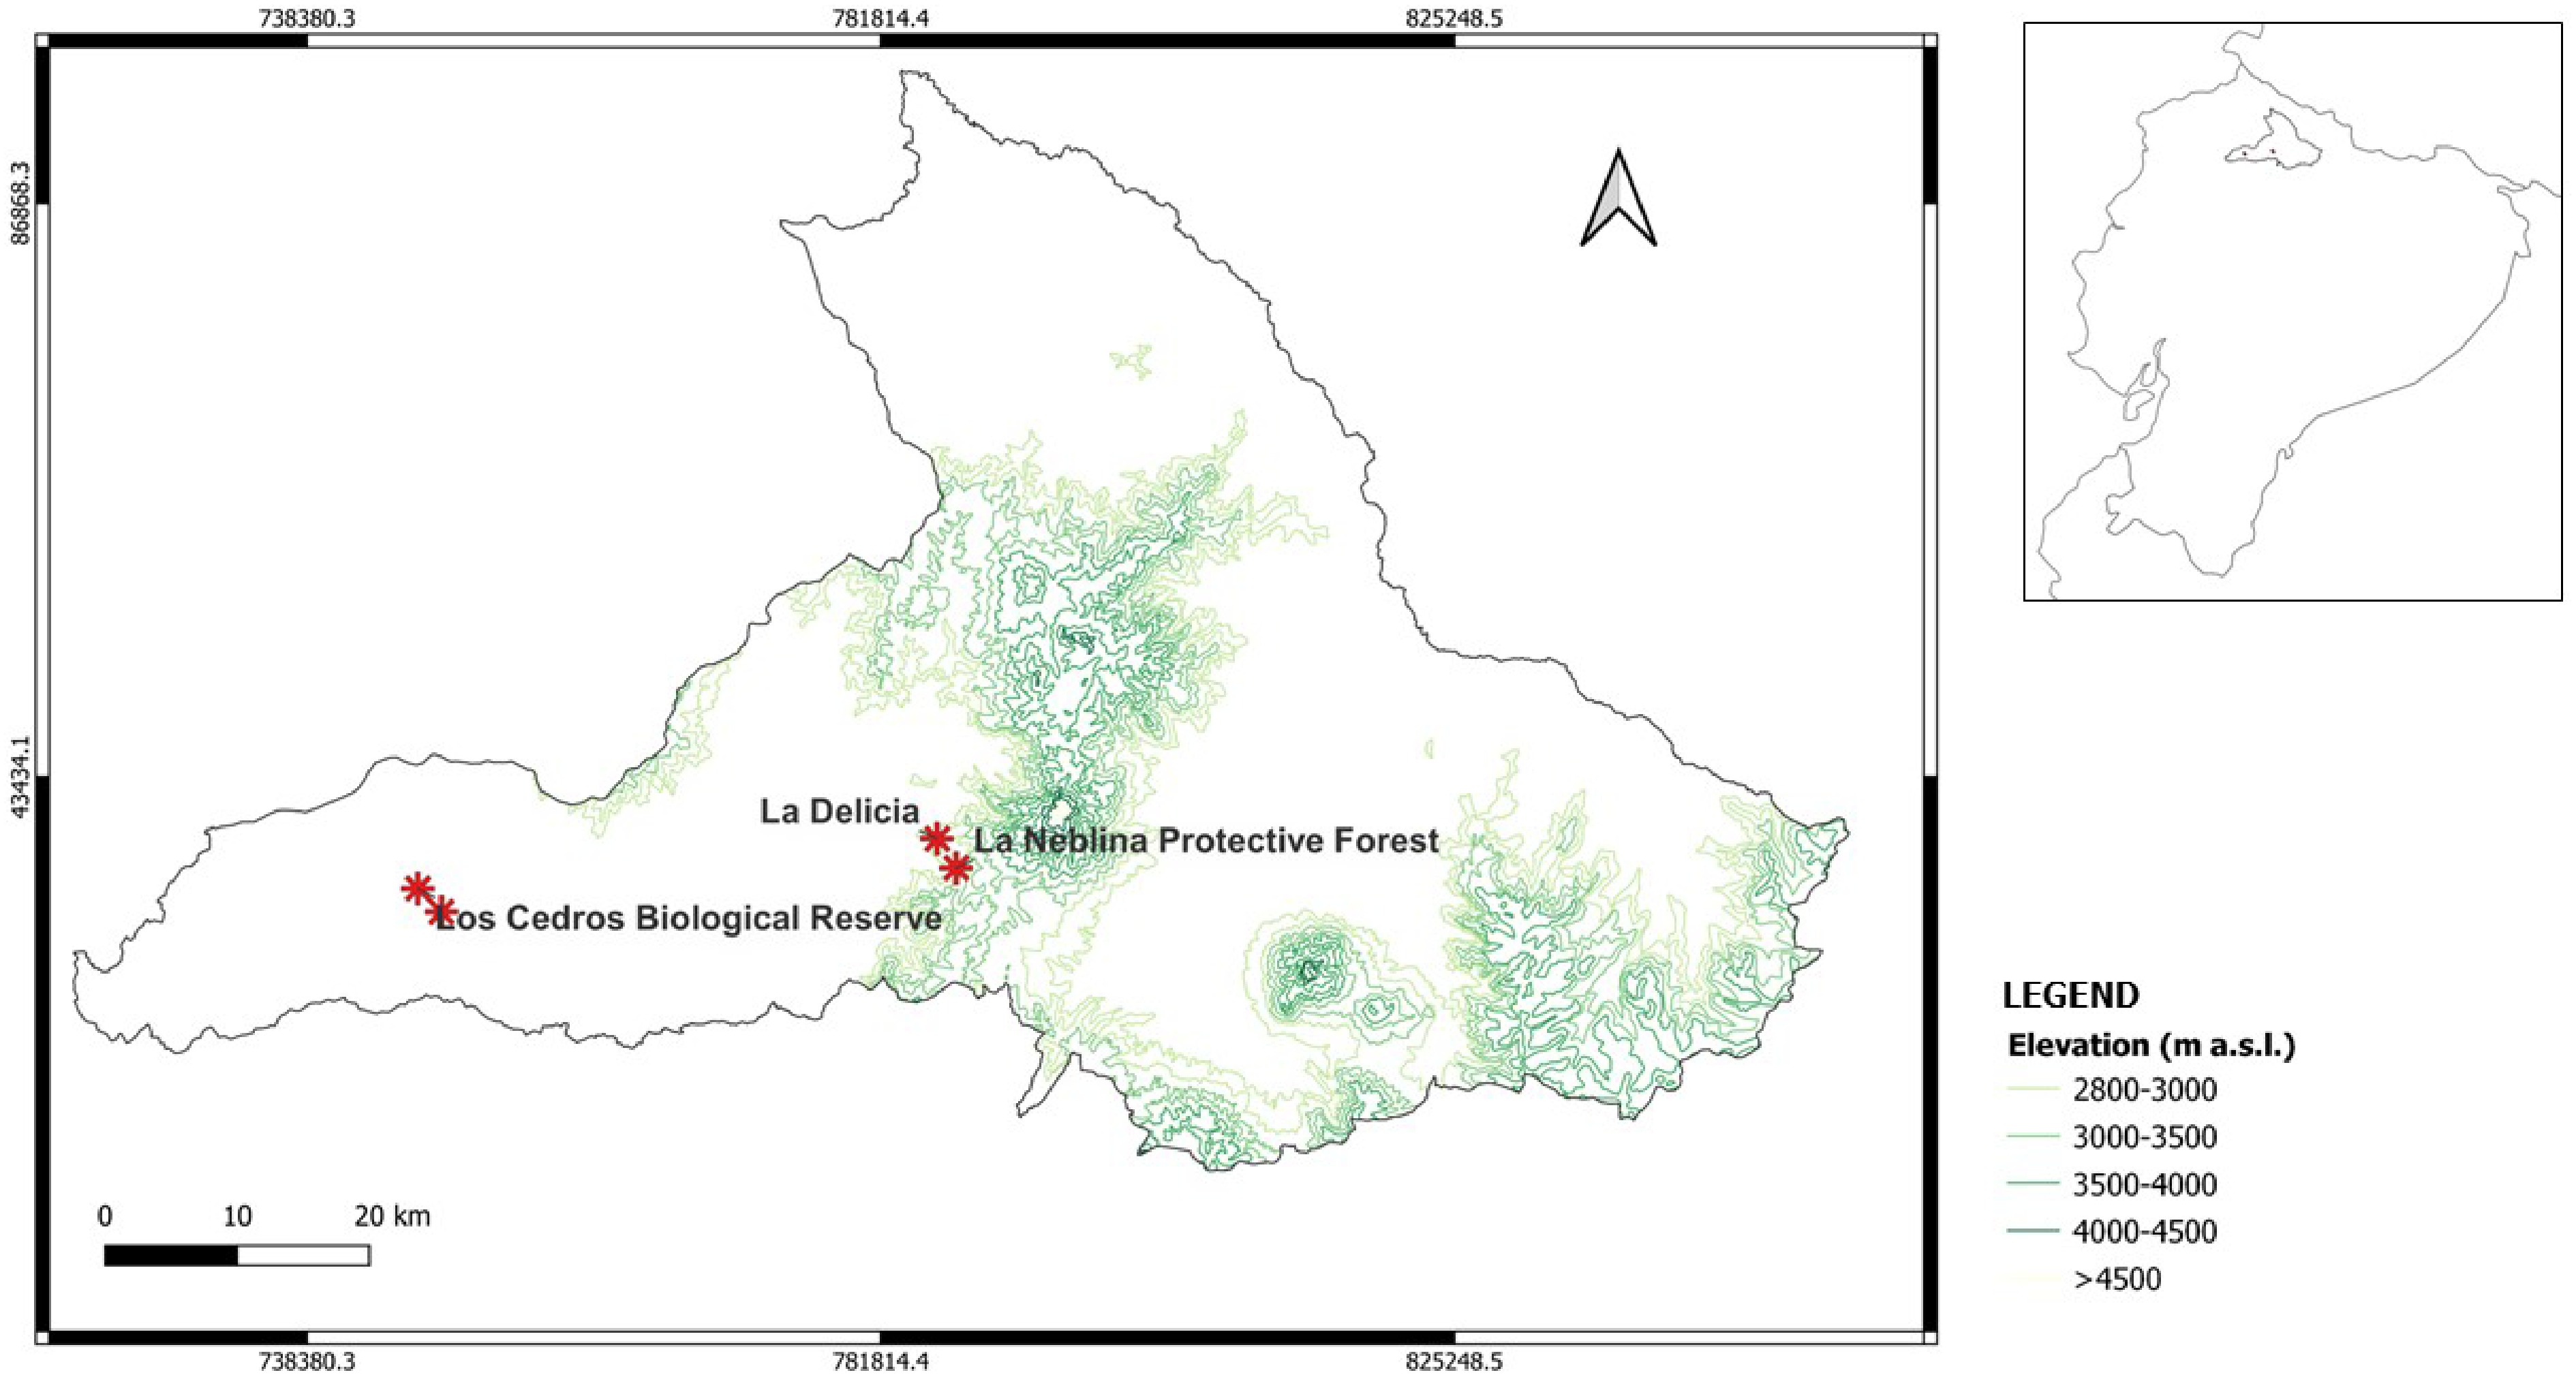
Figure 1.
Site description of sampling points. Los Cedros Biological Reserve, La Delicia, and La Neblina Protective Forest; around 1,500, 2,000, 2,500, and 3,000 m a.s.l., respectively.
-
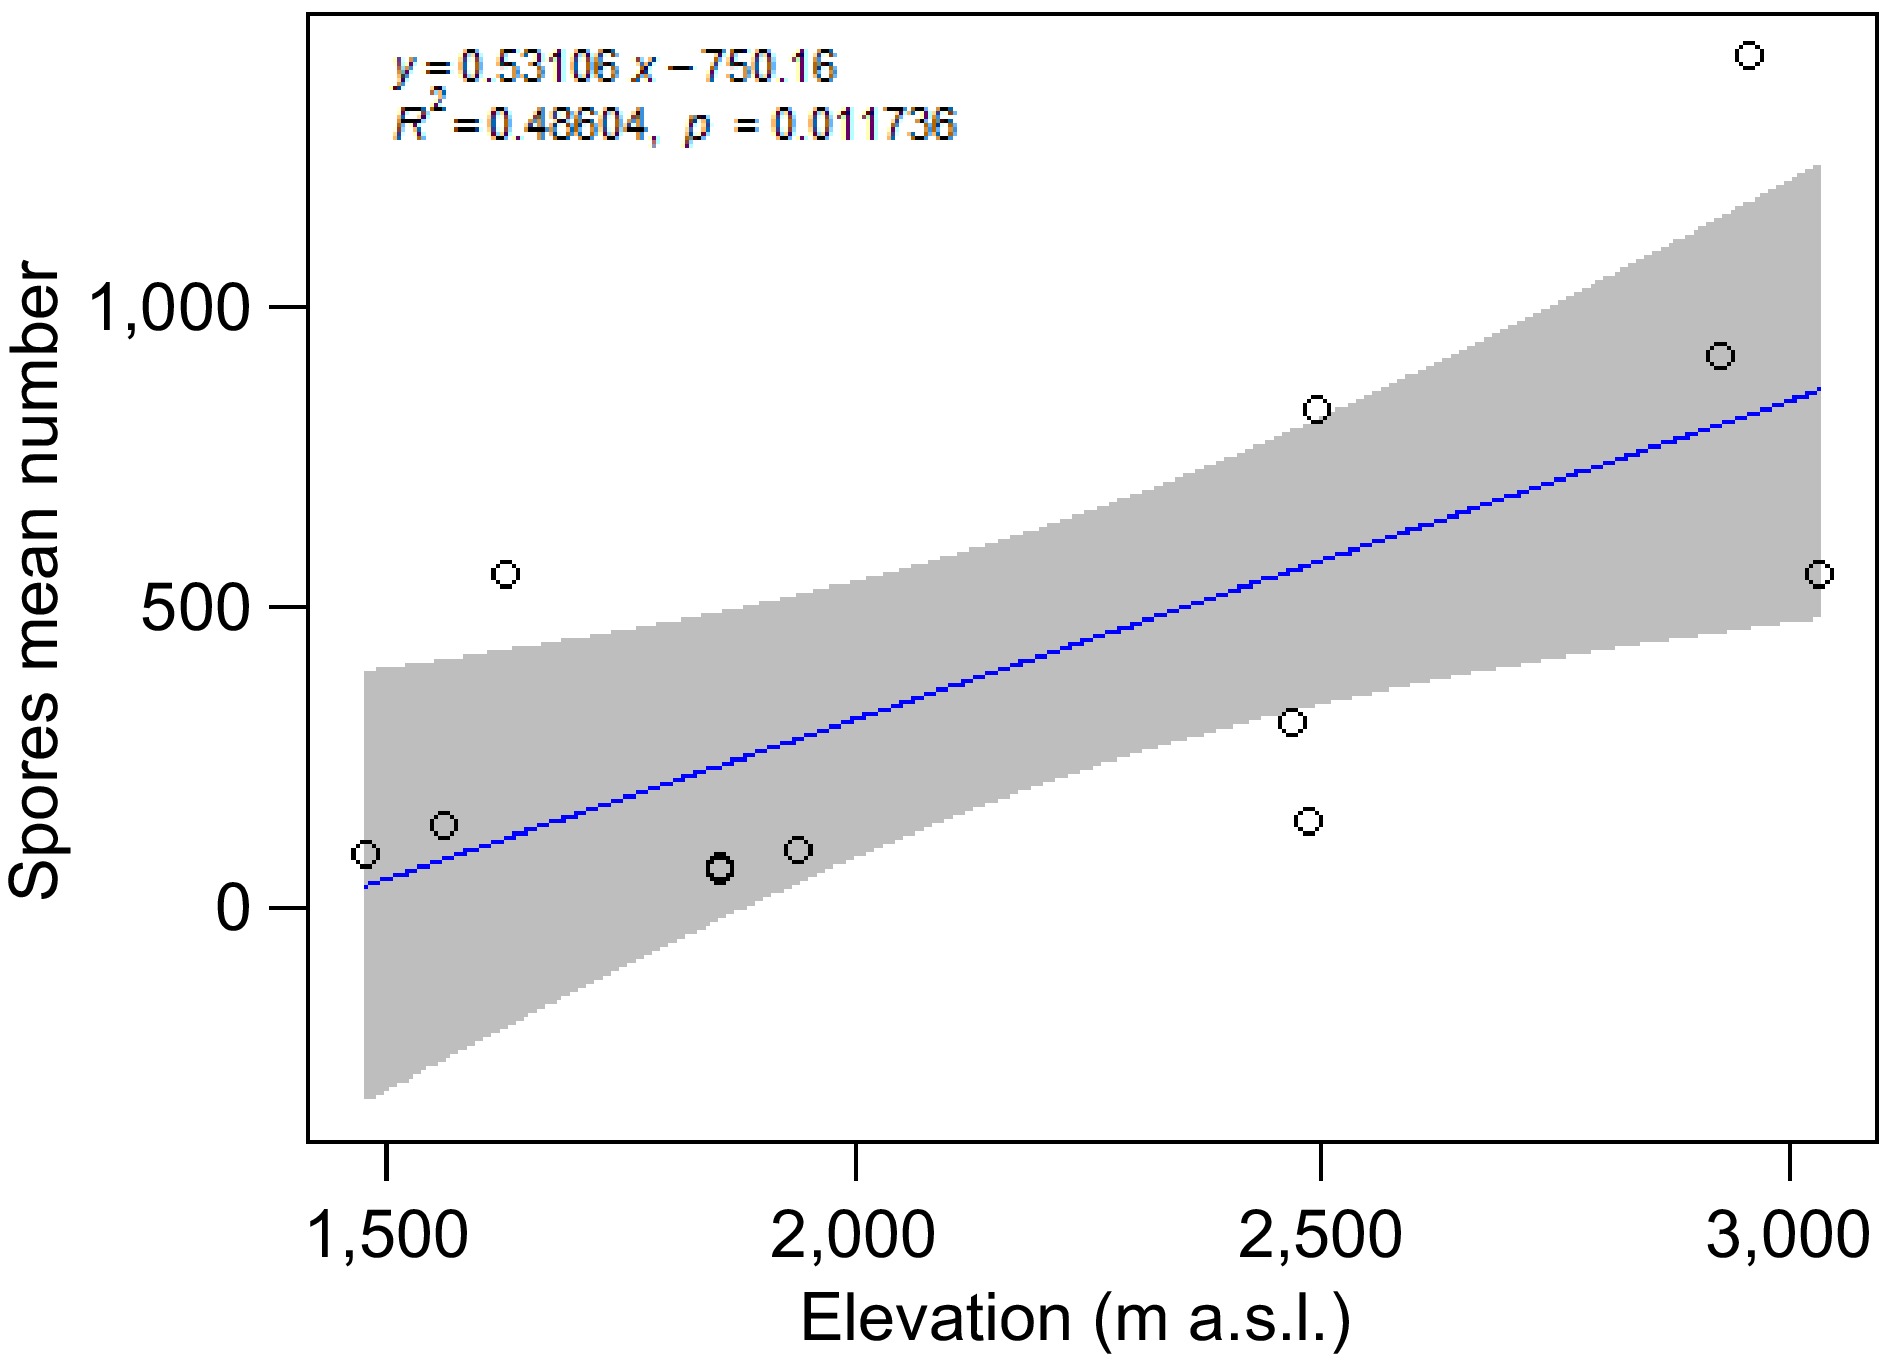
Figure 2.
Linear regression correlating spore mean number with elevation, from the rhizosphere of Cedrela montana roots. The regression line (blue) shows a positive trend, with the shaded gray area around the line representing the 95% confidence interval (the equation of the regression line is displayed at the top of the graph).
-
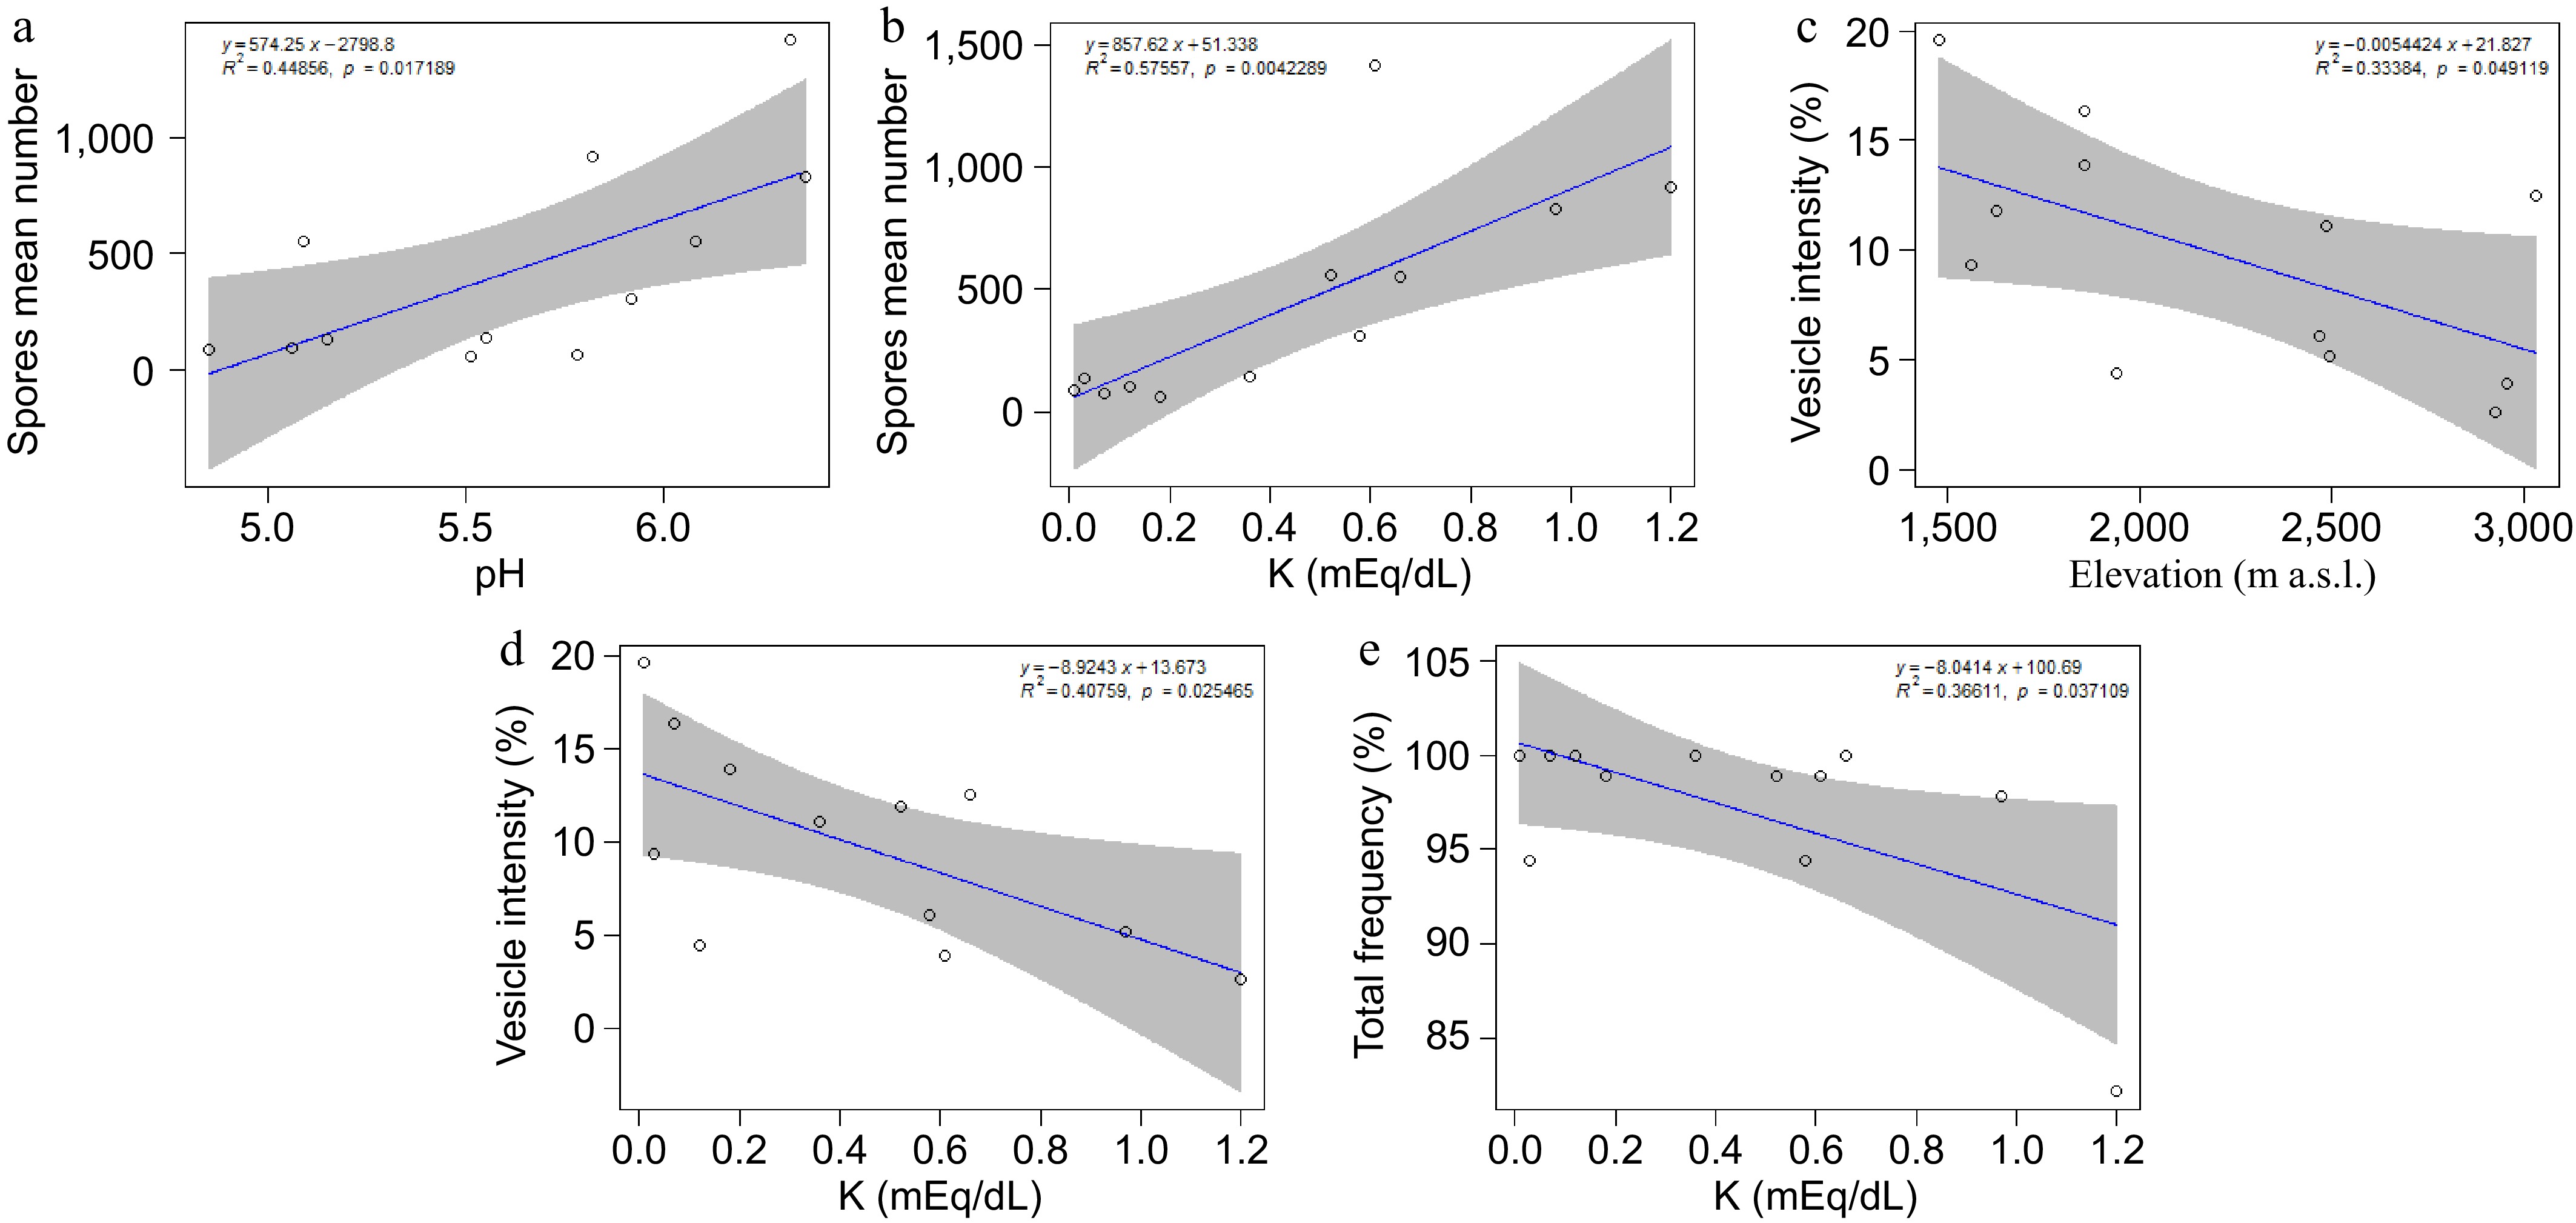
Figure 3.
Linear regressions with positive trends: (a) spore mean number with pH, and (b) spore mean number with K. Negative trends are observed for (c) vesicle intensity with elevation, (d) vesicle intensity with K, and (e) total frequency with K, from the rhizosphere of Cedrela montana. Regression lines (blue) are shown with shaded gray areas representing 95% confidence intervals (the equation of the regression line is displayed at the top of the graph).
-
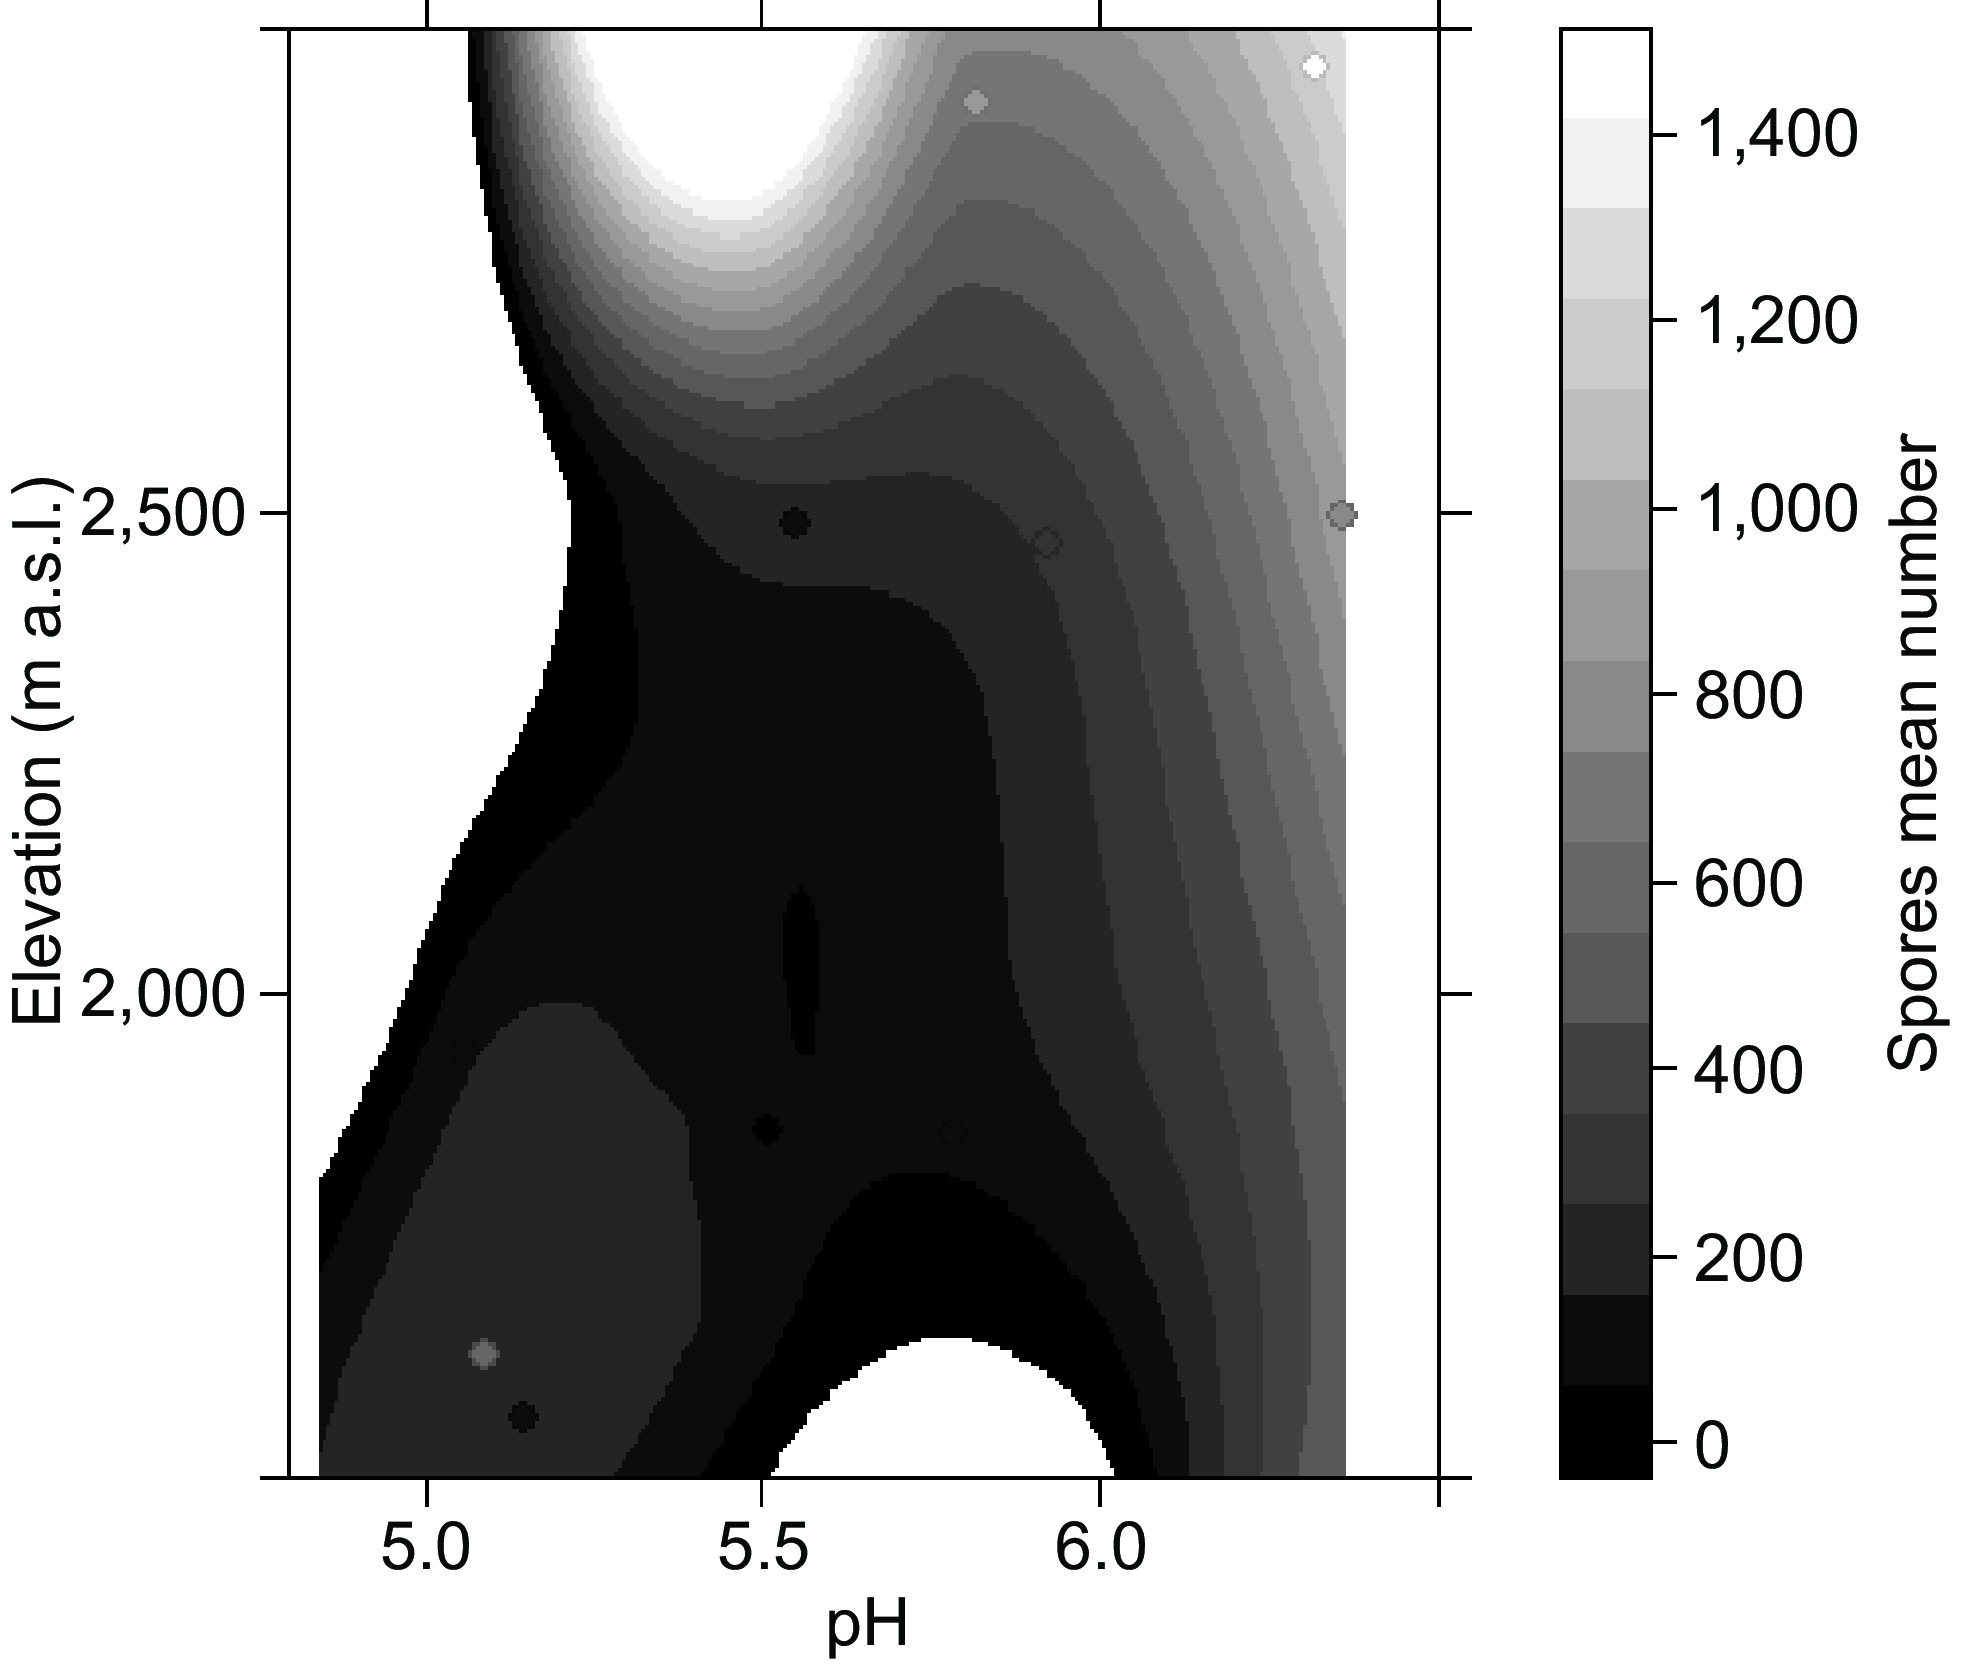
Figure 4.
Plot-level graphs showing the relationship between elevation and pH with spore mean number. The trend suggests that the abundance of spores tends to increase in the rhizosphere of trees located in highlands at pH of 6−7.
-
Spore mean number R2 E p Elevation 0.486 0.9152 0.0117 * SOM 0.105 −81.34 0.305 N 0.137 12.112 0.237 K 0.591 1140.8 0.004 ** P 0.003 −6.692 0.875 pH 0.678 926.8 0.0001*** R2: proportion of variance explained; E: estimated effect size; p: p-value indicating statistical significance (* p < 0.05; ** p < 0.01; *** p < 0.001). Table 1.
Statistical summary of the general linear model results for spore mean number, from the rhizosphere of 12 sampled trees of Cedrela montana, and elevation, SOM, N, K, P, and pH.
-
Total frequency Total intensity Arbuscule intensity Vesicle intensity Hypha intensity R2 E p R2 E p R2 E p R2 E p R2 E p Ele 0.117 −0.003 0.277 0.069 −0.003 0.412 0.085 −0.0003 0.358 0.341 −0.007 0.046* 0.008 −0.001 0.782 SOM 0.11 0.747 0.292 0.041 −0.468 0.526 0.001 0.003 0.940 0.060 −0.581 0.441 0.046 −0.523 0.500 N 0.024 −0.041 0.658 0.024 −0.047 0.625 0.003 −0.001 0.851 0.070 −0.082 0.403 0.009 −0.030 0.762 K 0.366 −8.041 0.037* 0.243 −6.713 0.103 0.253 −0.433 0.095 0.407 −8.924 0.025* 0.136 −5.293 0.237 P 0.041 0.239 0.527 0.308 0.211 0.585 0.022 −0.011 0.641 0.022 0.186 0.641 0.046 0.272 0.503 pH 0.021 −1.477 0.649 0.014 −1.224 0.714 0.172 −0.271 0.179 0.208 −4.840 0.136 0.002 0.500 0.887 R2: proportion of variance explained; E: estimated effect size; p: p-value indicating statistical significance (* p < 0.05). Table 2.
Statistical summary of the general linear model results for total frequency, total intensity, arbuscule intensity, vesicle intensity, and hypha intensity from the rhizosphere of 12 sampled trees of Cedrela montana, and elevation (Ele), SOM, N, K, P, and pH.
Figures
(4)
Tables
(2)