-
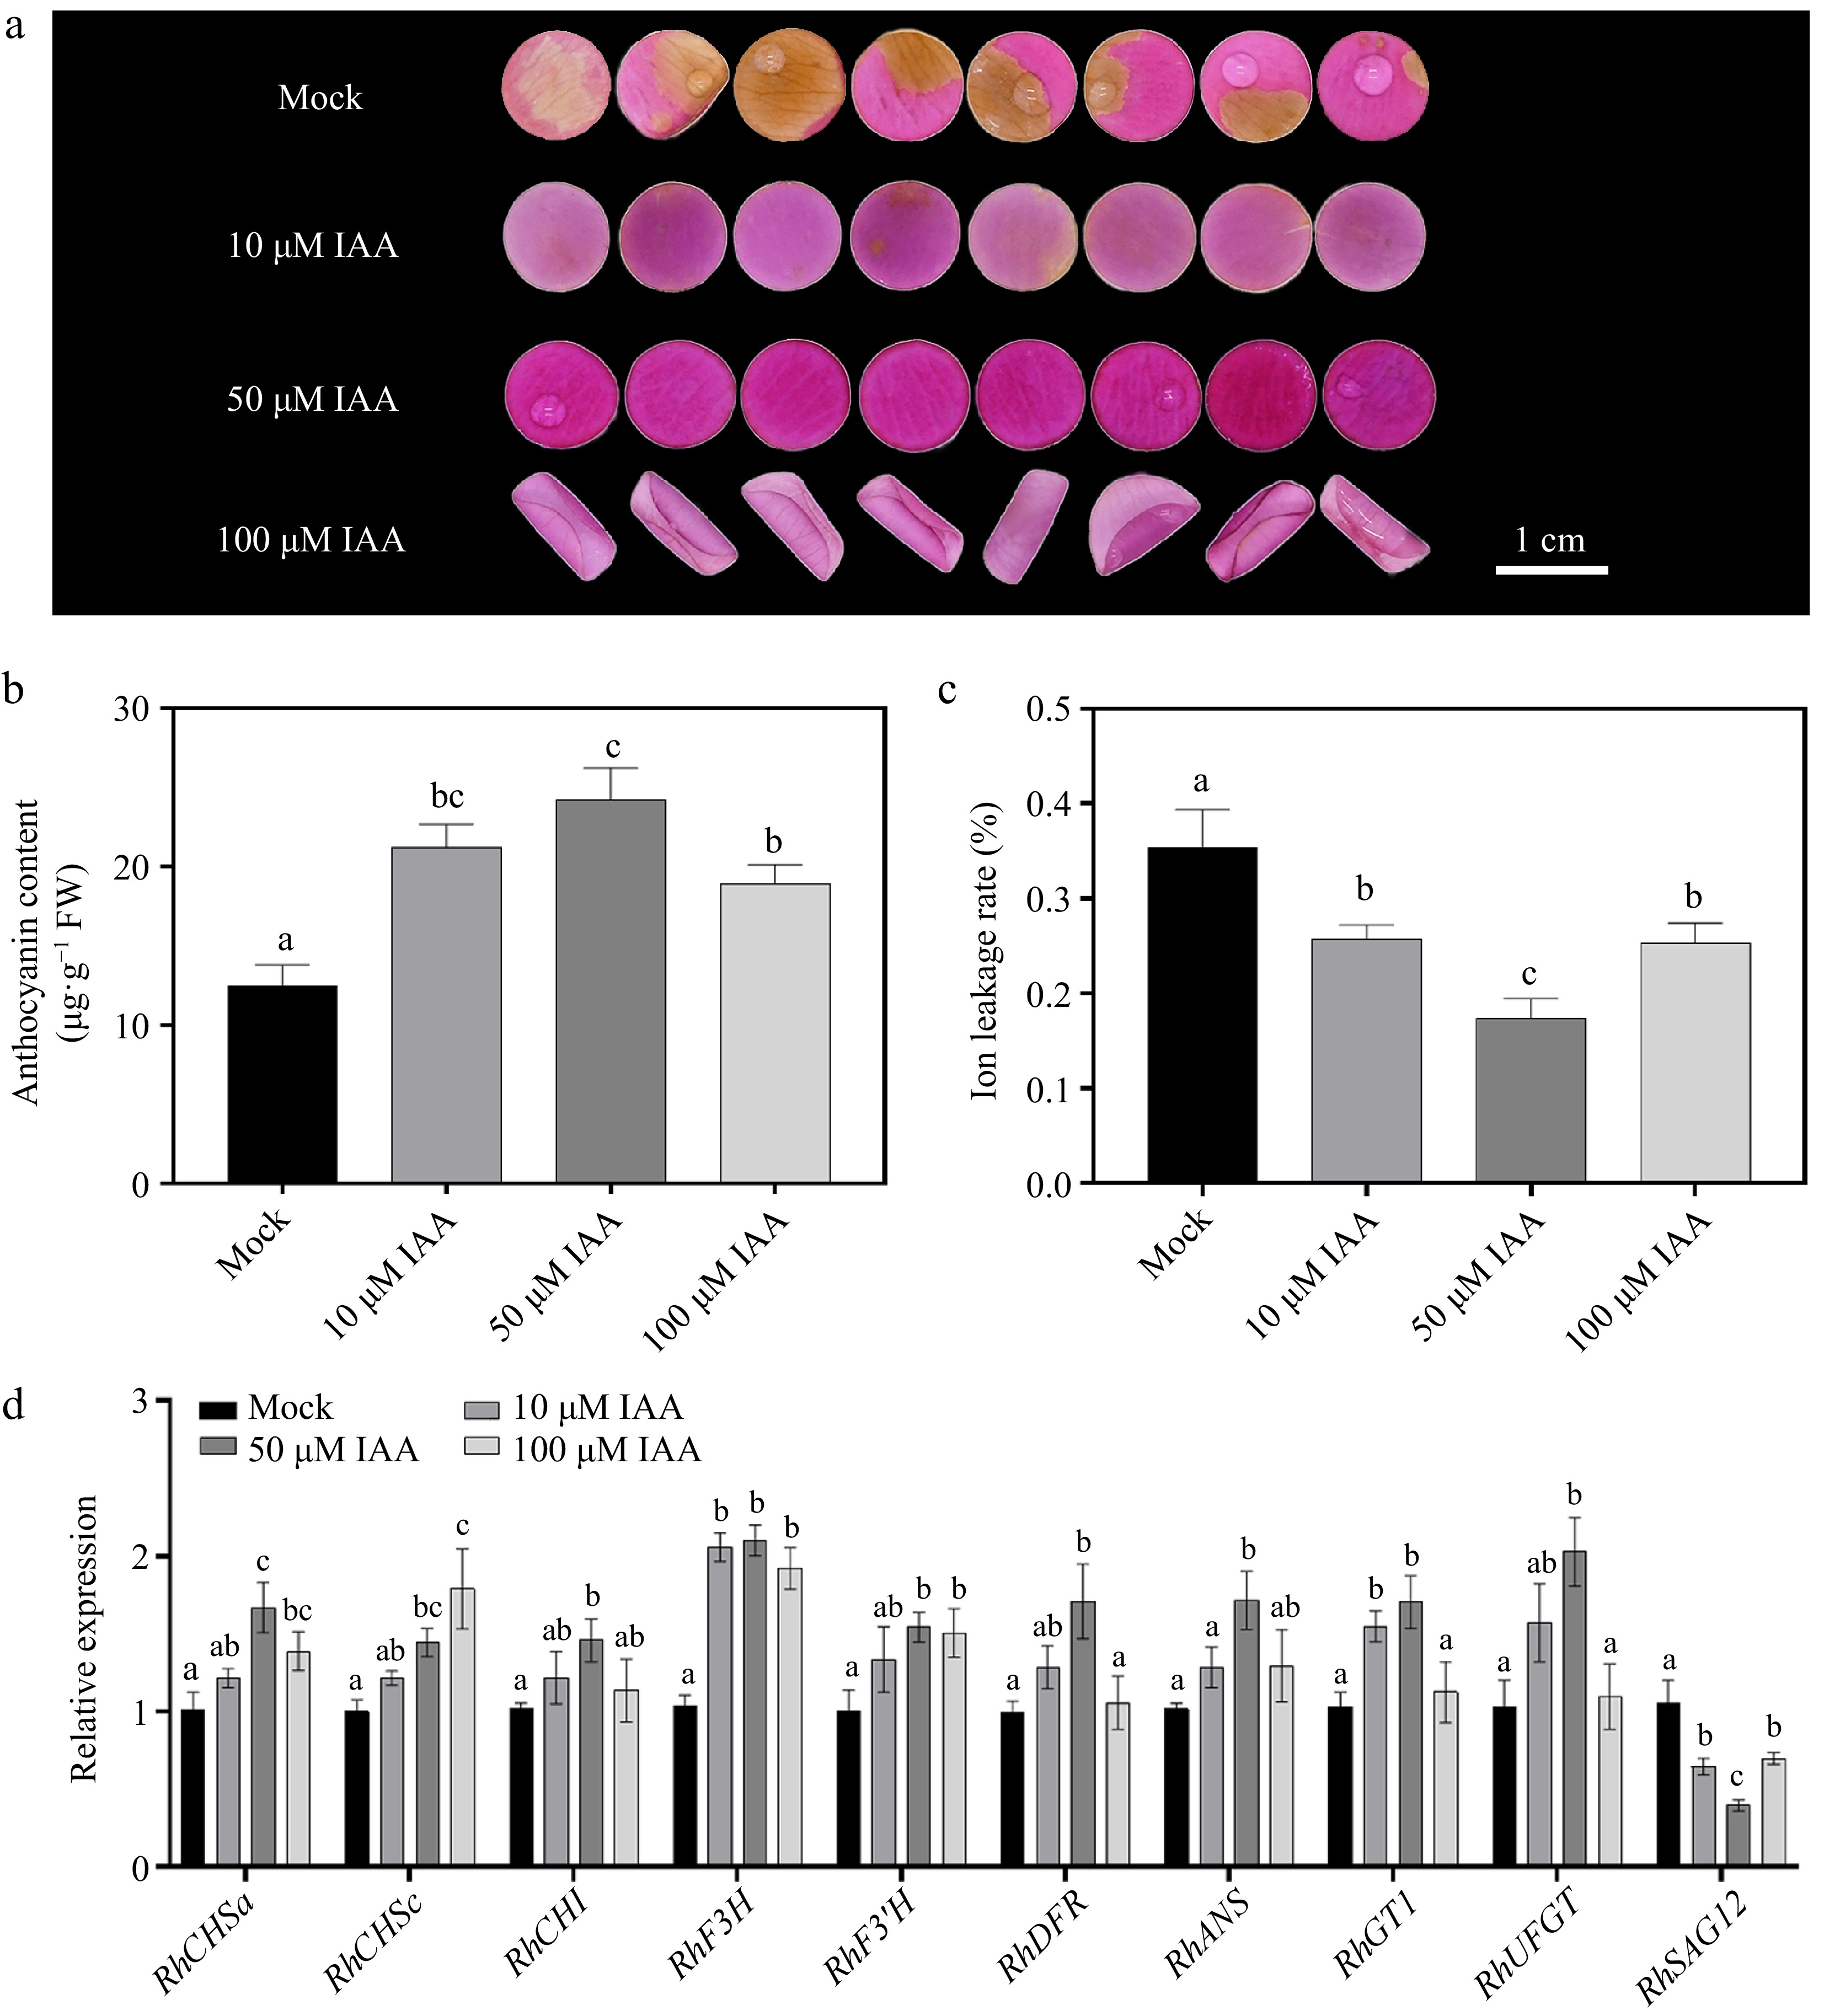
Figure 1.
Effects of different concentrations of indole-3-acetic acid (IAA) on petal phenotype, anthocyanin accumulation, ion leakage rate, and gene expression 12 d after treatment. (a) Phenotypic changes of petals treated with 0 μM (Mock control), 10 μM, 50 μM, and 100 μM IAA. After 12 d of treatment, petal color fading was significantly delayed with increasing IAA concentration, with 50 μM and 100 μM treatments exhibiting darker pigmentation. (b) Comparison of anthocyanin content under different IAA concentrations. (c) Changes in ion leakage rate under different IAA treatments. (d) Relative expression levels of the anthocyanin b iosynthesis-related genes (RhCHSa, RhCHSc, RhCHI, RhDFR, RhF3H, RhF3'H, RhANS, RhGT1, and RhUFGT) and senescence marker gene RhSAG12 under different IAA concentrations. Data are presented as means ± SE. Different letters indicate statistically significant differences (p < 0.05).
-
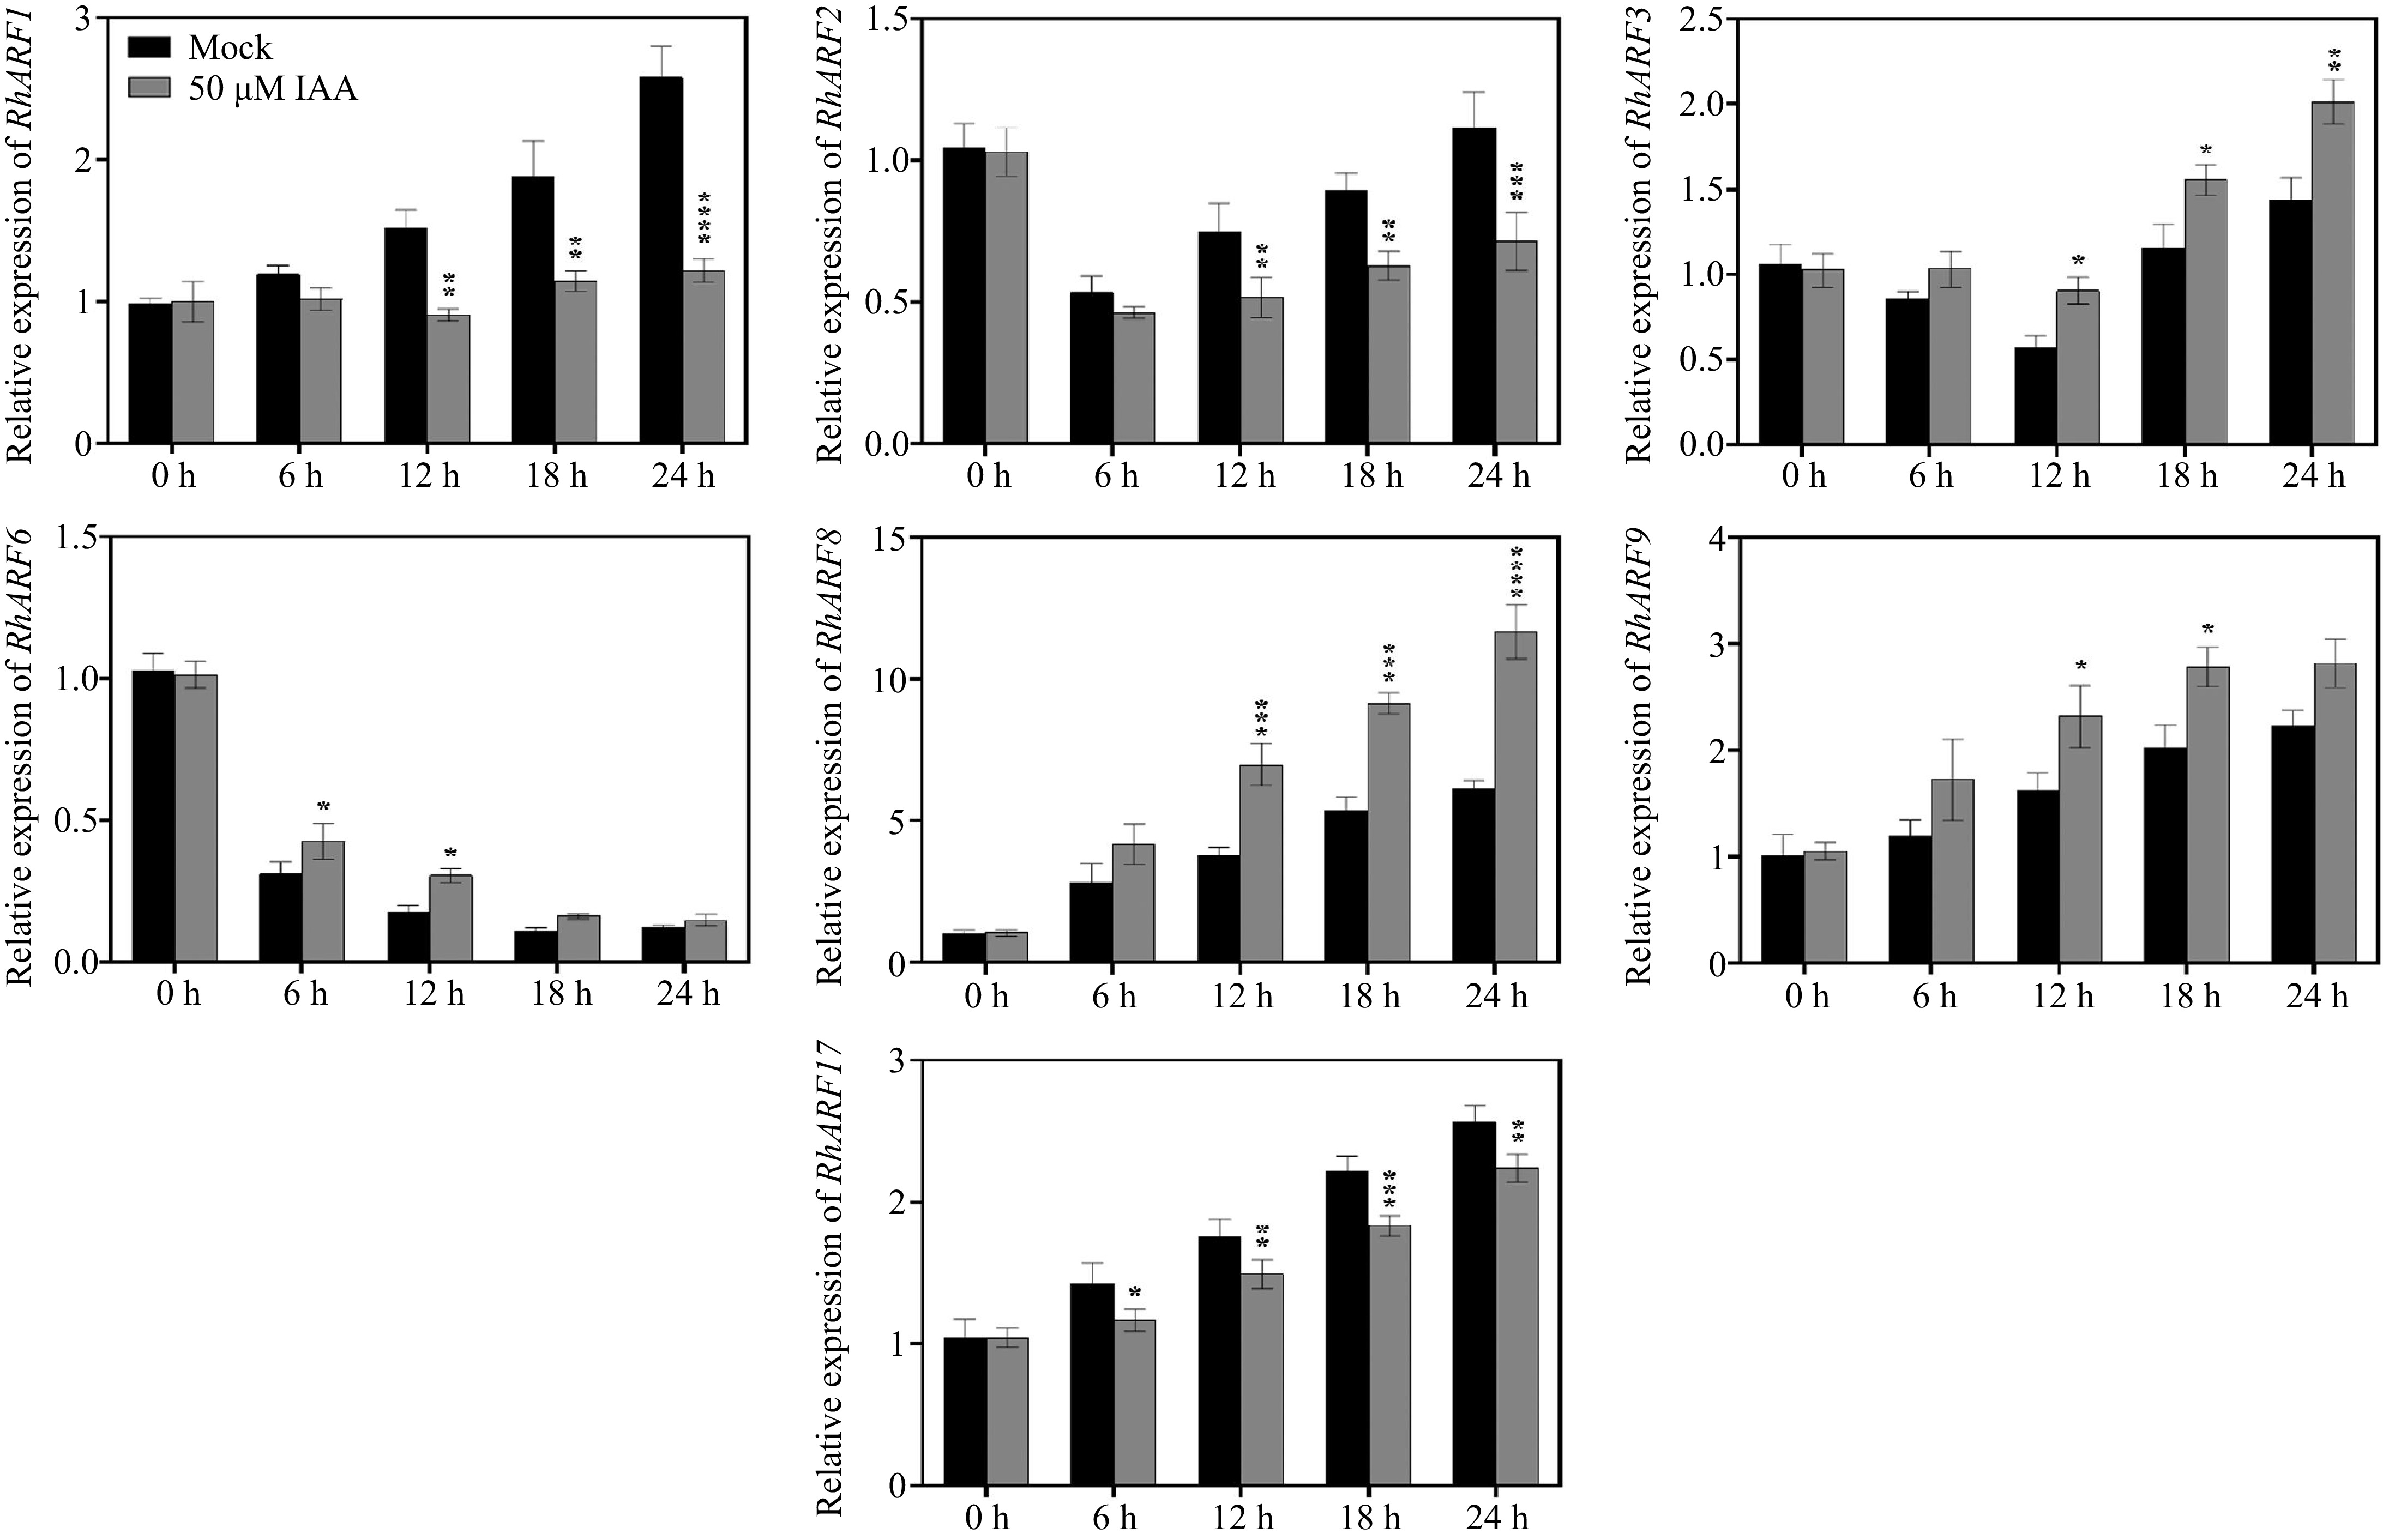
Figure 2.
Temporal expression patterns of ARF genes in petals under different IAA treatments. Petals were treated with 50 μM IAA or Mock control, and sampled at 0, 6, 12, 18, and 24 h to determine the relative expression levels of ARF genes. Asterisks indicate significant differences compared to the Mock control (* p < 0.05, ** p < 0.01, *** p < 0.001, **** p < 0.0001). Data are presented as mean ± SE (n = 3).
-
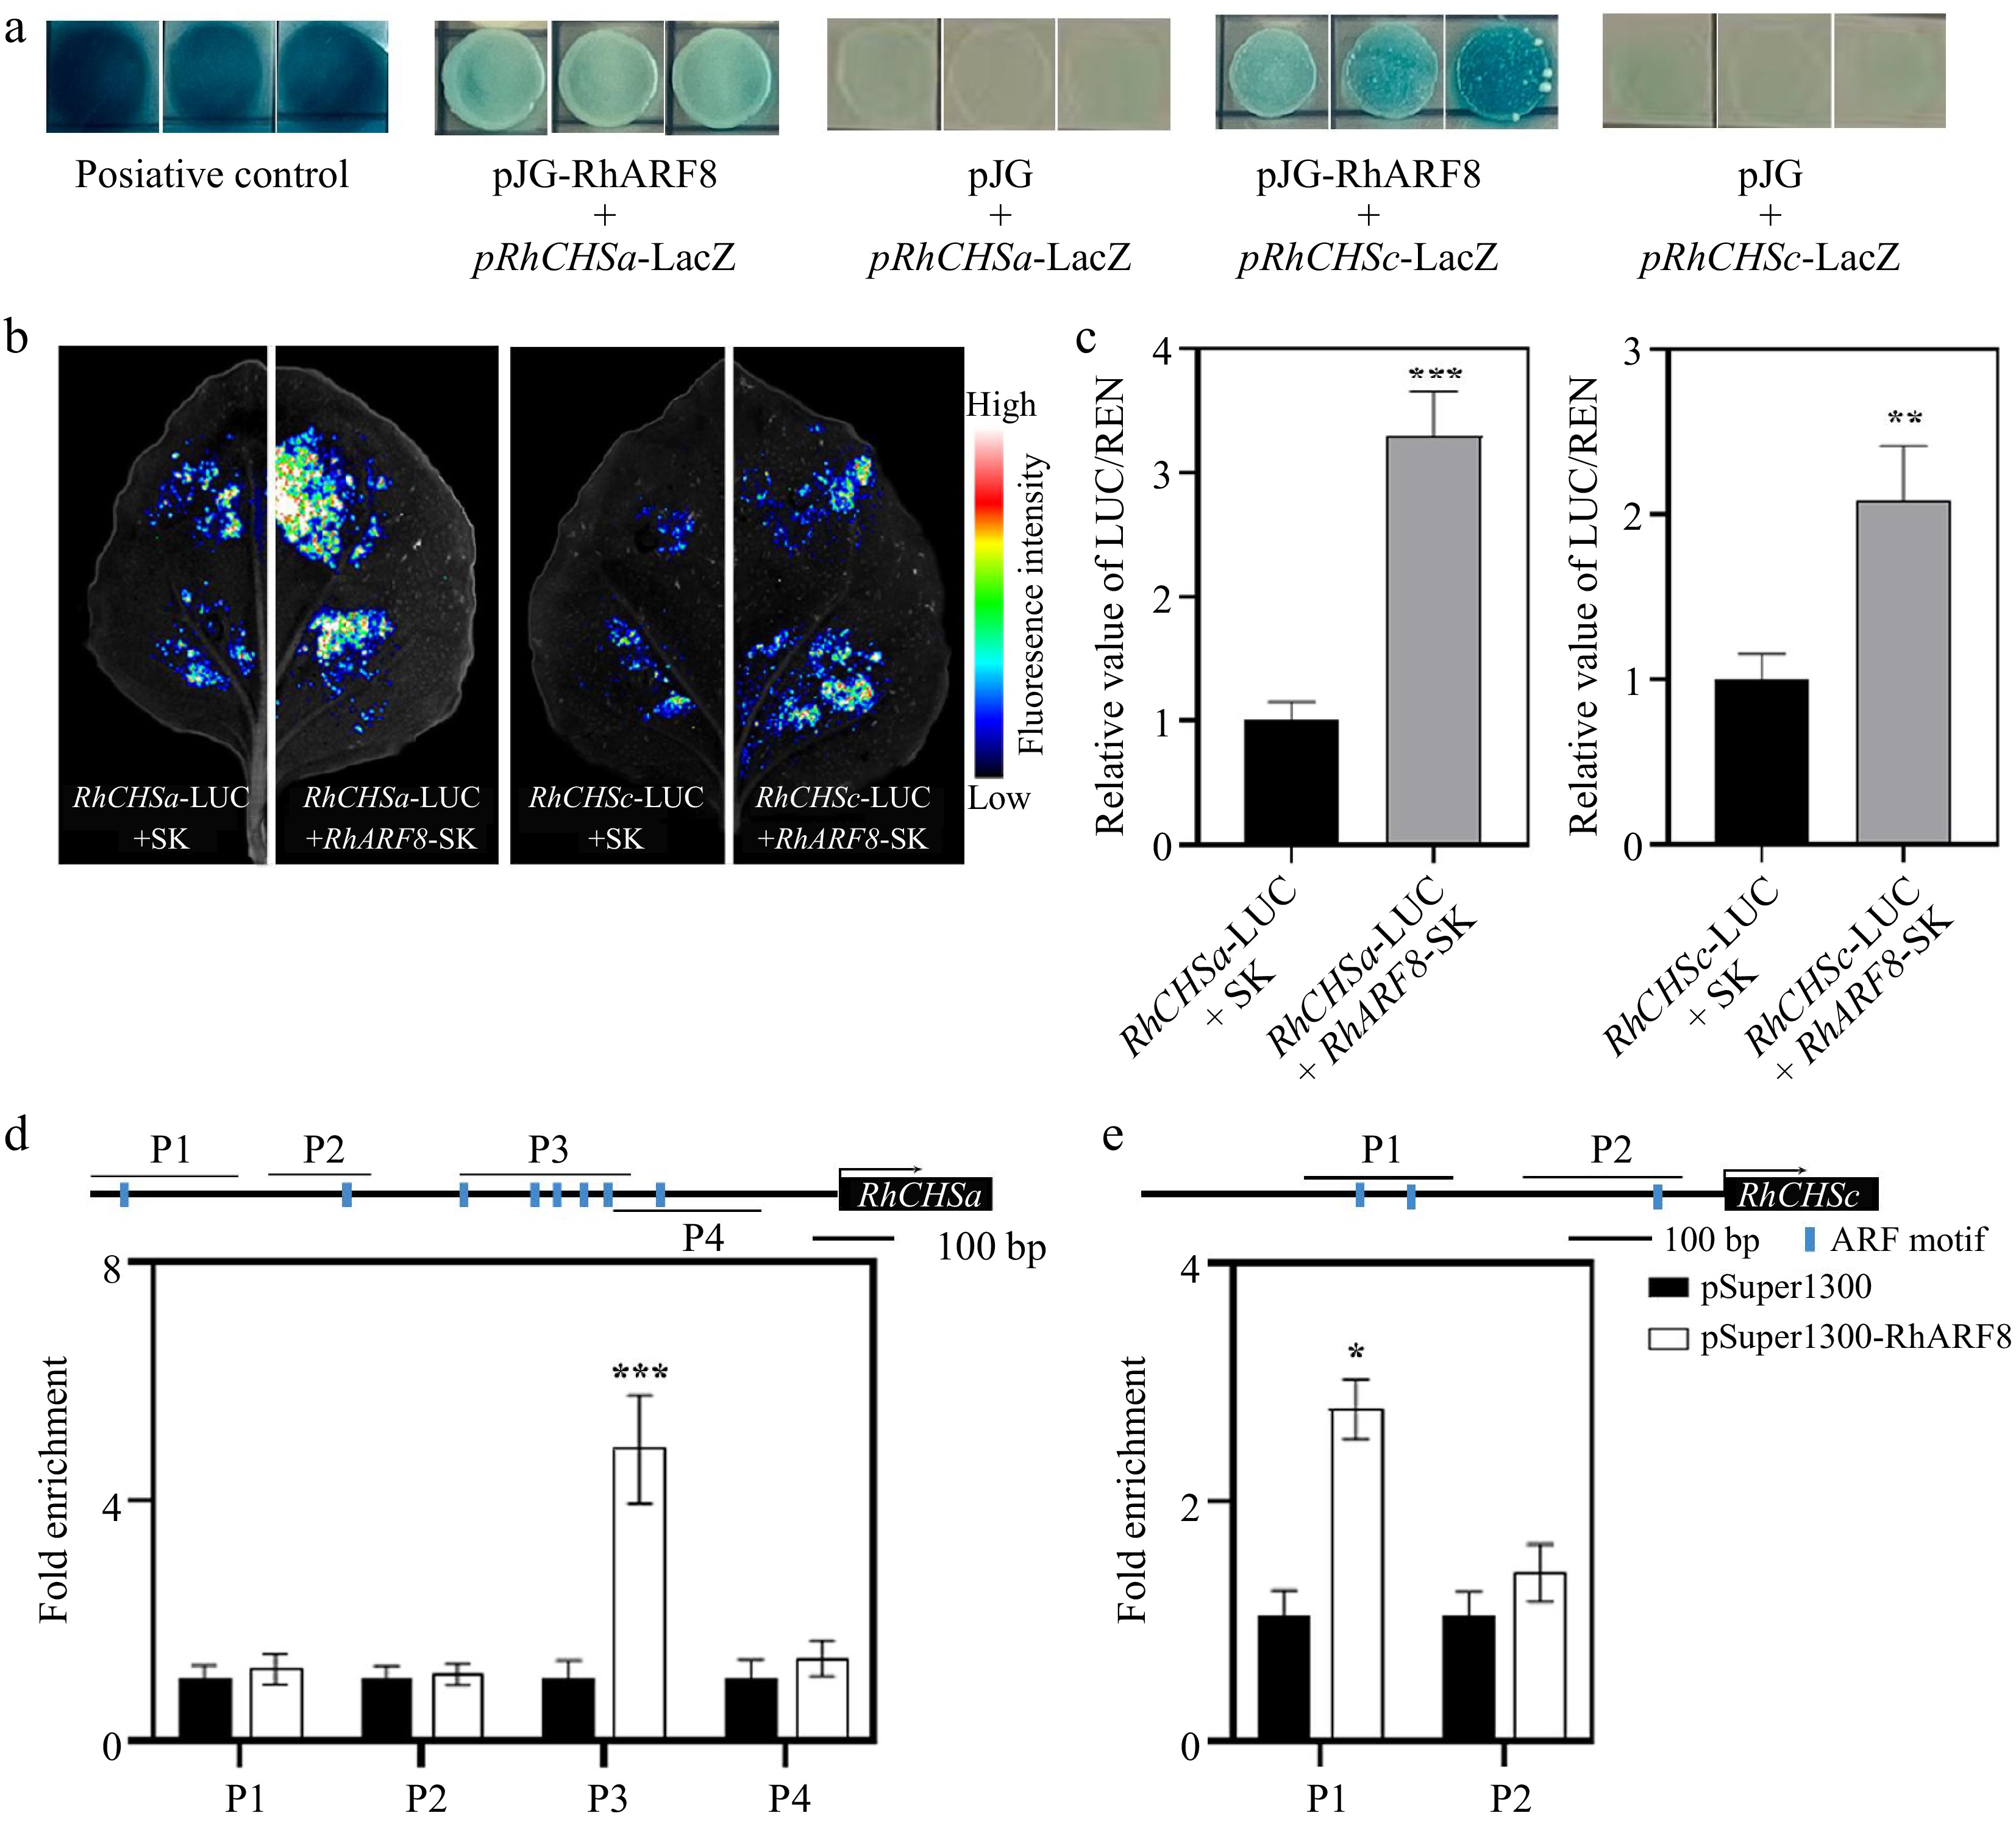
Figure 3.
RhARF8 directly binds to the promoters of RhCHSa/c and activates their expression in rose petals. (a) Yeast one-hybrid (Y1H) assay demonstrating the binding of RhARF8 to the promoters of RhCHSa and RhCHSc. Positive controls (pJG + pRhCHSa-LacZ and pJG + pRhCHSc-LacZ) show LacZ activity, while RhARF8 exhibit promoter-binding specificity. (b) Fluorescence imaging showing luciferase activity driven by the RhCHSa and RhCHSc promoters in the presence or absence of RhARF8 in transient assays. The fluorescence intensity was markedly increased in the presence of RhARF8. (c) Quantification of luciferase activity. RhARF8 significantly activated the RhCHSa and RhCHSc promoters compared to the control (*** p < 0.001, ** p < 0.01). (d) Chromatin immunoprecipitation (ChIP)-qPCR analysis showing RhARF8 exhibited significant enrichment at the P3 region of RhCHSa (*** p < 0.001). (e) RhARF8 exhibited significant enrichment at the P1 regions of RhCHSc (* p < 0.05). Values represent means ± SD (n = 3).
-
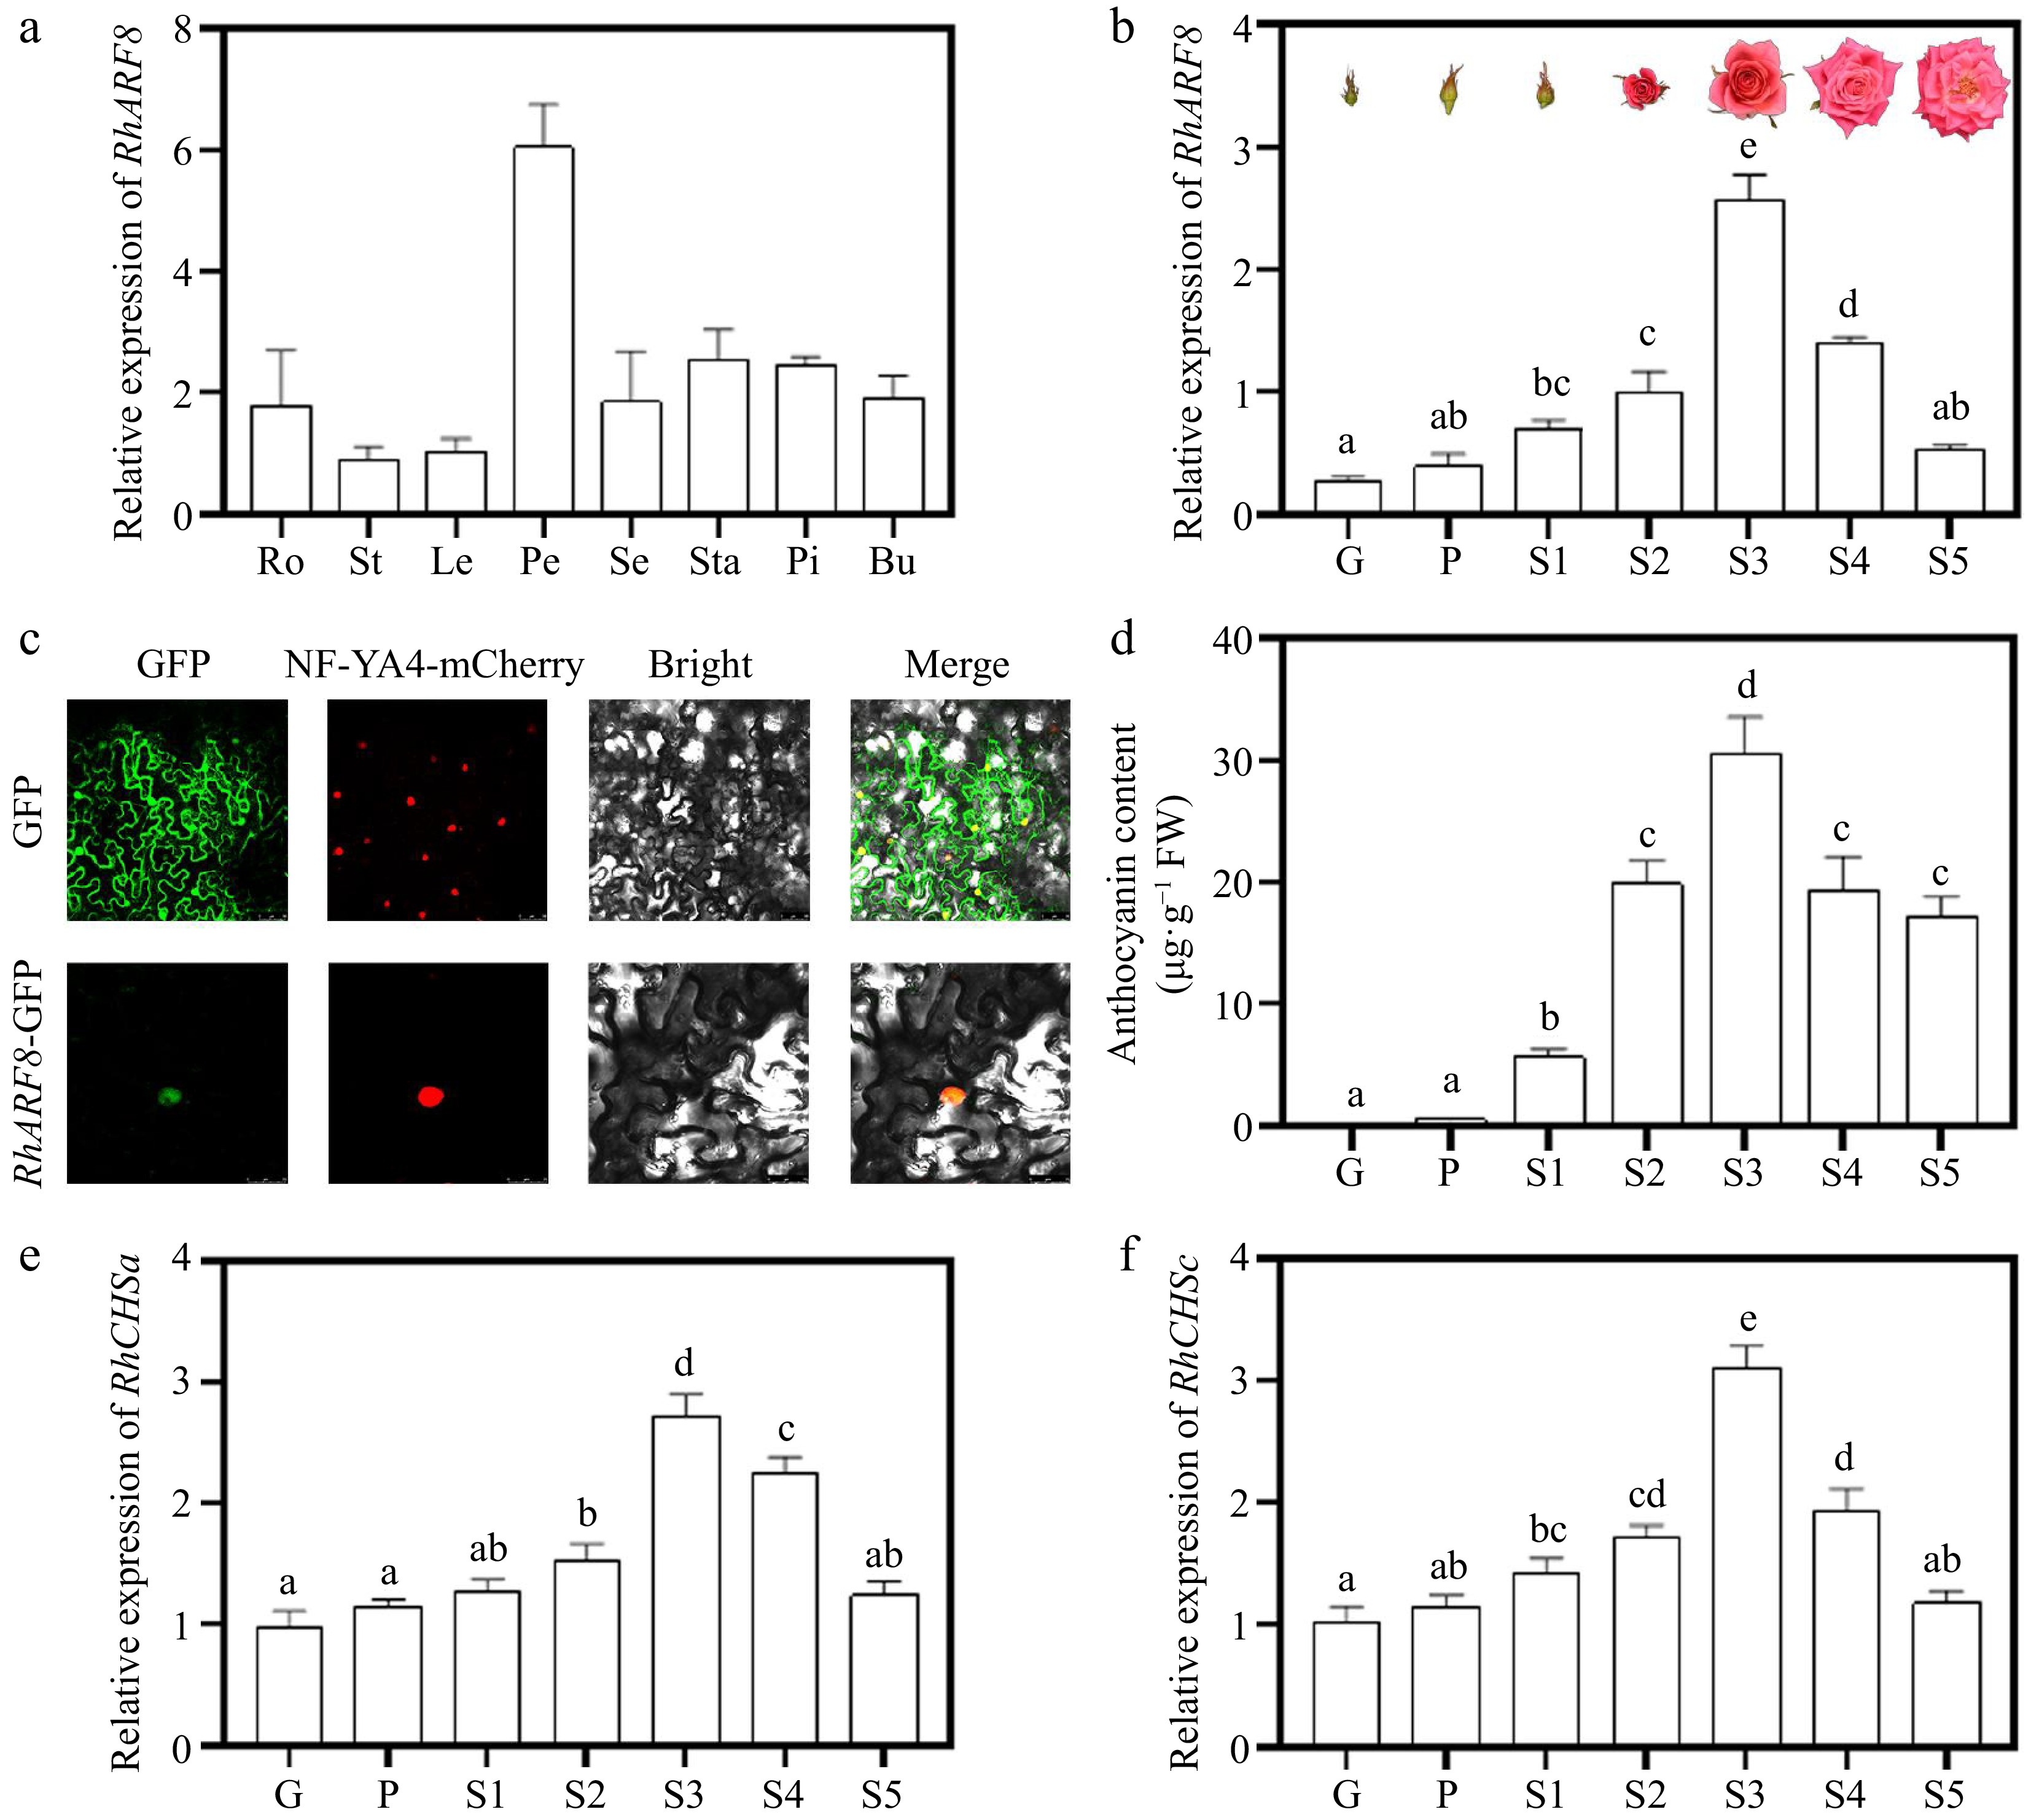
Figure 4.
Expression patterns and subcellular localization of RhARF8. (a) Relative expression levels of RhARF8 in different tissues (Ro: root; St: stem; Le: leaf; Pe: petal; Se: sepal; Sta: stamen; Pi: pistil; Bu: bud). (b) Relative expression levels of RhARF8 during flower opening stages (G, P, S1−S5) and phenotypic images of flower opening stages. (c) Subcellular localization of RhARF8 showing nuclear localization. (d) Anthocyanin content during different flower opening stages. (e) Relative expression levels of RhCHSa during flower opening stages. (f) Relative expression levels of RhCHSc during flower opening stages. Data are presented as means ± SE. Different letters indicate significant differences between groups (p < 0.05).
-
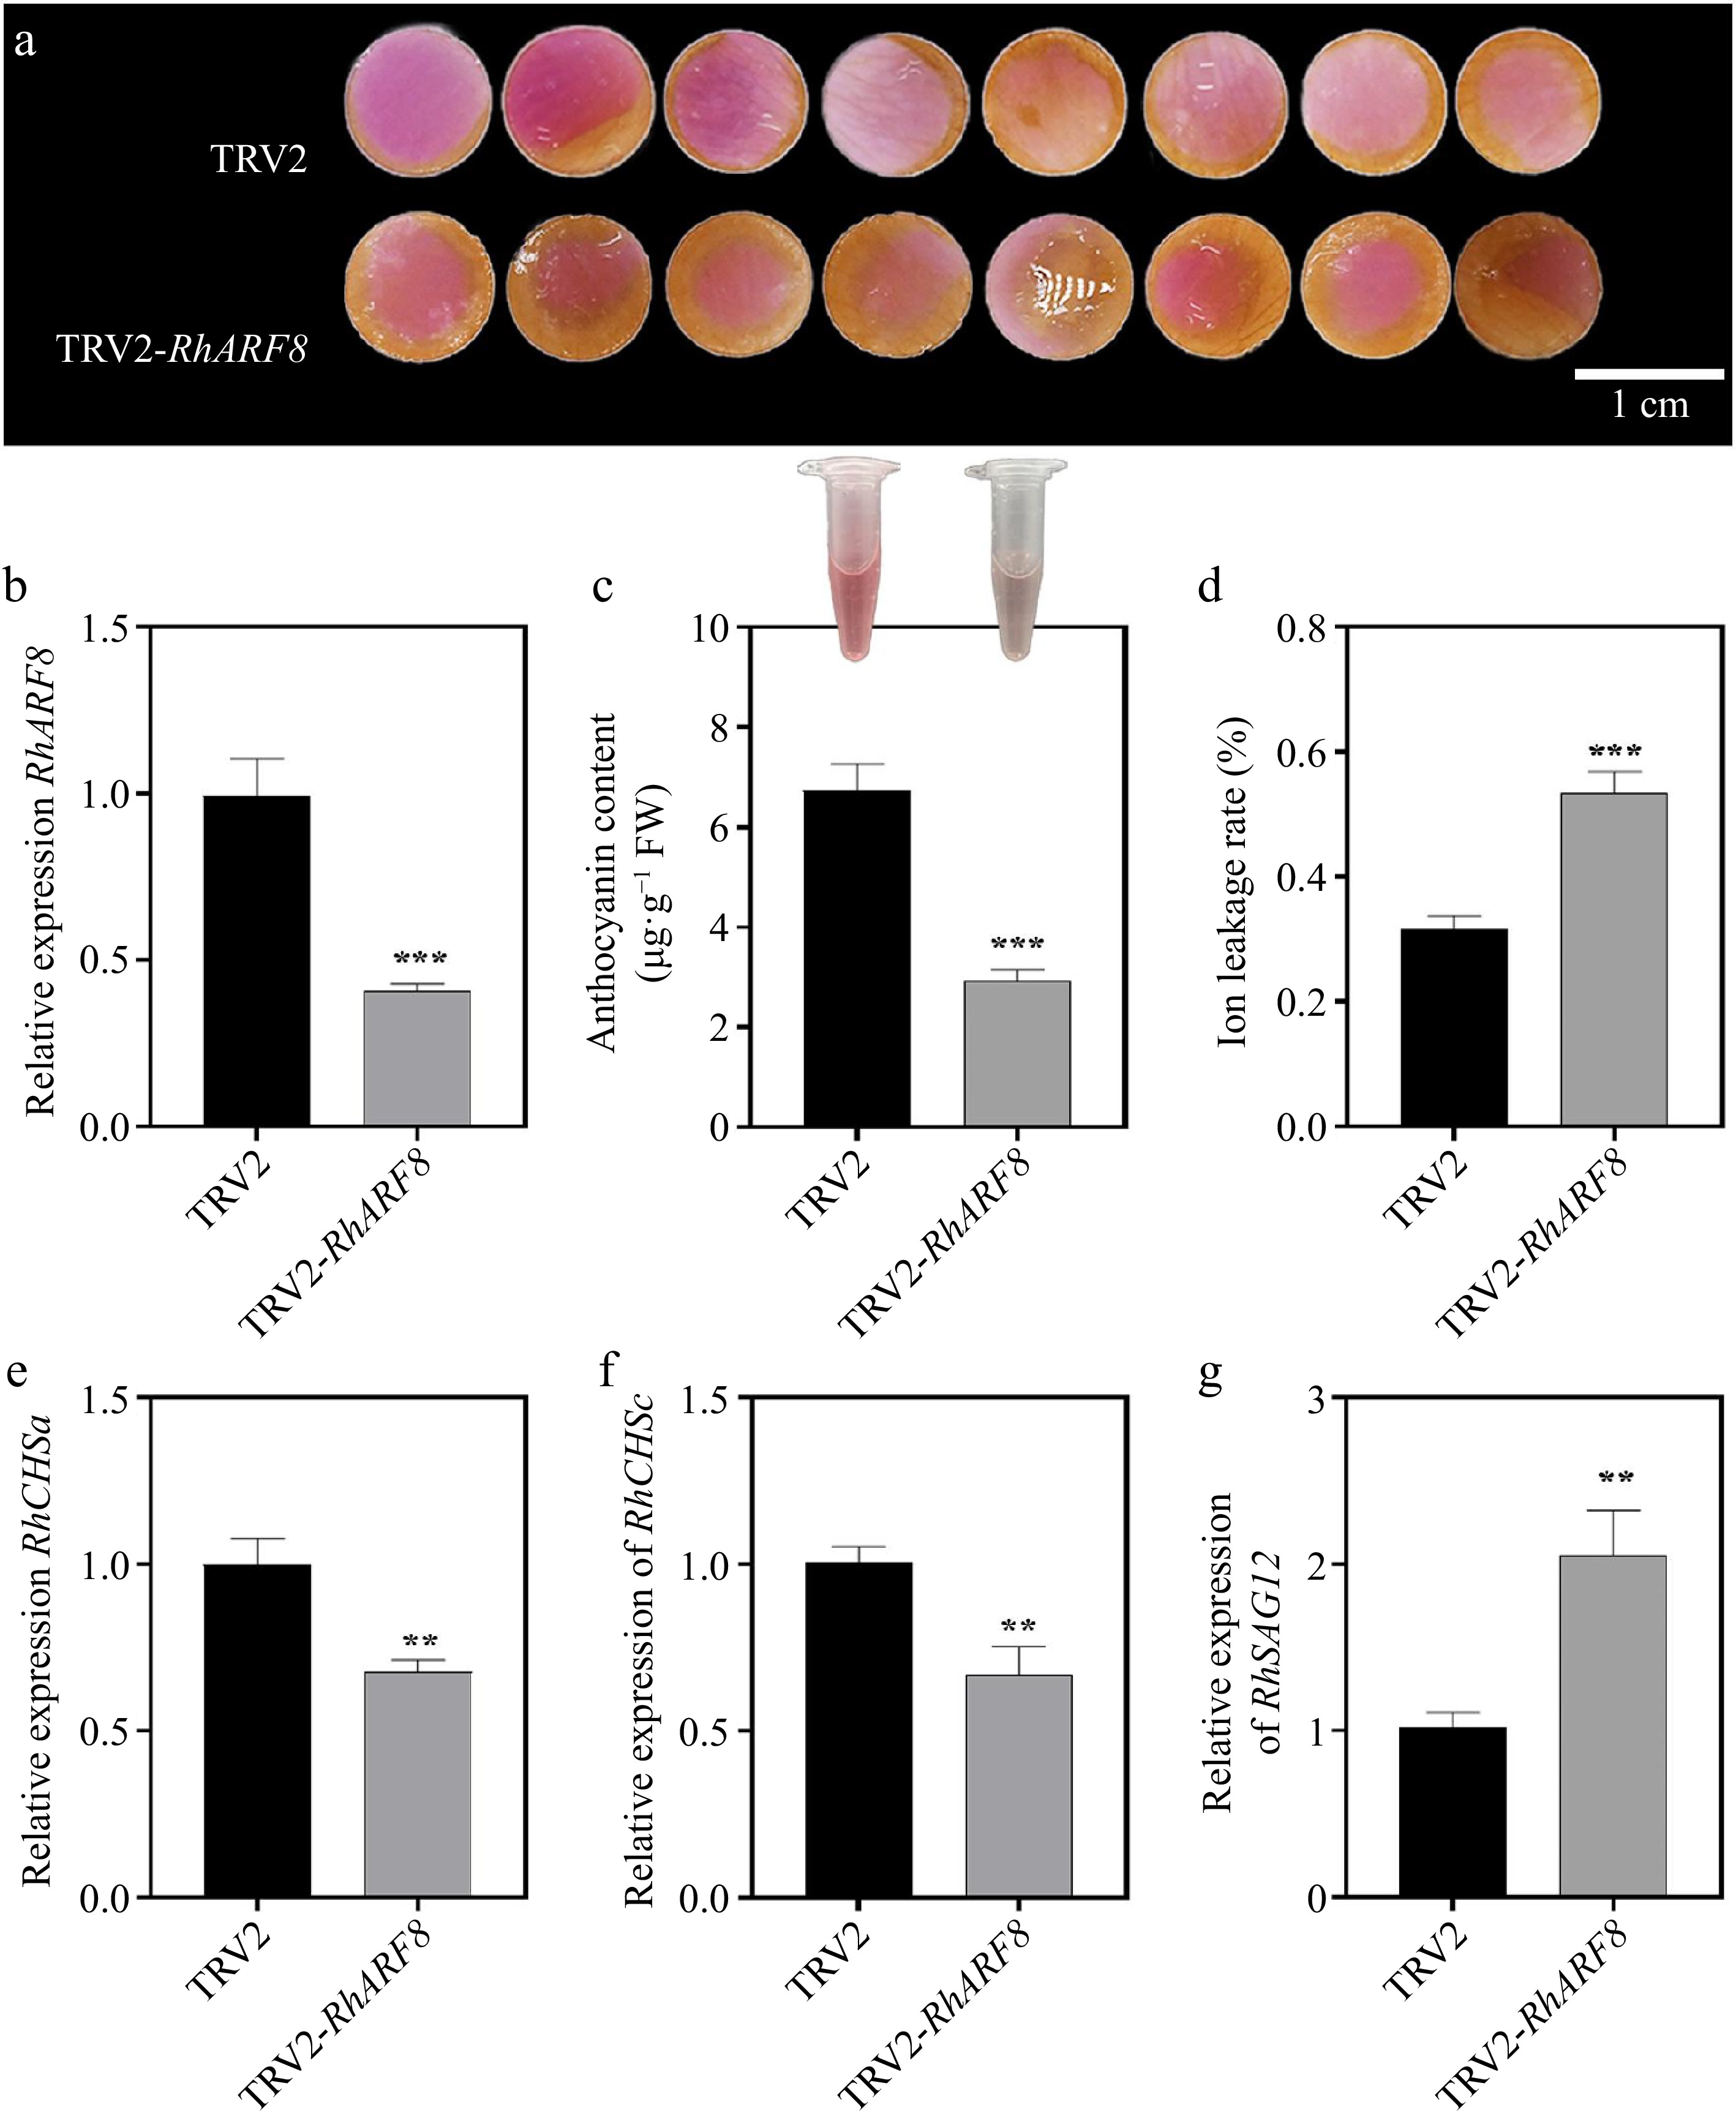
Figure 5.
Effects of RhARF8 silencing on anthocyanin metabolism and rose petal pigmentation. (a) Petal color changes in TRV2 control and TRV2-RhARF8-treated groups. (b) Relative expression levels of RhARF8. (c) Anthocyanin content. (d) Ion leakage rate. (e) Expression levels of the key anthocyanin biosynthetic gene RhCHSa. (f) Expression levels of the key anthocyanin biosynthetic gene RhCHSc. (g) Expression levels of the senescence marker gene RhSAG12 ( *** p < 0.001, ** p < 0.01, * p < 0.05). Data are presented as means ± SE.
-
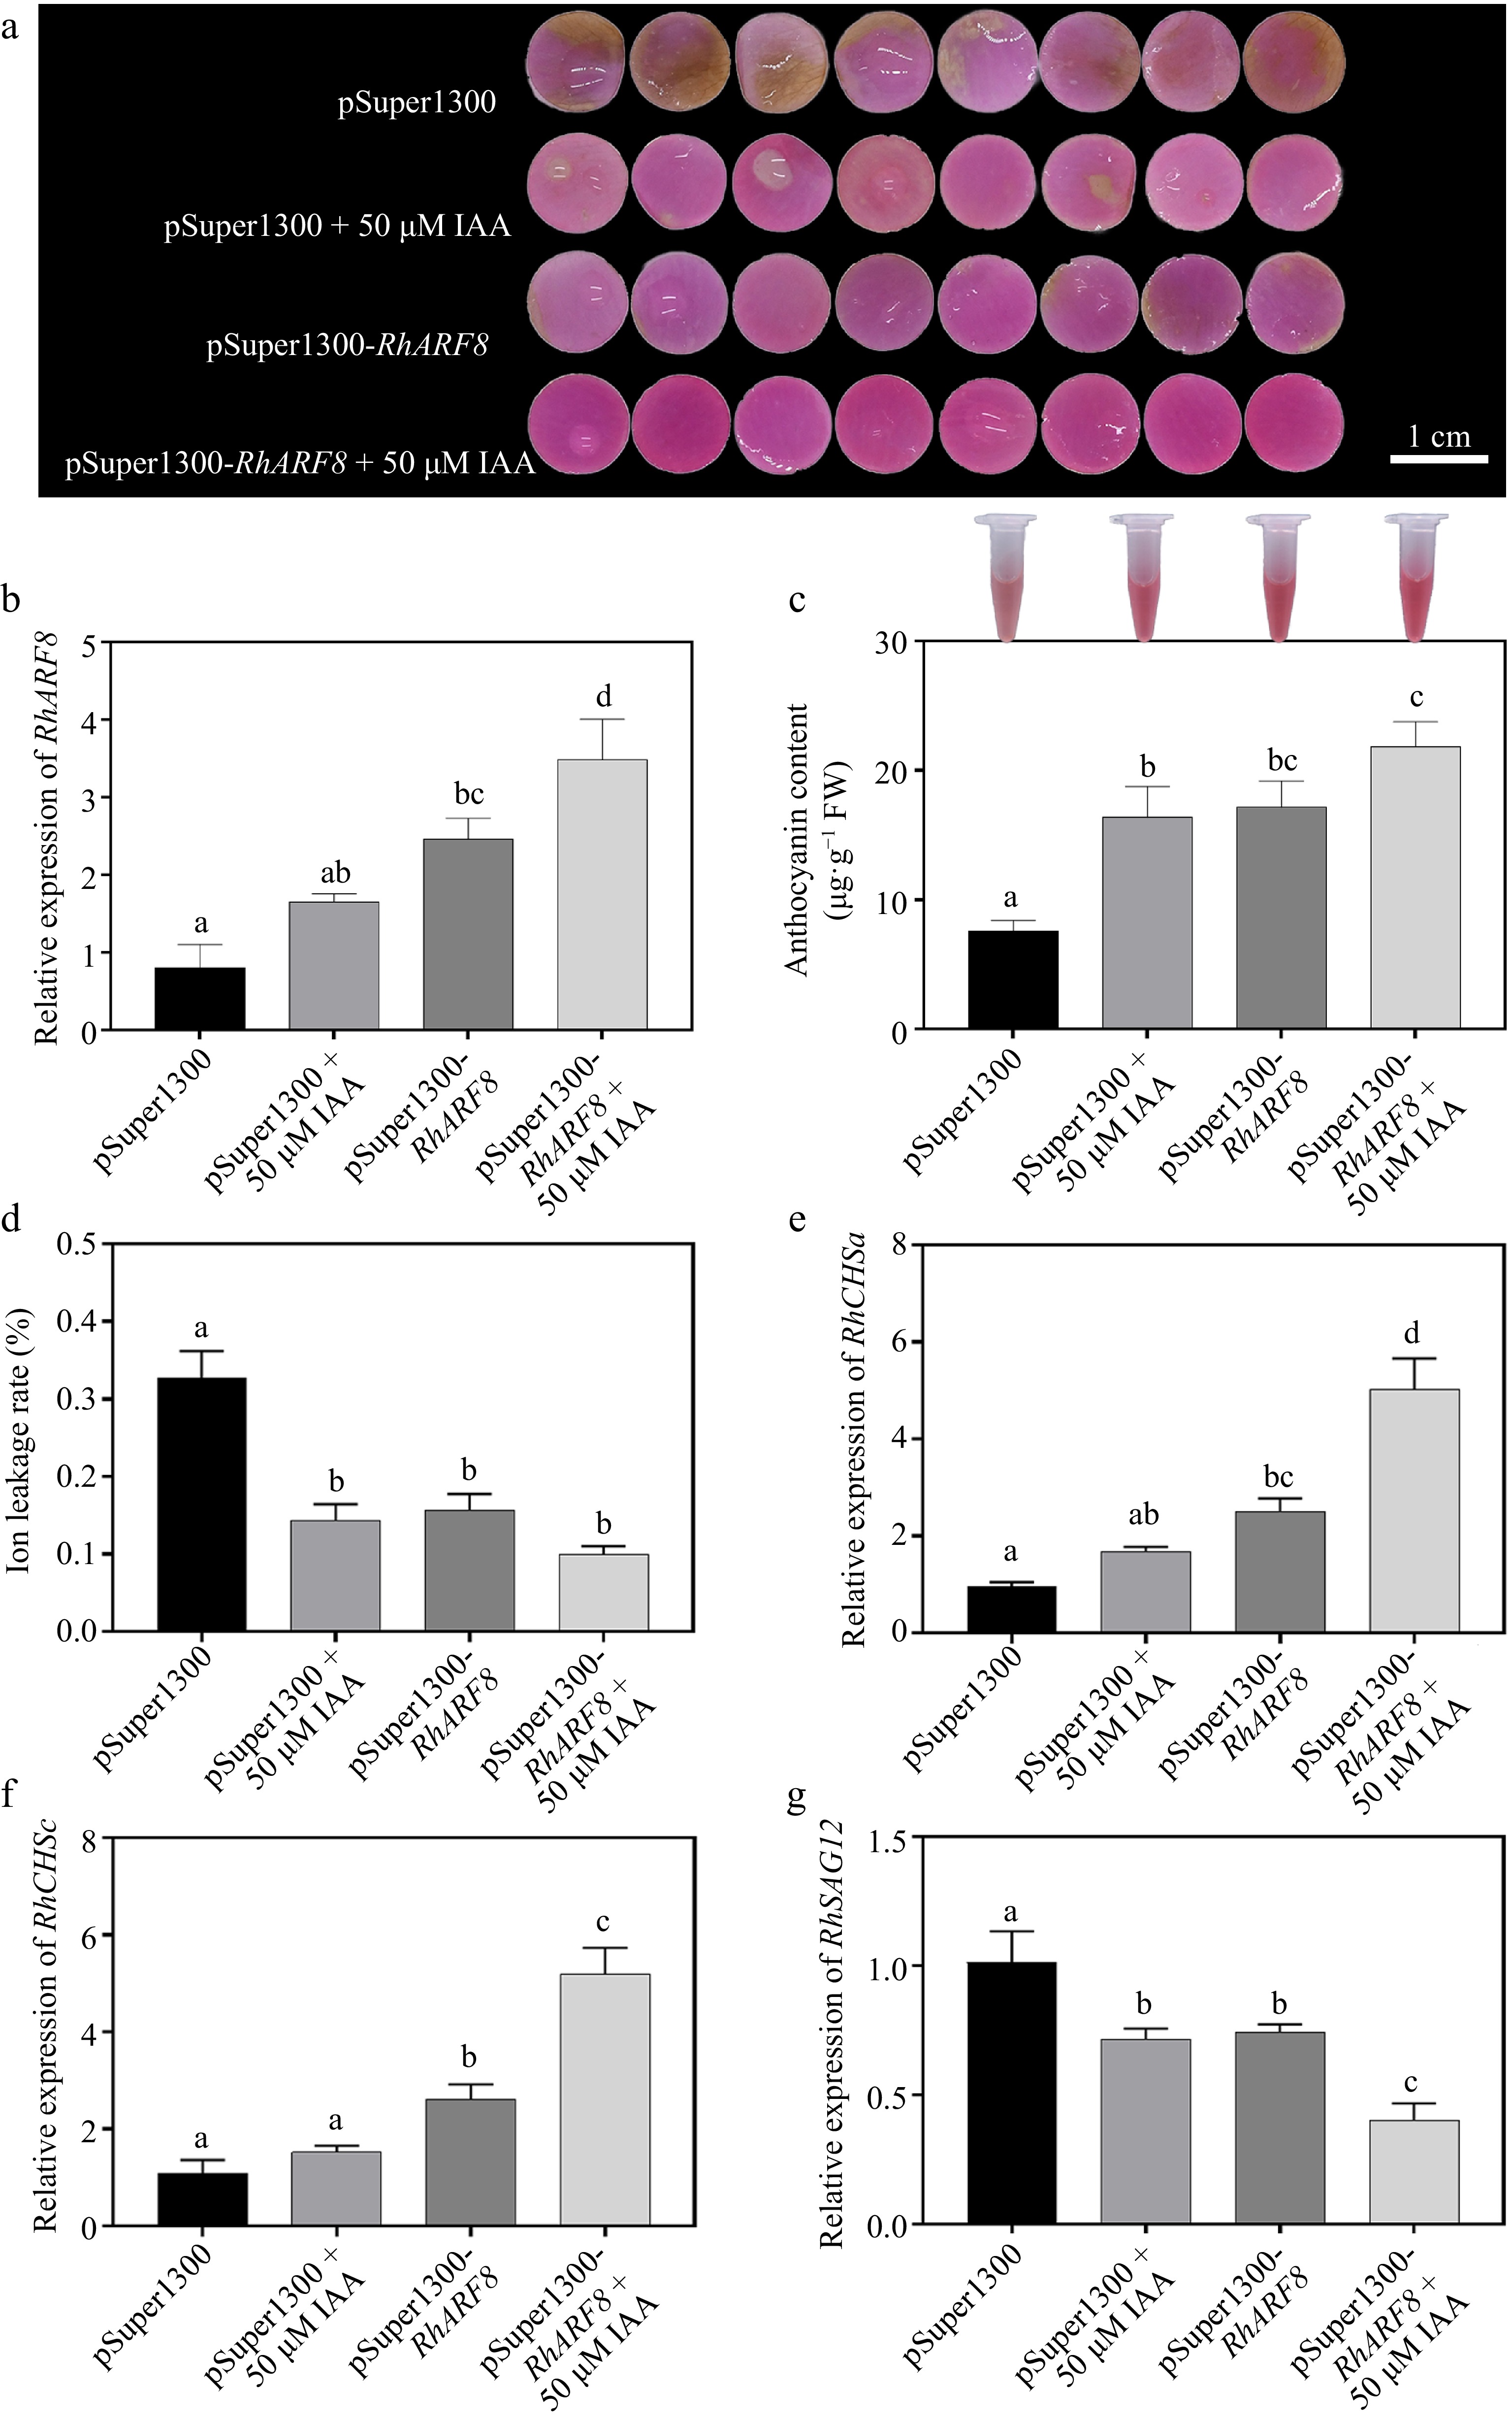
Figure 6.
Synergistic effects of IAA and RhARF8 on anthocyanin metabolism and related physiological processes in roses. (a) Petal color changes under different treatments: pSuper1300 empty vector, IAA treatment (pSuper1300 + 50 μM IAA), RhARF8 overexpression (pSuper1300-RhARF8), and RhARF8 overexpression combined with IAA treatment(pSuper1300-RhARF8 + 50 μM IAA). (b) Relative expression levels of RhARF8. (c) Anthocyanin content. (d) Ion leakage rate. (e) Expression levels of key anthocyanin biosynthetic genes RhCHSa. (f) Expression levels of key anthocyanin biosynthetic genes RhCHSc. (g) Expression levels of the senescence marker gene RhSAG12. Data are presented as means ± SE. Different letters indicate significant differences between groups (p < 0.05).
-
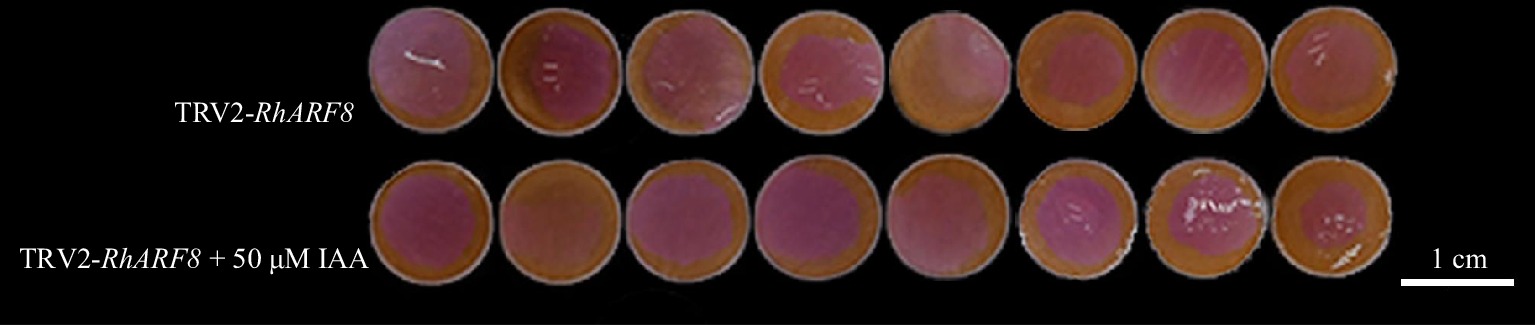
Figure 7.
Synergistic effects of IAA and RhARF8 silencing in roses. Petal color changes under different treatments: RhARF8 silencing (TRV2-RhARF8), and RhARF8 silencing combined with IAA treatment (TRV2-RhARF8 + 50 μM IAA).
-
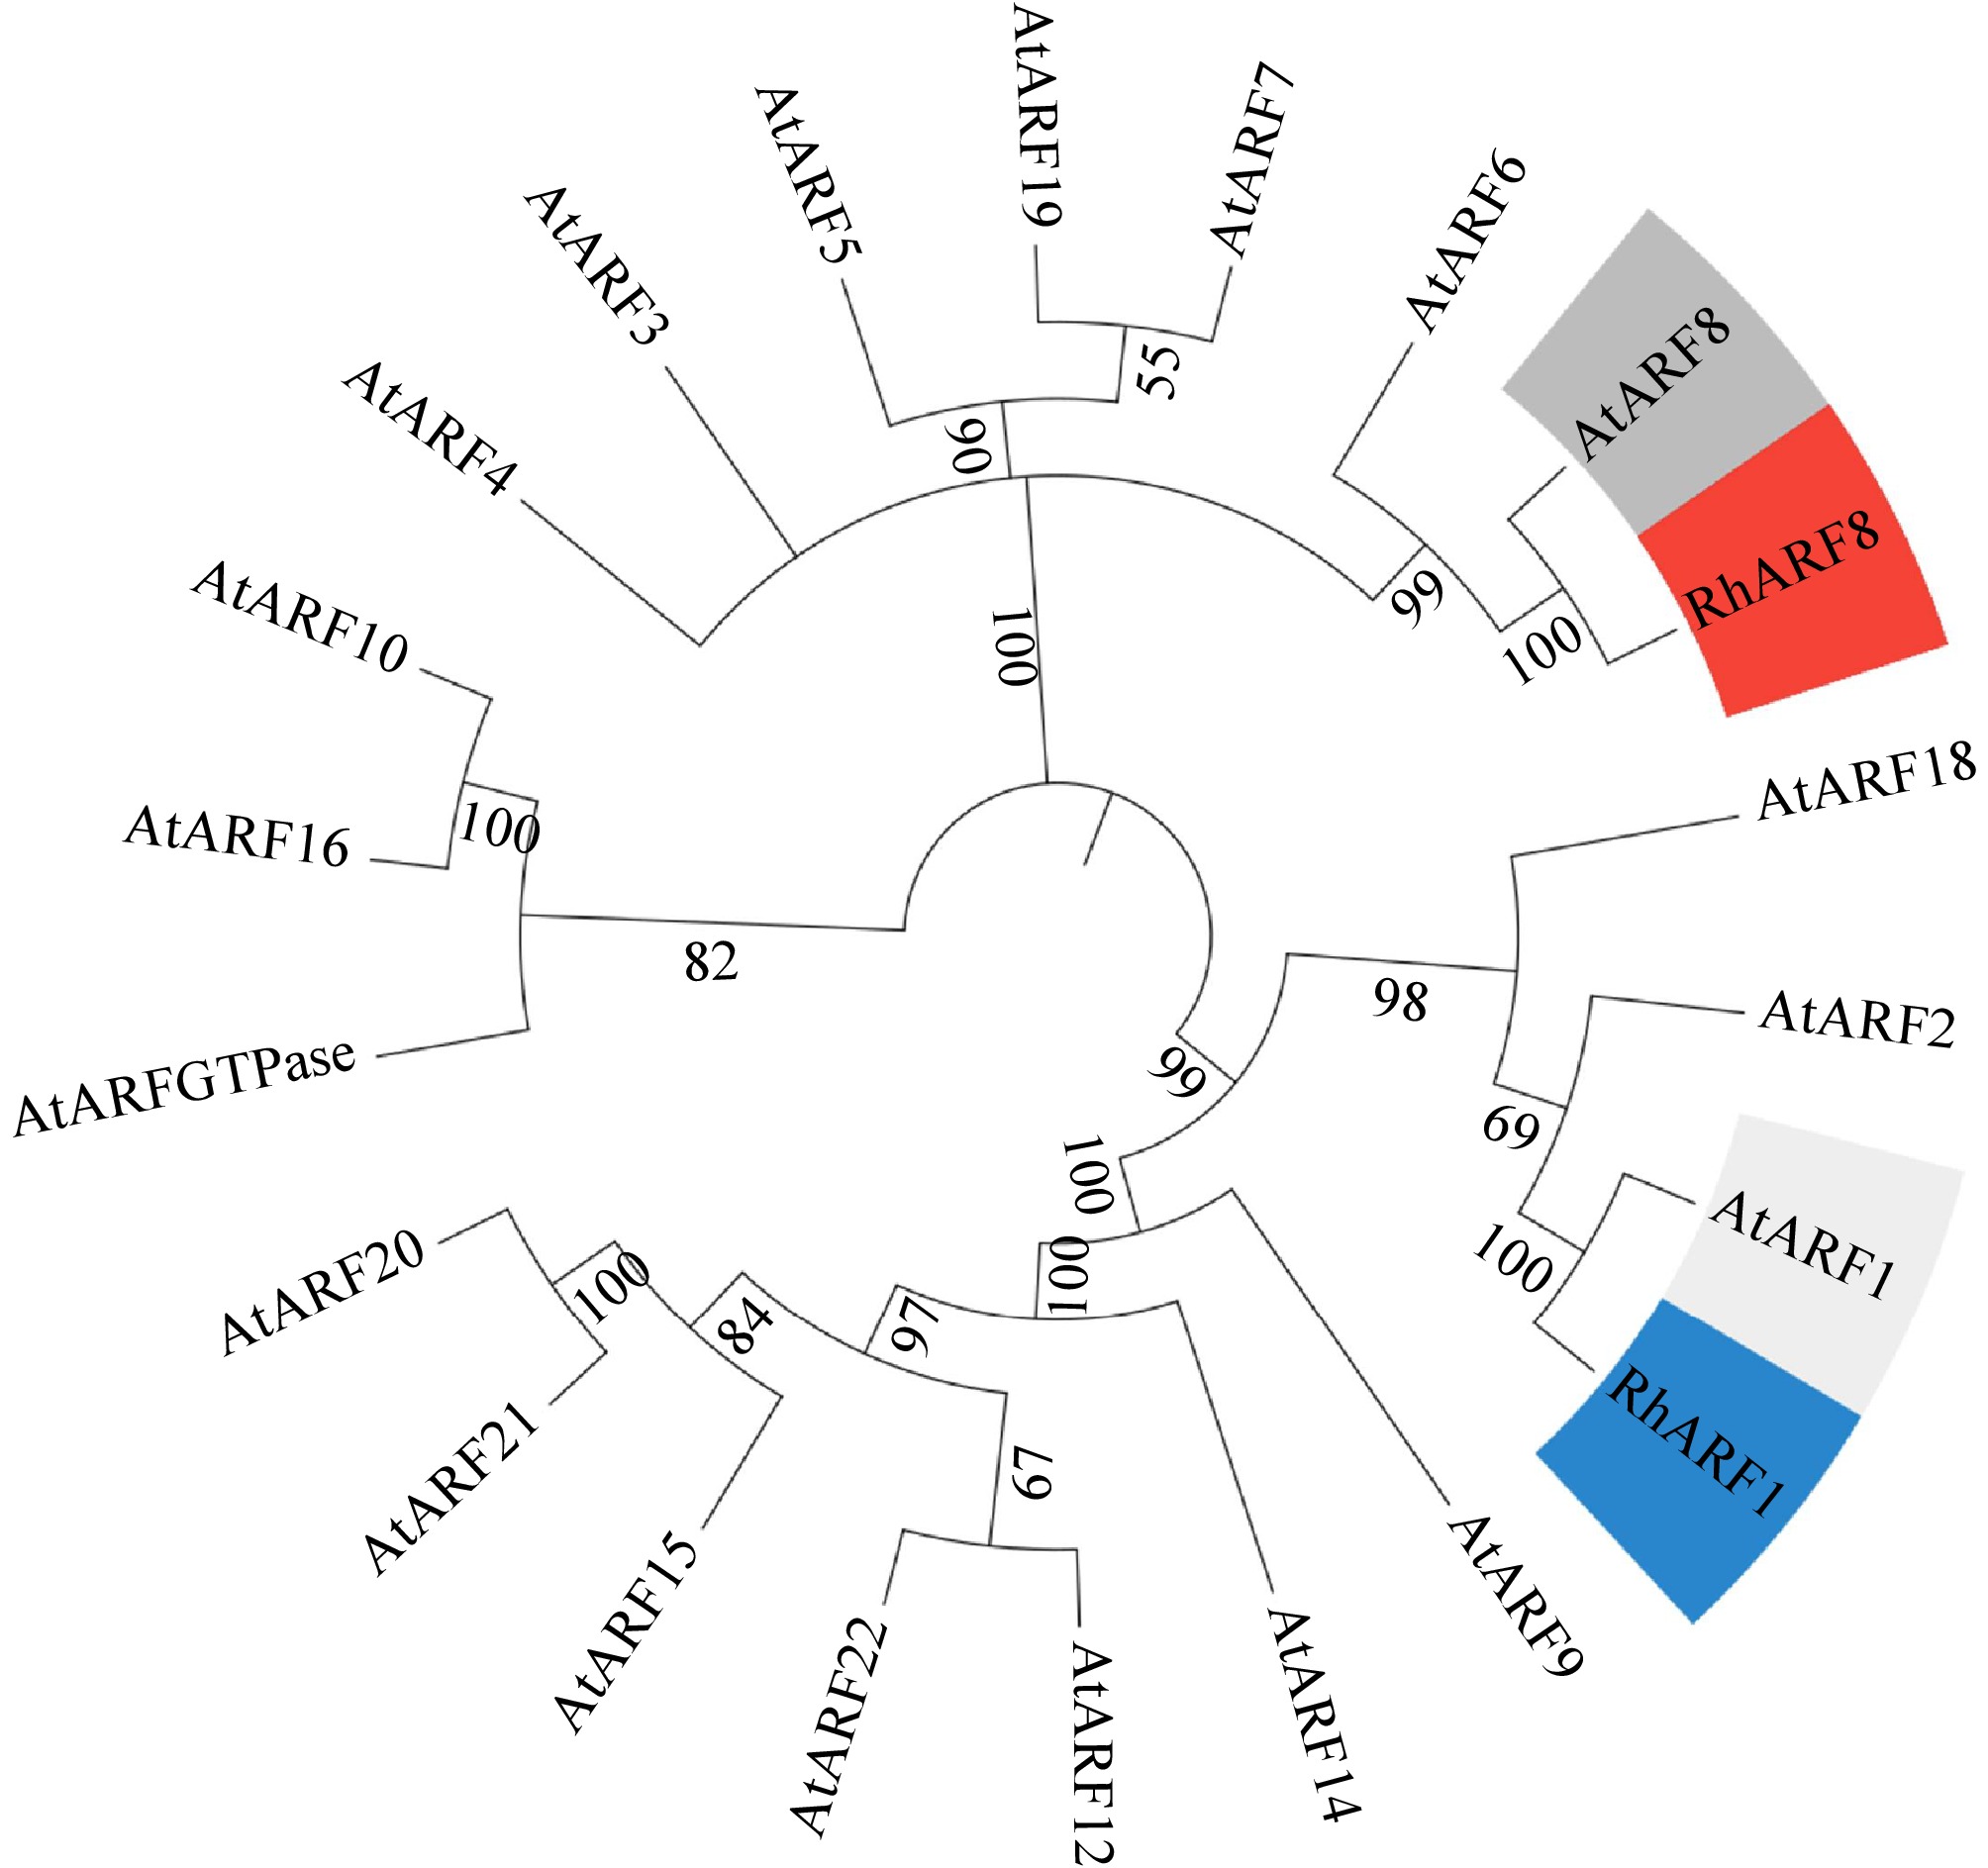
Figure 8.
Phylogenetic analysis of RhARF8 and RhARF1. Phylogenetic tree based on full-length amino acid sequences showing that RhARF8 and RhARF1 cluster into distinct clades with AtARF8 and AtARF1 from Arabidopsis thaliana, highlighting their functional specificity and evolutionary divergence.
Figures
(8)
Tables
(0)