-
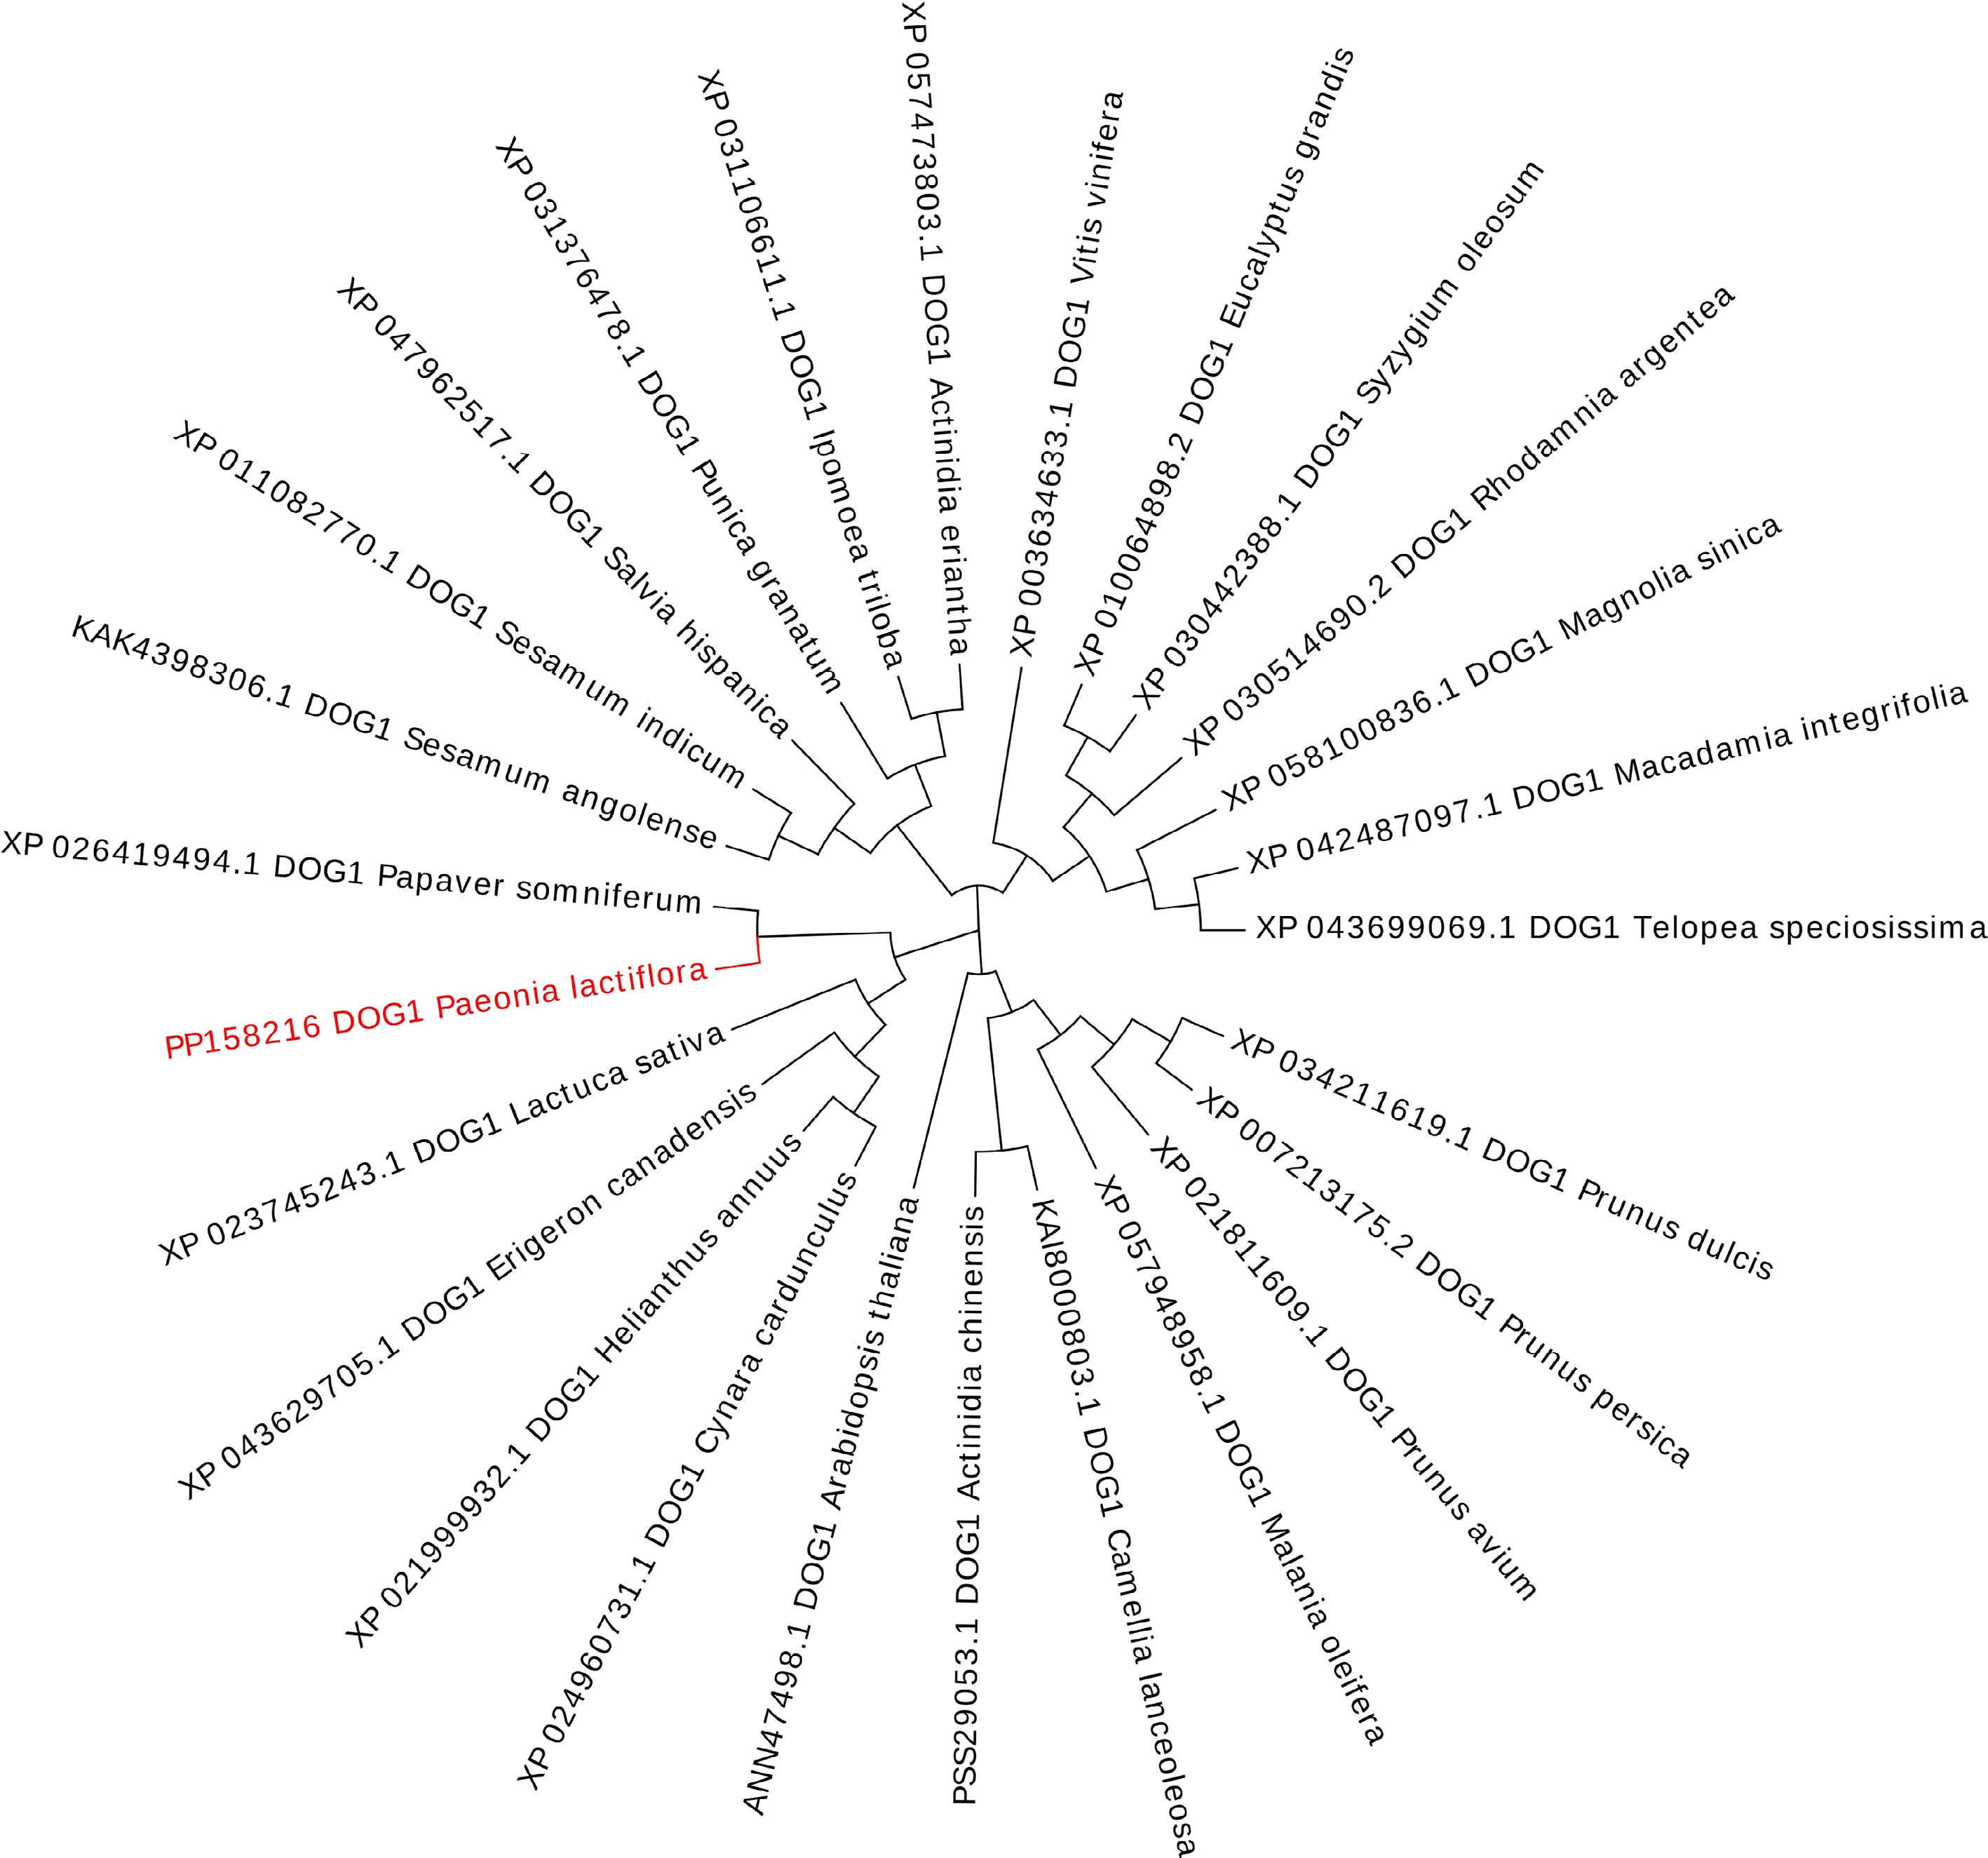
Figure 1.
A phylogenetic tree of PlDOG1 and DOG1 homologs from various plant species. The tree was generated by MEGA 7.0 and evolview software. The robustness of the tree branches was evaluated through 1,000 bootstrap replicates, and the corresponding bootstrap values were determined.
-
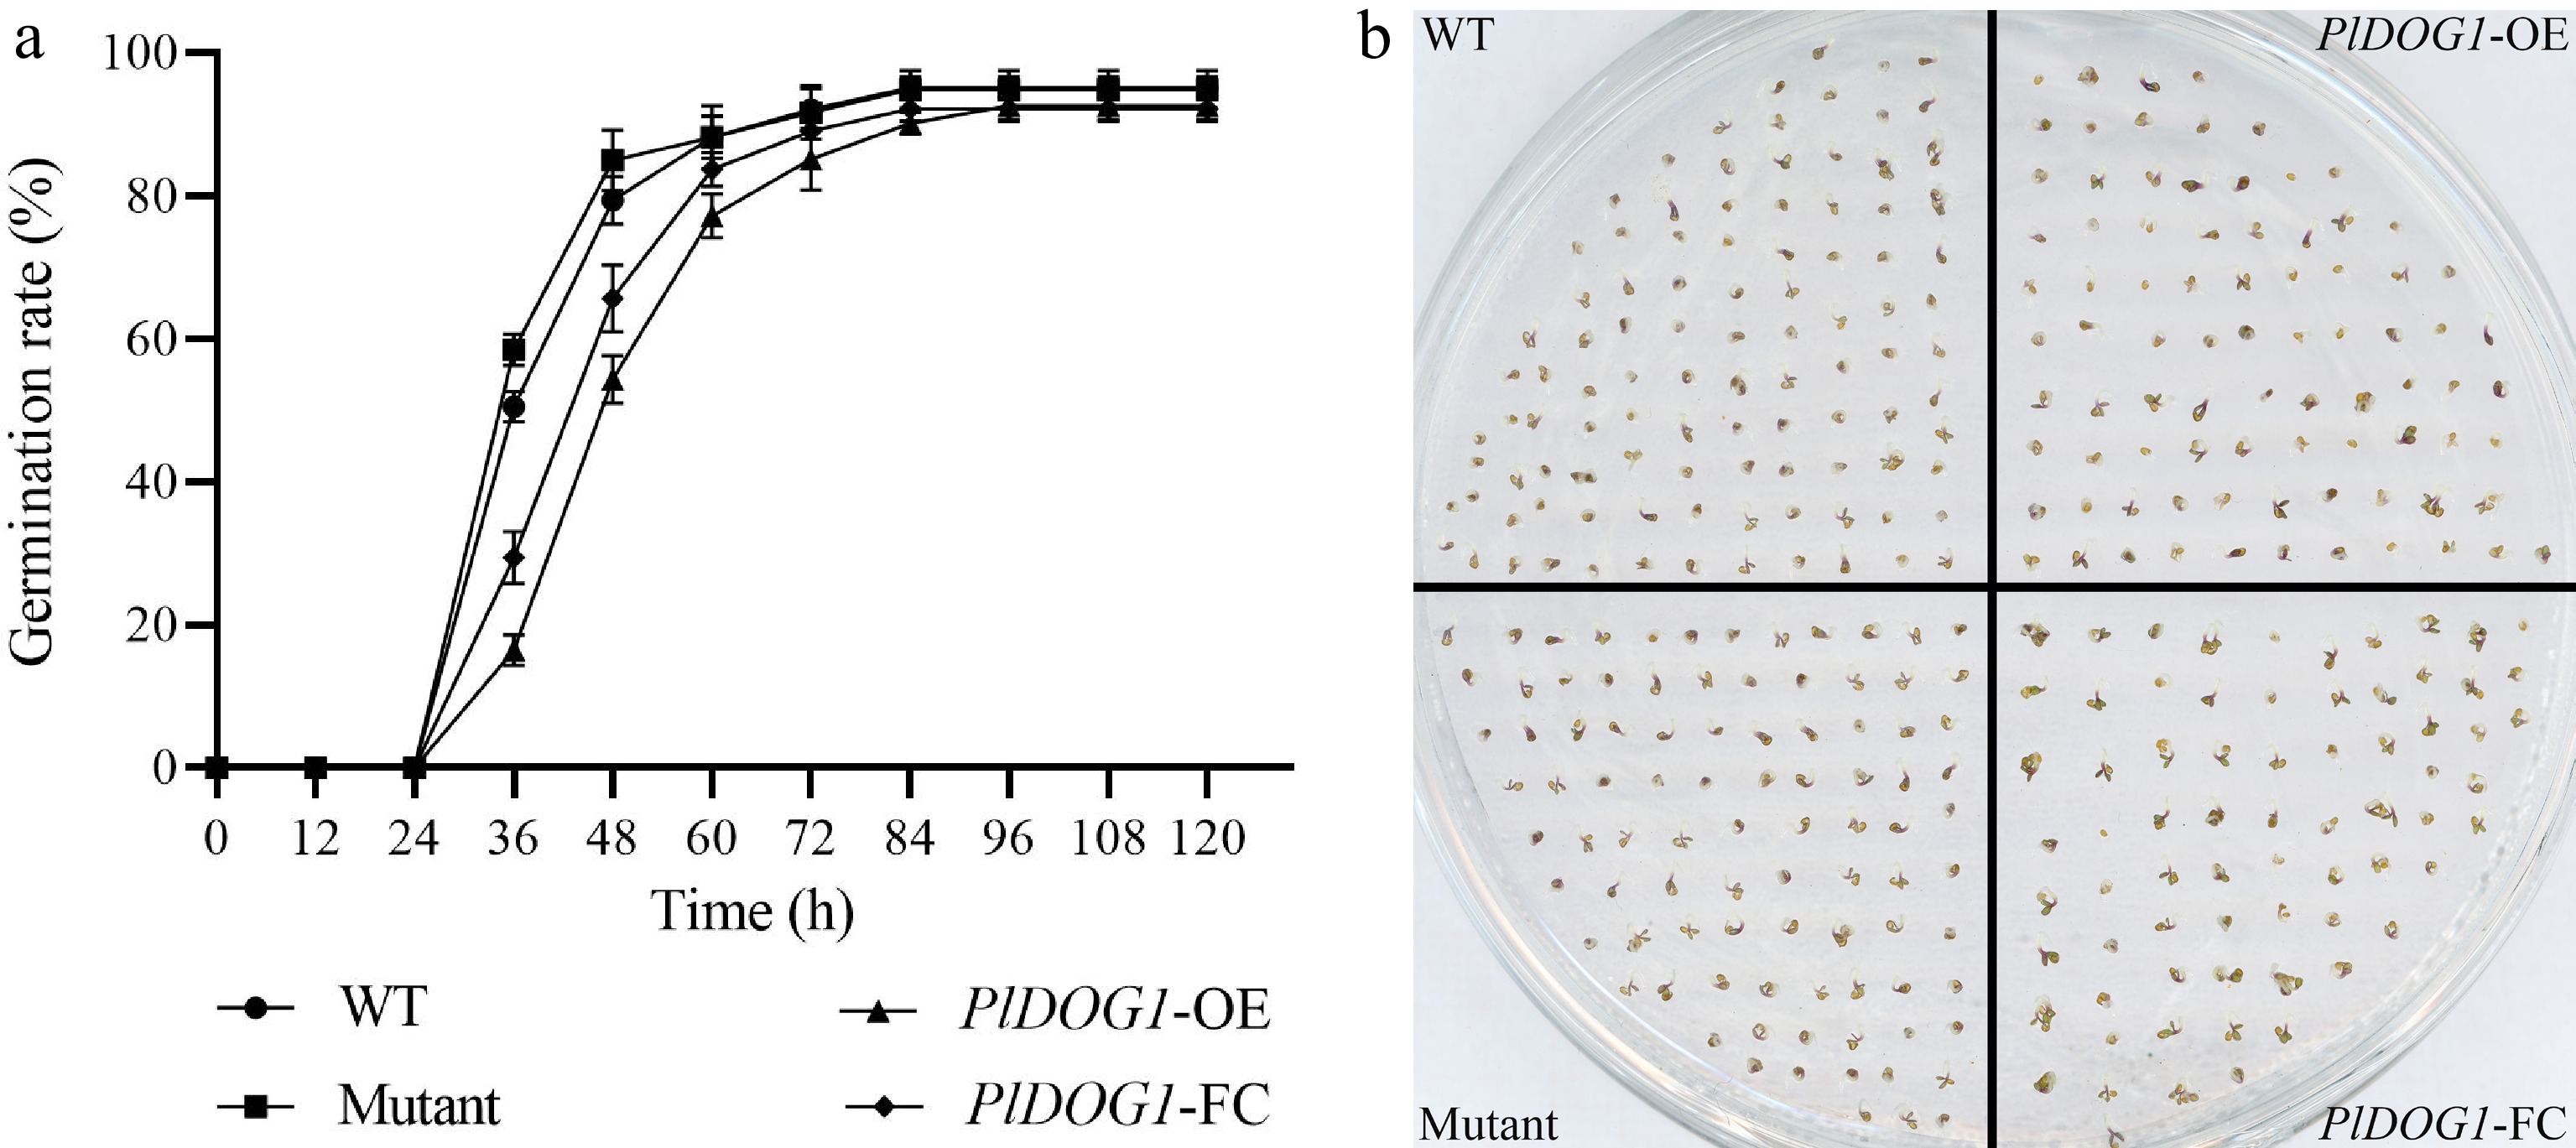
Figure 2.
Germination analysis of wild type, PlDOG1 overexpression, PlDOG1 complement expression and PlDOG1 function deficient Arabidopsis seeds. (a) Germination rates statistical analysis of different A. thaliana seeds. (b) Germination phenotype at 60 h. WT, wild type; PlDOG1-OE, transgenic overexpression seeds; PlDOG1-FC, mutant plants with functional complementation expression; Mutant, DOG1 deficient mutant seeds. Three independent biological replicates were prepared. Data differences were analyzed for significance using one-way analysis of variance (ANOVA) followed by Duncan's test.
-
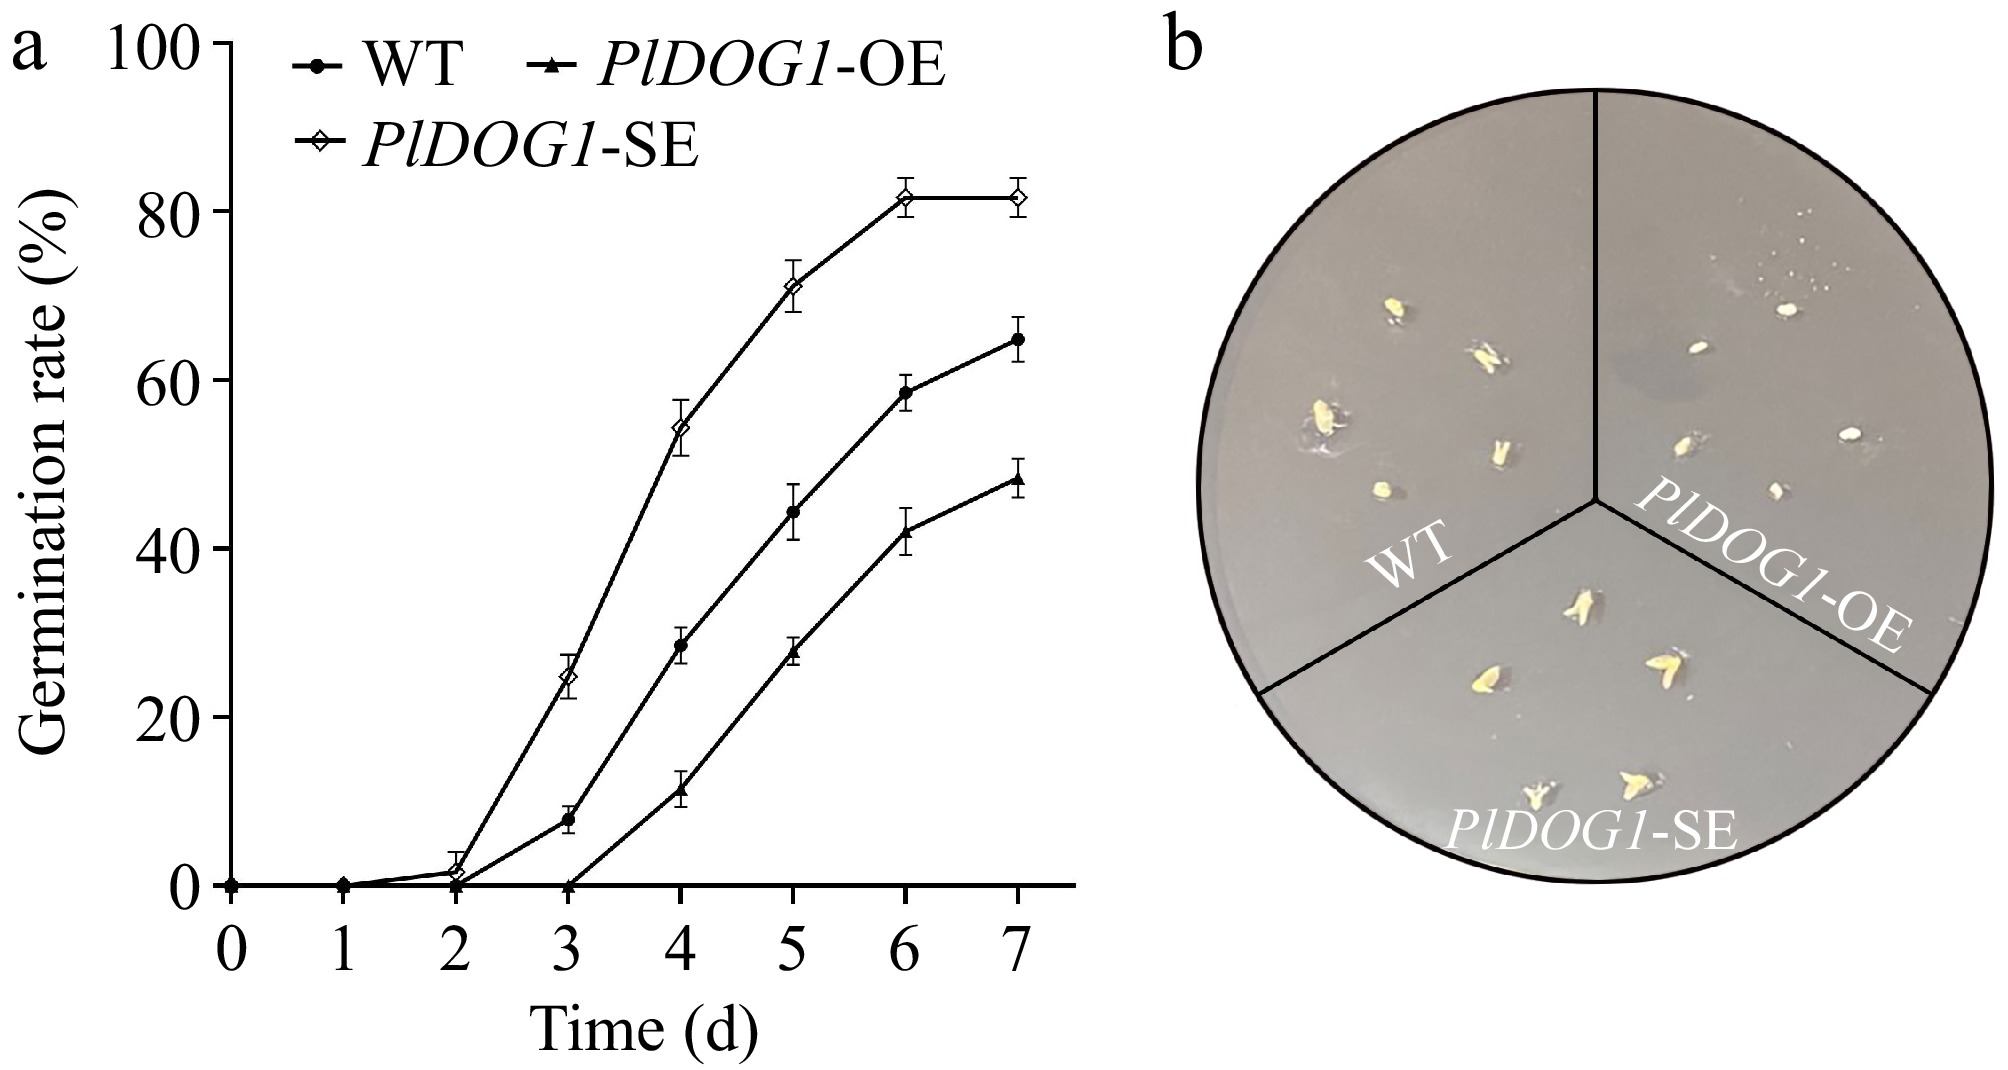
Figure 3.
Phenotypic and statistics analysis of PlDOG1 transgenic P. lactiflora embryos. (a) Germination rates statistical analysis of different P. lactiflora embryos. (b) Embryos germination phenotype observed on MS medium containing 0.5 mg/L GA3 after 4-d cultivation. WT, ddH2O water-transformed embryos; PlDOG1-OE, PlDOG1 overexpressed embryos; PlDOG1-SE, PlDOG1 silenced embryos. Three independent biological replicates were prepared. Data differences were analyzed for significance using one-way analysis of variance (ANOVA) followed by Duncan's test.
-
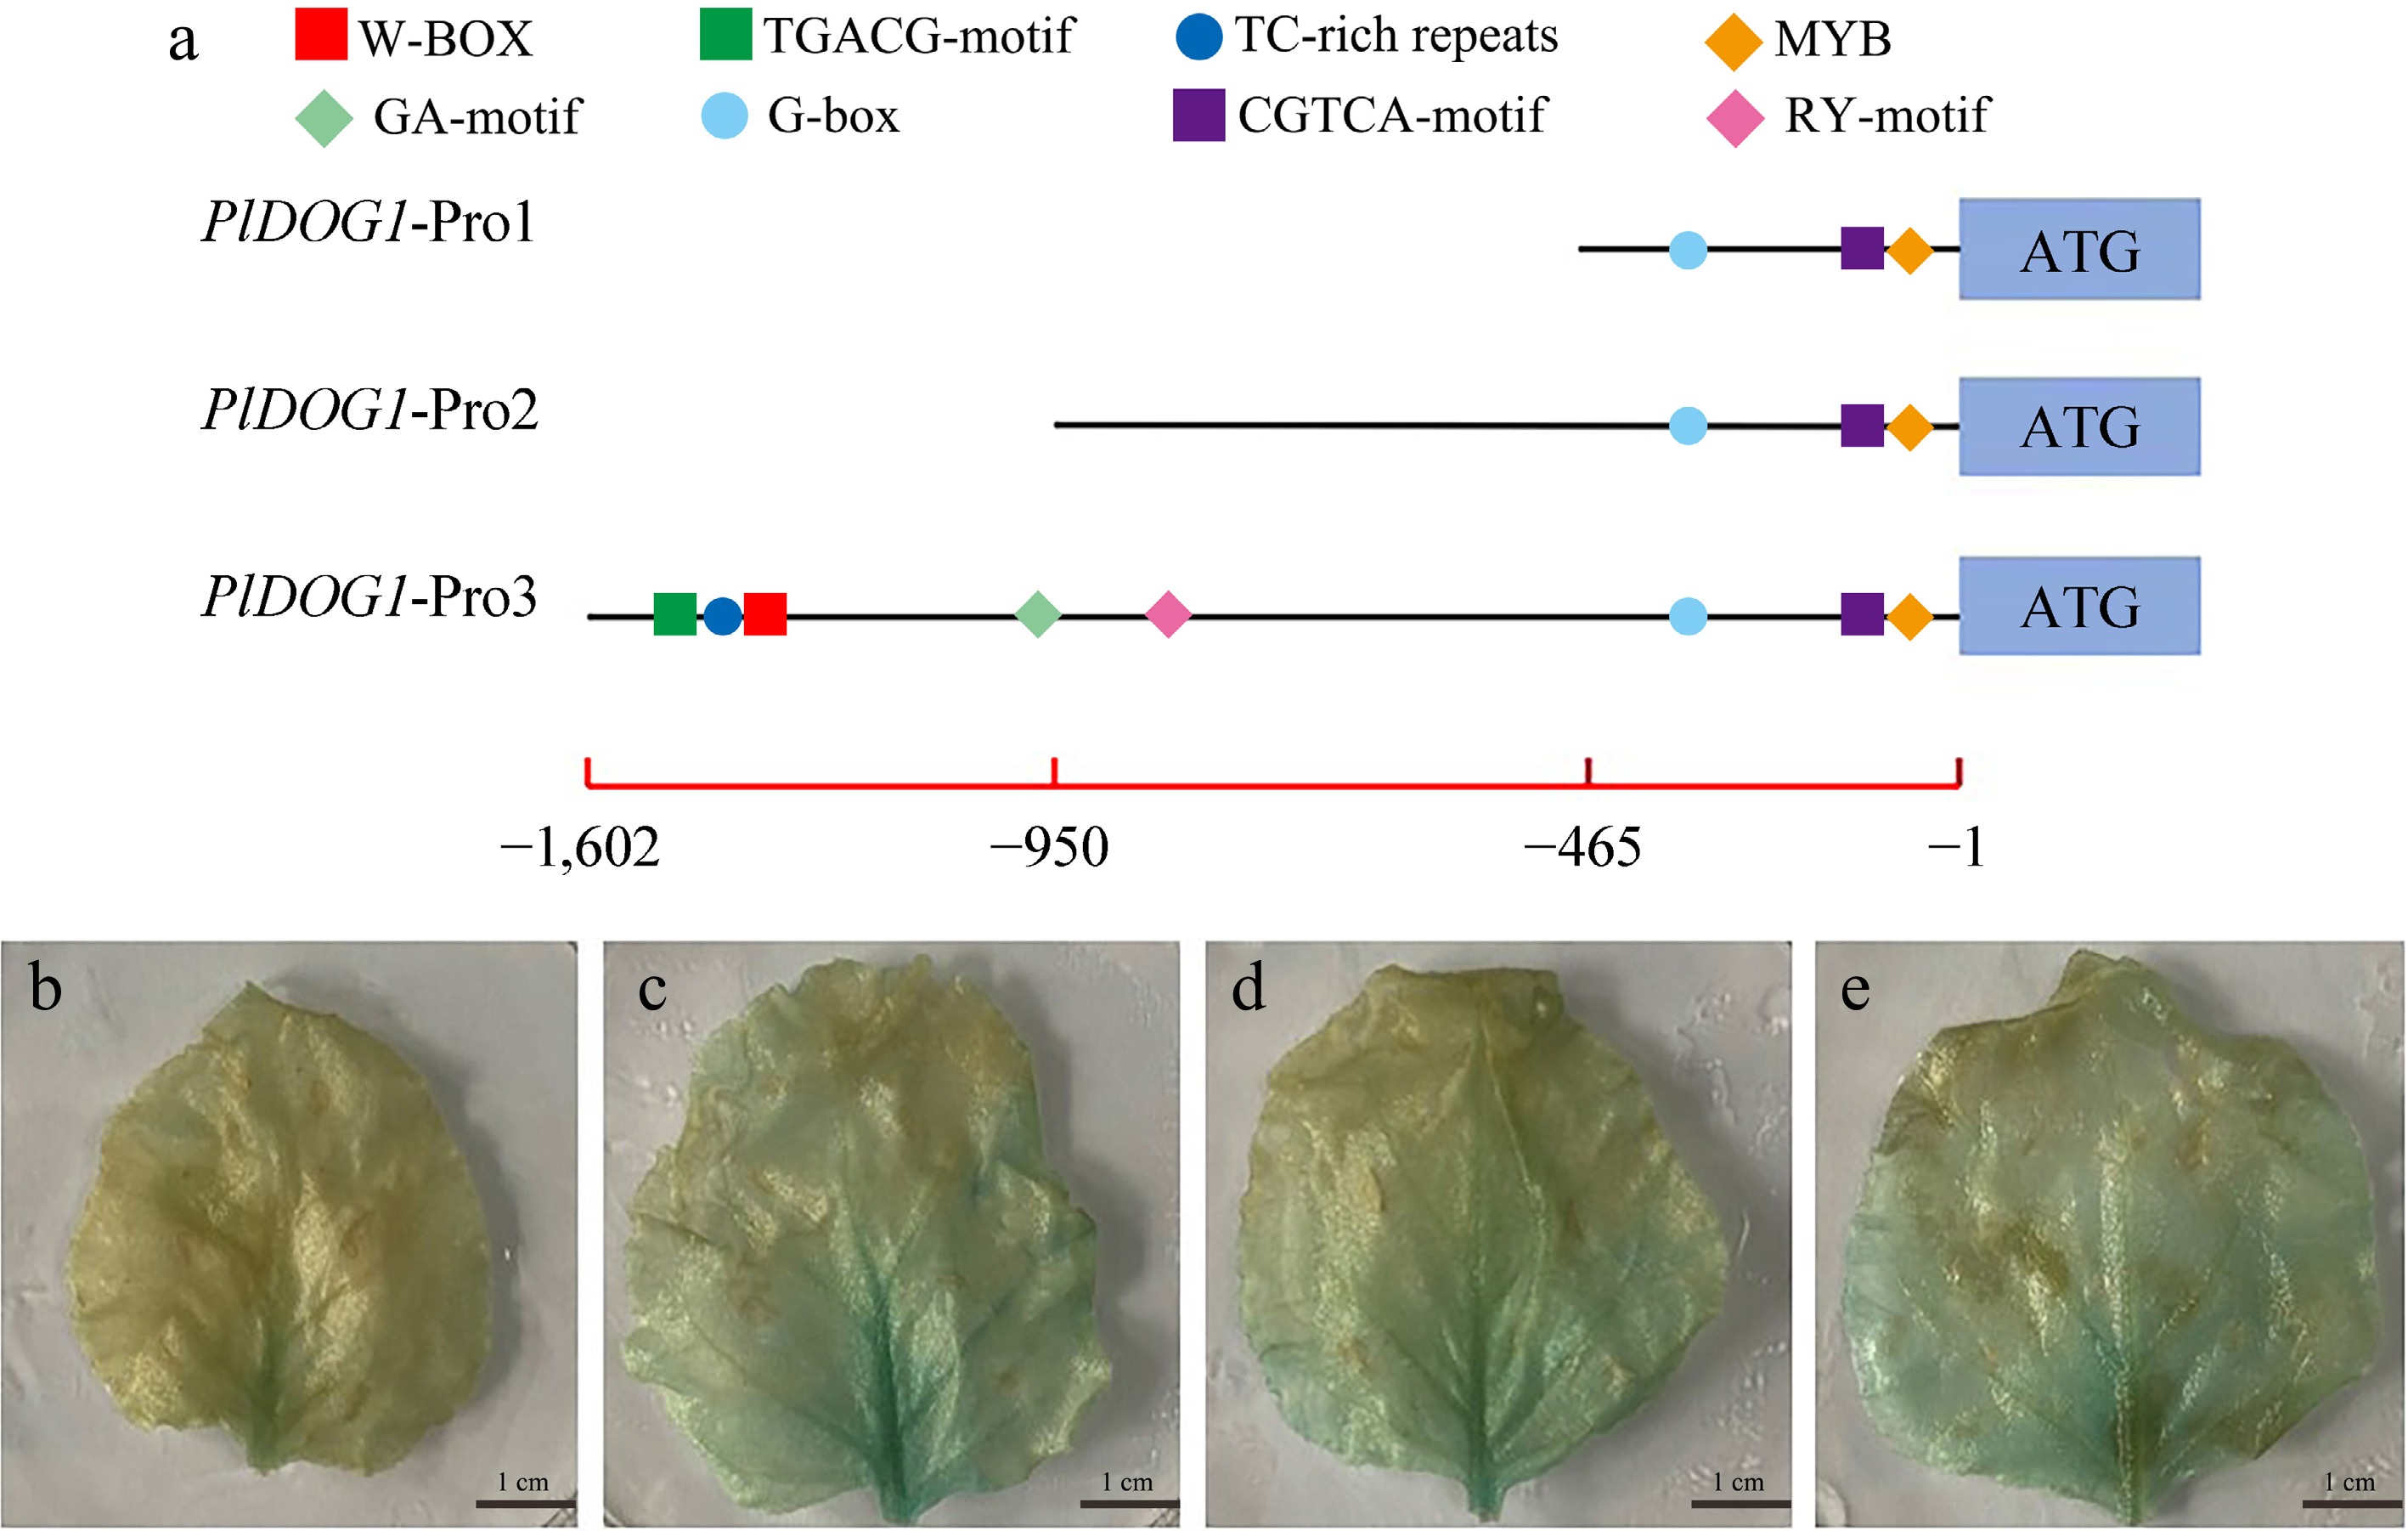
Figure 4.
Analysis of promoter activity of PlDOG1 promoter. (a) Schematic diagram of the absence of the 5' end of the PlDOG1 promoter sequence. GUS gene expression driven by different promoter sequences in healthy tobacco leaves: (b) 35S promoter, (c) PlDOG1-Pro1, (d) PlDOG1-Pro2, (e) PlDOG1-Pro3. Bars: 1 cm.
-
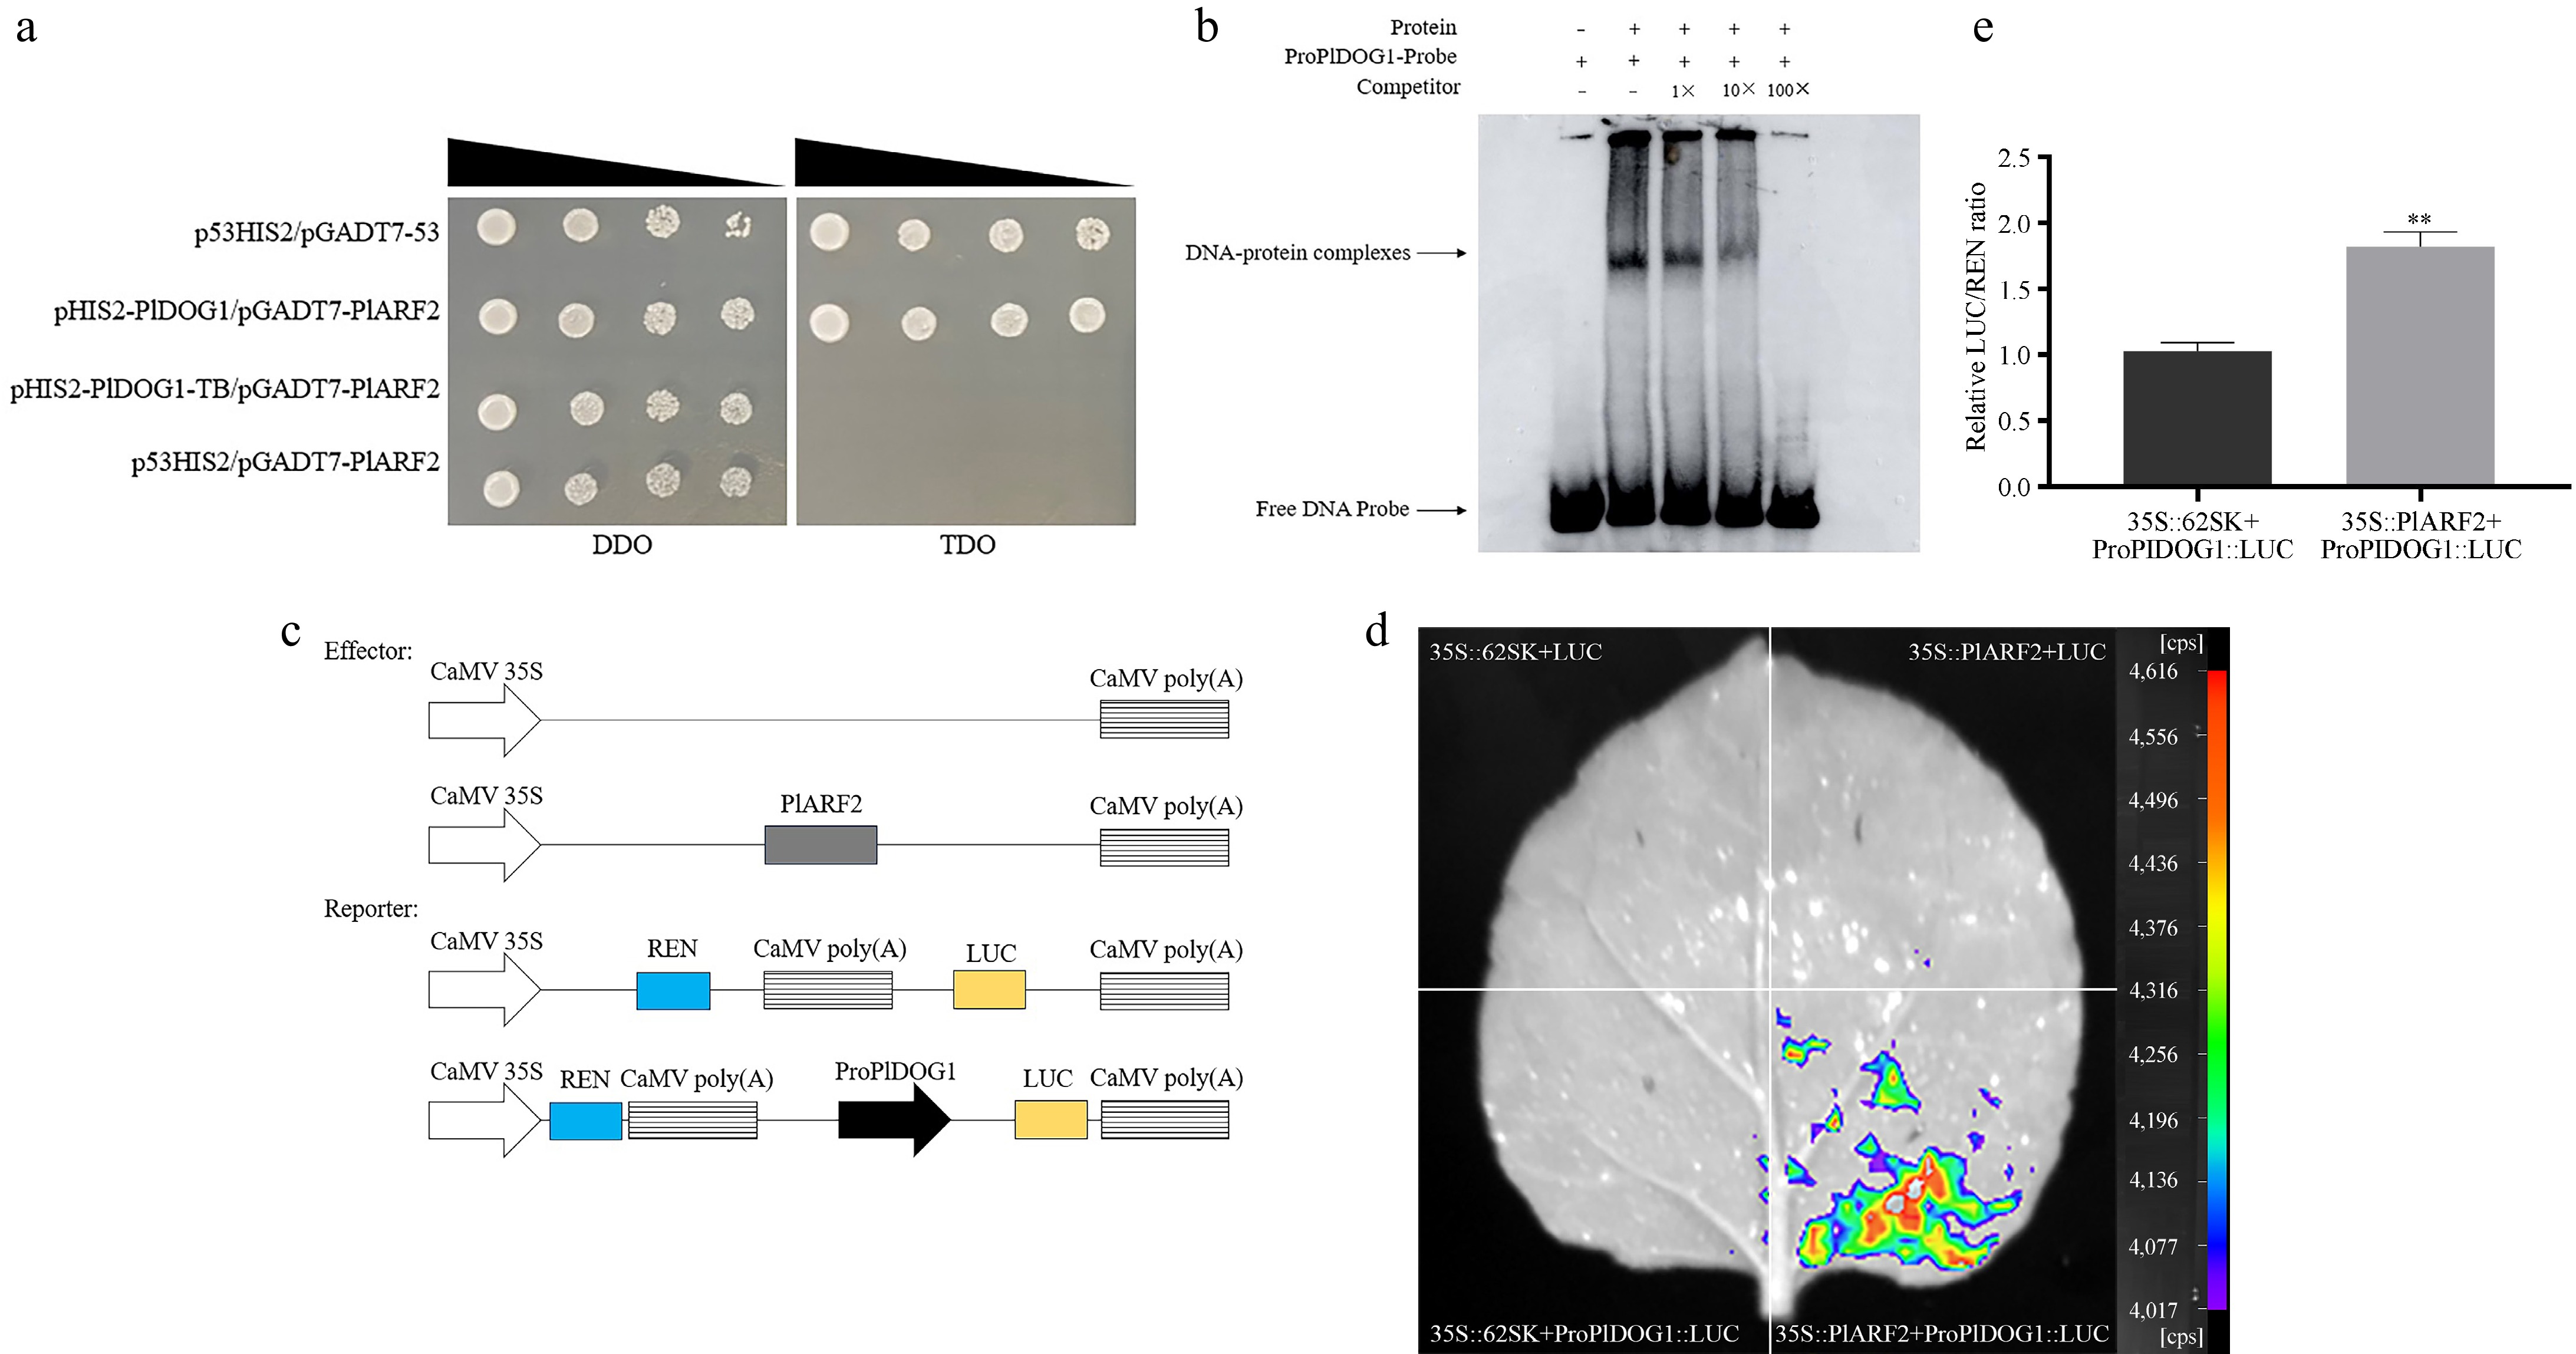
Figure 5.
Identification of the binding between PlARF2 and the PlDOG1 promoter. (a) The association of PlARF2 with the PlDOG1 promoter determination by using the Y1H system. p53HIS2/pGADT7-53 was the positive control group, pHIS2-PlDOG1/pGADT7-PlARF2 was the experimental group, pHIS2-PlDOG1-TB /pGADT7-PlARF2 was the mutant group, and p53HIS2/pGADT7-PlARF2 was the negative control group. Yeast transformants were serially diluted (1/1, 1/10, 1/100, 1/1000) and plated on TDO selective medium lacking Leucine, Tryptophan, and Histidine, supplemented with 50 mM 3-AT for identification. Parallel cultures grown on DDO medium without Tryptophan and Leucine served as growth controls. (b) EMSA analysis of PlARF2 combined with the promoter of PlDOG1. (c) Diagrammatic representation of Effector and Reporter assembly. (d) LUC fluorescence was detected using a live plant imaging system. (e) Analysis of the relative LUC/REN value. Asterisks in each column denote significant differences (p < 0.01).
-
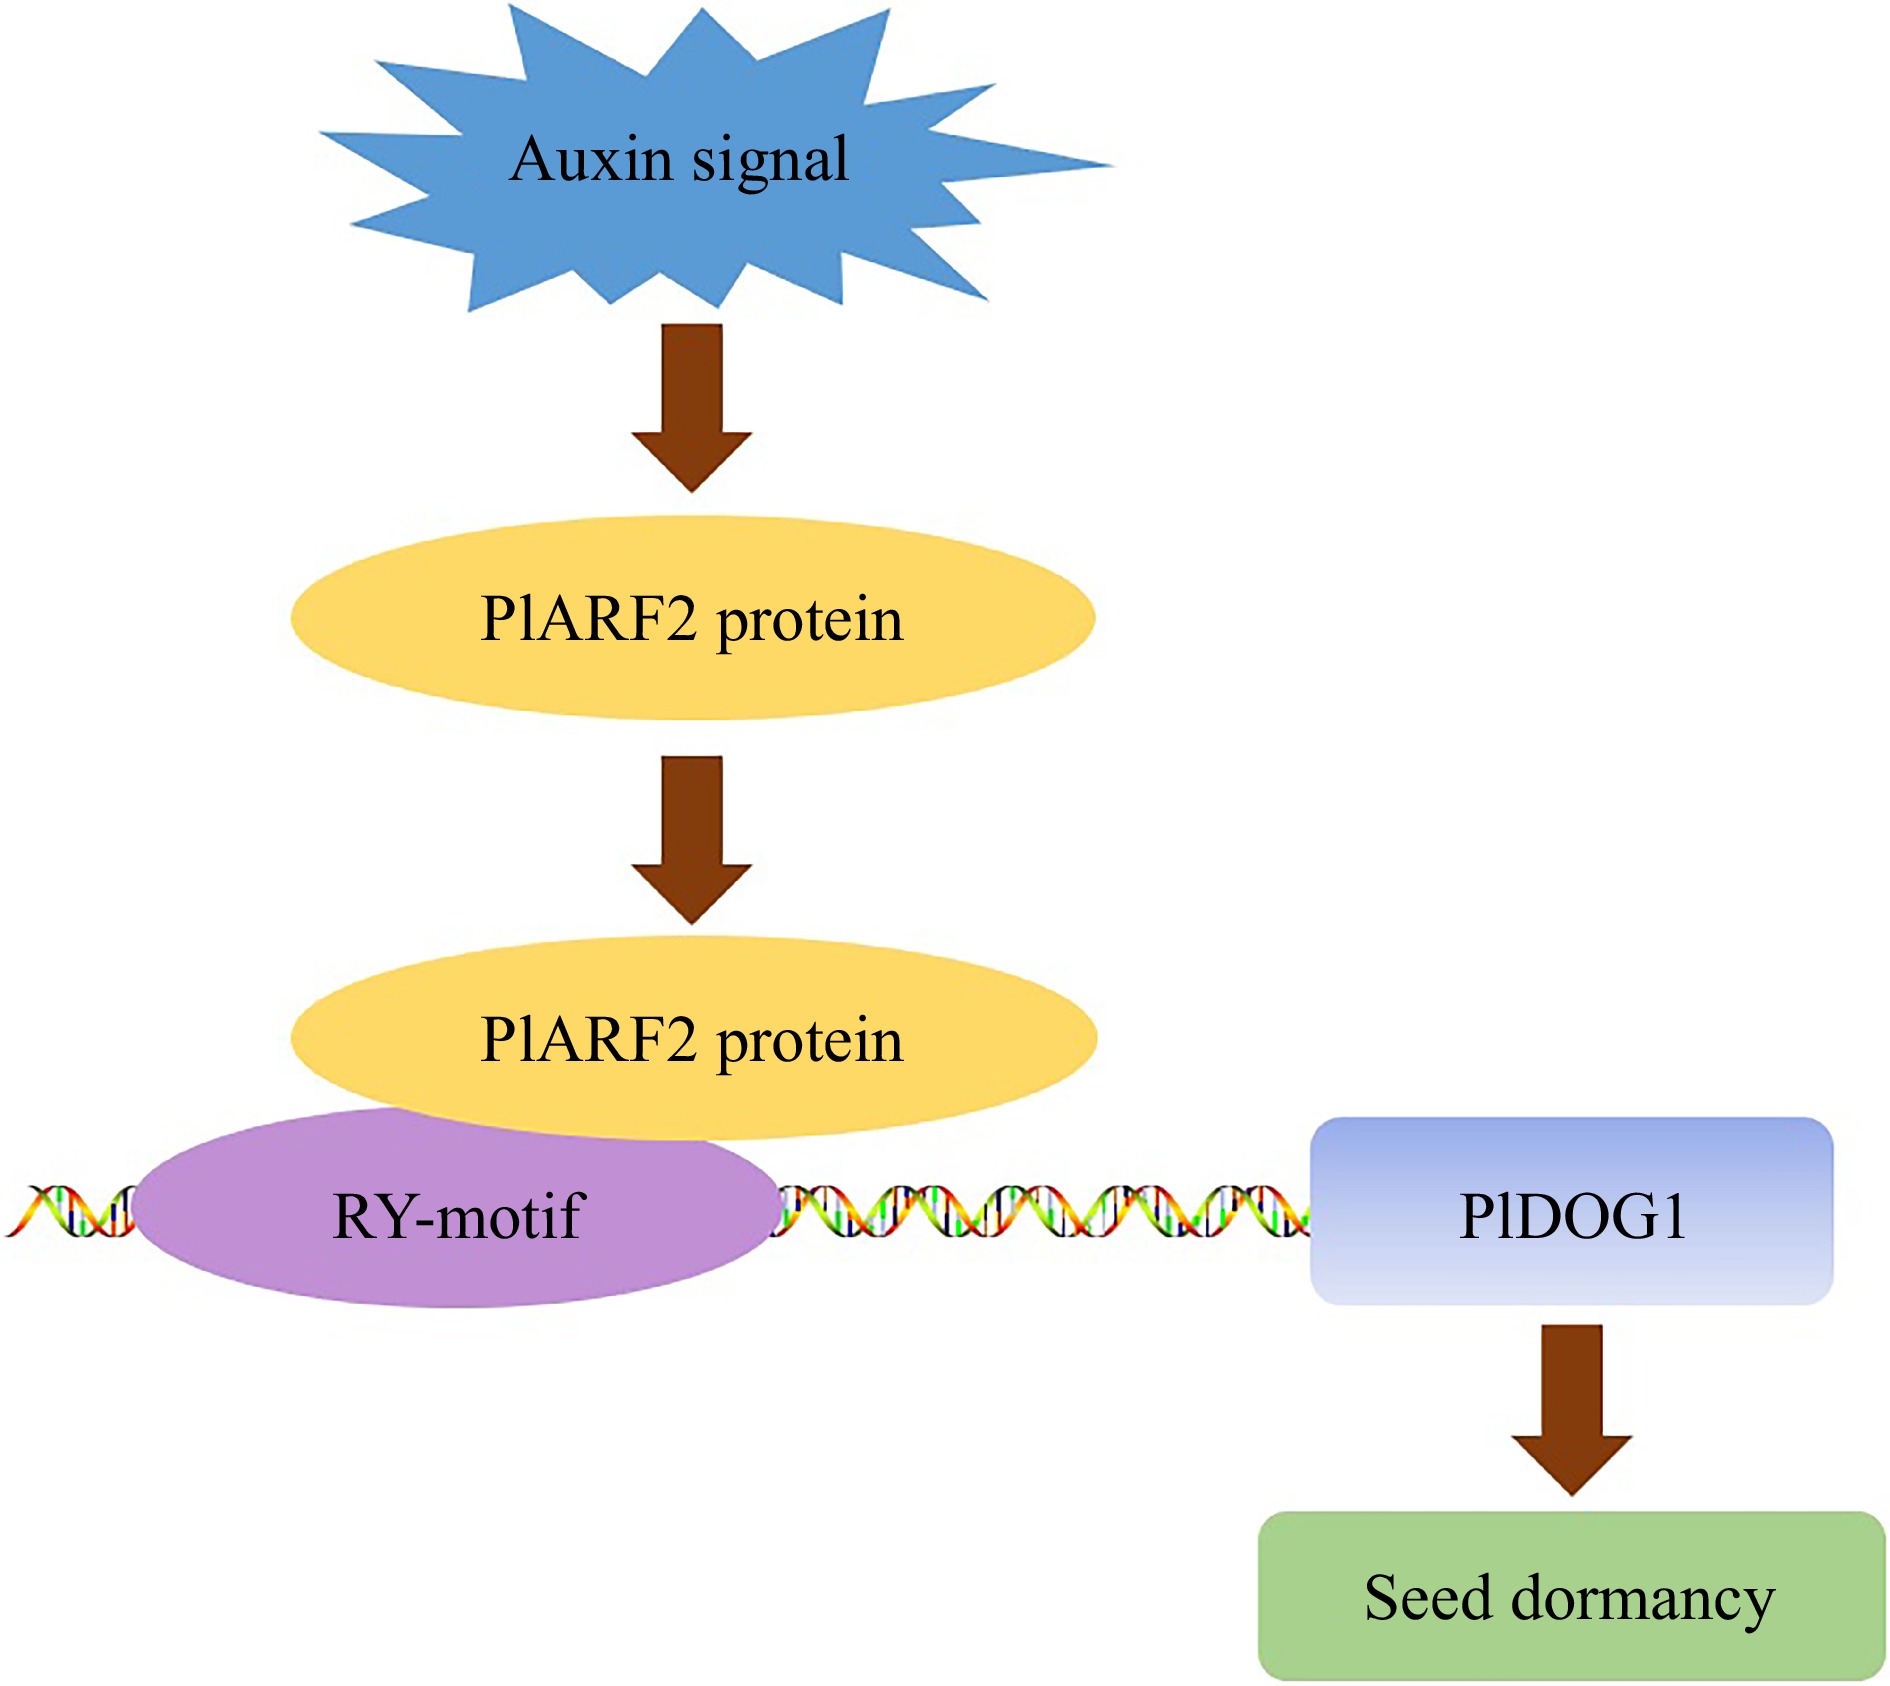
Figure 6.
A proposed model illustrates that PlDOG1 regulates seed dormancy through binding to PlARF2. Auxin signals trigger the expression of PlARF2, and then the PlARF2 protein binds to the PlDOG1 promoter to regulate seed dormancy.
-
Motif name Sequence Site Function RY-motif CATGCAT +517 Seed formation, development,
and dormancyCGTCA-motif CGTCA +1,453 MeJA-responsiveness G-box CACGAC +1,262 Light responsive element GA-motif ATAGATAA −990 Light responsive element MYB TAACCA +1,548 Light responsive element TC-rich repeats GTTTTCTTAC −1,241 Protective and stress response mechanisms TGACG-motif TGACG −1,453 MeJA-responsiveness W-box TTGACC +381 Abiotic stress response Table 1.
Important motifs contained in the PlDOG1 promoter sequence.
Figures
(6)
Tables
(1)