-
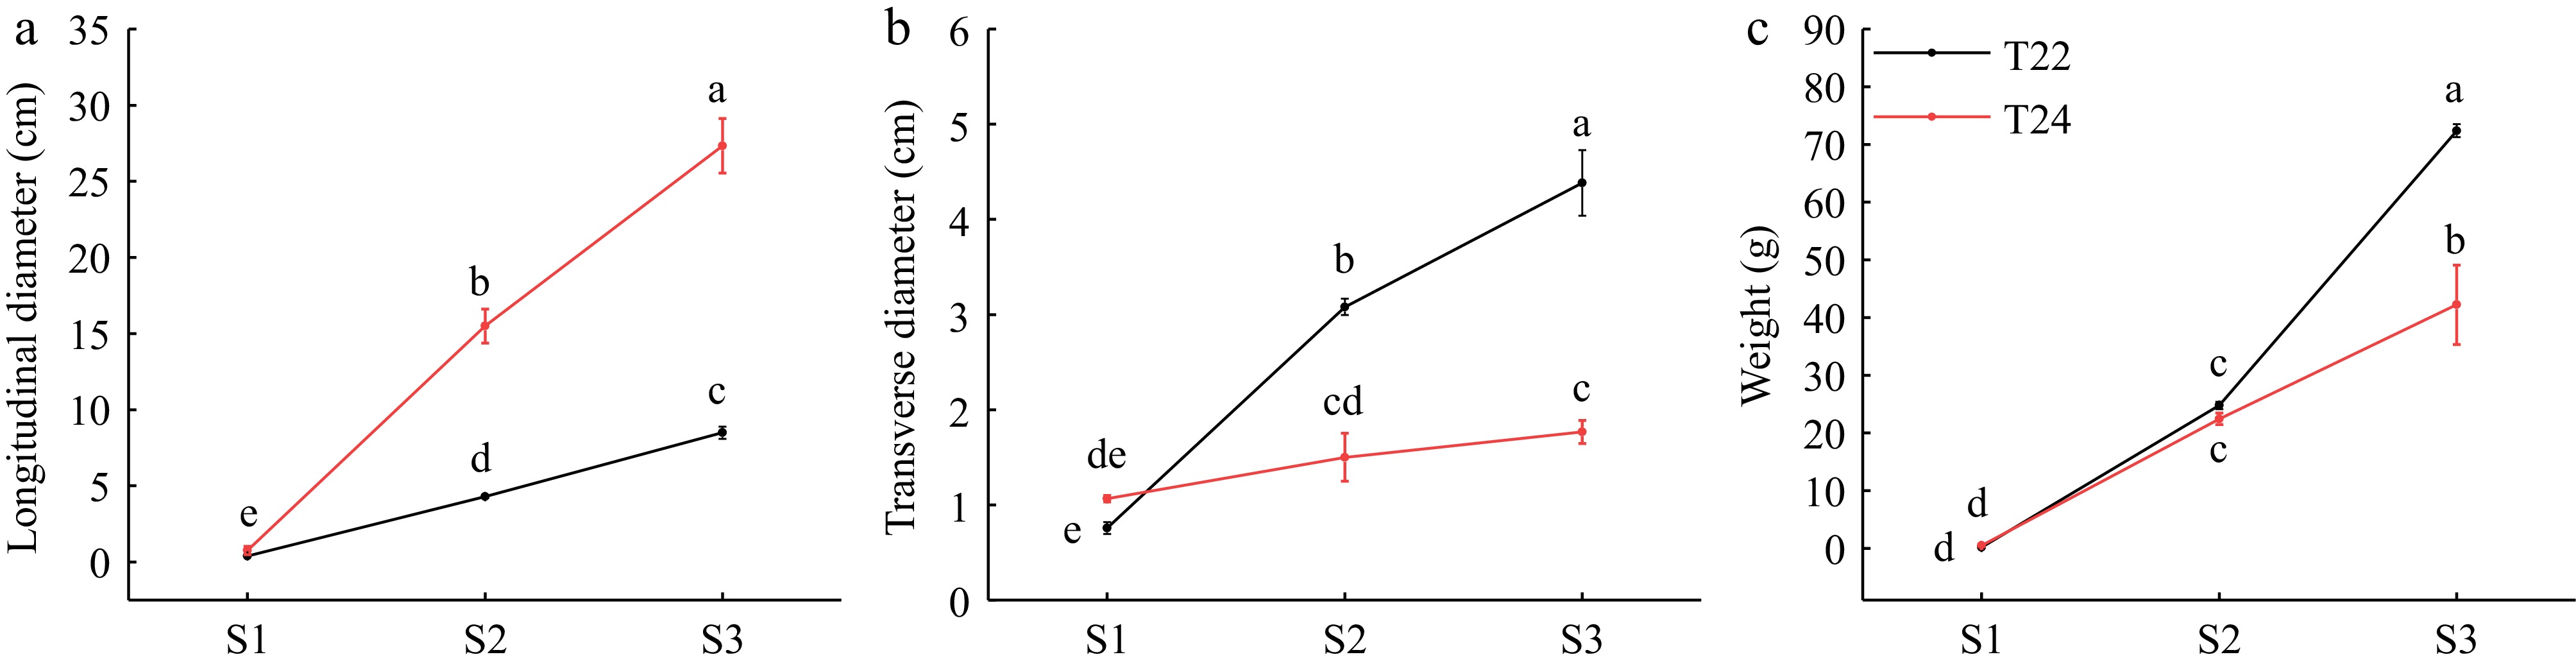
Figure 1.
(a) Longitudinal diameters, (b) transverse diameters, and (c) weights of taro cormel at the different expansion stages in T22 and T24. Data are means (± SE) from at least three biological replicates. Different letters indicate significant differences between means as determined using ANOVA followed by Duncan's multiple range test (p-value < 0.05).
-
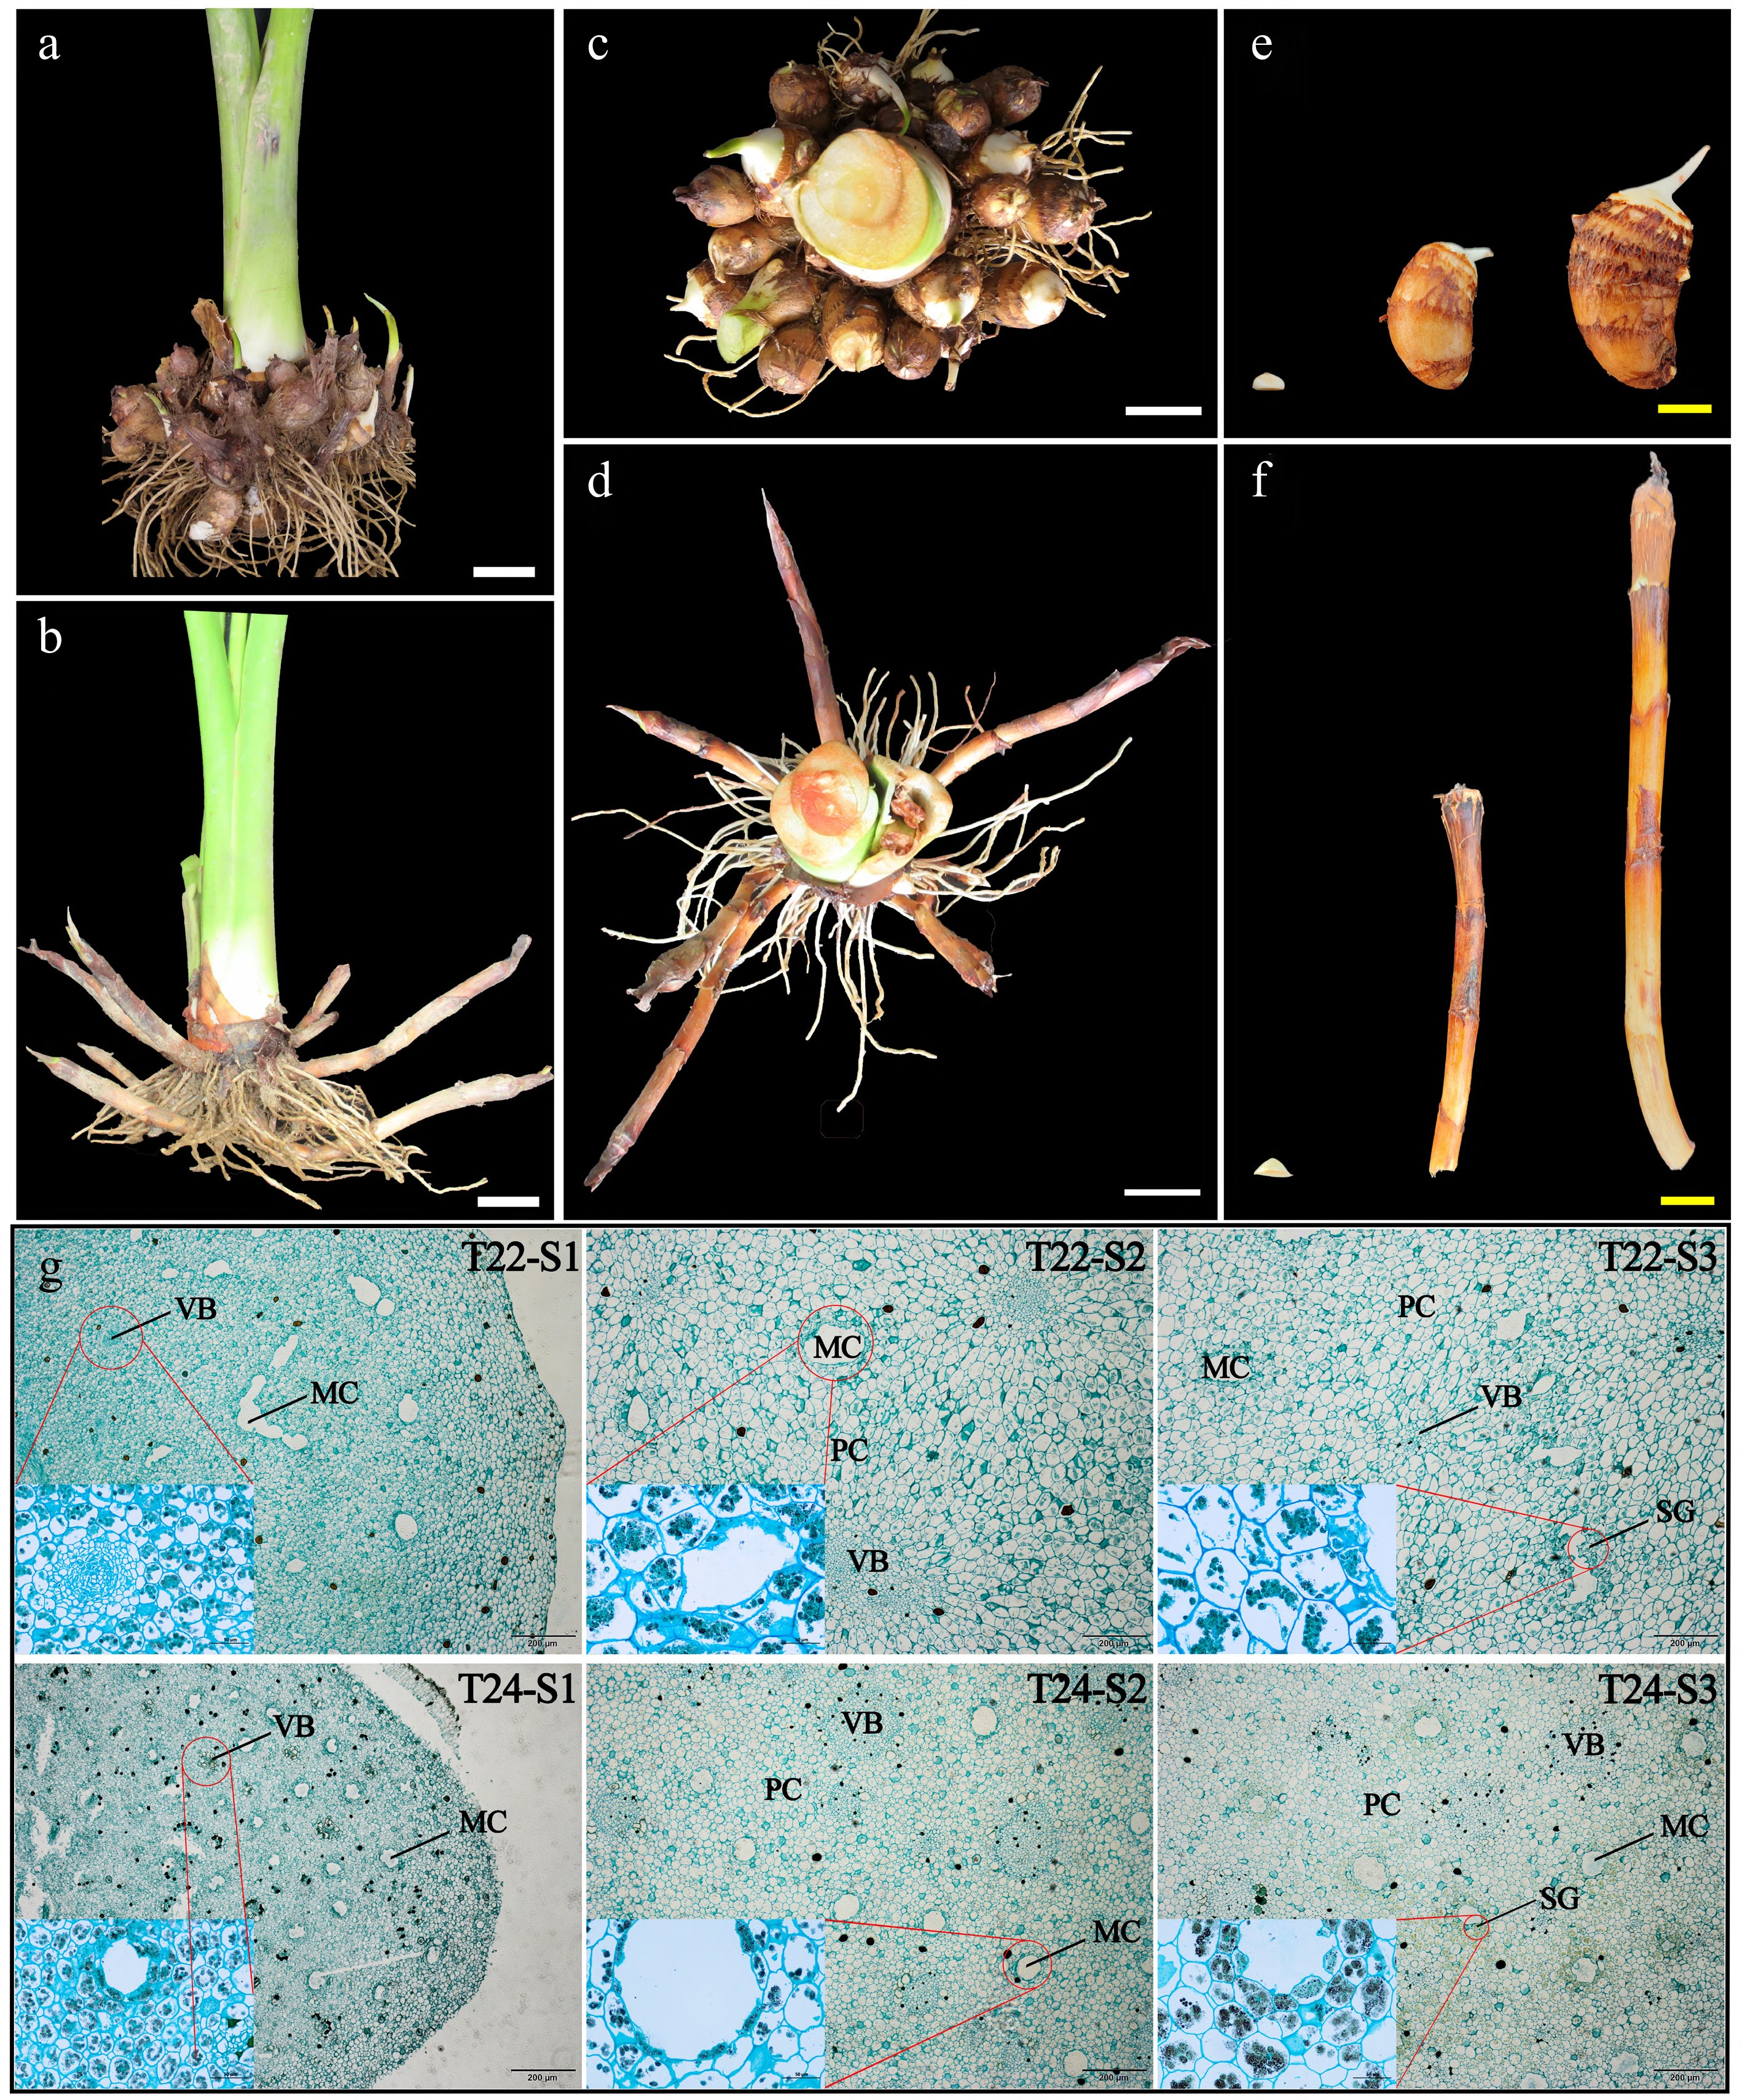
Figure 2.
Phenotypic changes and microscopy observation of taro cormel. (a)−(d) The global state of underground taro (T22 and T24) growth at maturity and taro cormels of (e) T22, and (f) T24 dug out at 8−10 d, 50−60 d, and 90−100 d. White bars = 5 cm and yellow bars = 2 cm. Sections of taro cormels at different expansion stages stained by potassium iodide and solid green from (g) T22 and T24, respectively. MC: mucilage cavities; VB: vascular bundles; PC: parenchyma cells; SG: starch granules.
-
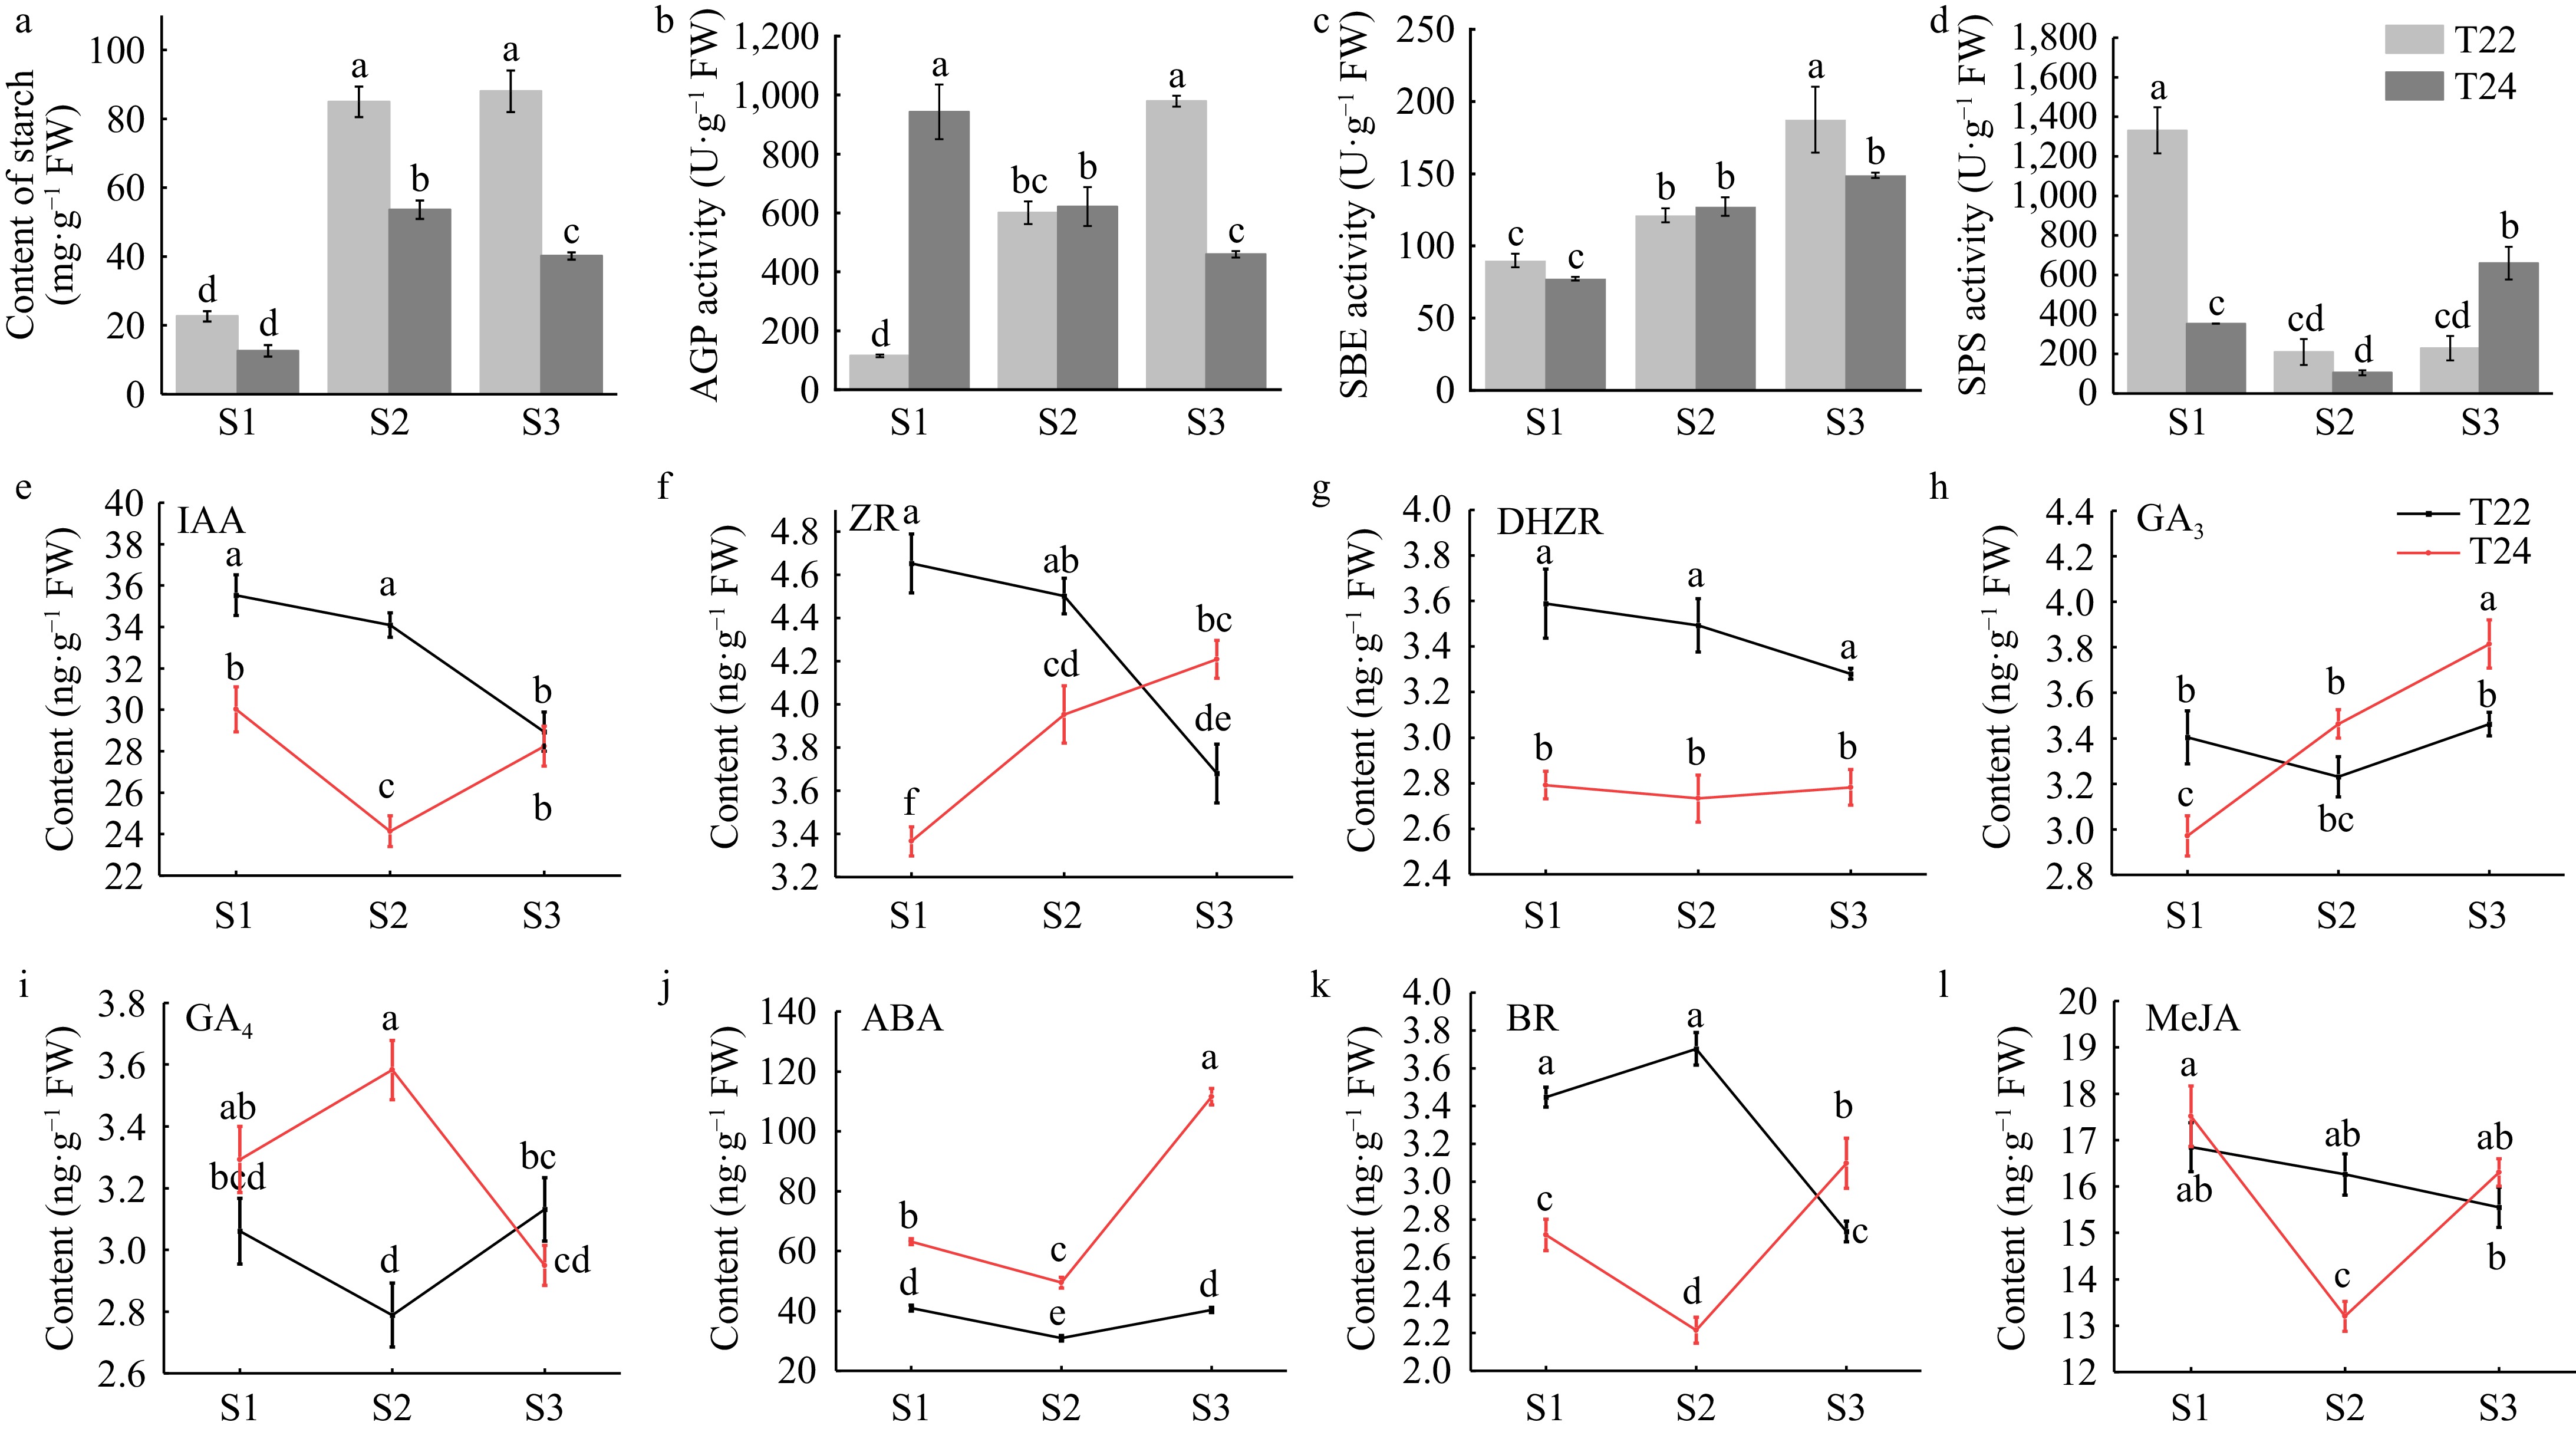
Figure 3.
Trends in starch content, starch synthesis enzymes and phytohormone levels during taro cormel expansion. Content of (a) starch at the different stages of taro cormel expansion. (b) AGP activity, (c) SBE activity, and (d) SPS activity were extracted at the different cormel expansion stages. (e) Endogenous IAA, (f) ZR, (g) DHZR, (h) GA3, (i) GA4, (j) ABA, (k) BR, and (l) MeJA levels at the different cormel expansion stages. Data are means (± SE) from at least three biological replicates. Different letters indicate significant differences between means as determined using ANOVA followed by Duncan's multiple range test (p-value < 0.05).
-
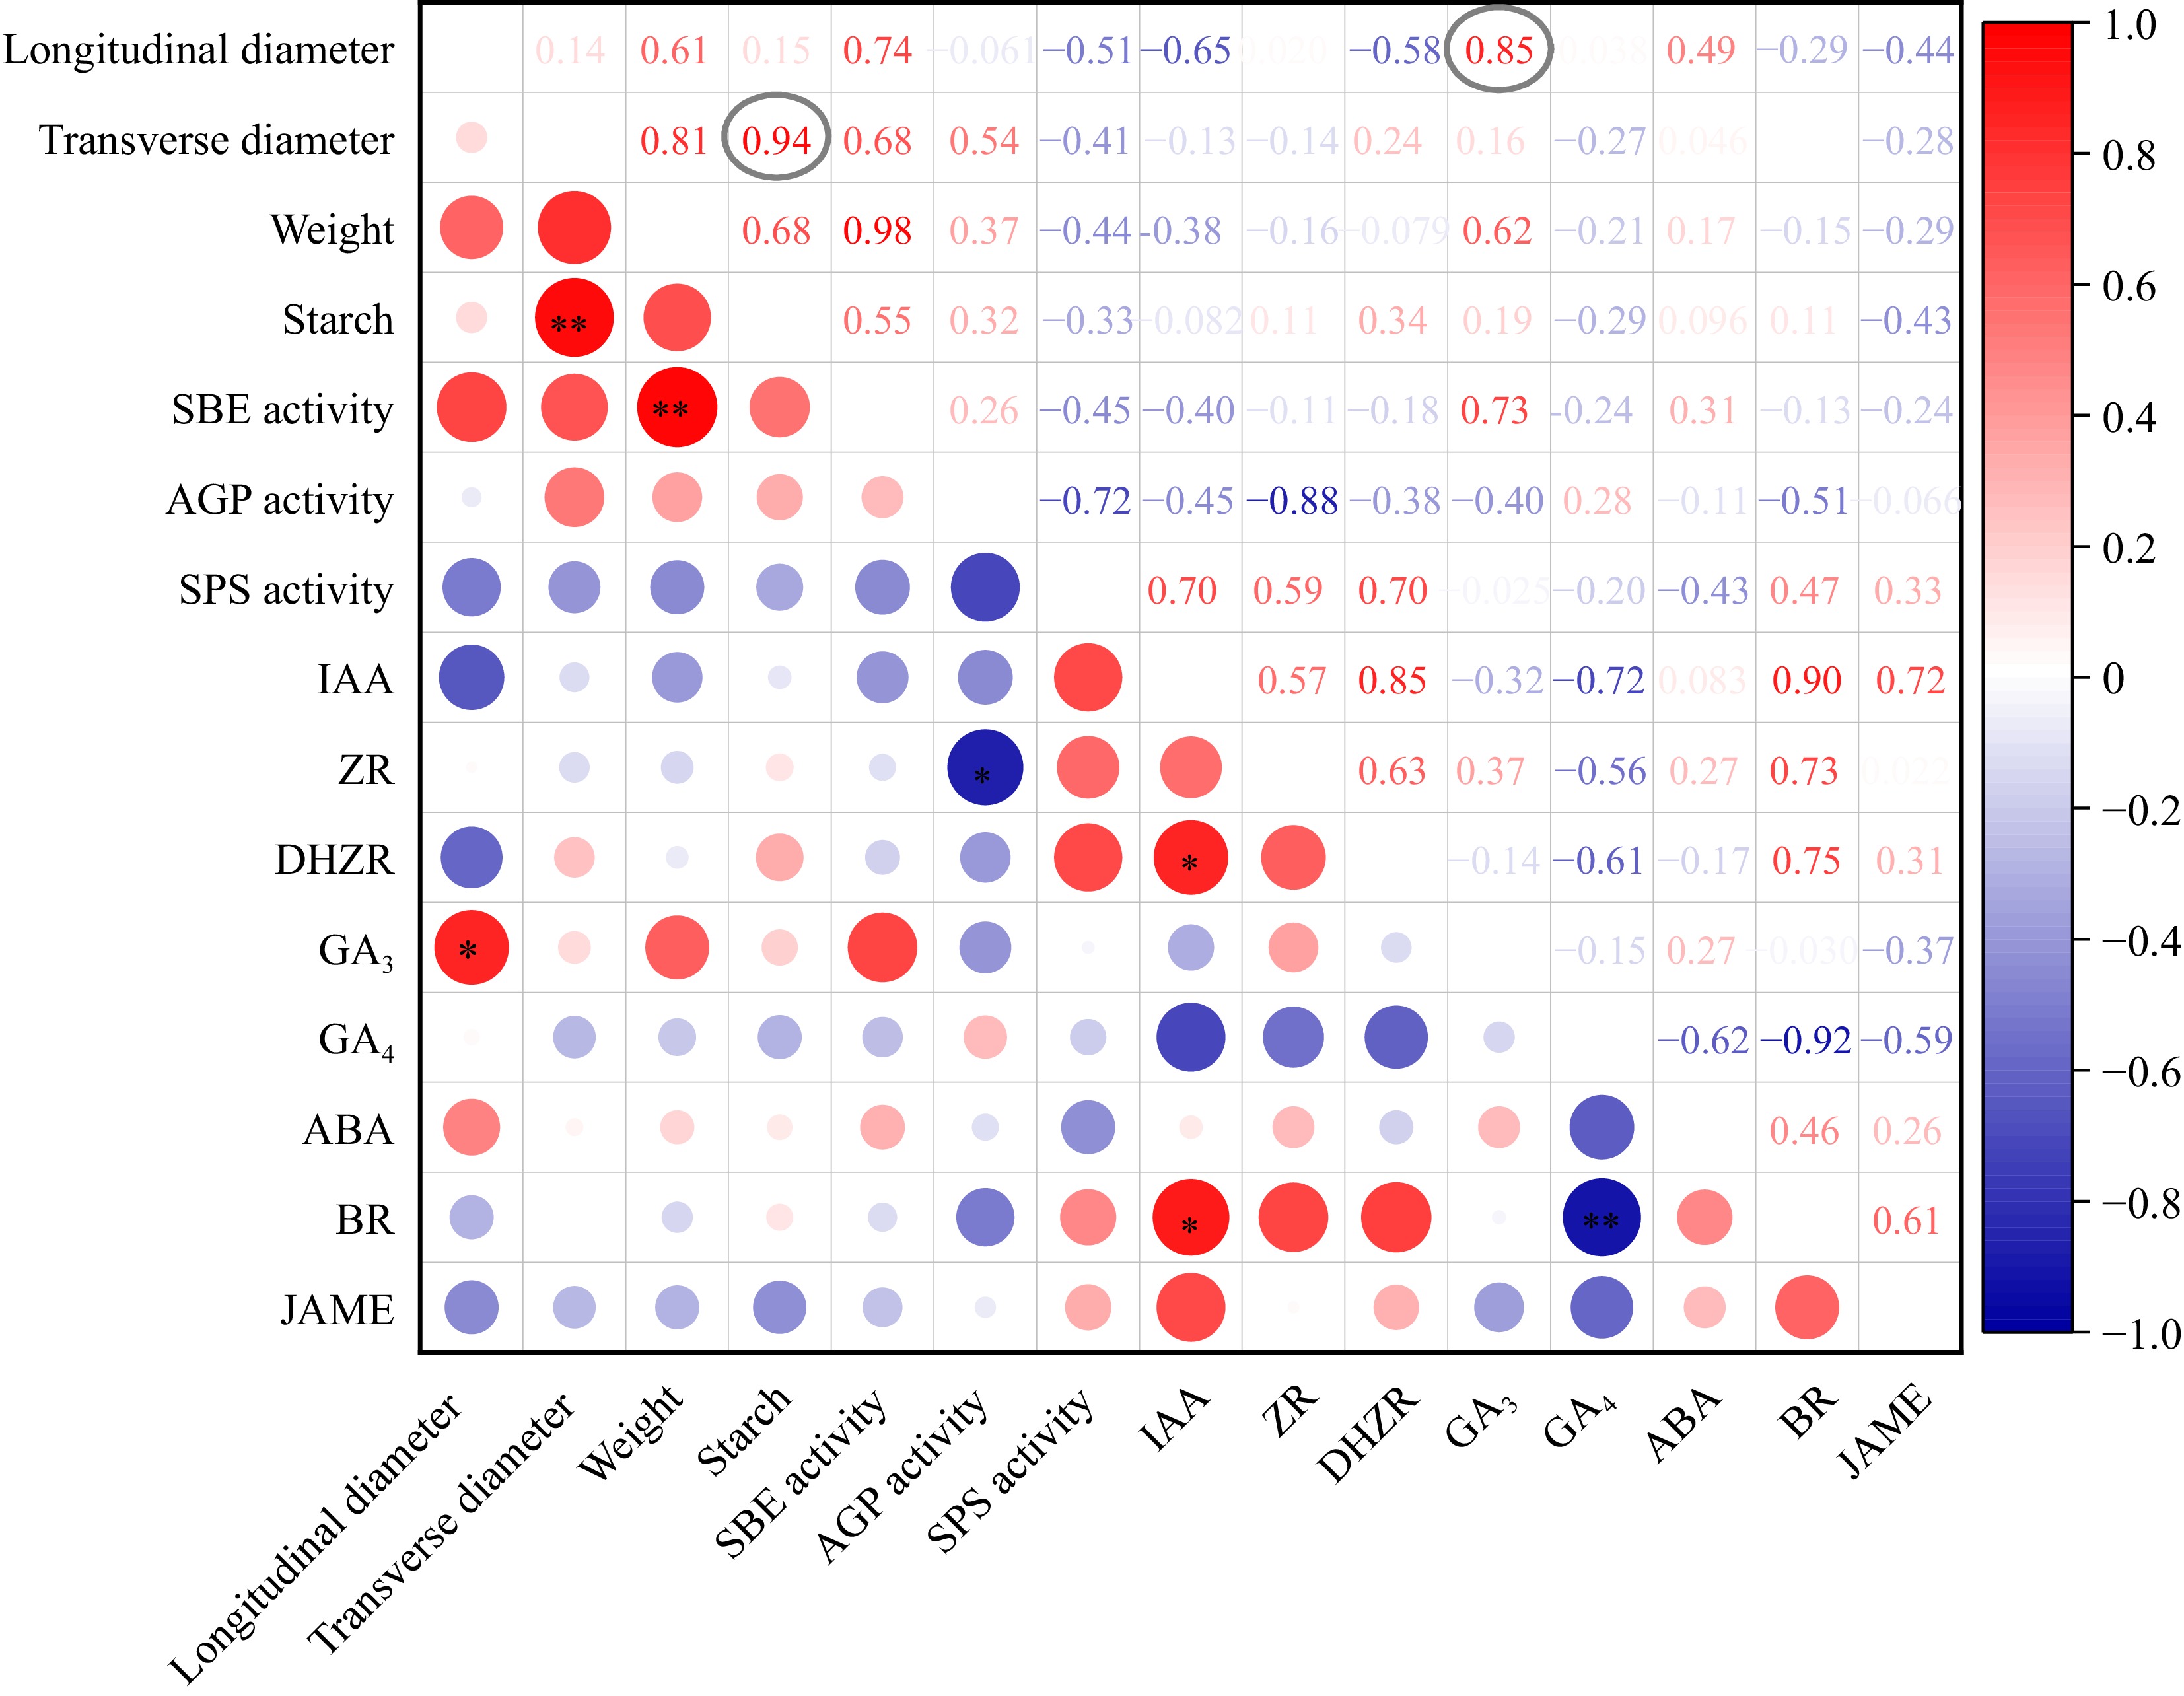
Figure 4.
The correlation analysis of taro cormel phenotype, starch content and phytohormone levels. The Pearson correlation coefficients are colored in red and blue for high and low coefficient between two indexes. The cycle size represented the significance level. * Indicates that the coefficients were significantly enriched at the 0.05 level. ** Indicates that the coefficients were significantly enriched at the 0.01 level.
-
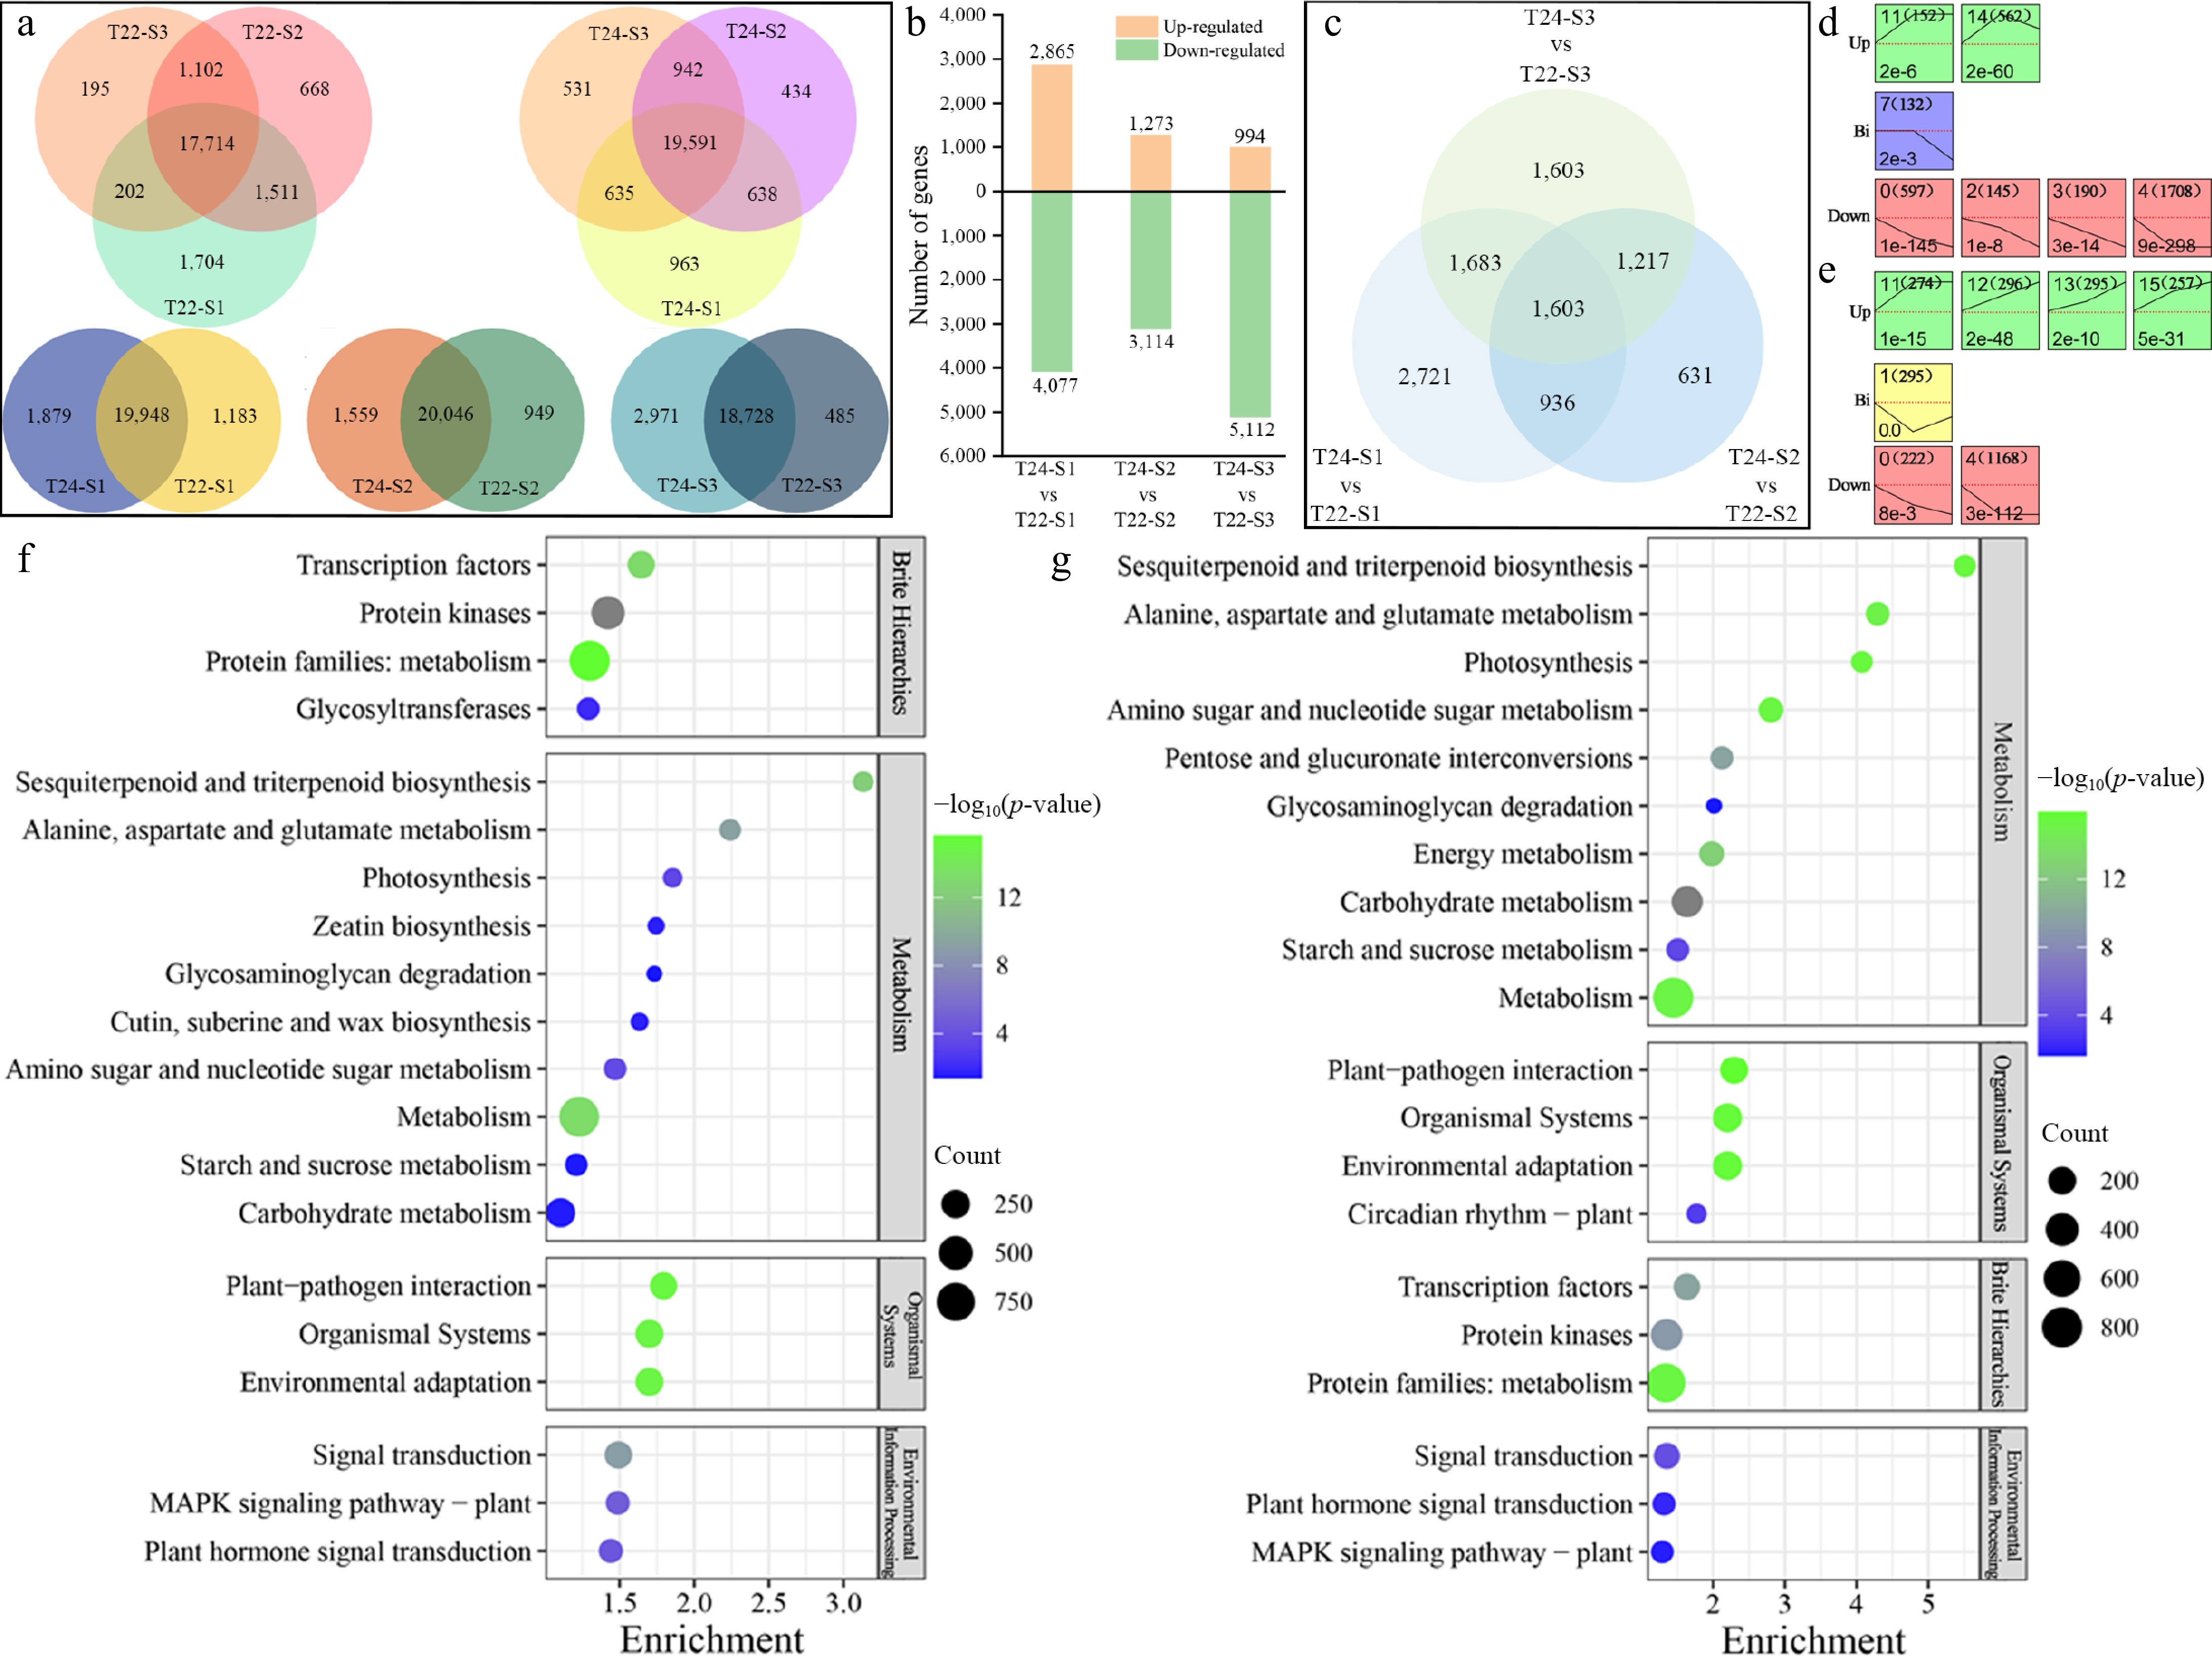
Figure 5.
Detection and analysis of DEGs during taro cormel expansion. (a) Venn diagram showing the numbers of unique and overlapping expressed genes at different stages and in the same stage with T22 and T24. (b) Histogram showing the number of DEGs that were up-regulated and down-regulated in pairwise comparisons. (c) Venn diagram showing the DEGs at different pairwise comparisons. Significantly enriched profiles (p-value < 0.05) during taro cormel expansion as revealed by Short Time-Series Expression Miner analysis. Profiles in (d) T22, and (e) T24. The profiles were classified into three groups, Up (Up-regulated), Bi (Biphasic expression pattern), and Down (Down-regulated). Their profile number following with the number of DEGs in the bracket are shown in the top left-hand corner. The p-value assigned to each profile is shown in the bottom left-hand corner. Significantly different profiles are represented by different background colors. KEGG pathway enrichment analysis of the DEGs profiles in (f) T22, and (g) T24.
-
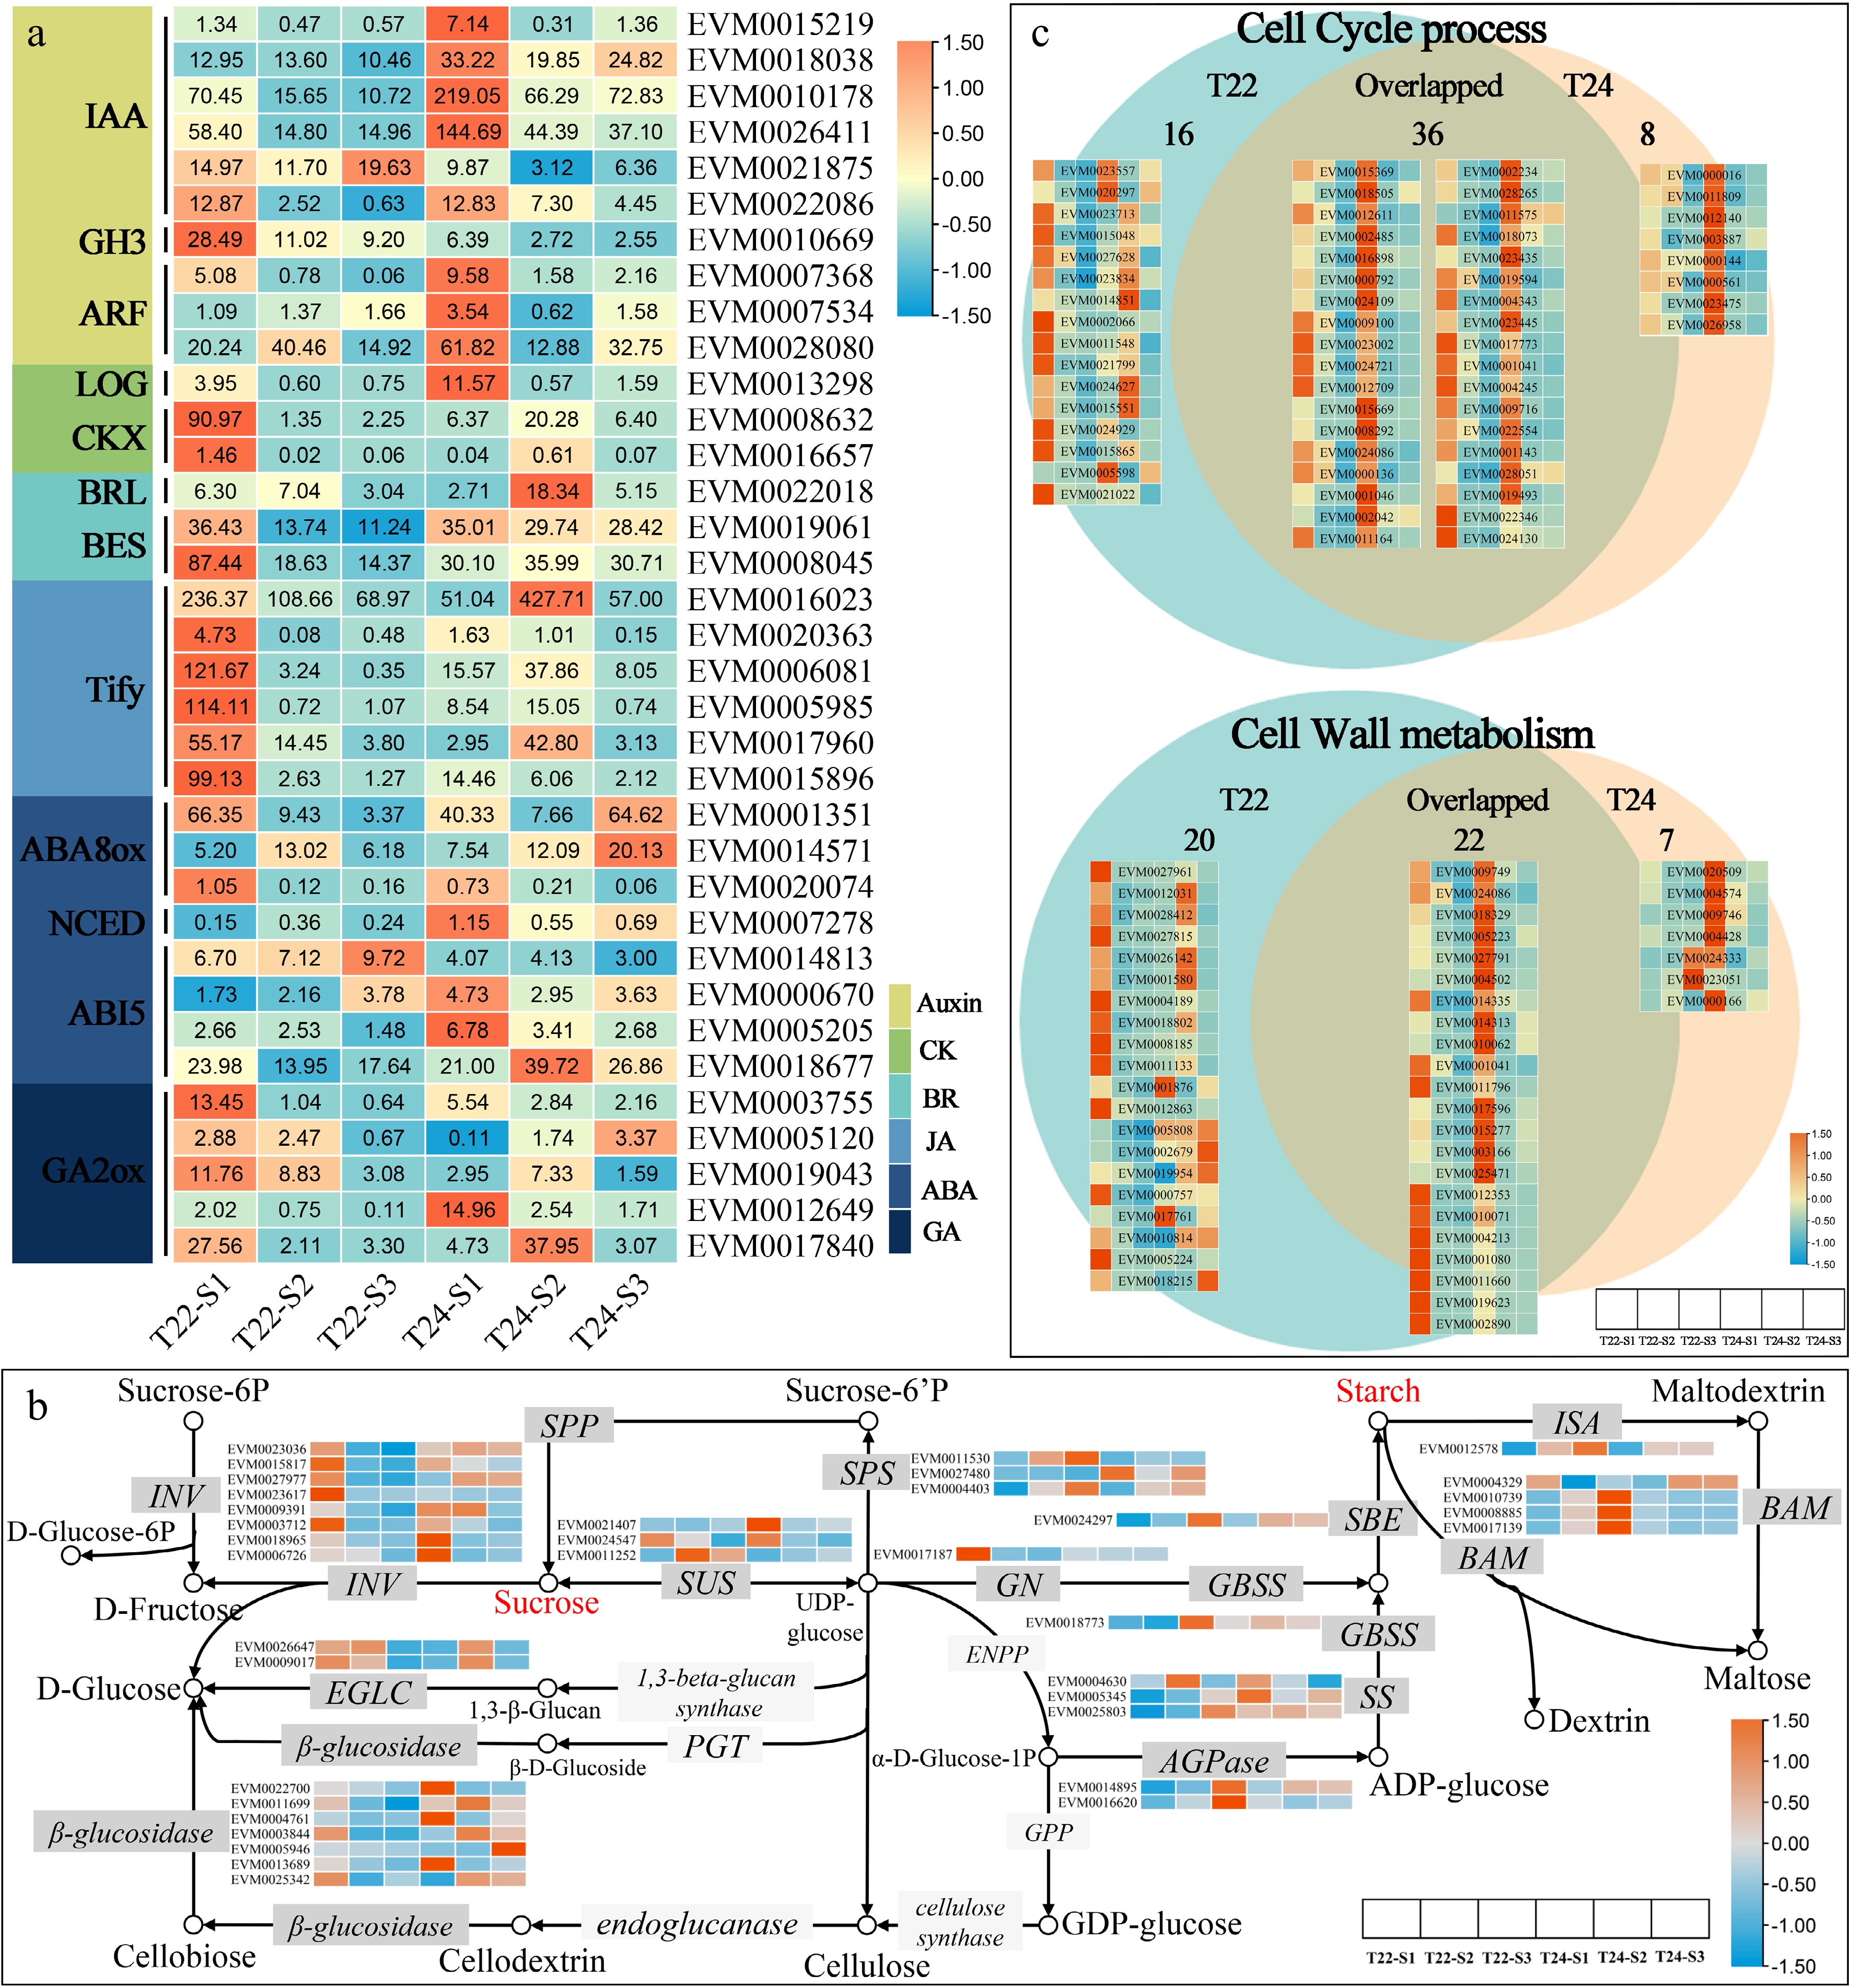
Figure 6.
Expression patterns of DEGs assigned to plant hormone transduction pathway, sucrose and starch metabolism and cell process. (a) Heat maps of gene sets associated with hormone (Auxin, CK, BR, JA, ABA, and GA). The expression levels are log-transformed and colored in orange and blue for high and low expression, respectively. (b) The expression patterns of DEGs assigned to starch and sucrose metabolism in T22 and T24 during taro cormel expansion. The expression values were log-transformed and ranged from −1.5 to 1.5 after normalization. The box with dark grey and light grey colors indicated enzymes with and without transcriptional differentially expressed, respectively. (c) Venn diagram showing the numbers of unique and overlapping DEGs involved in cell cycle and cell wall metabolism between T22 and T24 with the gene expression heatmap. The expression levels are standardized by row scaled and colored in orange and cyan for high and low expression.
-
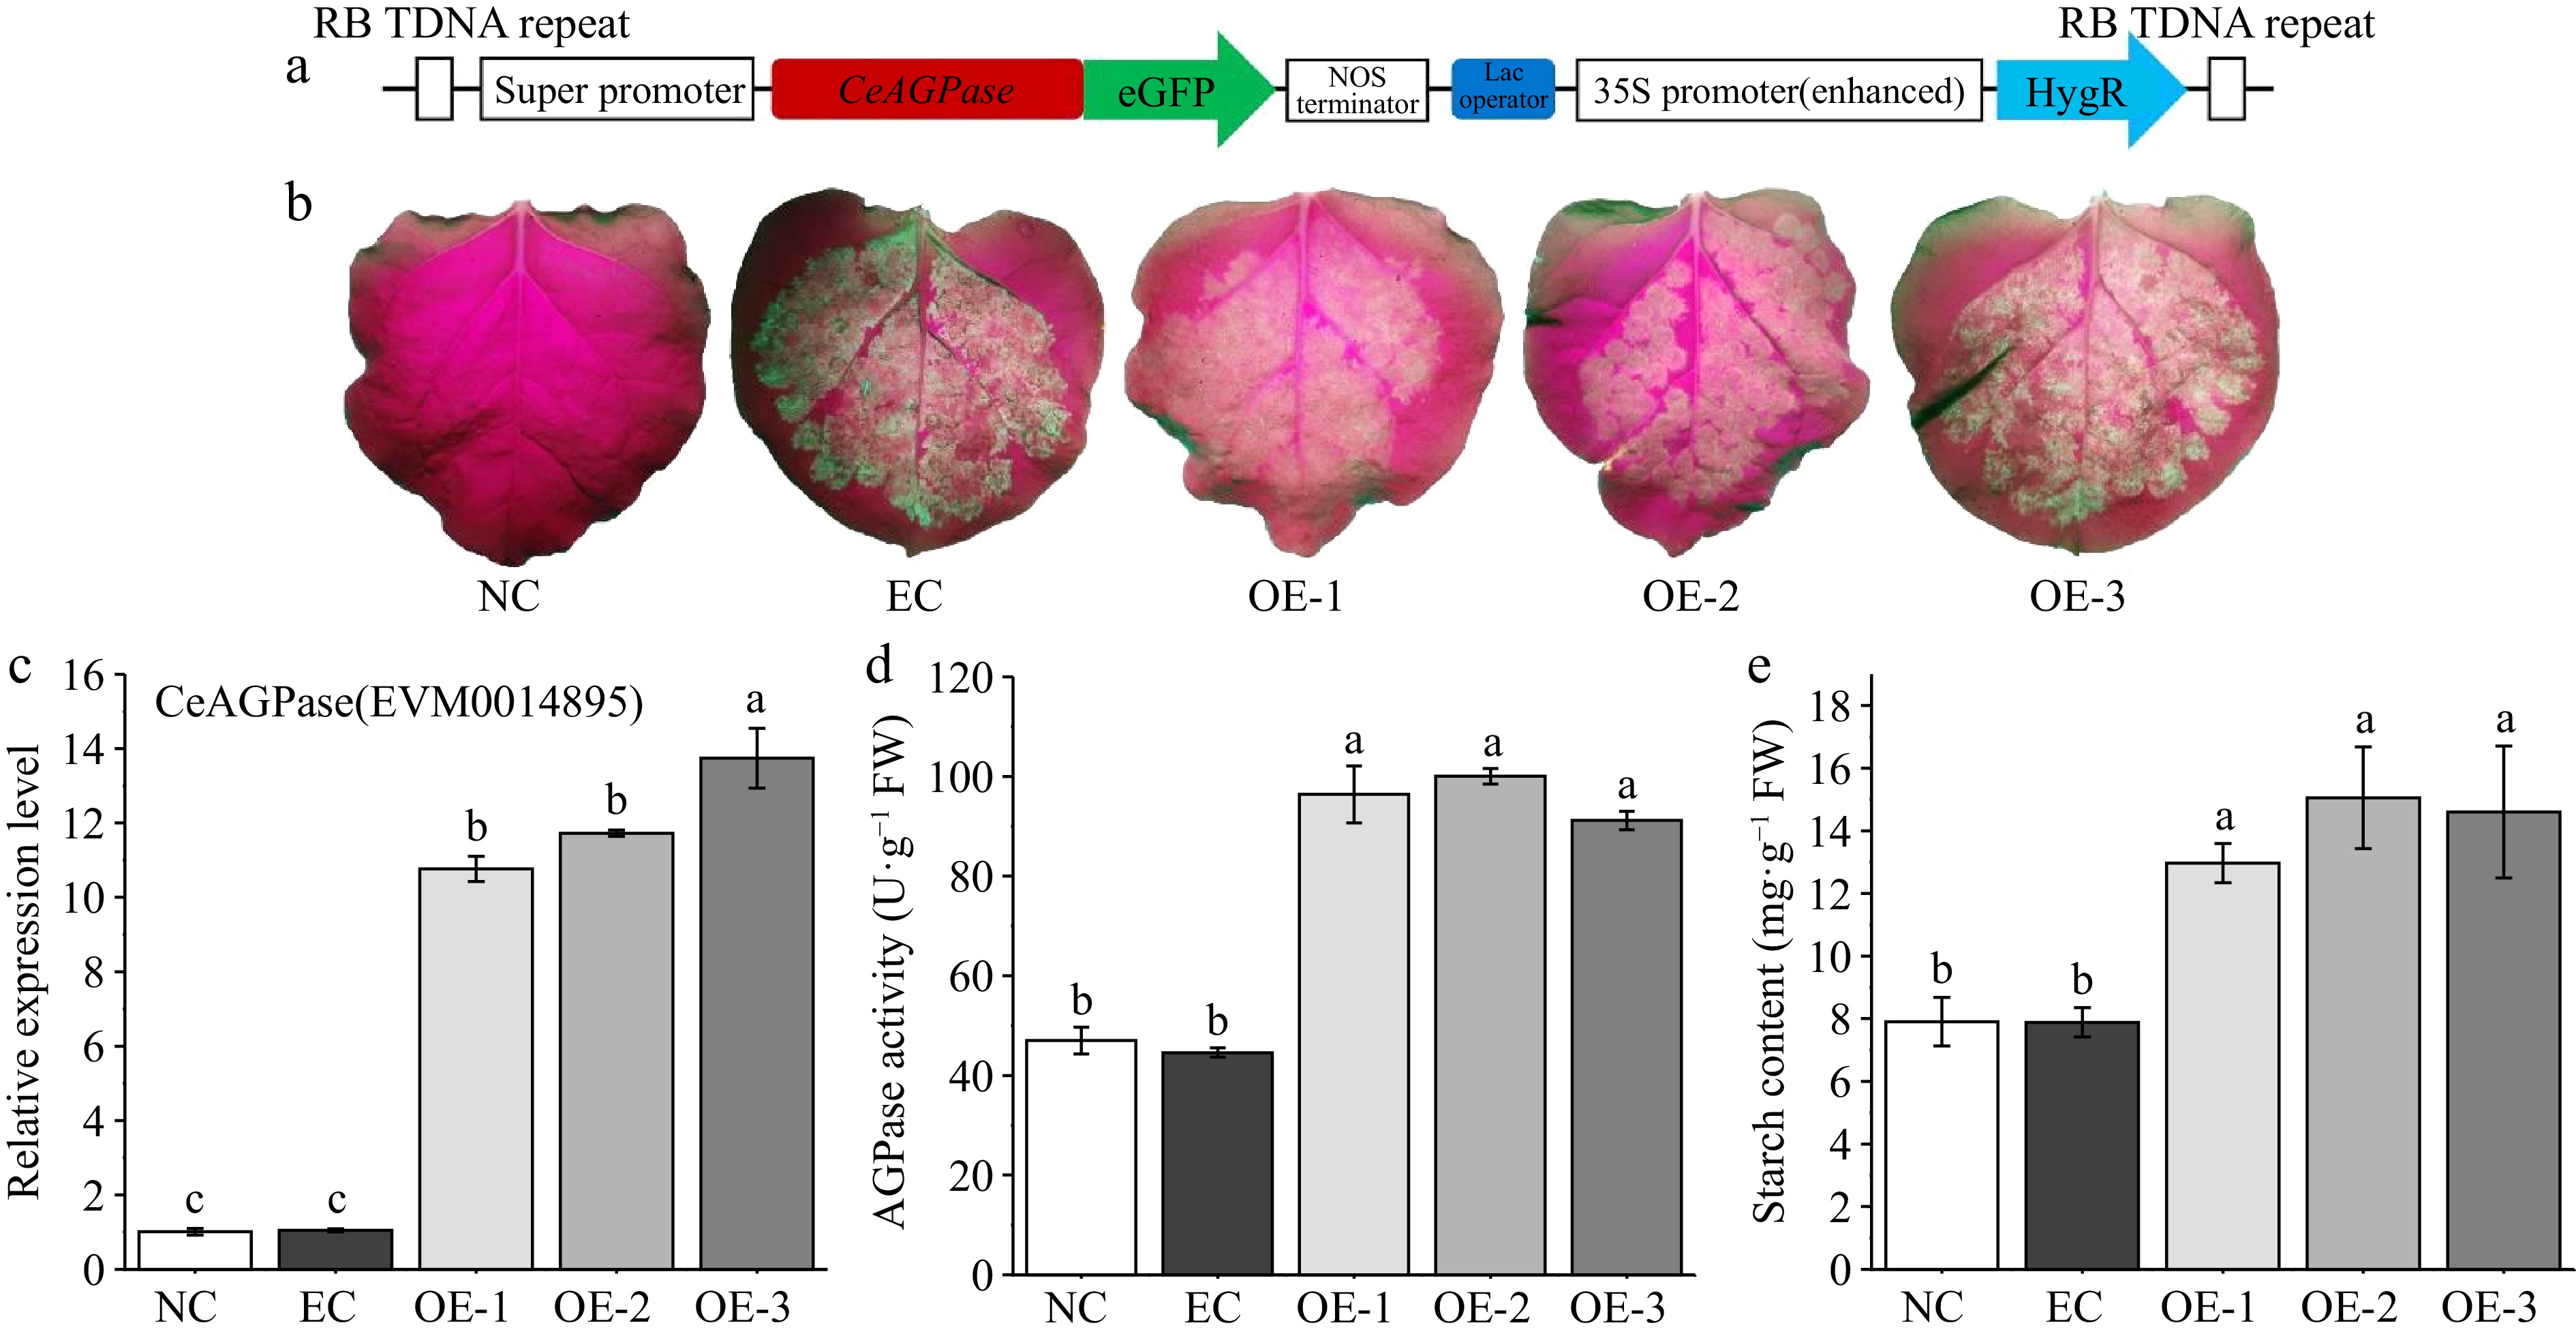
Figure 7.
Transient overexpression analysis of CeAGPase in tobacco leaves. (a) Schematic representation of the overexpression vector. (b) Enhanced Green Fluorescent observation of tobacco leaves after 3 d of resting cultivation. (c) The relative expression levels of CeAGPase in the tobacco leaves from negative control (NC) line, empty vector control (EC) line and overexpressing (OE) line. (d) AGPase activity was assayed in the tobacco leaves from NC line, EC line and OE line. (e) Analysis of the starch content in the tobacco leaves from NC line, EC line and OE line. Data are means (± SE) from at least three replicates. Different letters indicate significant differences between means as determined using ANOVA followed by Duncan's multiple range test (p-value < 0.05).
-
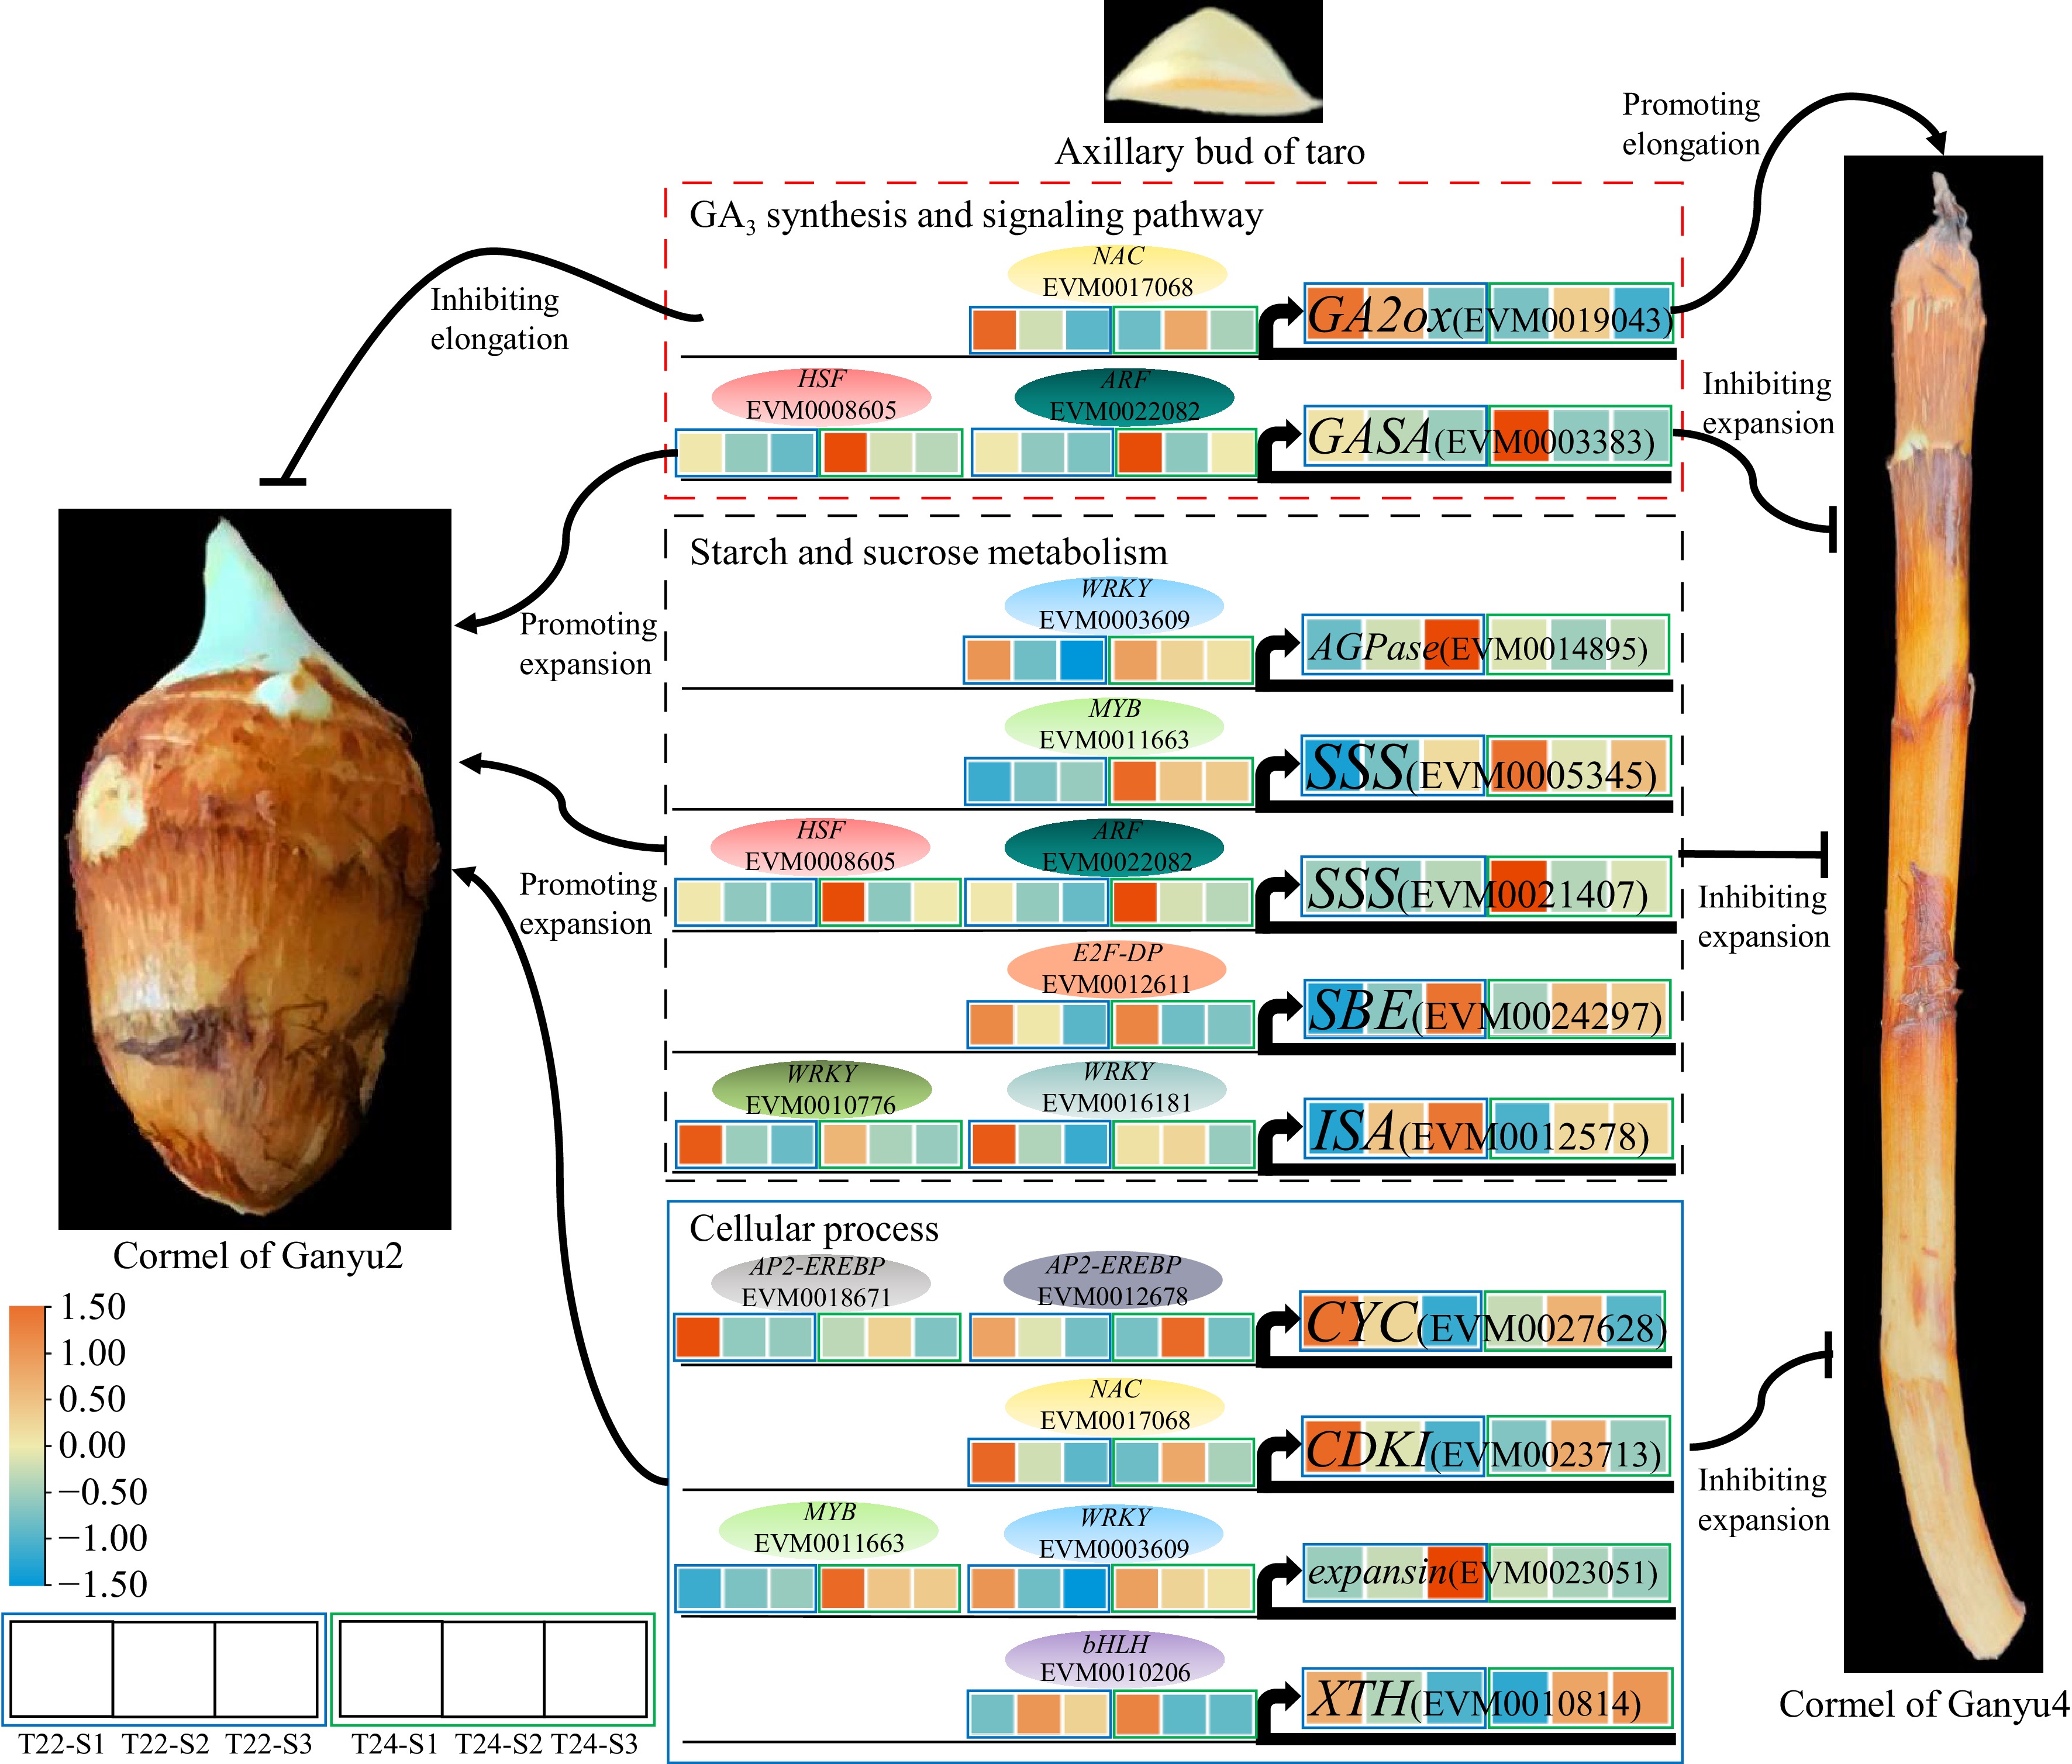
Figure 8.
A proposed model for genes regulation of taro cormel expansion. The heat map showed expression levels of genes which are standardized by row scaled and colored in orange and cyan for high and low expression. The oval modules indicate key candidate TFs.
-
Taro cormel in
different stagesLongitudinal cell length (μm) Transverse cell length (μm) Ganyu2 (T22) Ganyu4 (T24) Ganyu2 (T22) Ganyu4 (T24) S1 19.34 ± 0.84 d 16.32 ± 0.17 d 12.46 ± 1.24 c 12.64 ± 0.61 d S2 31.80 ± 0.82 bc 29.40 ± 1.63 c 33.28 ± 2.13 a 22.63 ± 1.06 bc S3 35.34 ± 1.39 b 46.90 ± 2.96 a 33.78 ± 1.82 a 24.18 ± 0.70 b The data represent the mean ± standard error (SE) of three biological with three replicates each. Different letters indicate significant at the 0.05 level. Table 1.
Longitudinal and transverse cell length of taro cormels in T22 and T24.
-
TF name T22 Overlap T24 Total AP2-EREBP 25 17 0 42 MYB 24 15 6 45 WRKY 15 8 0 23 NAC 10 5 5 20 bHLH 9 14 4 27 Tify 7 2 0 9 G2-like 6 6 2 14 HSF 6 2 1 9 C2H2 5 2 1 8 GRAS 5 2 0 7 OFP 4 3 4 11 C2C2-Dof 3 6 1 10 Trihelix 3 4 0 7 ABI3VP1 2 3 2 7 MADS 2 0 0 2 ARF 1 4 2 7 BES1 1 0 2 3 LOB 1 4 1 6 TCP 1 4 1 6 bZIP 1 1 1 3 C2C2-CO-like 1 0 1 2 zf-HD 1 2 0 3 PLATZ 1 1 0 2 FAR1 1 0 0 1 mTERF 1 0 0 1 TUB 1 0 0 1 BBR/BPC 0 0 2 2 C2C2-GATA 0 5 1 6 GRF 0 2 1 3 C3H 0 1 1 2 SBP 0 5 0 5 C2C2-YABBY 0 2 0 2 E2F-DP 0 2 0 2 ARR-B 0 1 0 1 HB 0 1 0 1 RWP-RK 0 1 0 1 Table 2.
List of some of the important differentially expressed TFs in T22 and T24.
Figures
(8)
Tables
(2)