-
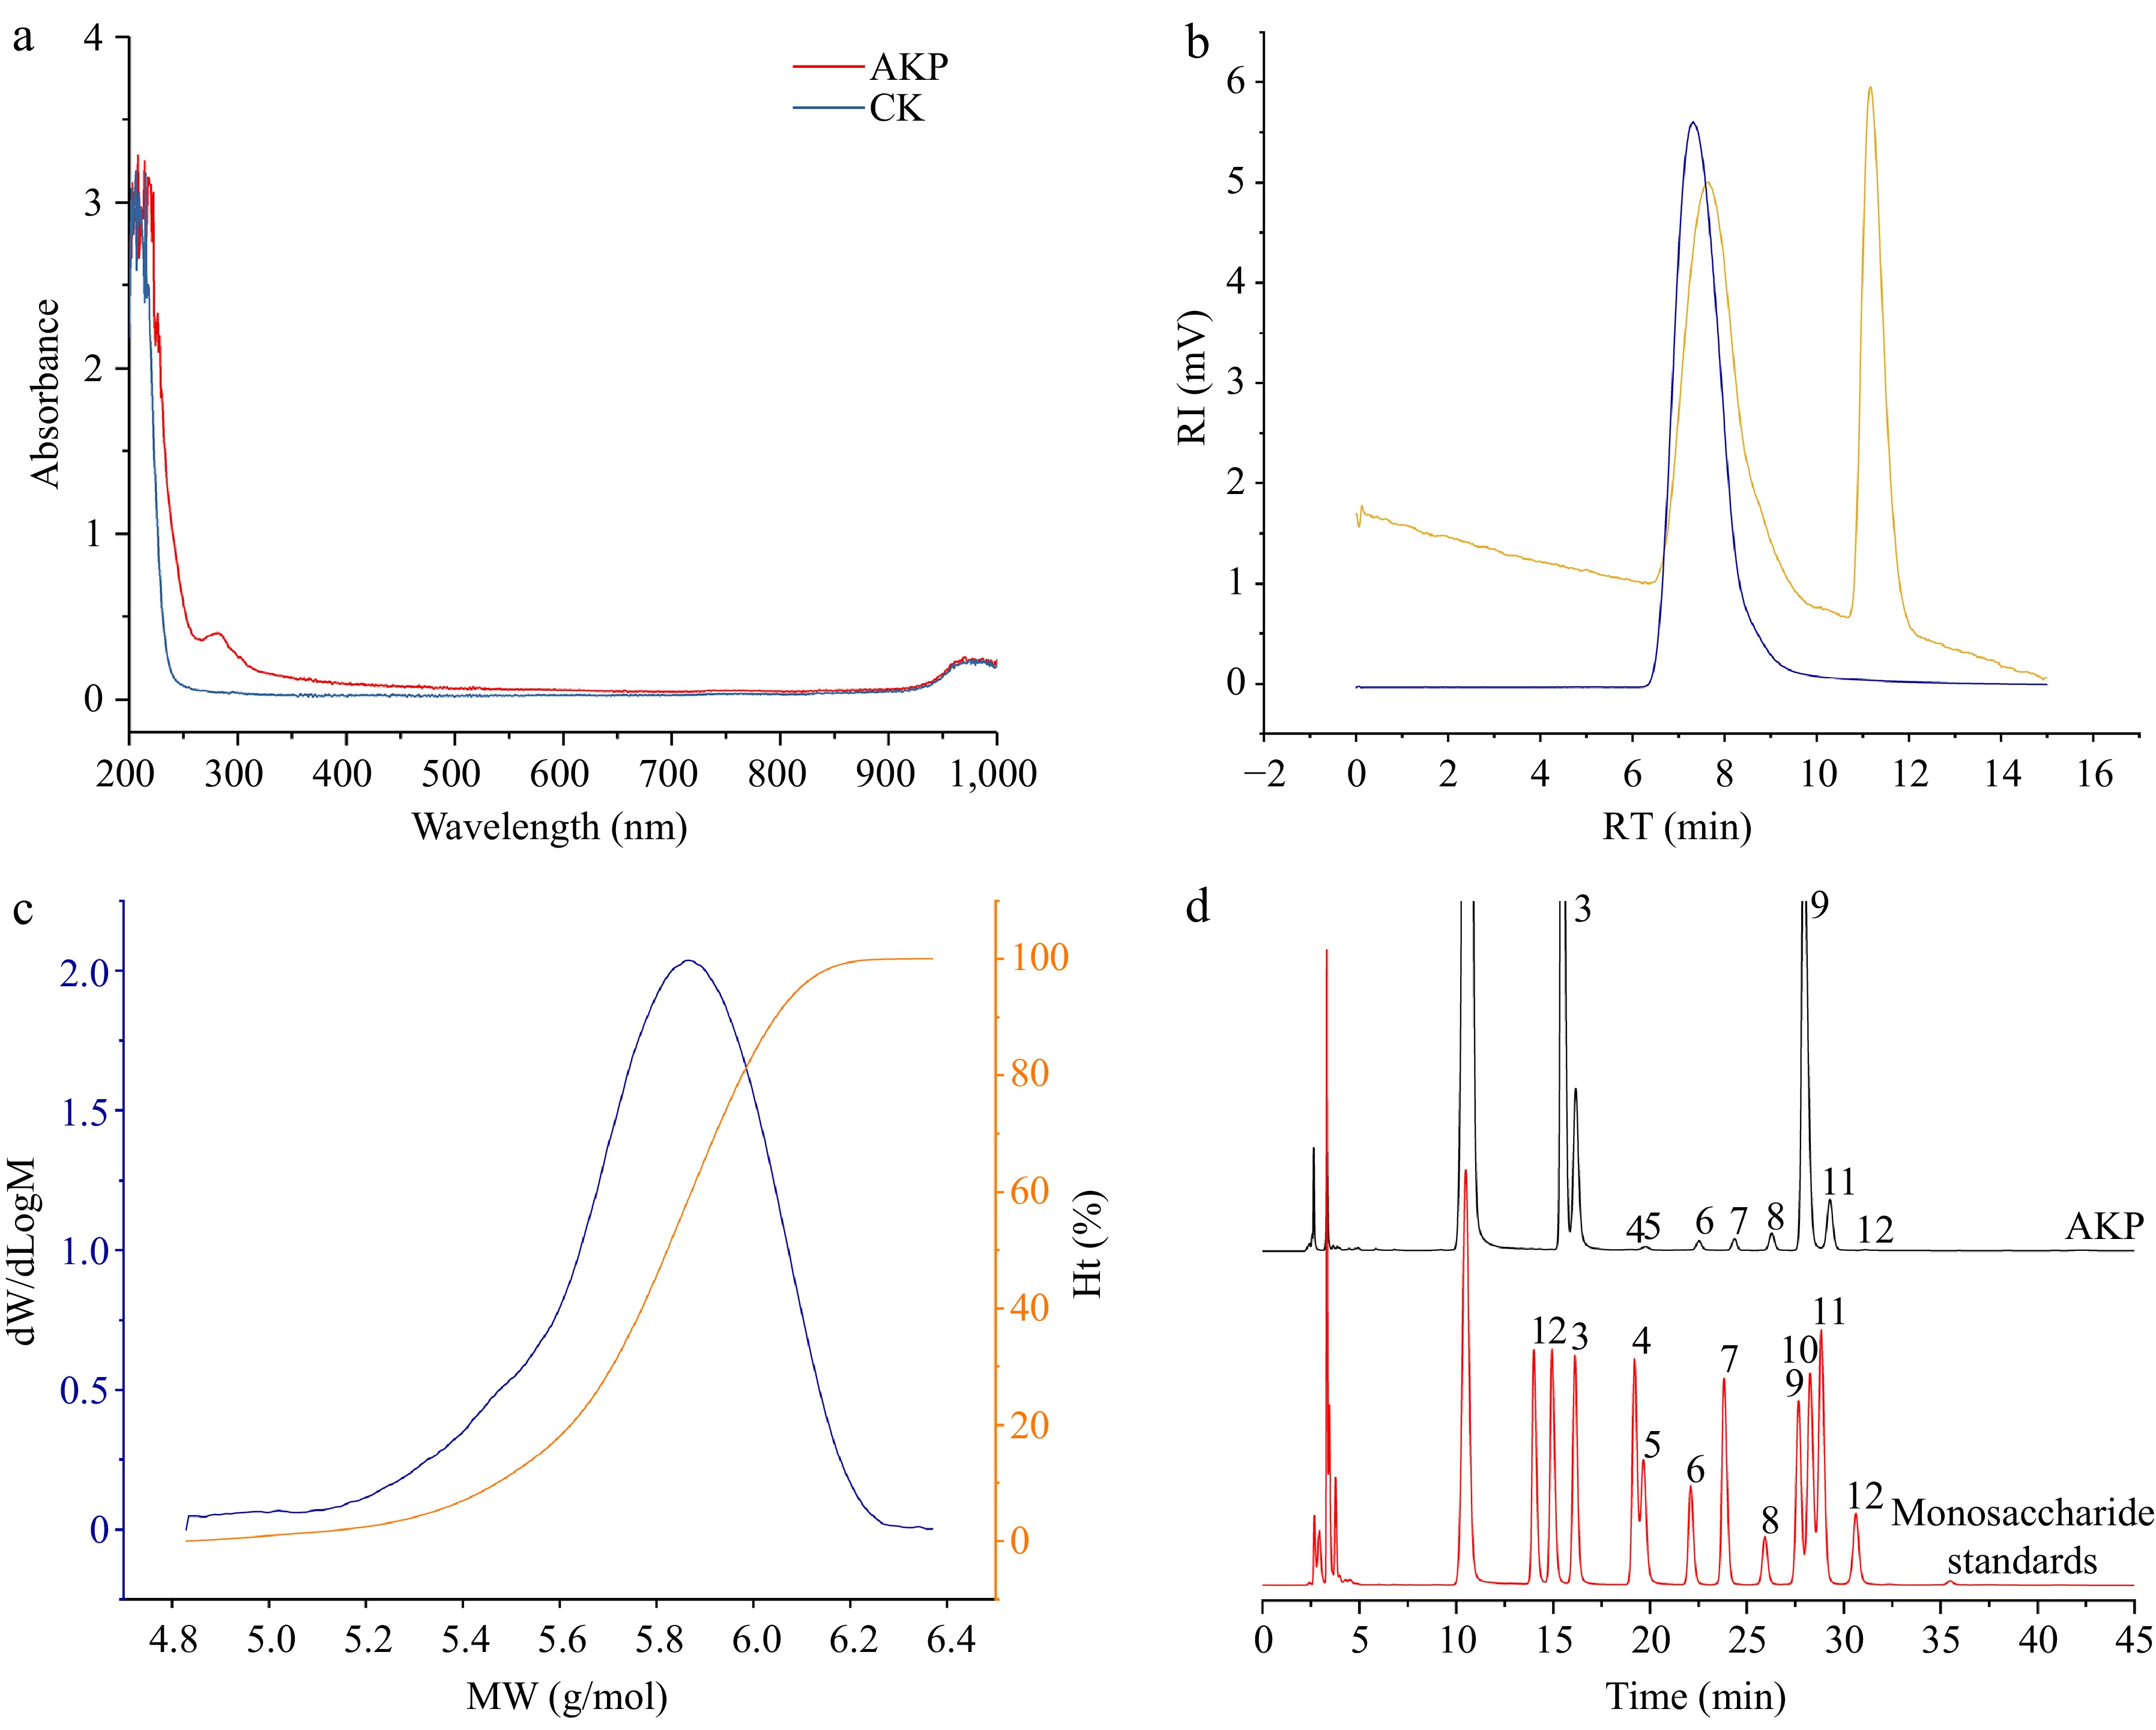
Figure 1.
(a) UV–Vis spectrum, (b) molecular weight chromatogram, (c) molecular weight distribution plot, and (d) monosaccharide composition of AKP. In (b), the blue line represents the dual angle laser light scattering signal, and the yellow line represents the differential signal. In (c) the blue line represents the molecular weight, and the orange line represents the proportion of molecular weight. In (d), the numbers were expressed as guluronic acid (1), mannuronic acid (2), mannose (3), ribose (4), rhamnose (5), glucuronic acid (6), galacturonic acid (7), glucose (8), galactose (9), xylose (10), arabinose (11), and fucose (12) respectively.
-
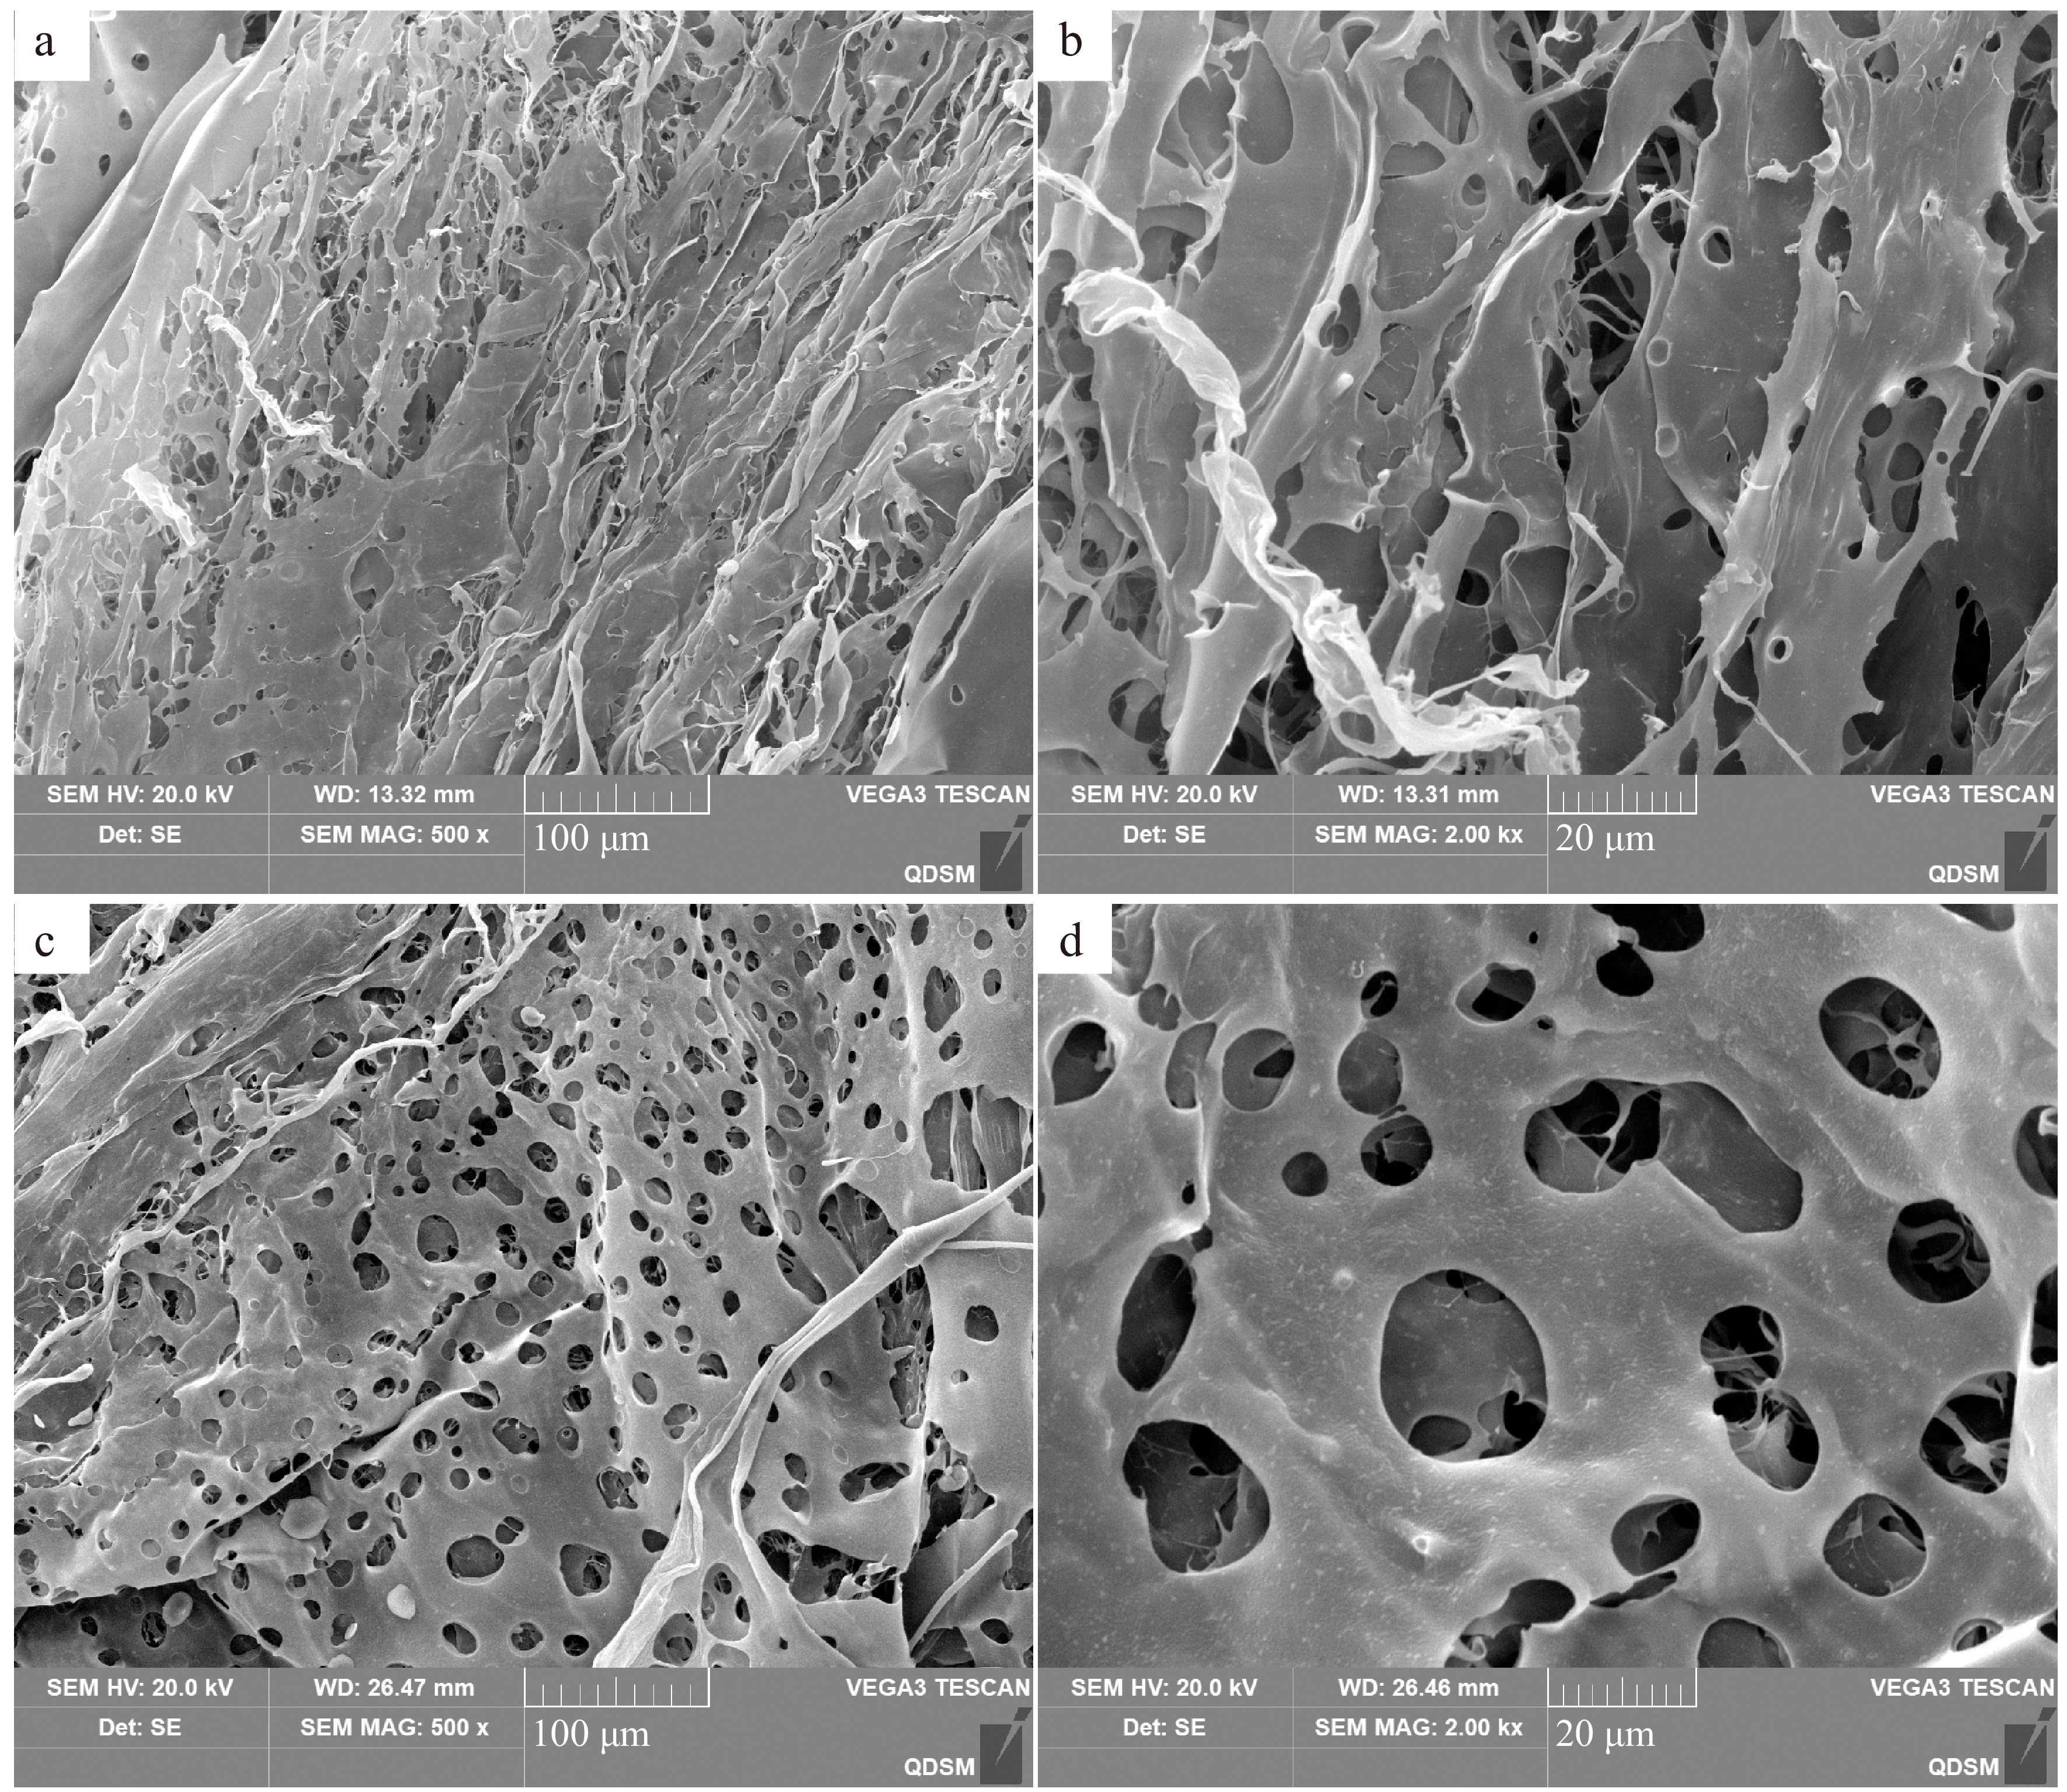
Figure 2.
The microstructure of AKP at different positions. (a), (c) magnification 500×; (b), (d) magnification 2,000×.
-
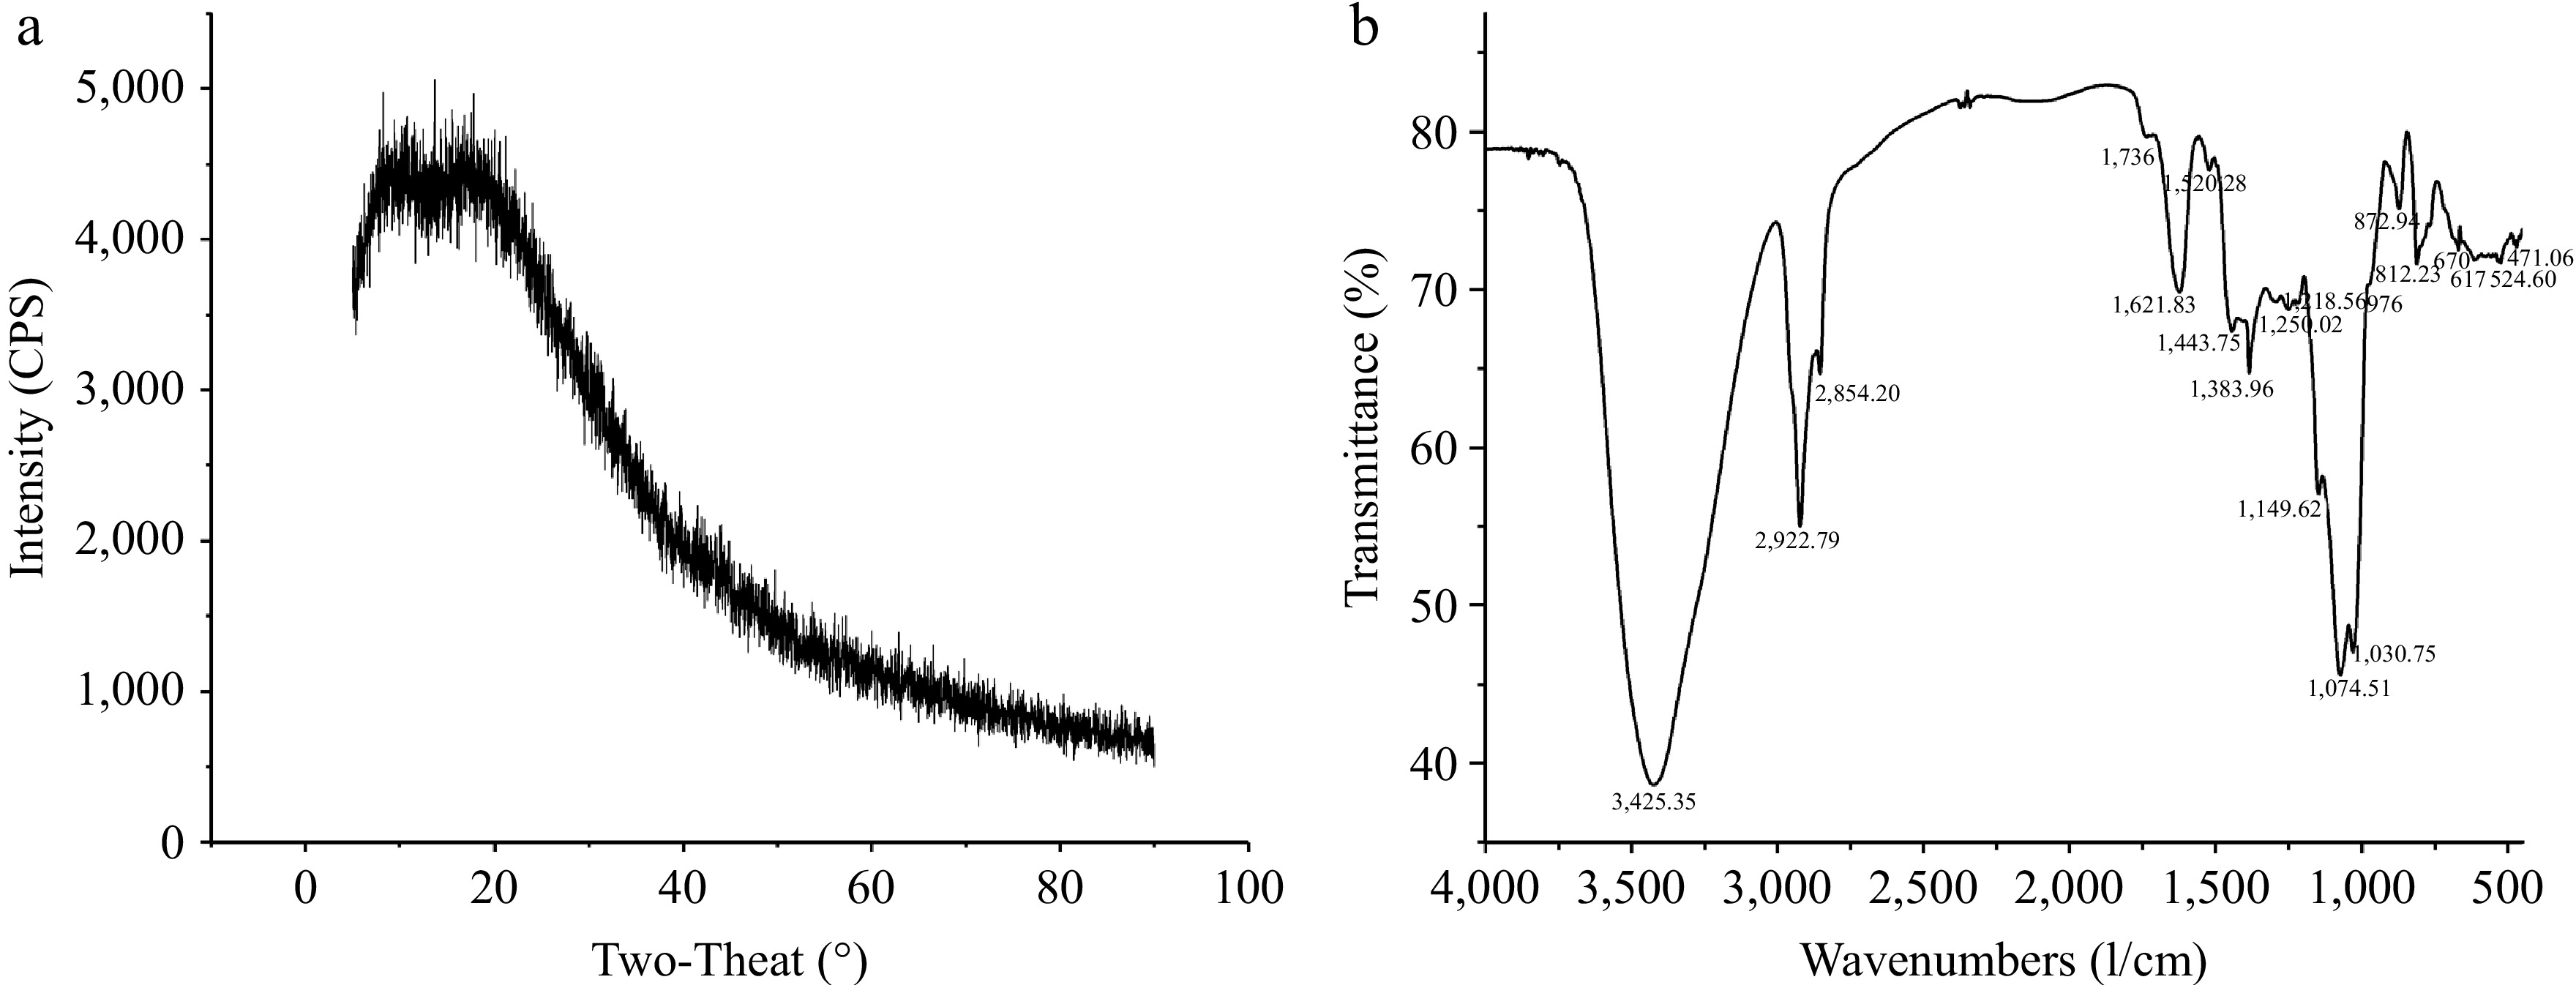
Figure 3.
(a) X-ray diffraction pattern, and (b) FTIR spectrum of AKP.
-
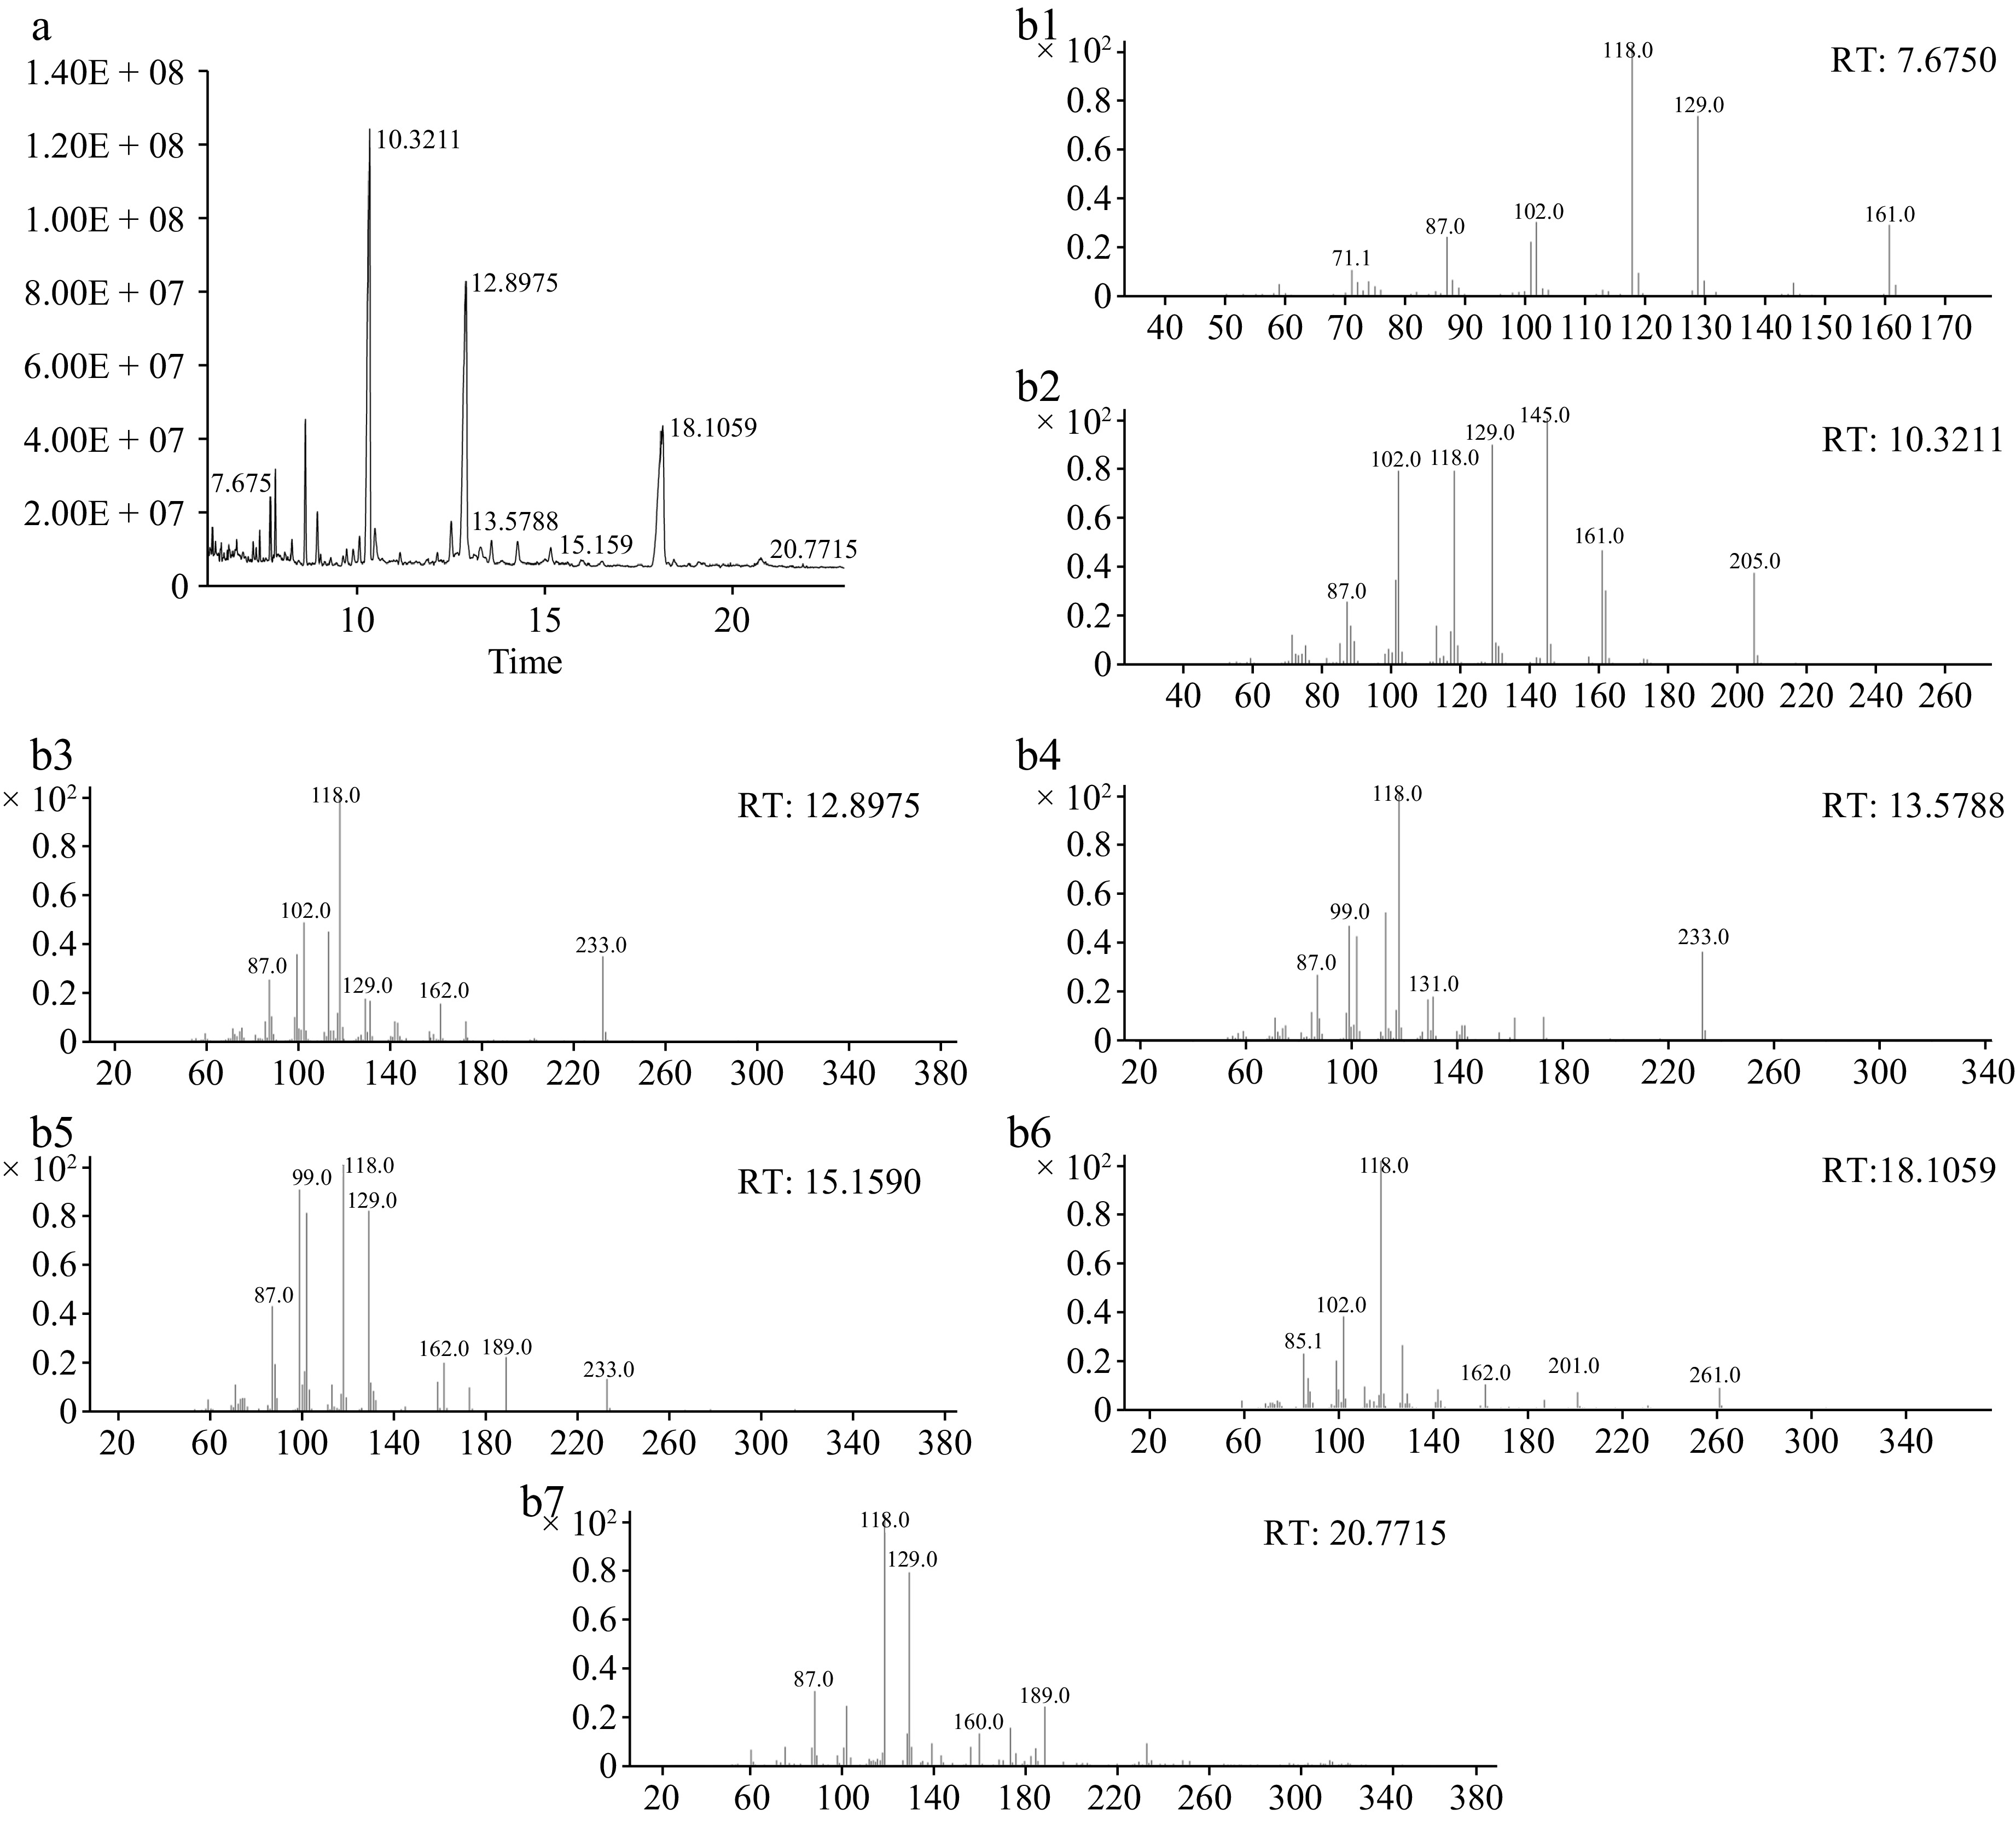
Figure 4.
(a) The total ion flow chromatogram, and (b) methylation mass spectrum of AKP. (b1)−(b7) Represent T-Araf, T-Galp, 4-Manp, 4-Glcp, 6-Galp, 4,6-Manp, and 3,6-Galp respectively.
-
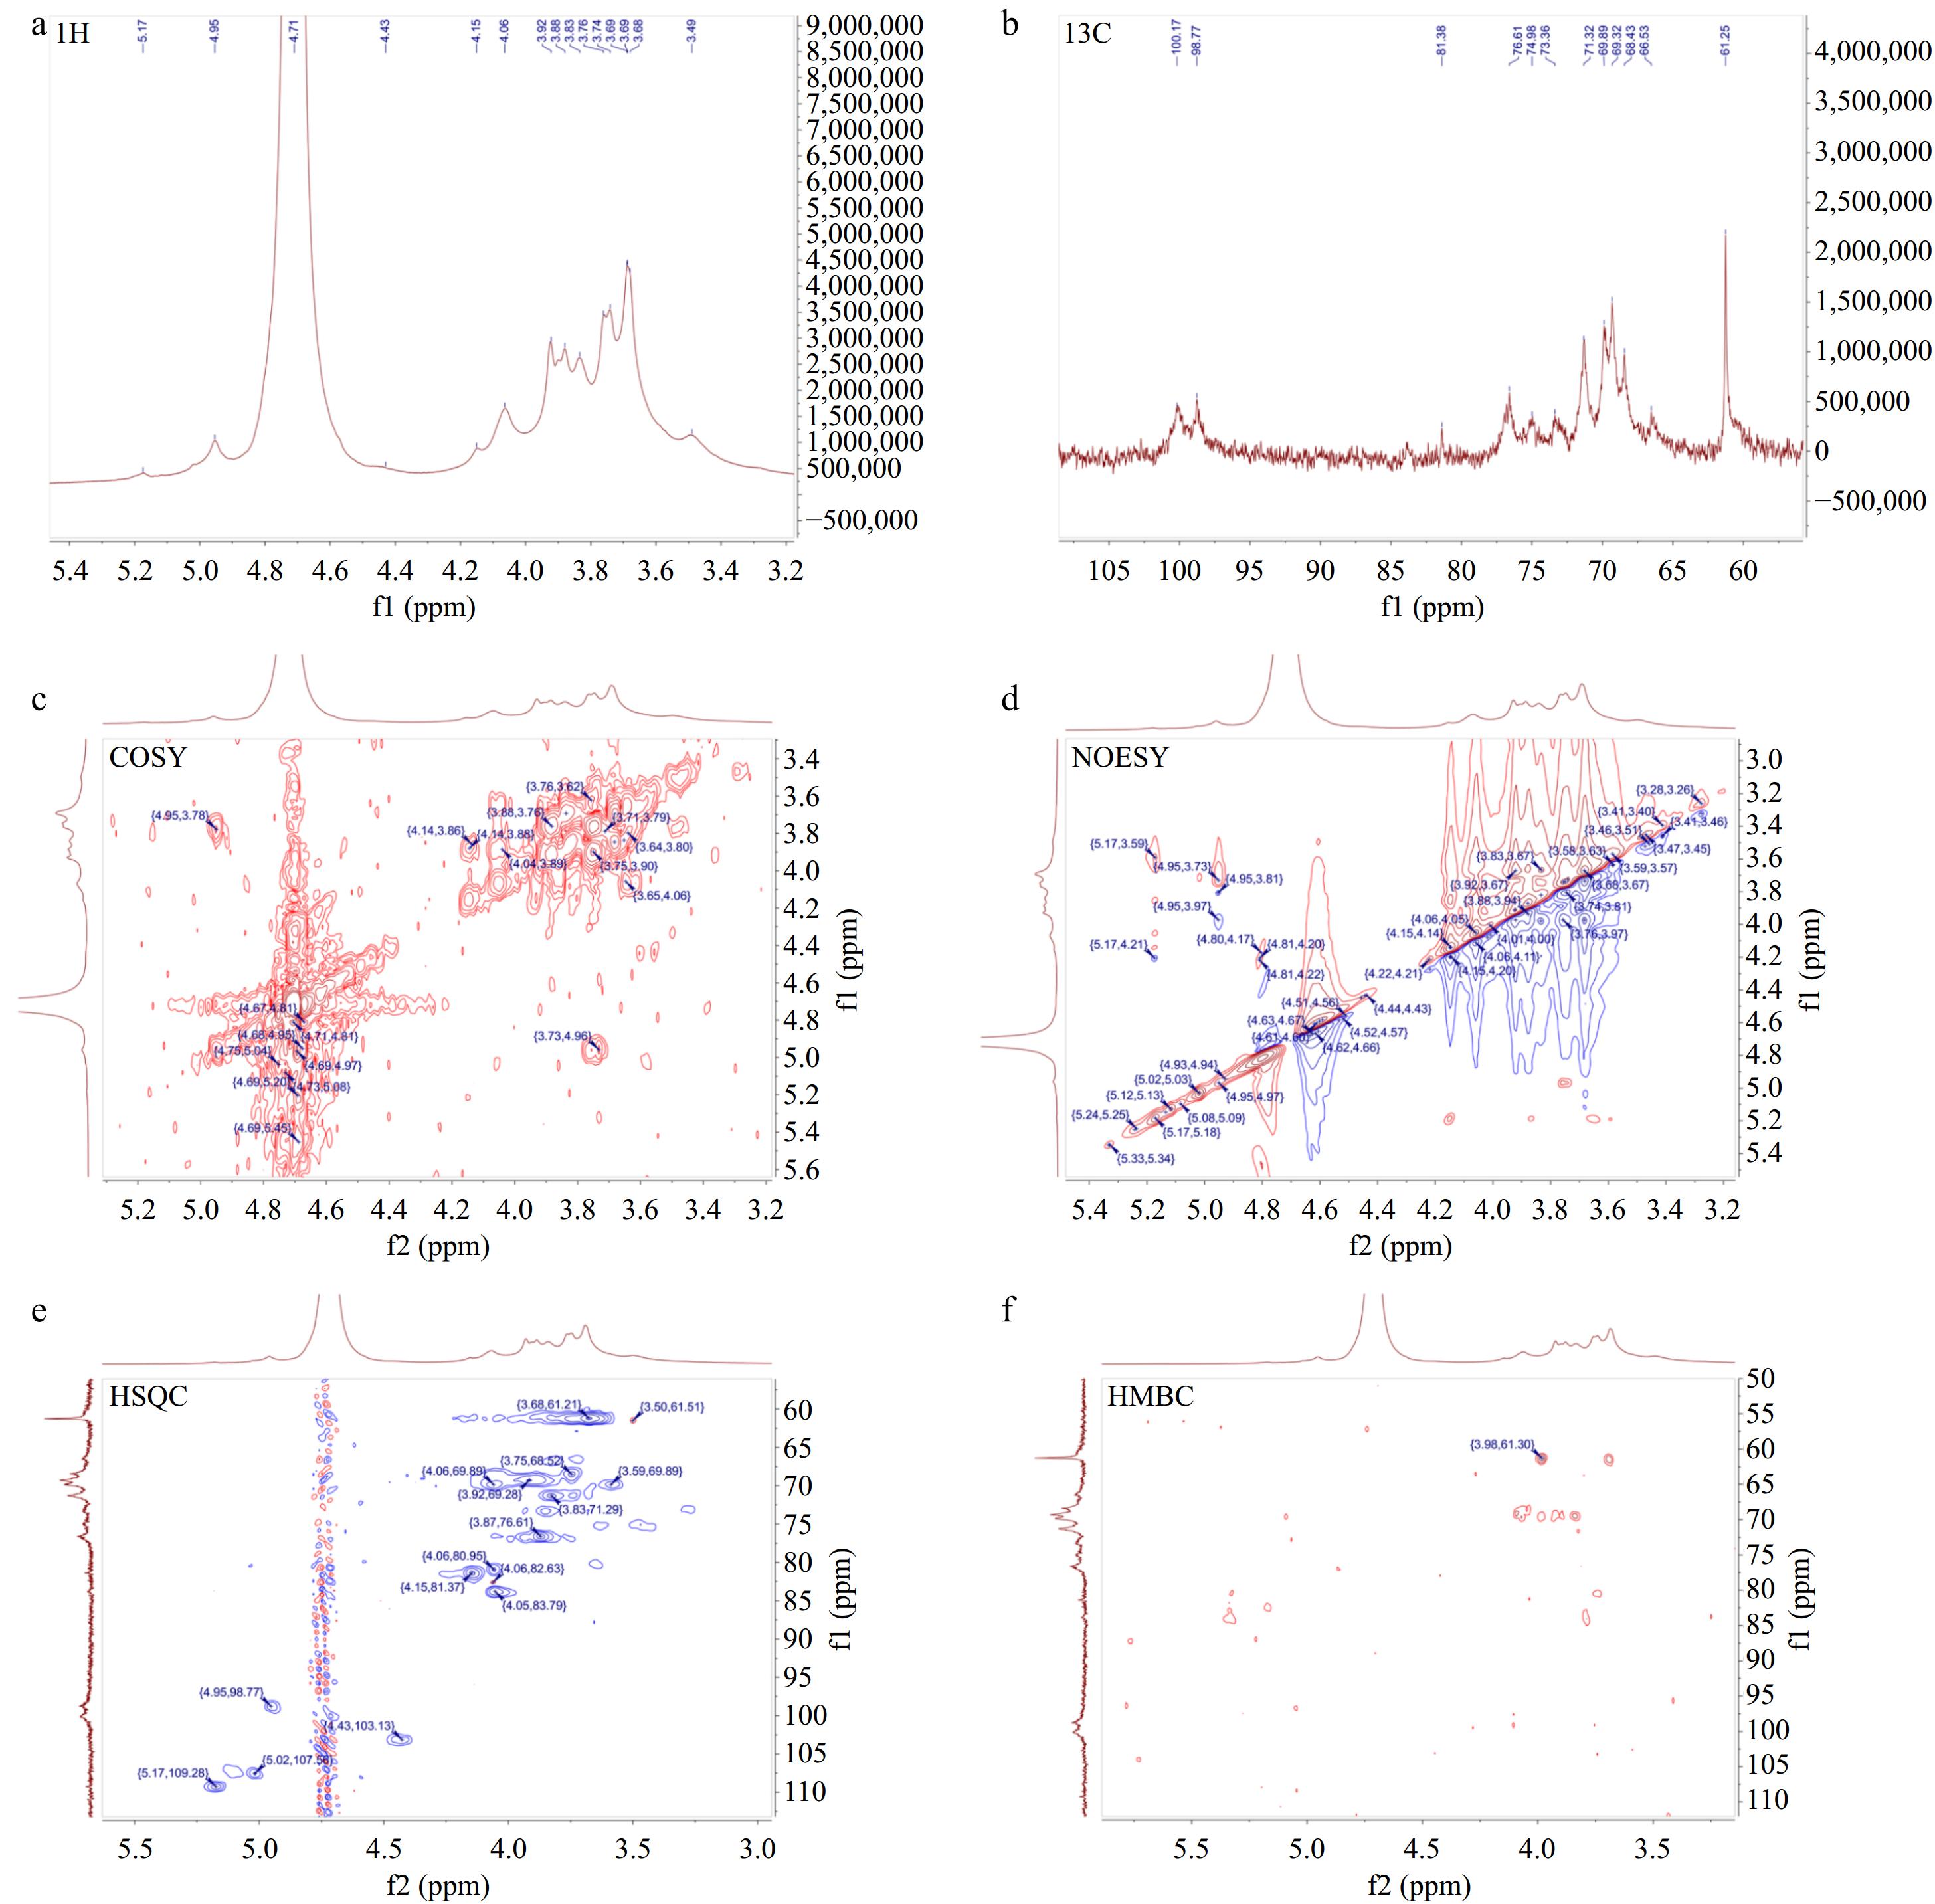
Figure 5.
One-dimensional and two-dimensional nuclear magnetic resonance spectrum of AKP. (a) 1H NMR spectrum, (b) 13C NMR spectrum, (c) COSY spectrum, (d) NOESY spectrum, (e) HSQC spectrum, (f) HMBC spectrum.
-
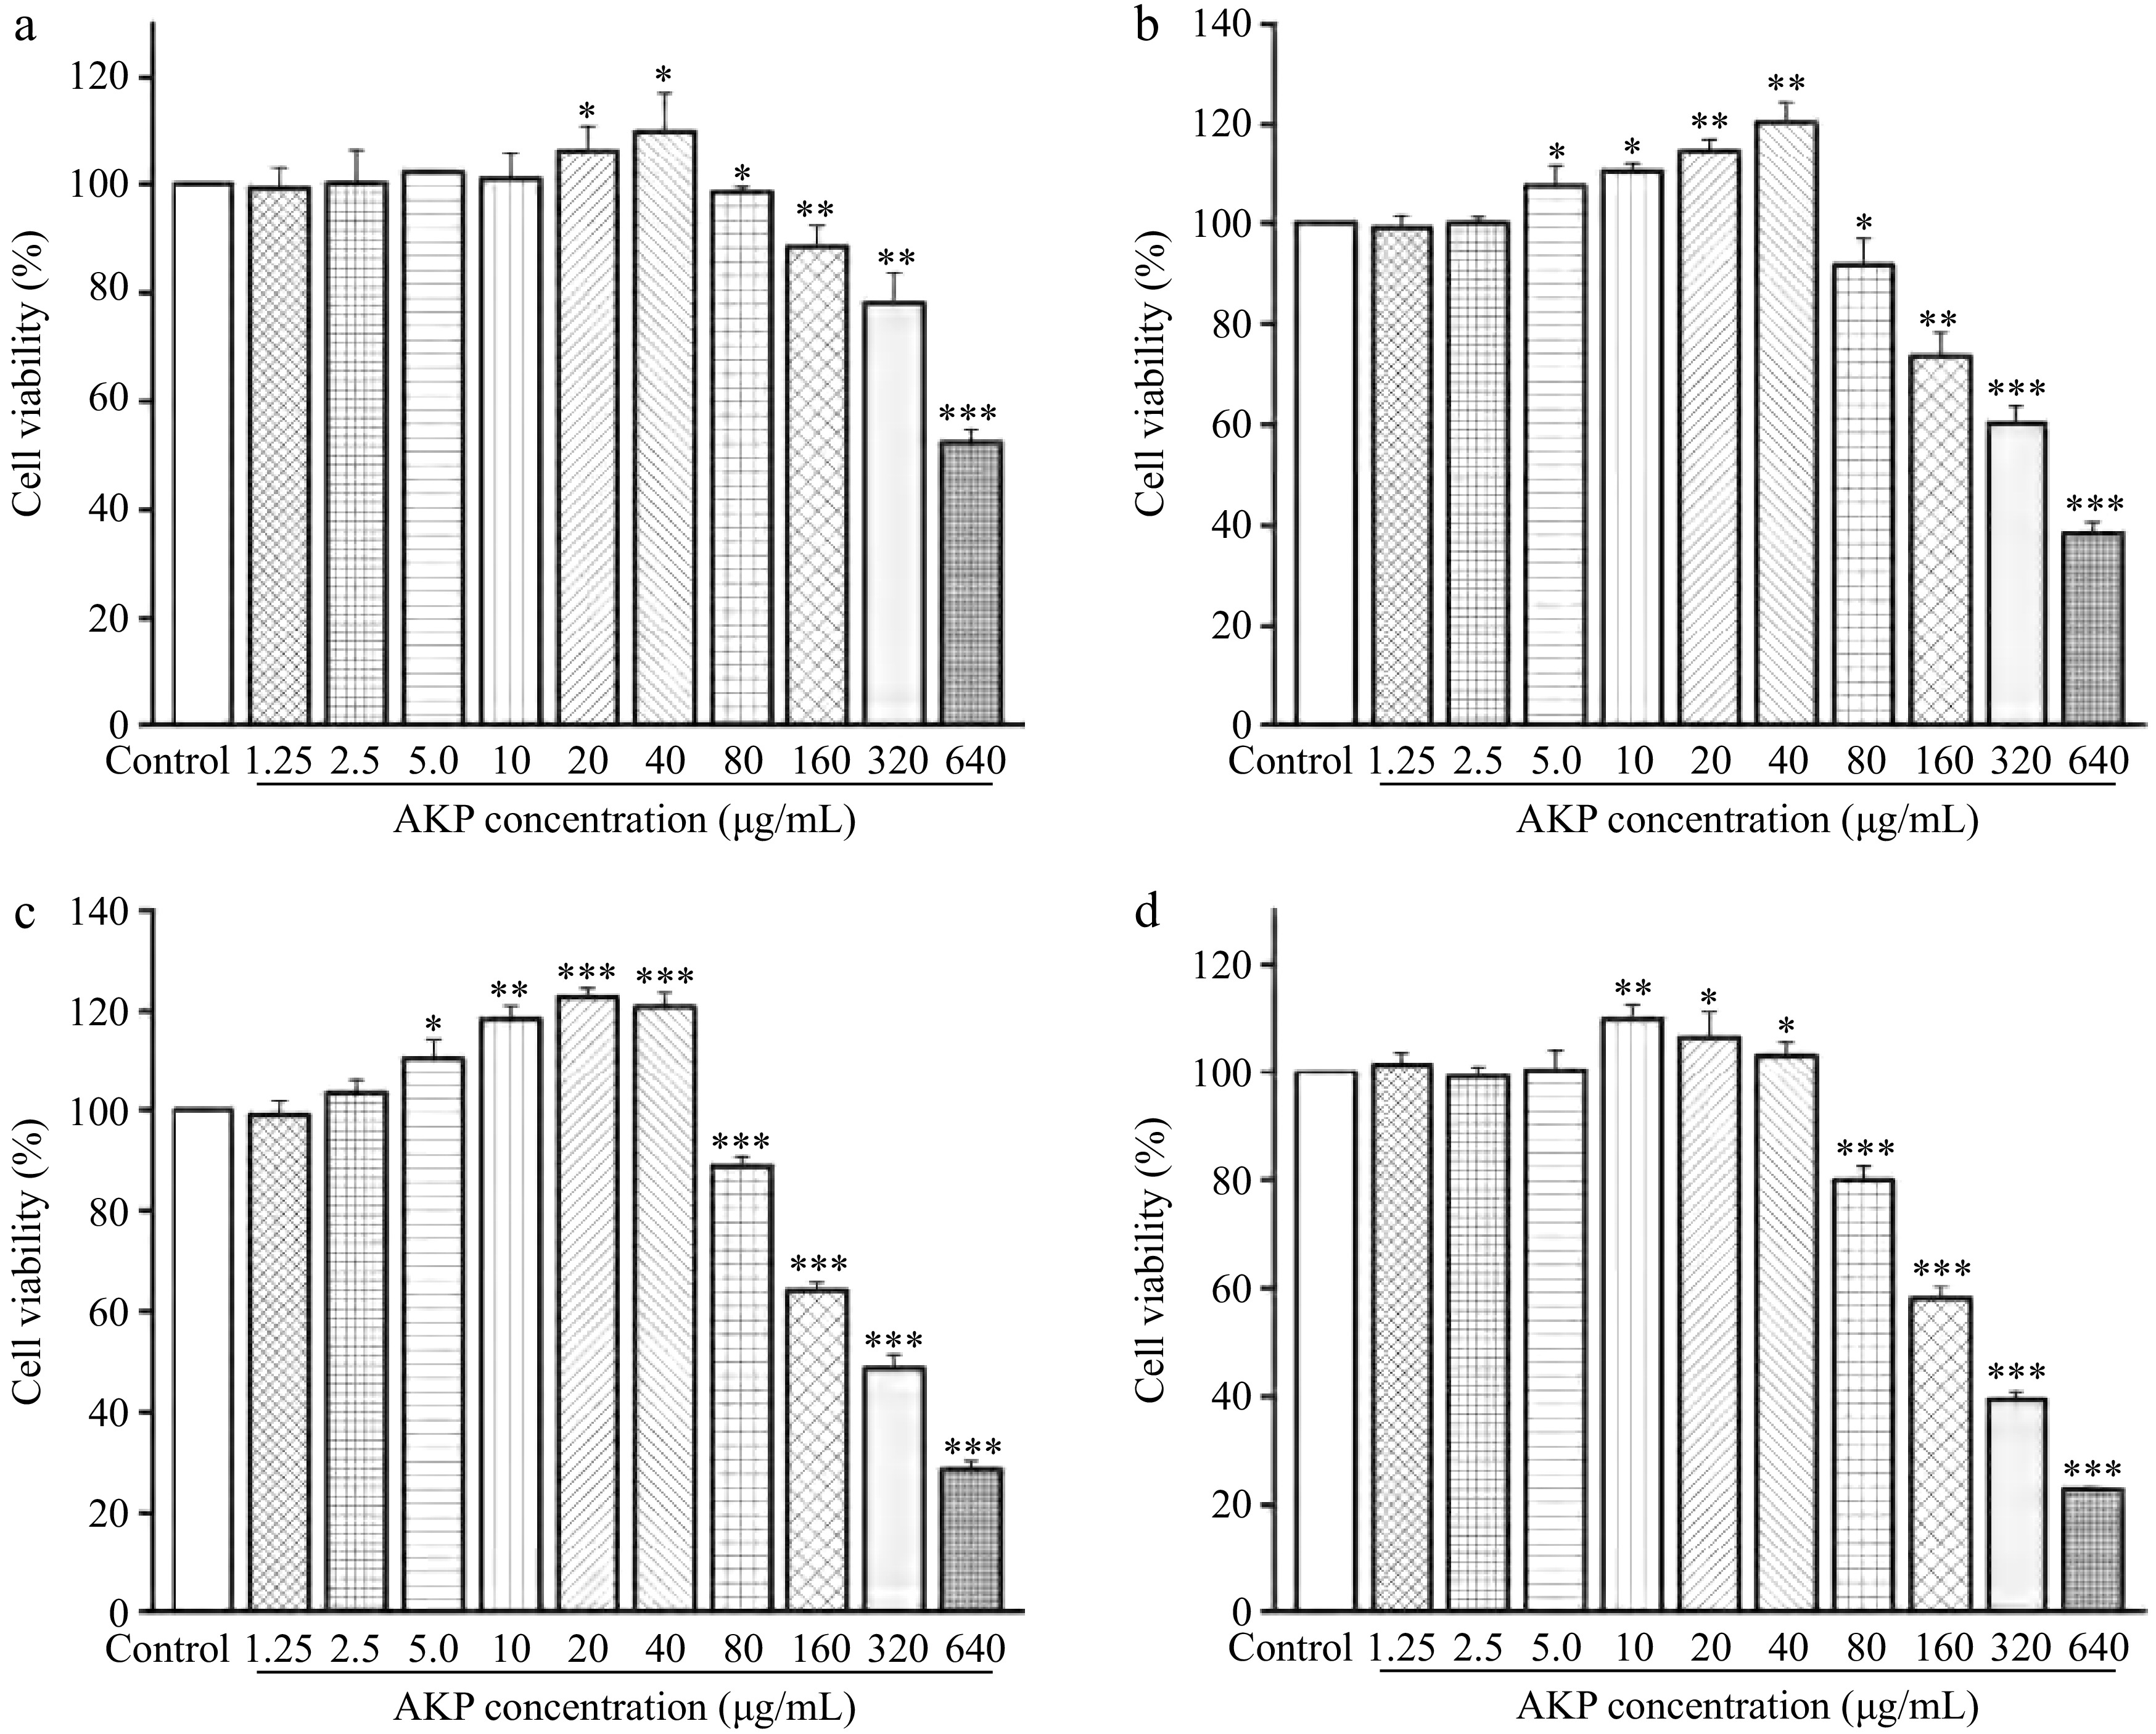
Figure 6.
Effect of AKP concentration and treatment time on the cell viability. Compared with the control group, *** p < 0.001, ** p < 0.01, * p < 0.05. (a)−(d) represent the treatment time of 12, 24, 48, and 72 h, respectively
-
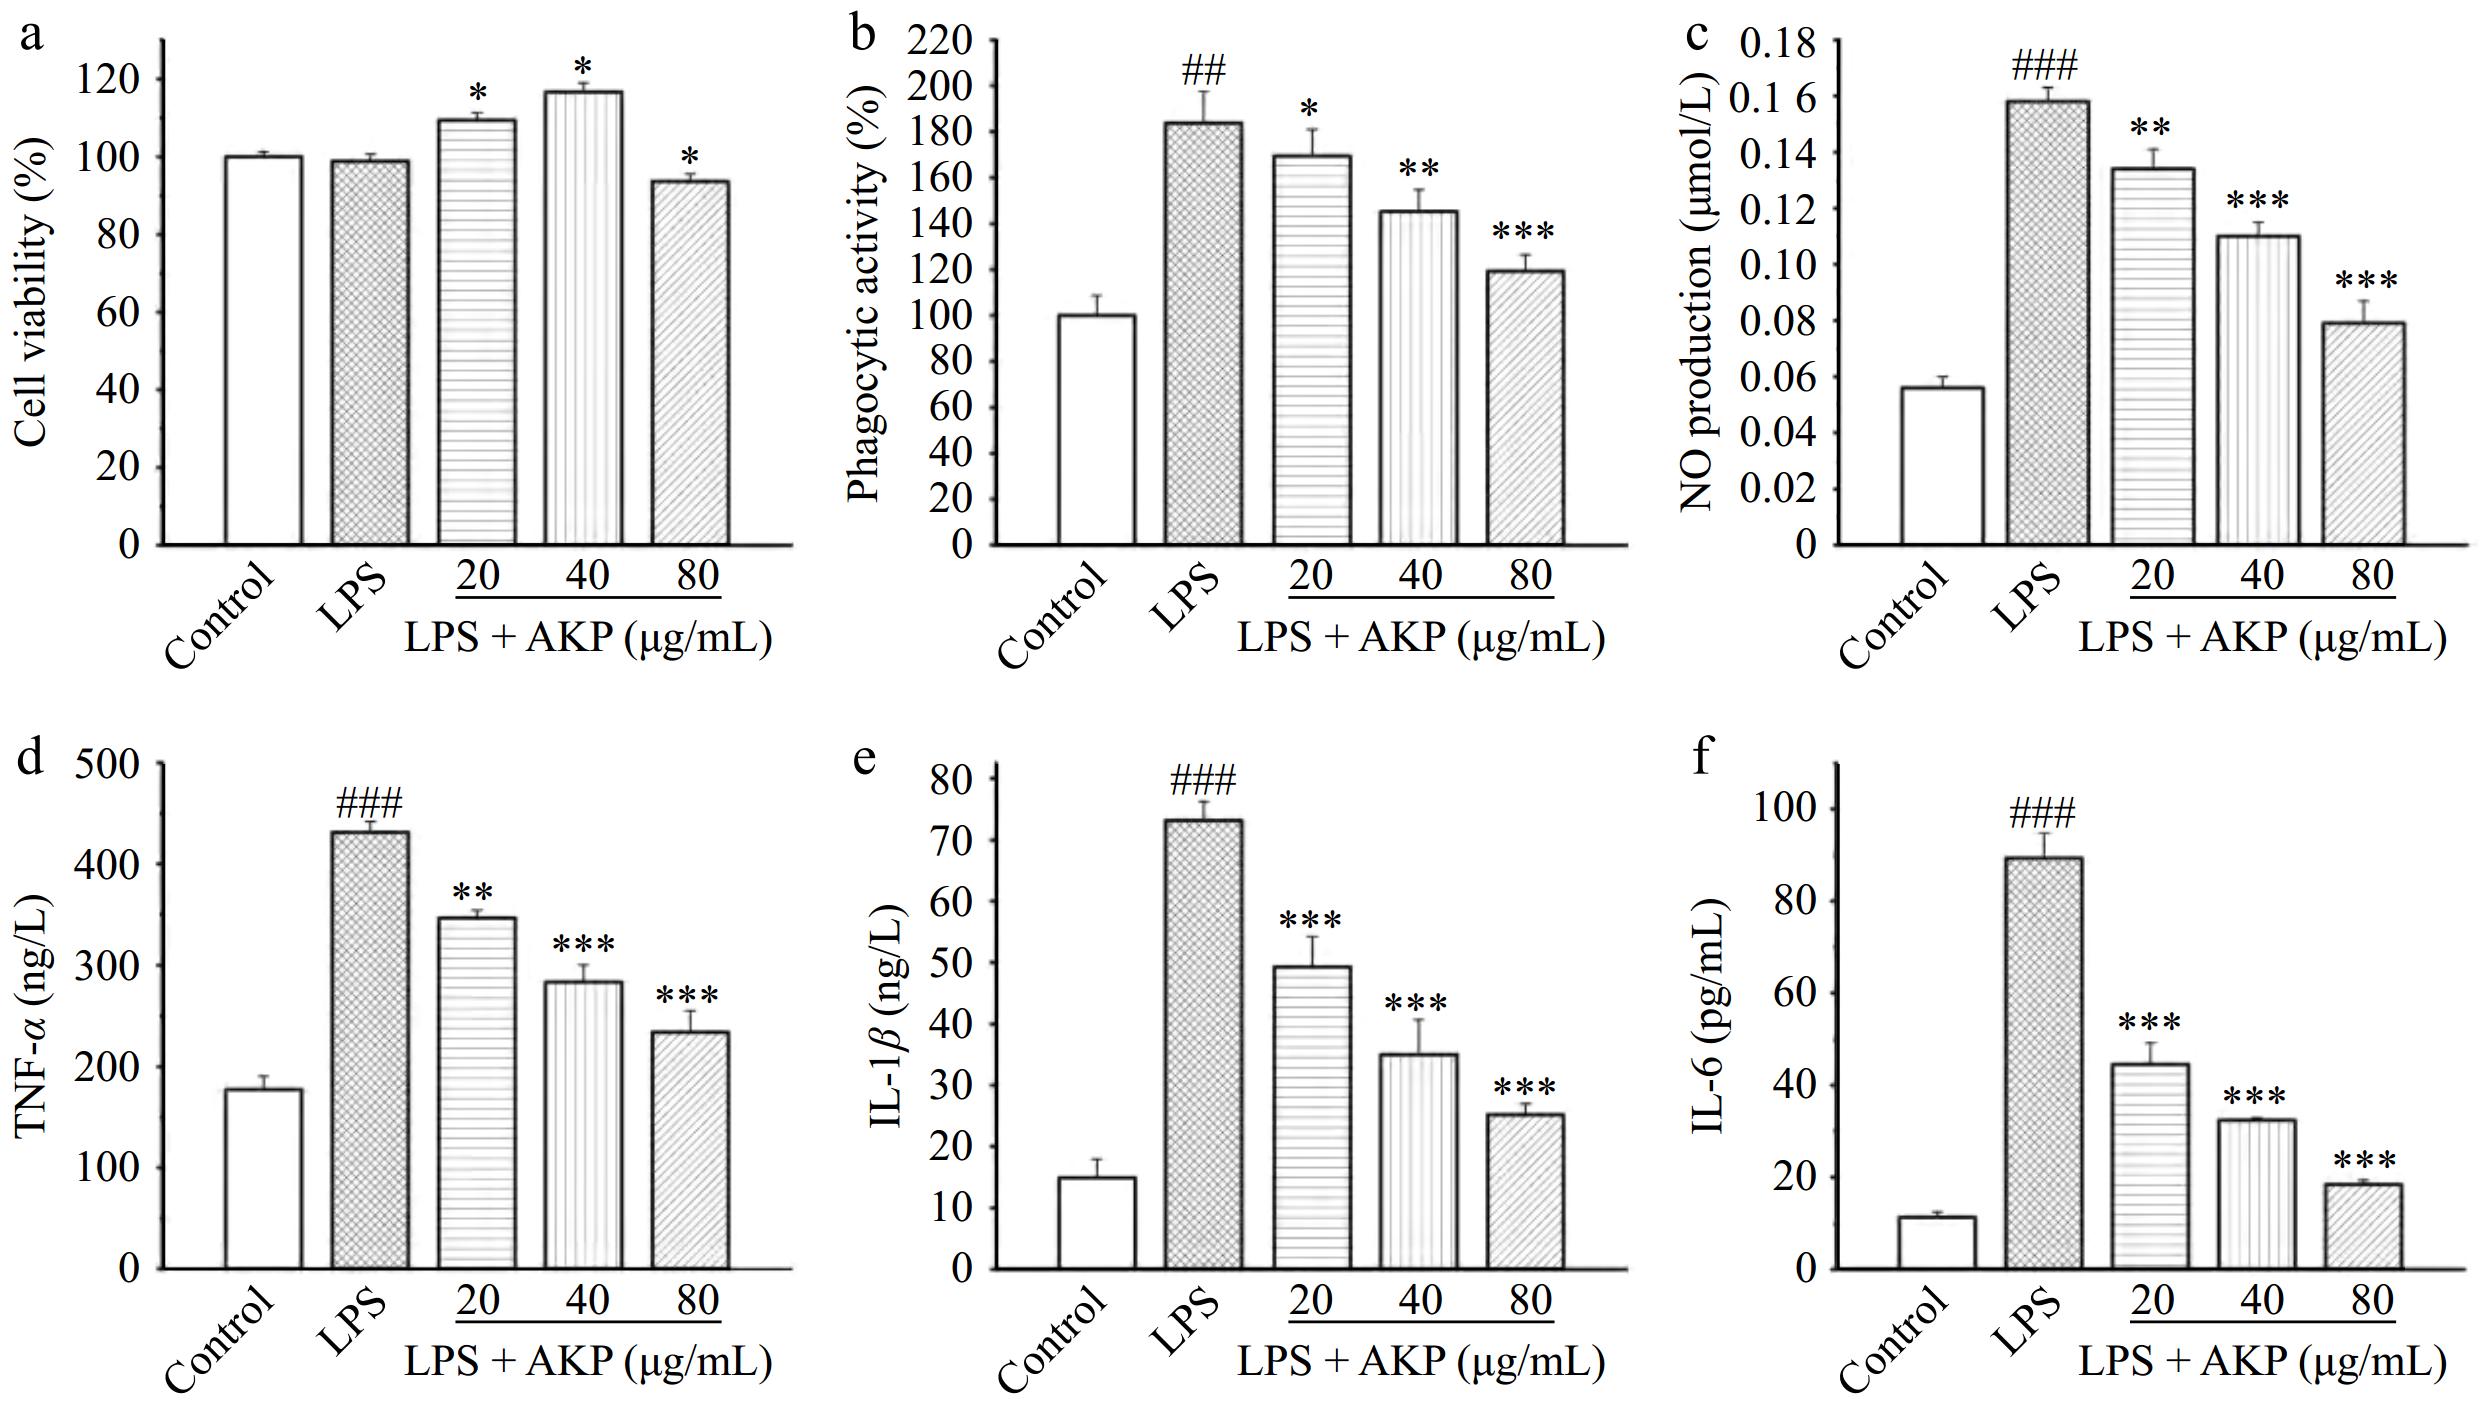
Figure 7.
Effect of AKP on the (a) cell viability, (b) phagocytic activity, (c) NO production, (d) IL-1β release, (e) IL-6 release, and (f) TNF-α release of LPS-induced RAW264.7 cells. Compared with the control group, ### p < 0.001; Compared with the model group, *** p < 0.001, ** p < 0.01, * p < 0.05.
-
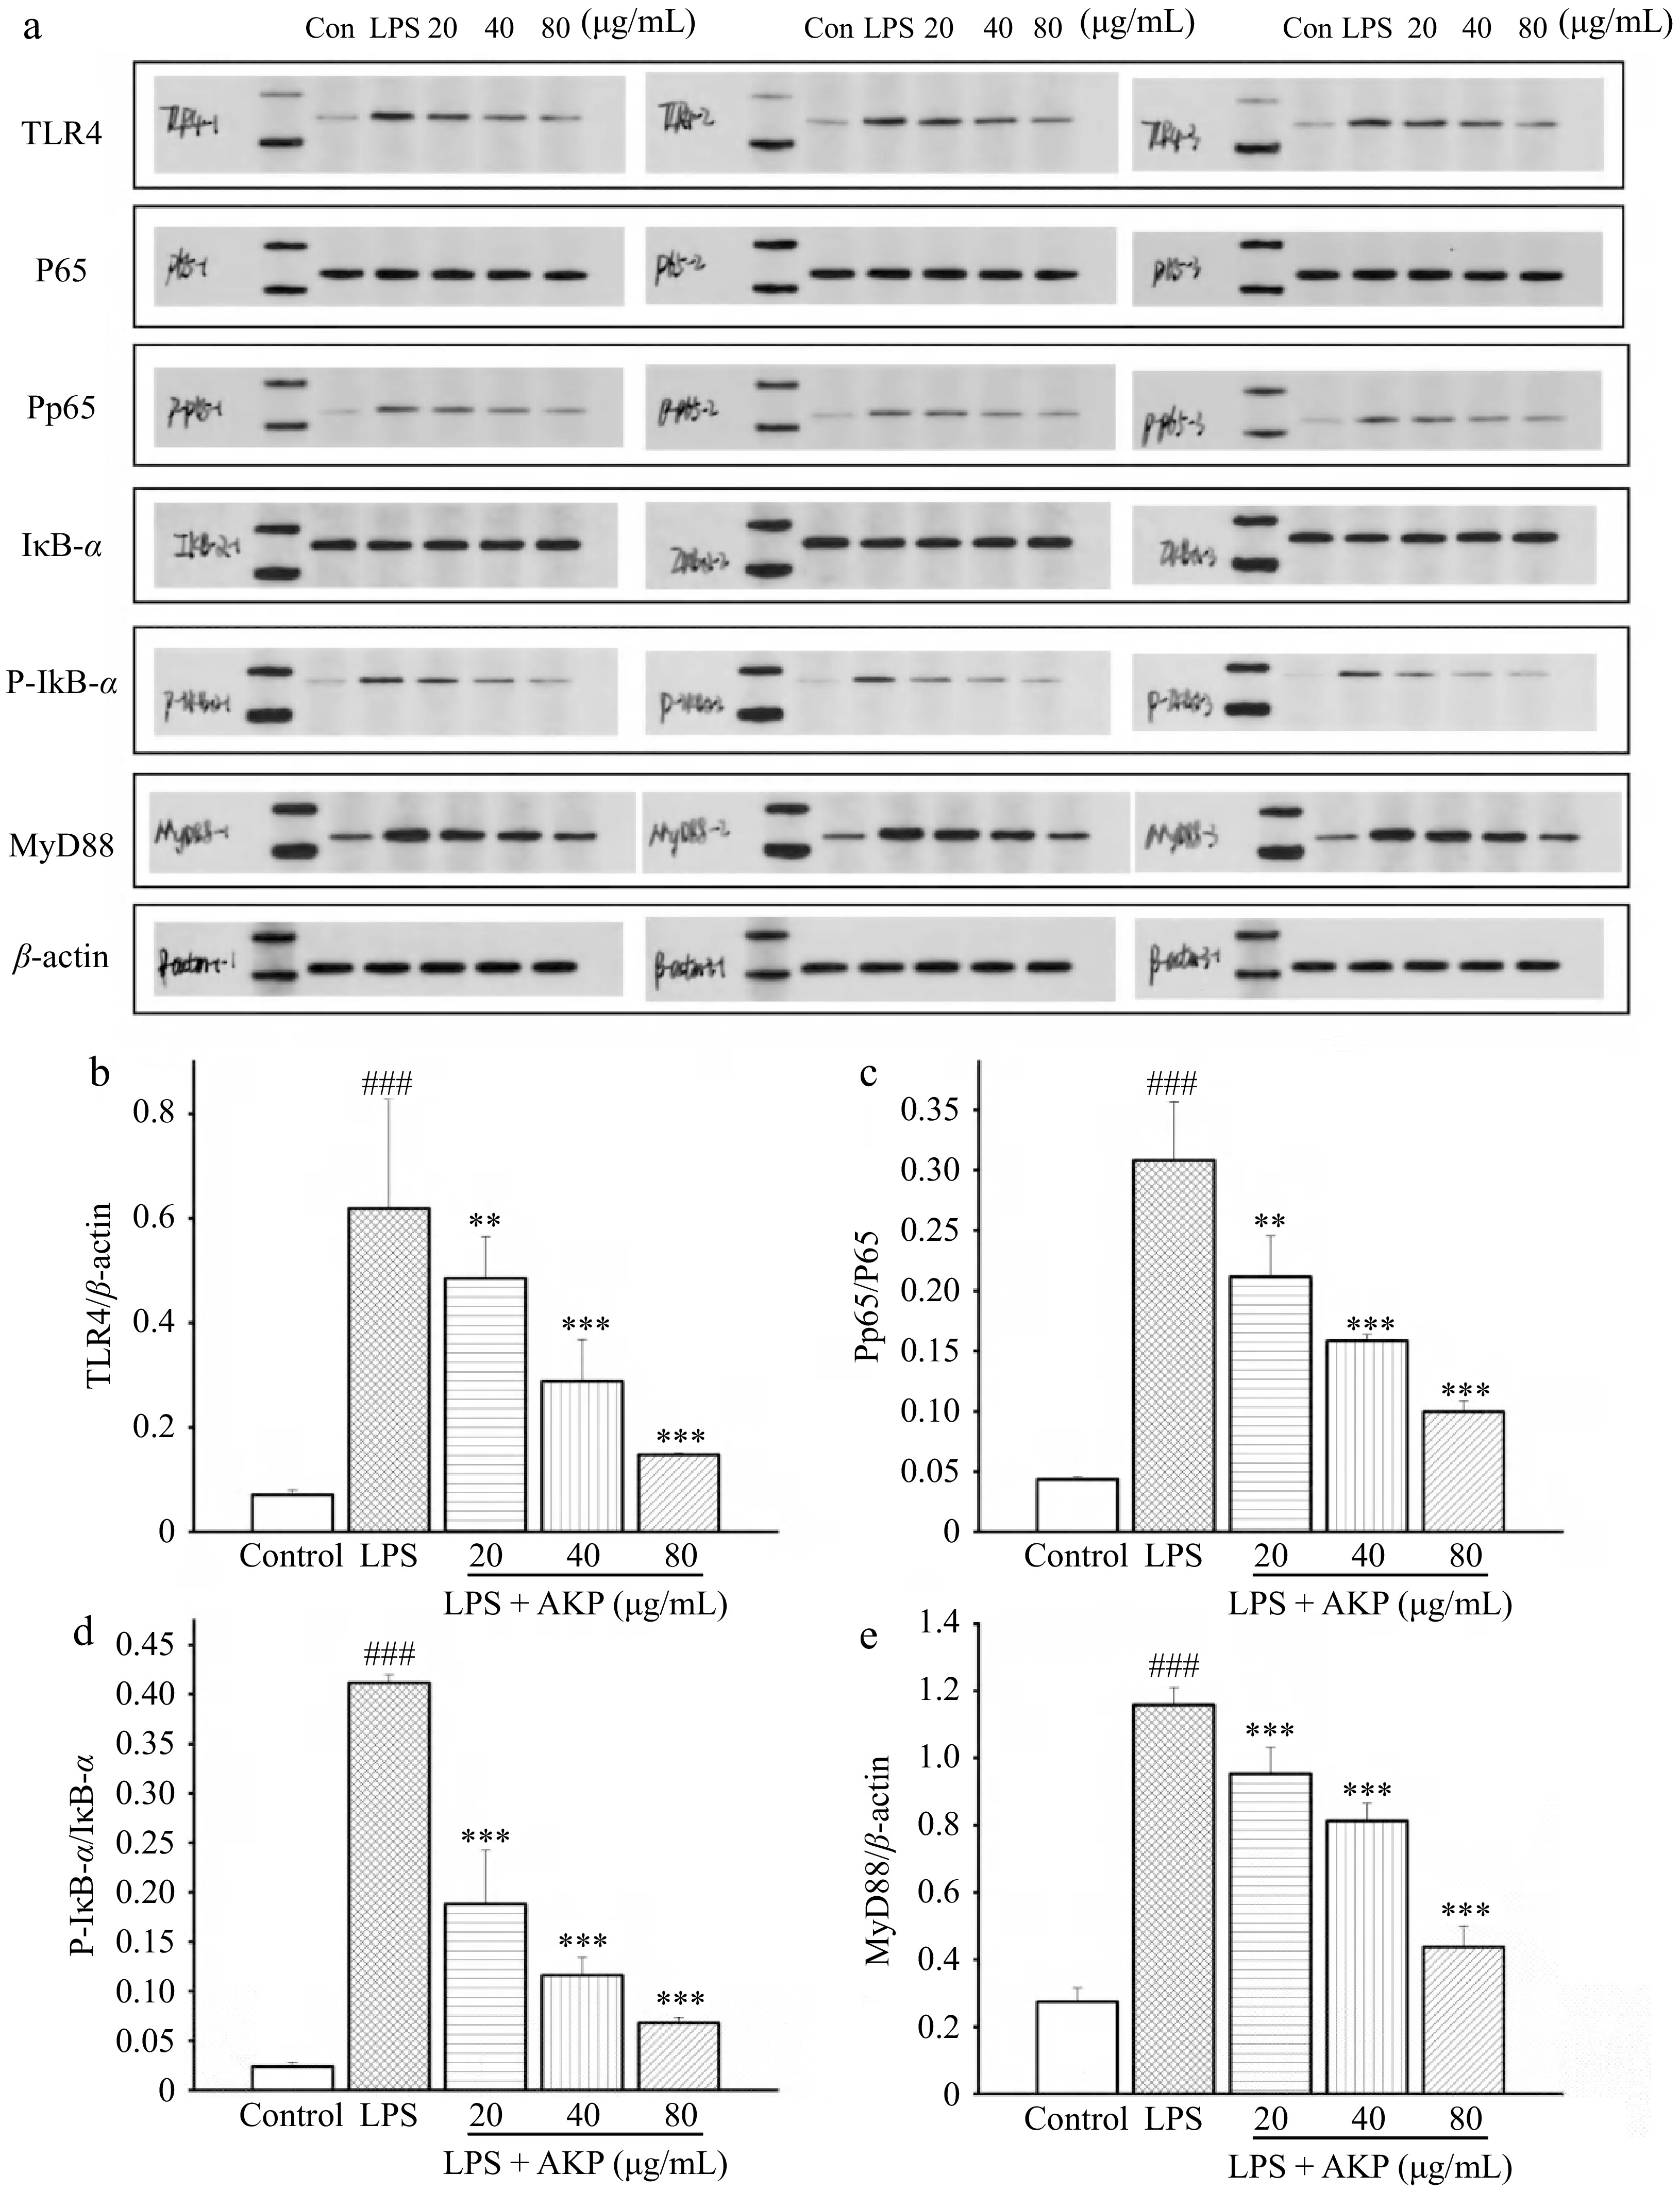
Figure 8.
Effect of AKP on the TLR4/NF-kB signaling pathway related proteins in RAW264.7 cells induced by LPS. (a) Protein imprinting map, (b) TRL4 protein expression, (c) P-P65/P65 protein expression, (d) P-IκB-α/IκB-α protein expression, (e) MyD88 protein expression. Compared with control group, ### p < 0.001; Compared with model group, *** p < 0.001, ** p < 0.01. Three columns represent three repeated experiments.
-
Linkage type Retention time (min) Derivative name MW Relative molar ratio (%) T-Araf 7.675 1,4-Di-O-acetyl-1-deuterio-2,3,5-tri-O-methyl-D-arabinitol 279 2.45 T-Galp 10.3211 1,5-Di-O-acetyl-1-deuterio-2,3,4,6-tetra-O-methyl-D-galactitol 323 39.50 4-Manp 12.8975 1,4,5-Tri-O-acetyl-1-deuterio-2,3,6-tri-O-methyl-D-mannitol 351 31.91 4-Glcp 13.5788 1,4,5-Tri-O-acetyl-1-deuterio-2,3,6-tri-O-methyl-D-glucitol 351 1.64 6-Galp 15.159 1,5,6-Tri-O-acetyl-1-deuterio-2,3,4-tri-O-methyl-D-galactitol 351 1.47 4,6-Manp 18.1059 1,4,5,6-Tetra-O-acetyl-1-deuterio-2,3-di-O-methyl-D-mannitol 379 21.95 3,6-Galp 20.7715 1,3,5,6-tetra-O-acetyl-2,4-di-O-methyl galactitol 379 1.05 Table 1.
AKP methylation analysis data.
-
Code Glycosyl residues Chemical shifts (ppm) H1/C1 H2/C2 H3/C3 H4/C4 H5/C5 H6/C6 A α-D-Galp-(1→ 4.95 3.77 3.74 4.06 3.84 3.69 98.77 71.33 71.21 69.89 73.34 61.21 B →4)-β-D-Manp-(1→ 4.43 3.6 3.83 3.86 3.88 3.84,3.5 103.13 69.78 71.33 76.65 69.22 61.35 C →4,6)-β-D-Manp-(1→ 4.43 3.59 3.83 3.87 n.d. 3.74,4.07 103.15 69.87 71.2 76.65 n.d. 68.41 D α-L-Araf-(1→ 5.17 4.15 n.d. 4.05 n.d. / 109.28 81.37 n.d. 83.79 n.d. / n.d.: not detected. Table 2.
Chemical shifts of sugar residues 1H and 13C.
Figures
(8)
Tables
(2)