-
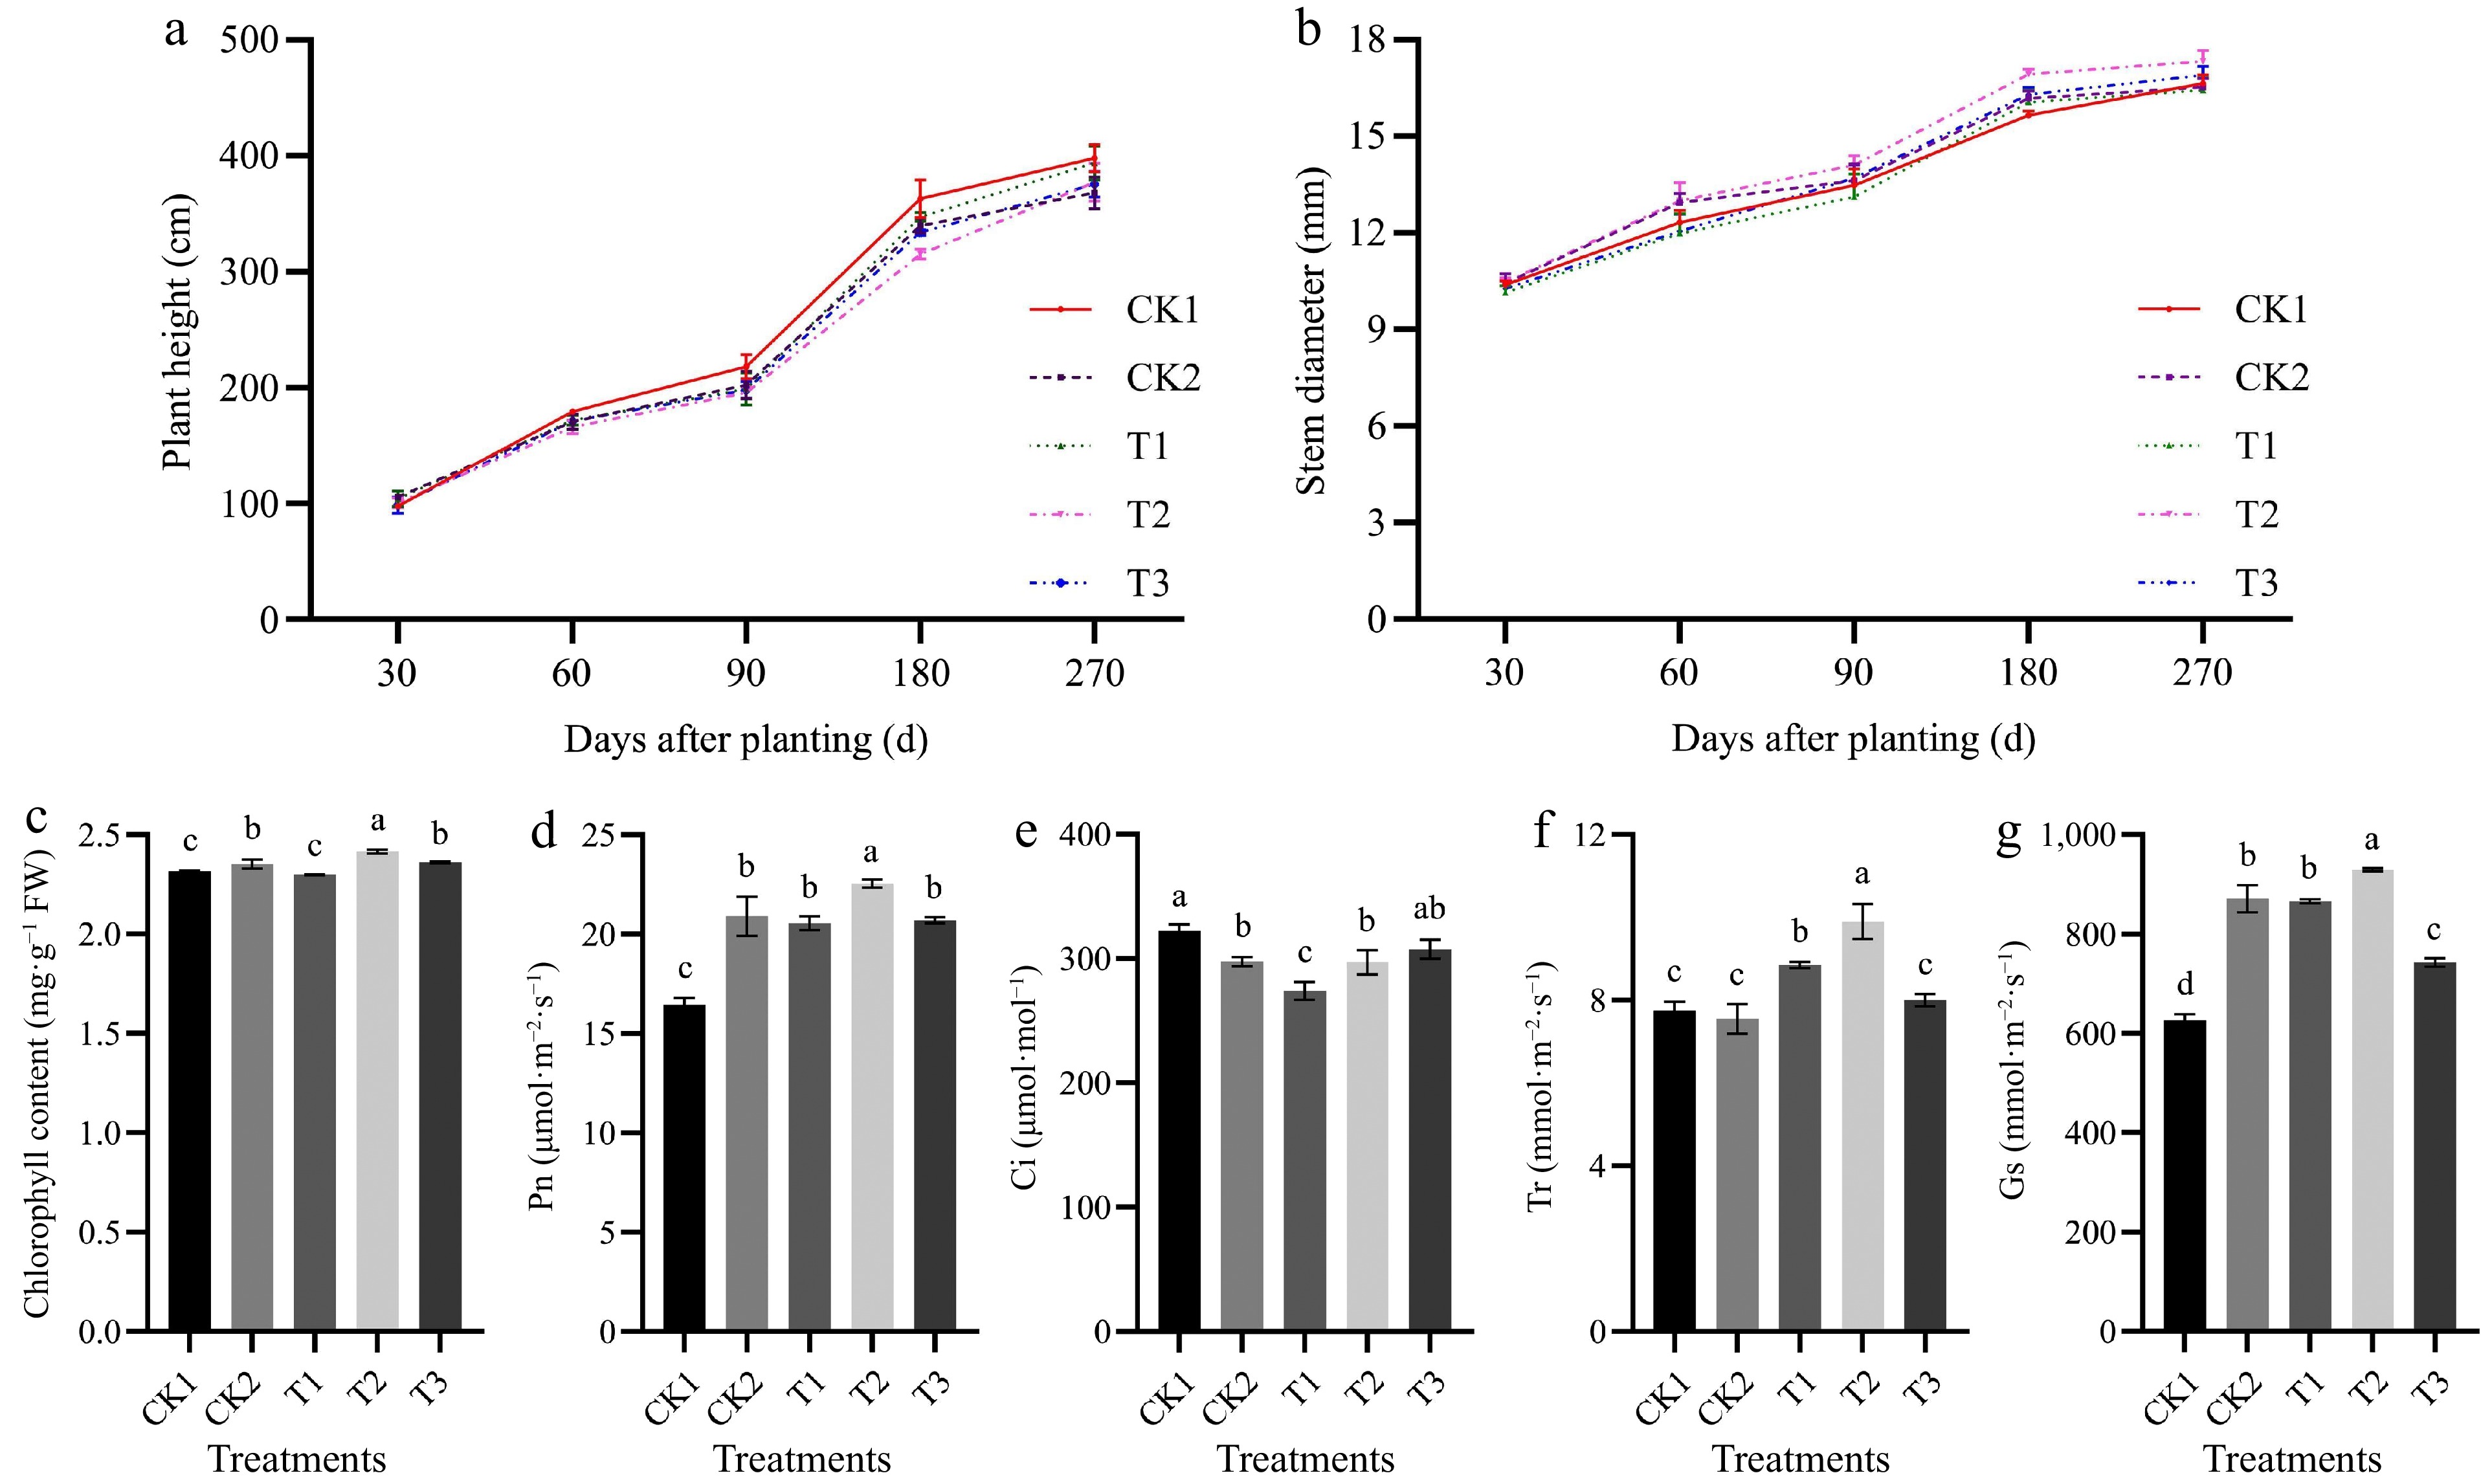
Figure 1.
The effects of different irrigation frequencies on (a) tomato plant height, and (b) stem diameter during 0−270 d. The effects of different irrigation frequencies on (c) tomato chlorophyll content, and photosynthetic parameters (d)−(g) at 90 d after planting. Pn: Net photosynthetic rate, Ci: Intercellular carbon dioxide concentration, Gs: Stomatal conductance, Tr: Transpiration rate. Different letters (a, b, c) indicate significant differences between groups (p < 0.05).
-
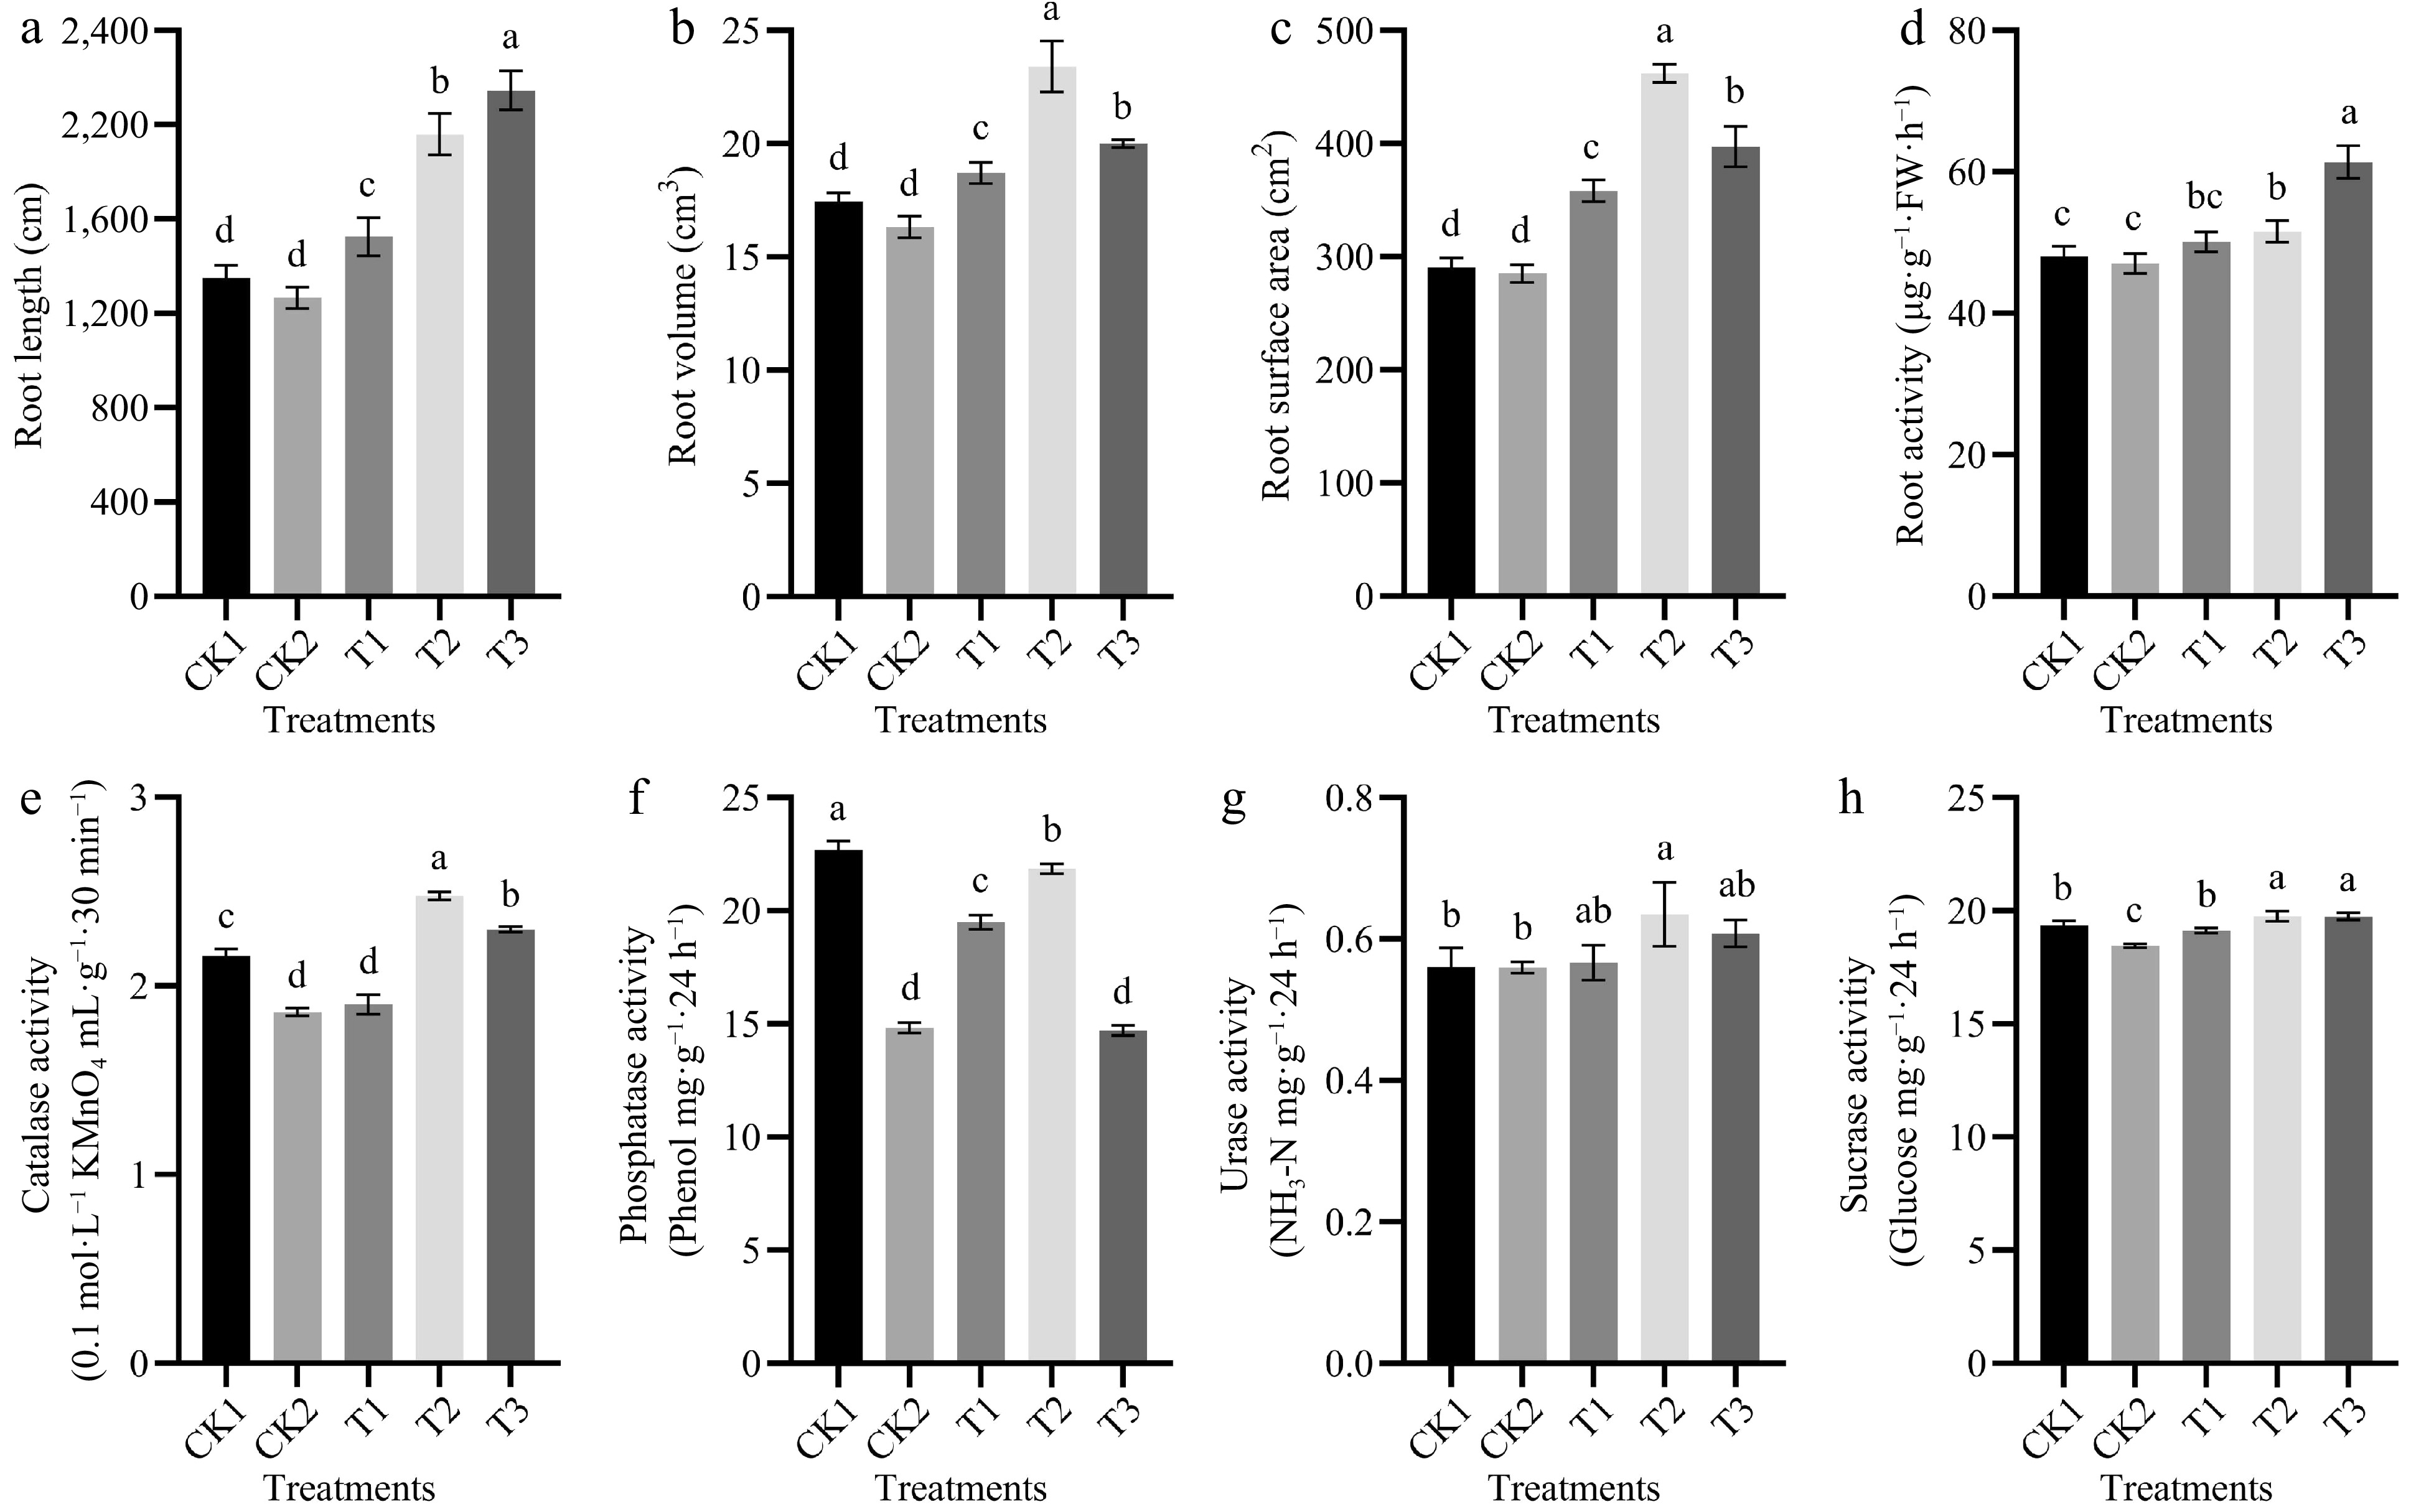
Figure 2.
The effects of different irrigation frequencies on (a) tomato root length, (b) root surface area, (c) root volume, (d) root vigor, and (e) soil activities of CAT, (f) ALP, (g) UE, and (h) SC at 90 d after planting. Different letters (a, b, c) indicate significant differences between groups (p < 0.05).
-
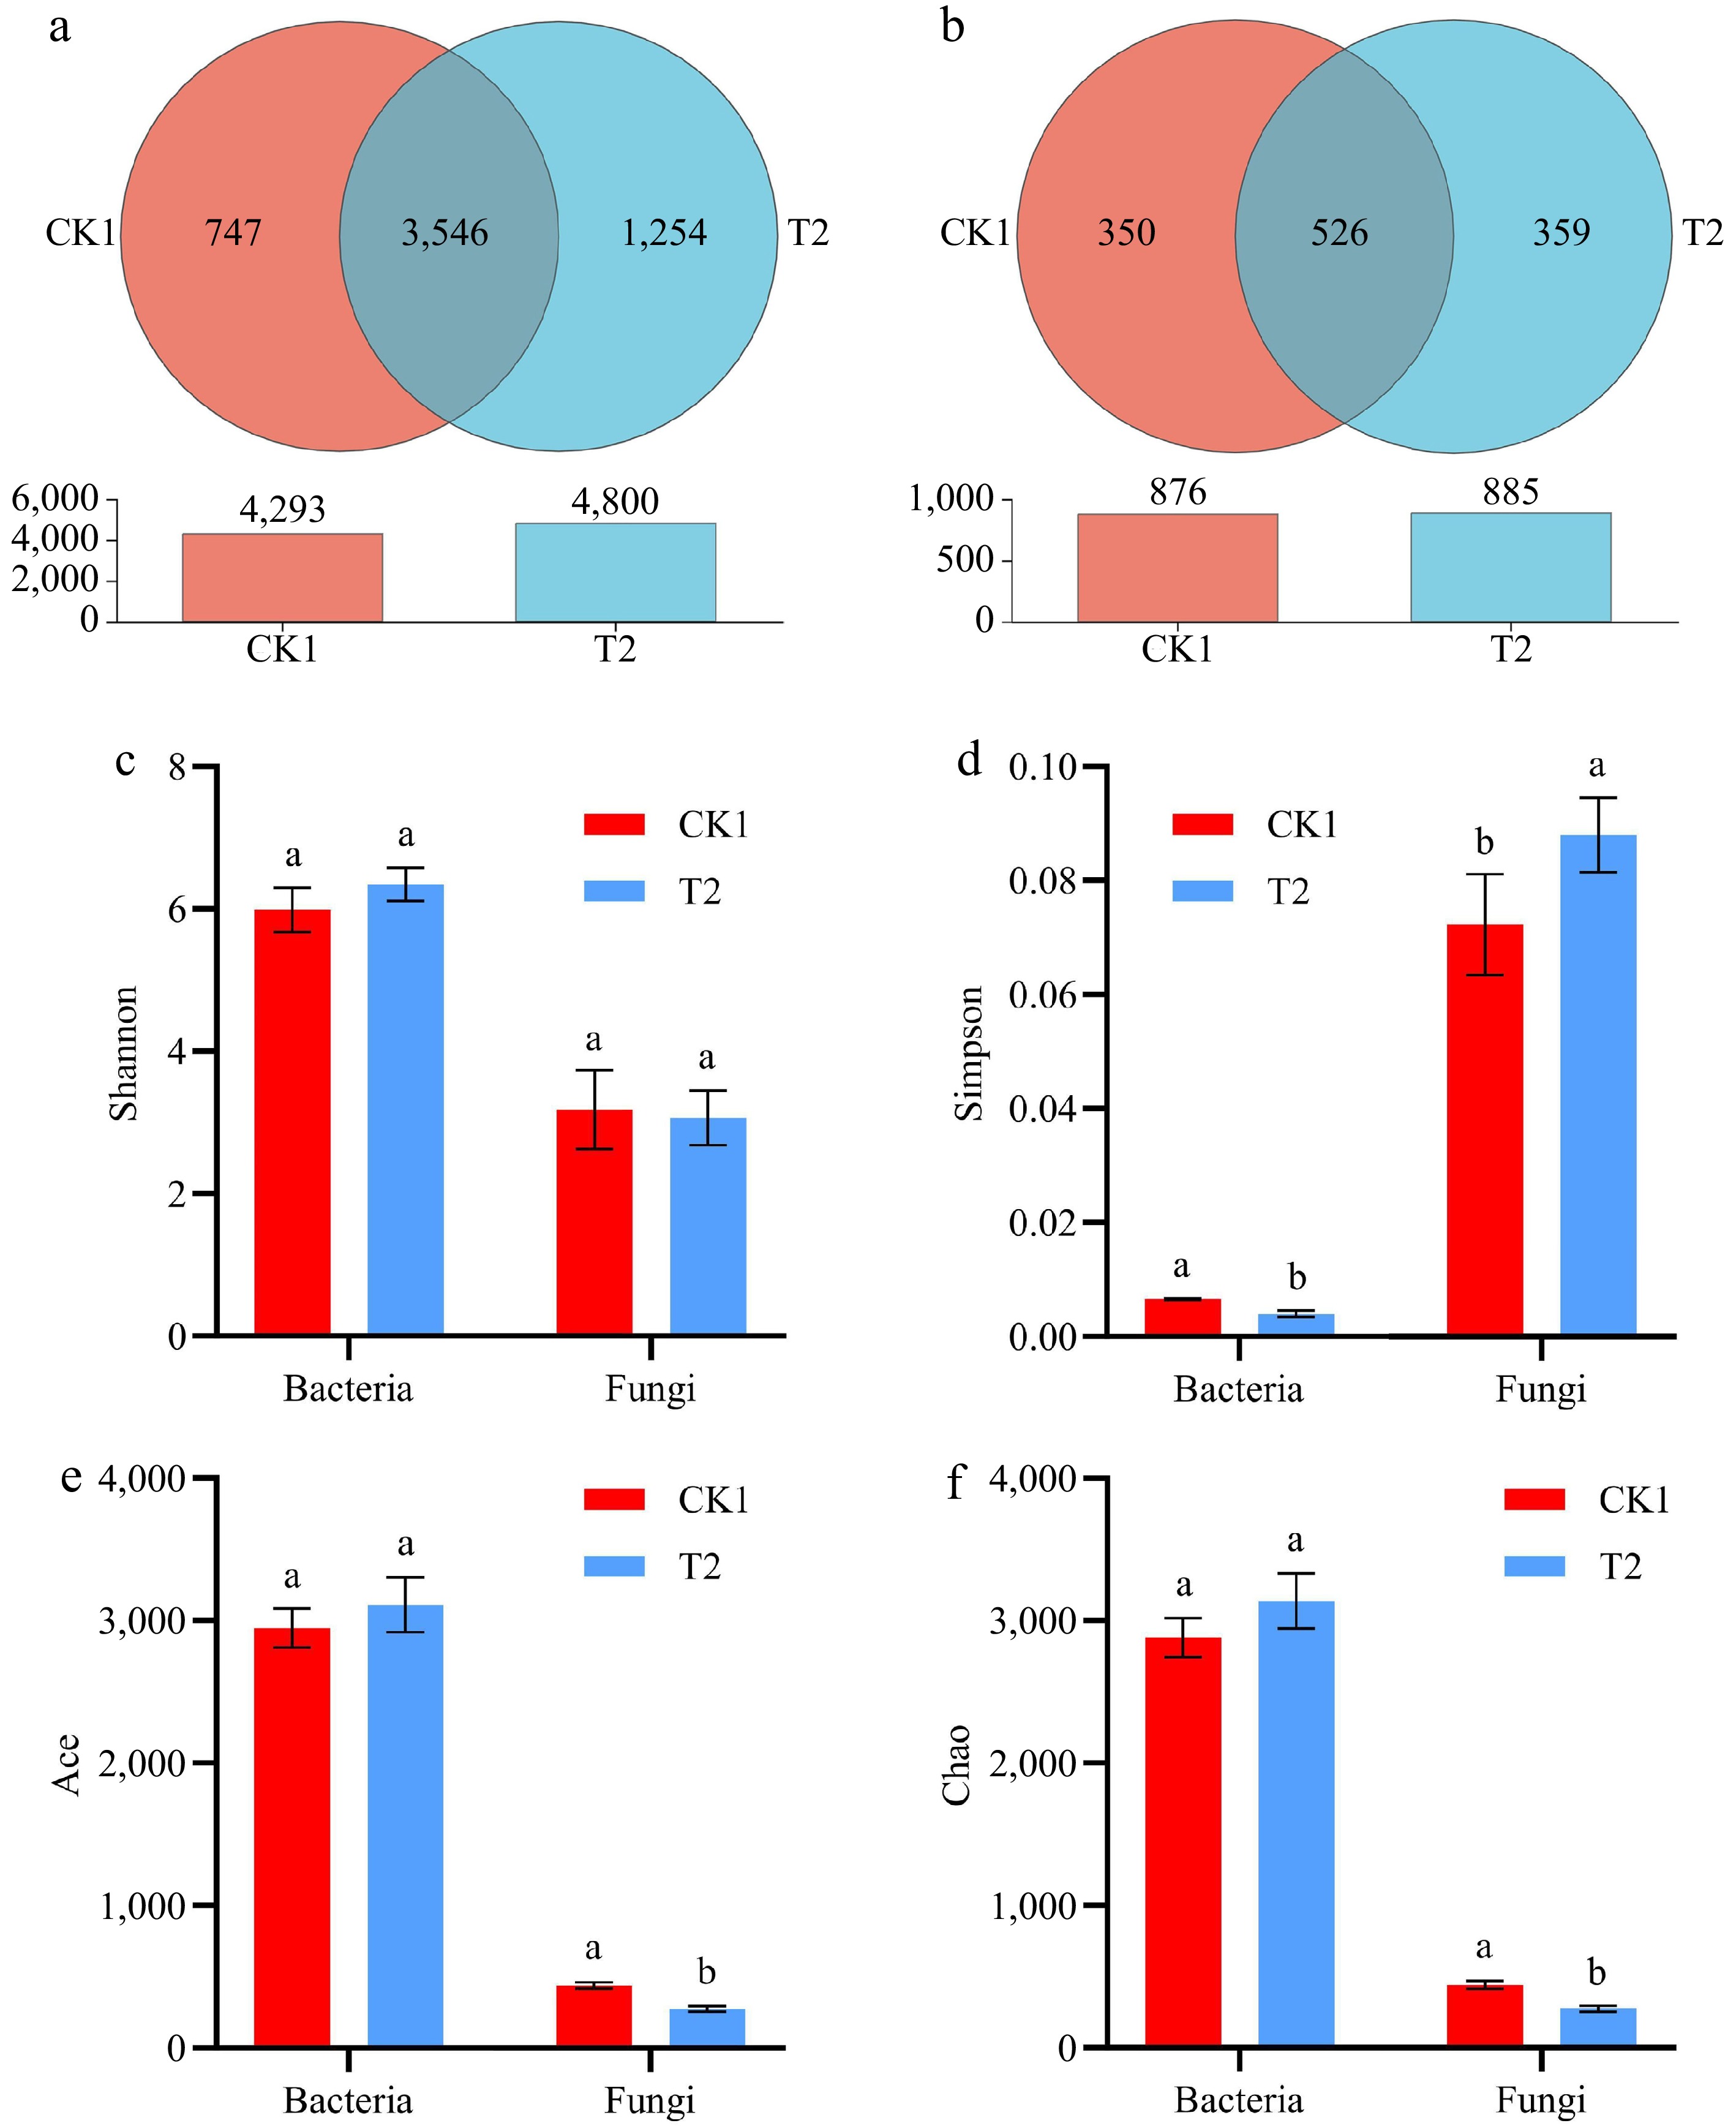
Figure 3.
The effect of CK1 and T2 on the composition of (a) bacterial, and (b) fungal OTUs in soil. (c)−(f) Bacterial and fungal alpha diversity indices of CK1 and T2 at the OTU level.
-
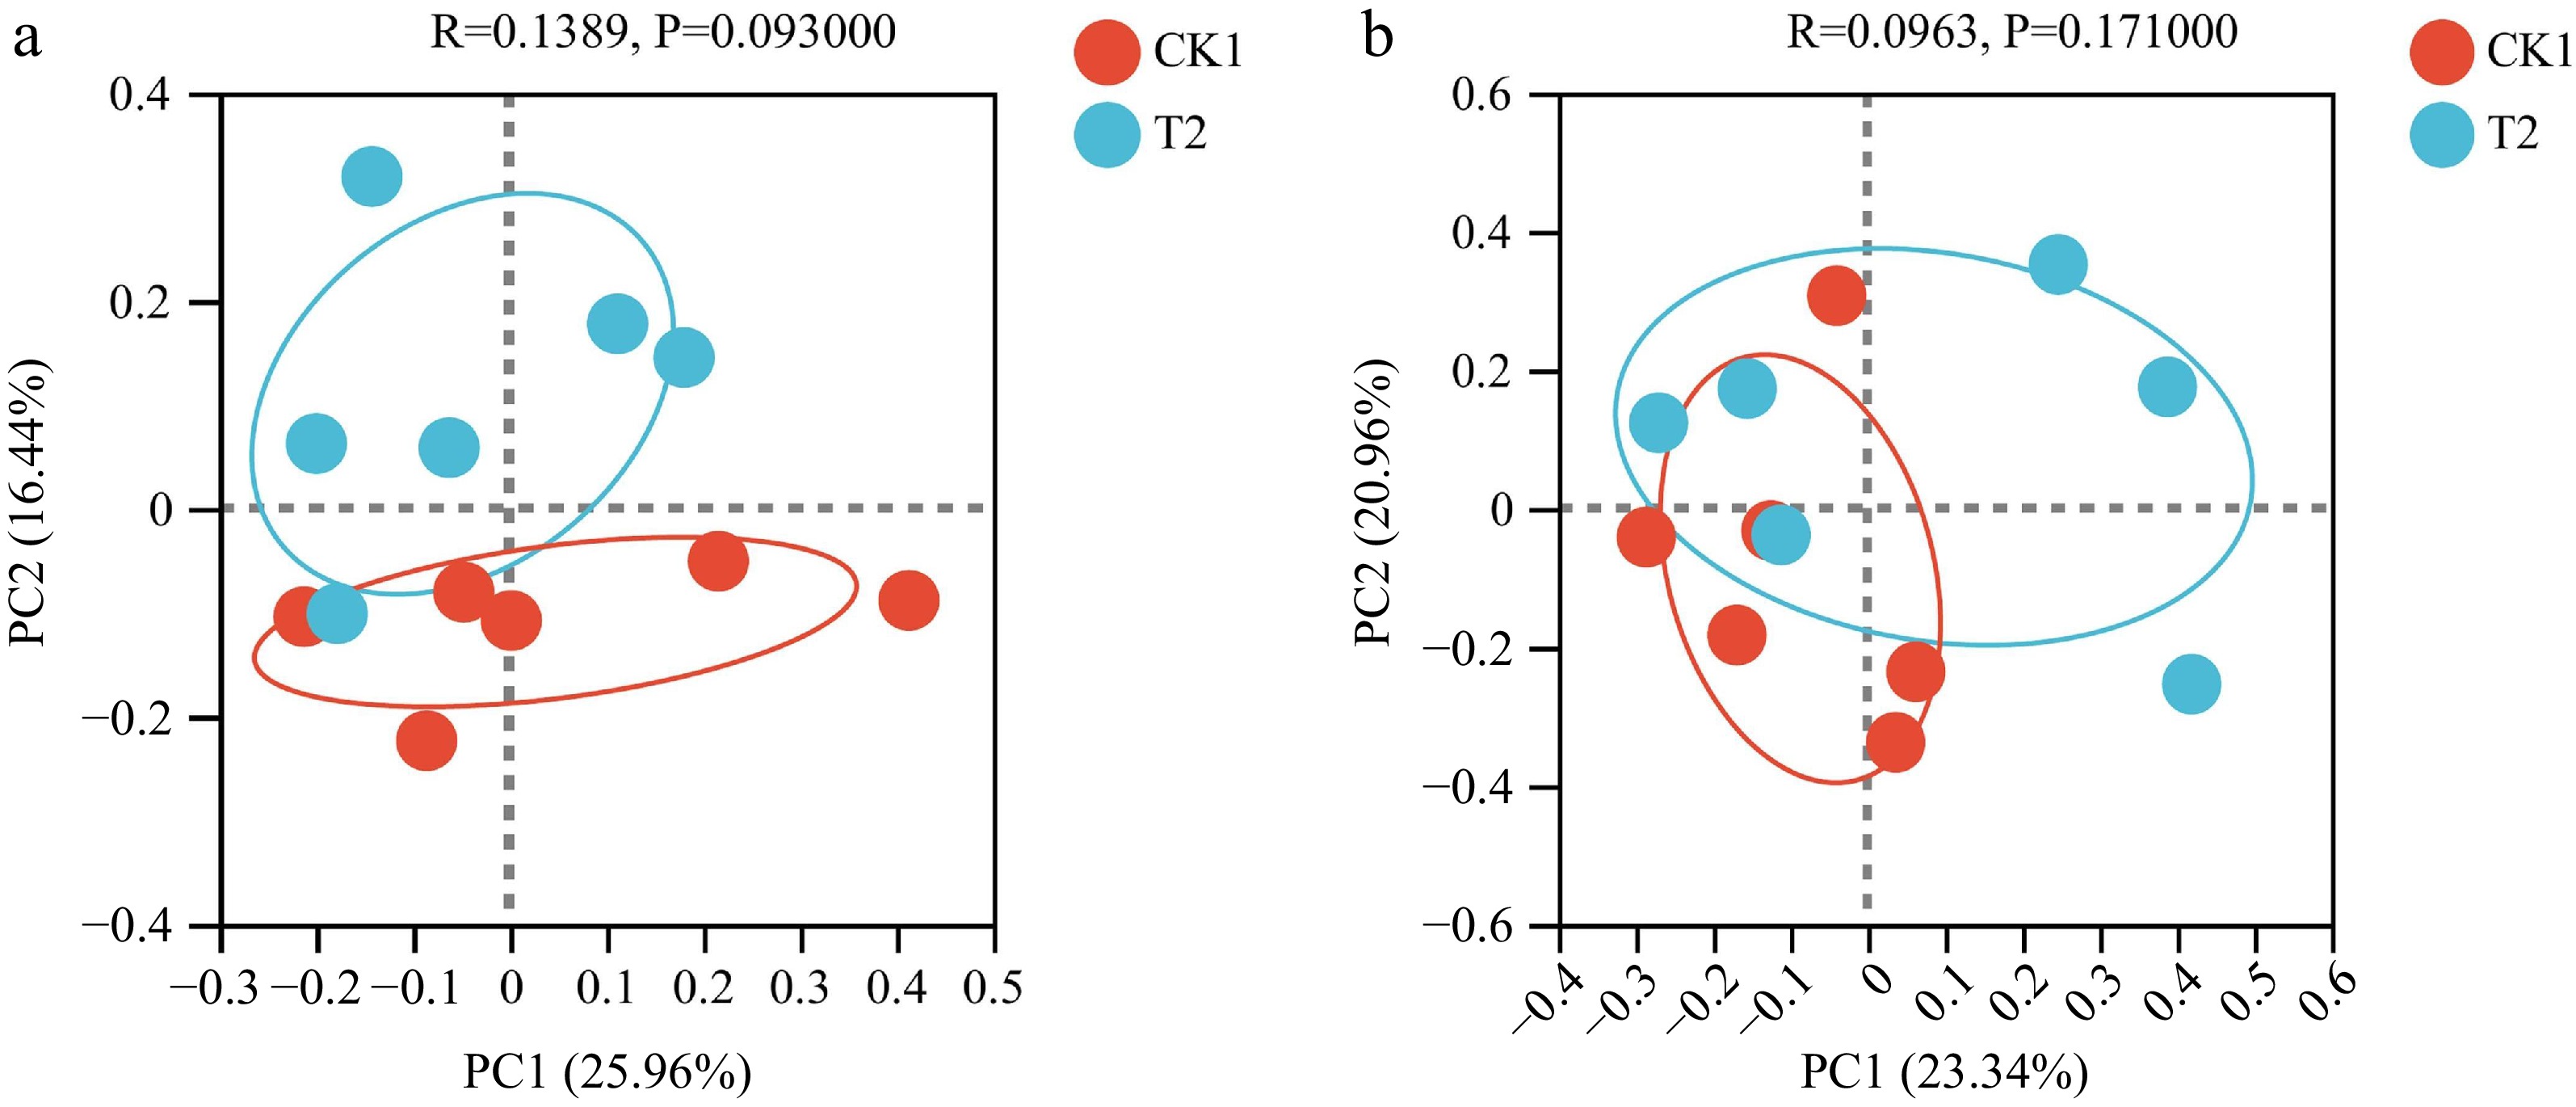
Figure 4.
Principal co-ordinates analysis (PCoA) of bacterial community structure in CK1 and T2.
-
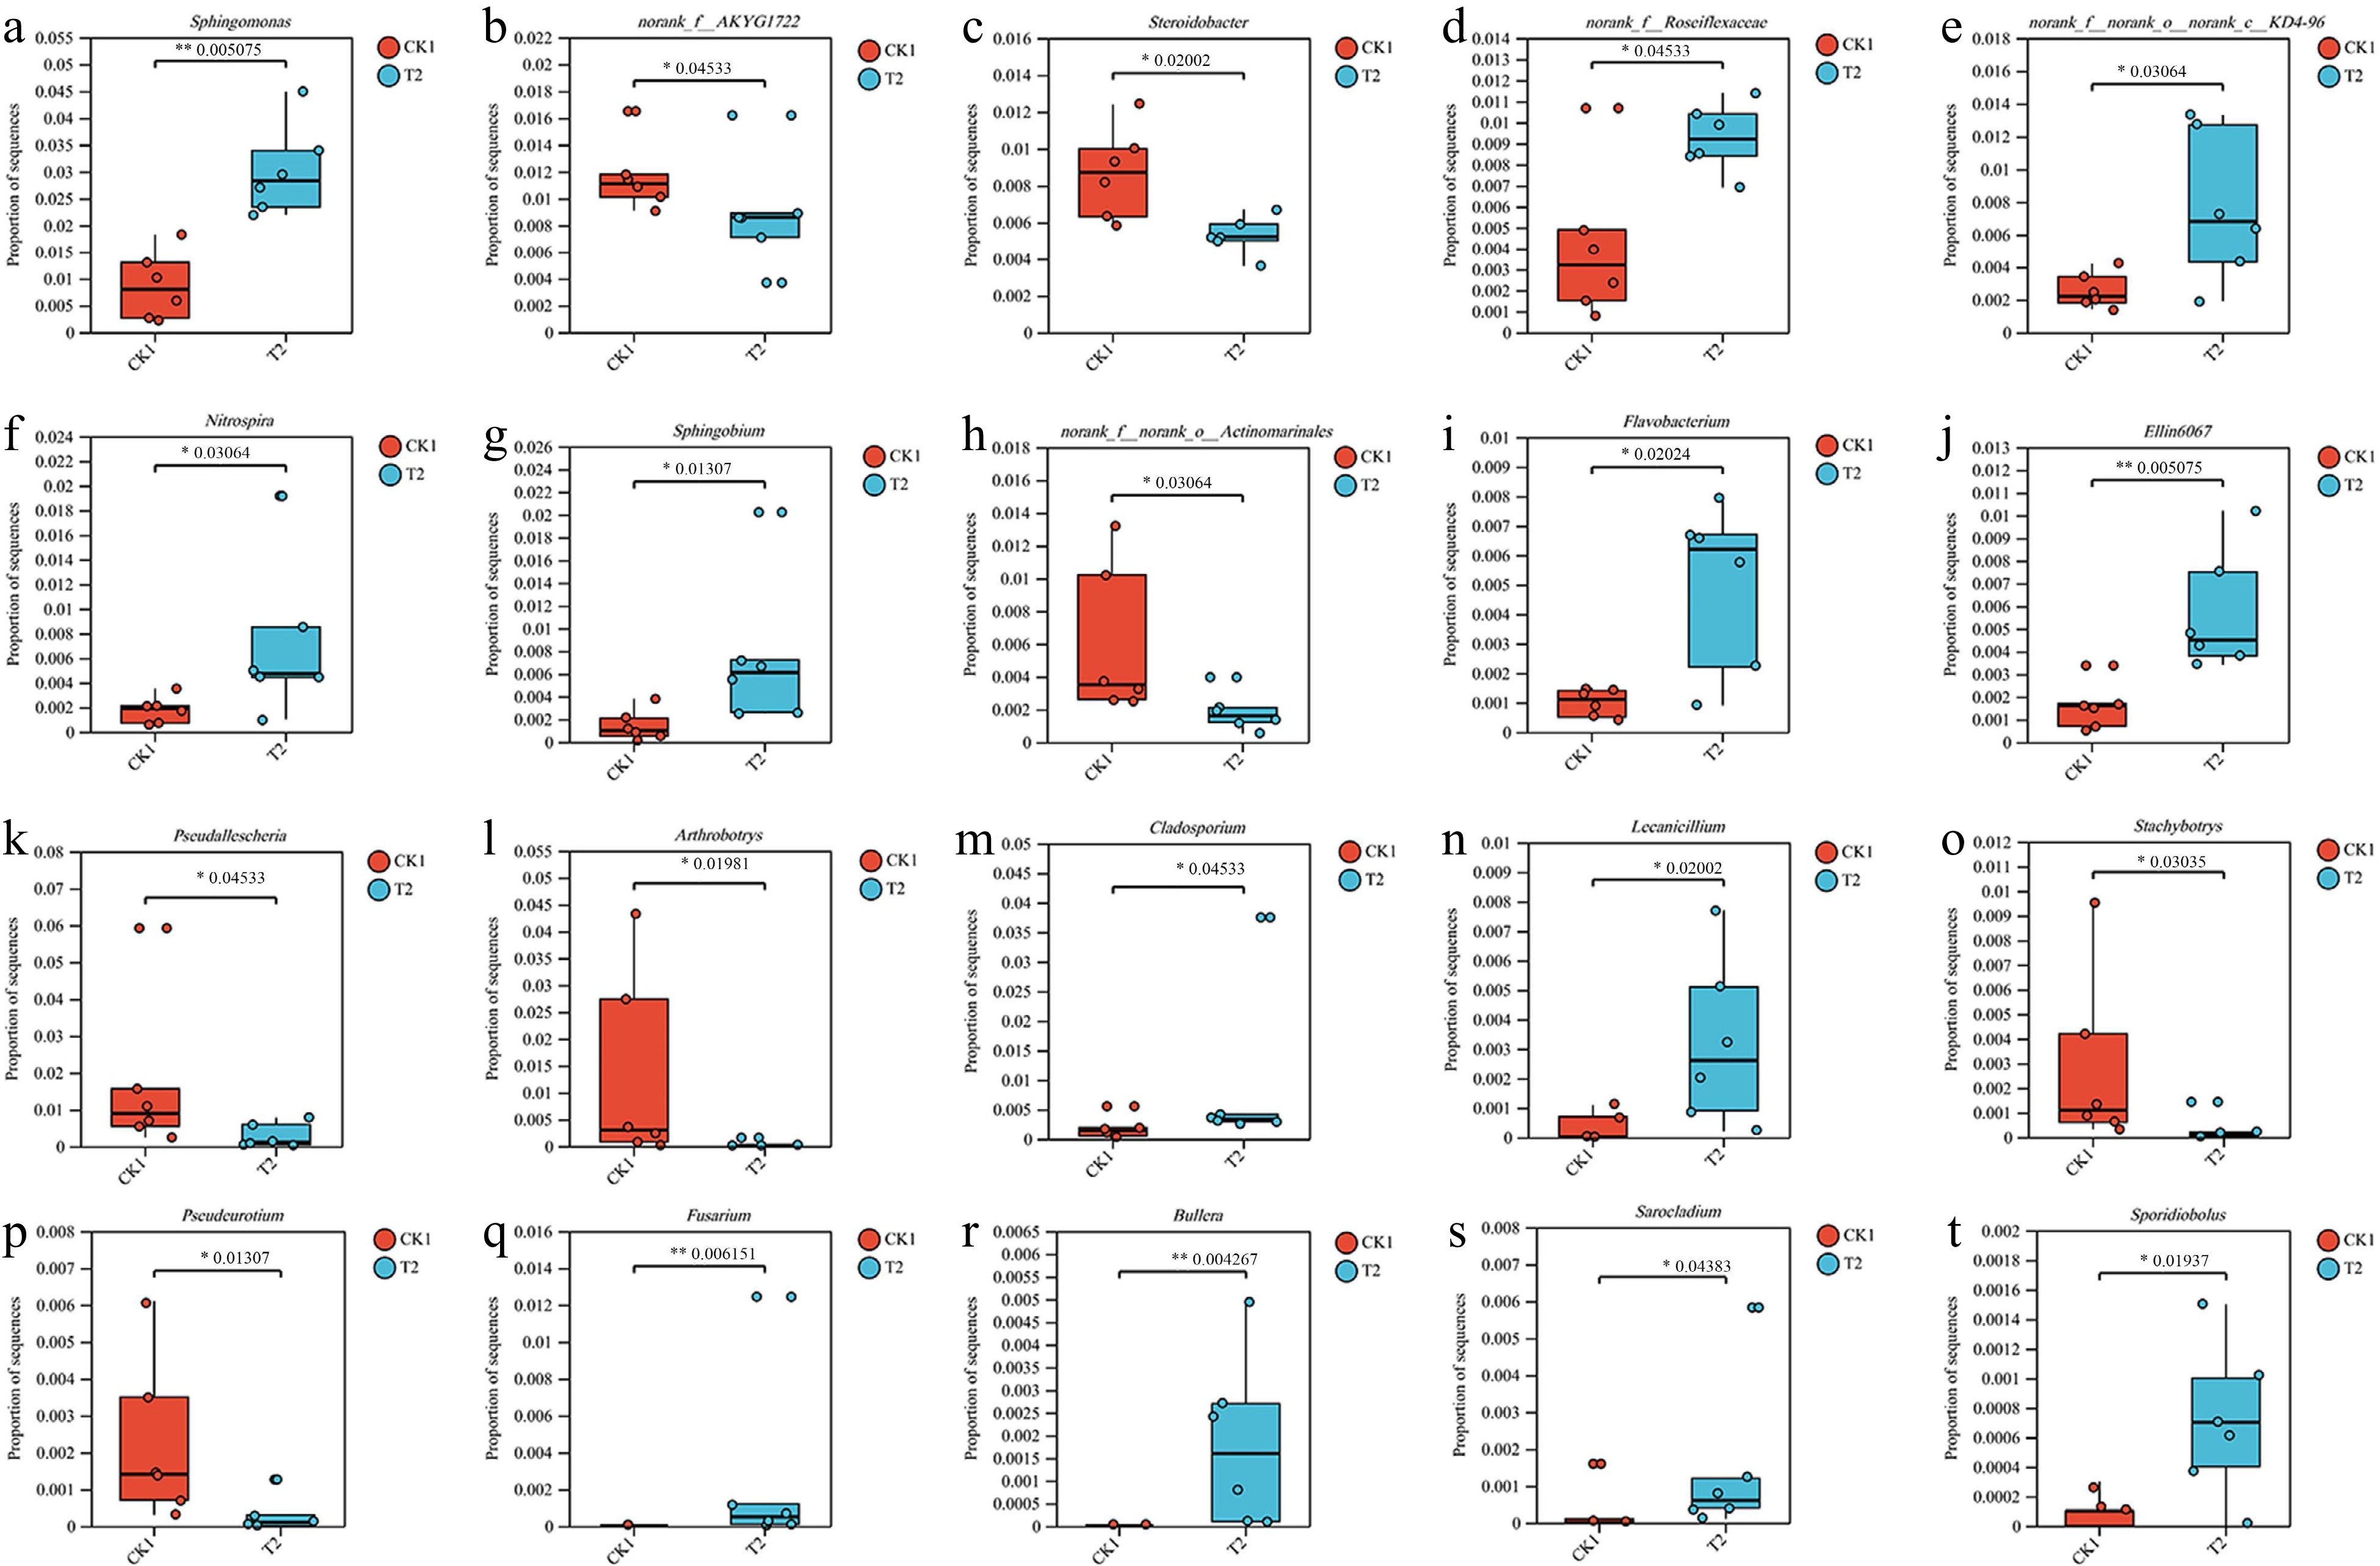
Figure 5.
Wilcoxon rank-sum test chart of the (a)−(j) ten bacterial and (k)−(t) fungal genus with the highest abundance averages.
-
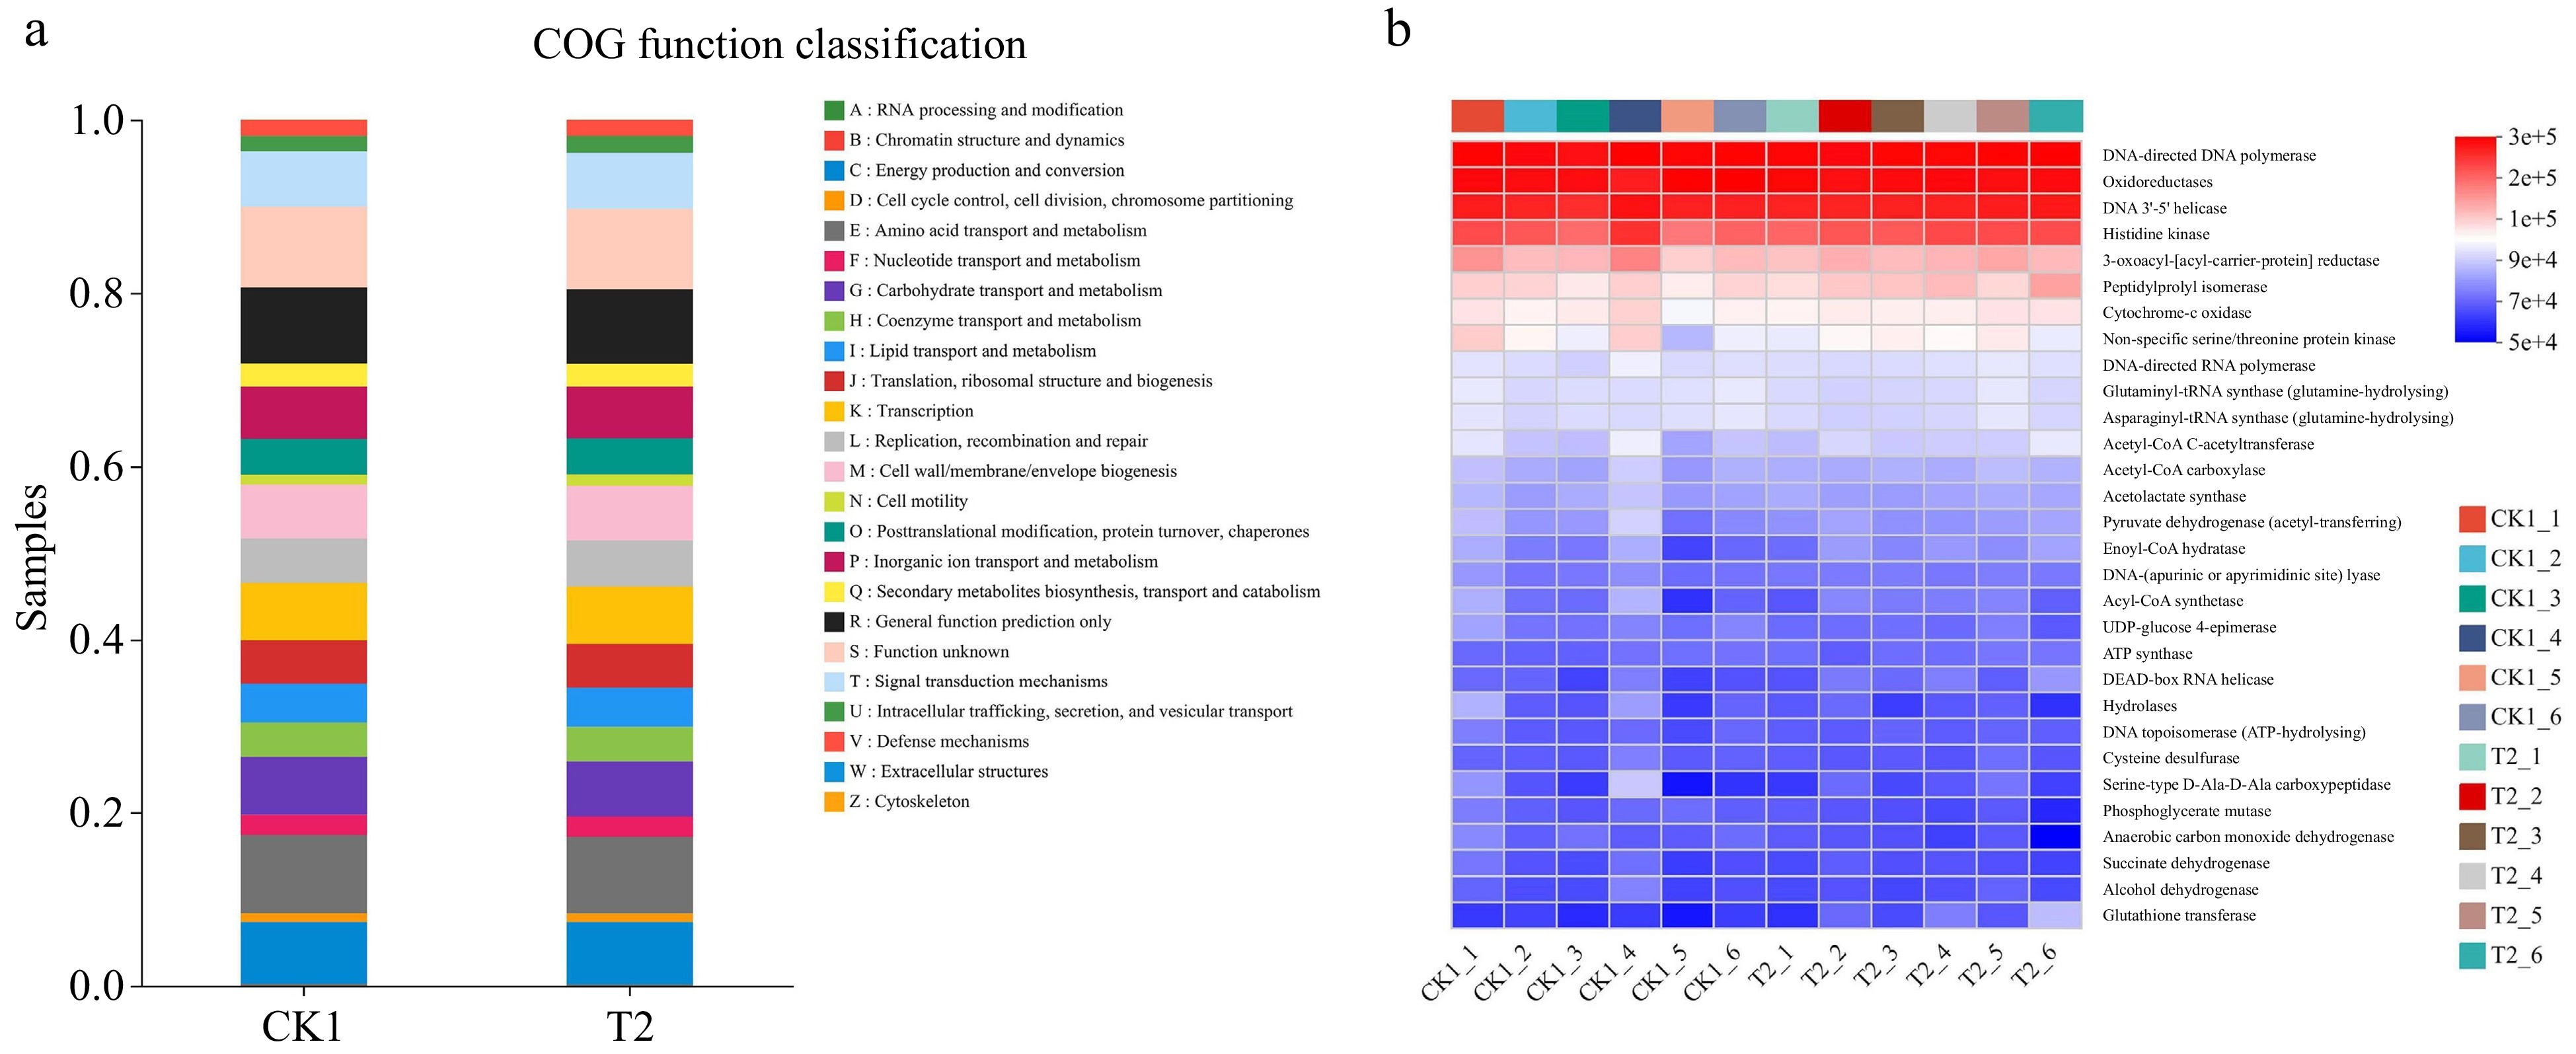
Figure 6.
Clusters of Orthologous Groups (COG) functional classification of PICRUSt in (a) bacteria of CK1 and T2. The functional heatmap predicted by PICRUSt2 in (b) bacteria in CK1 and T2.
-
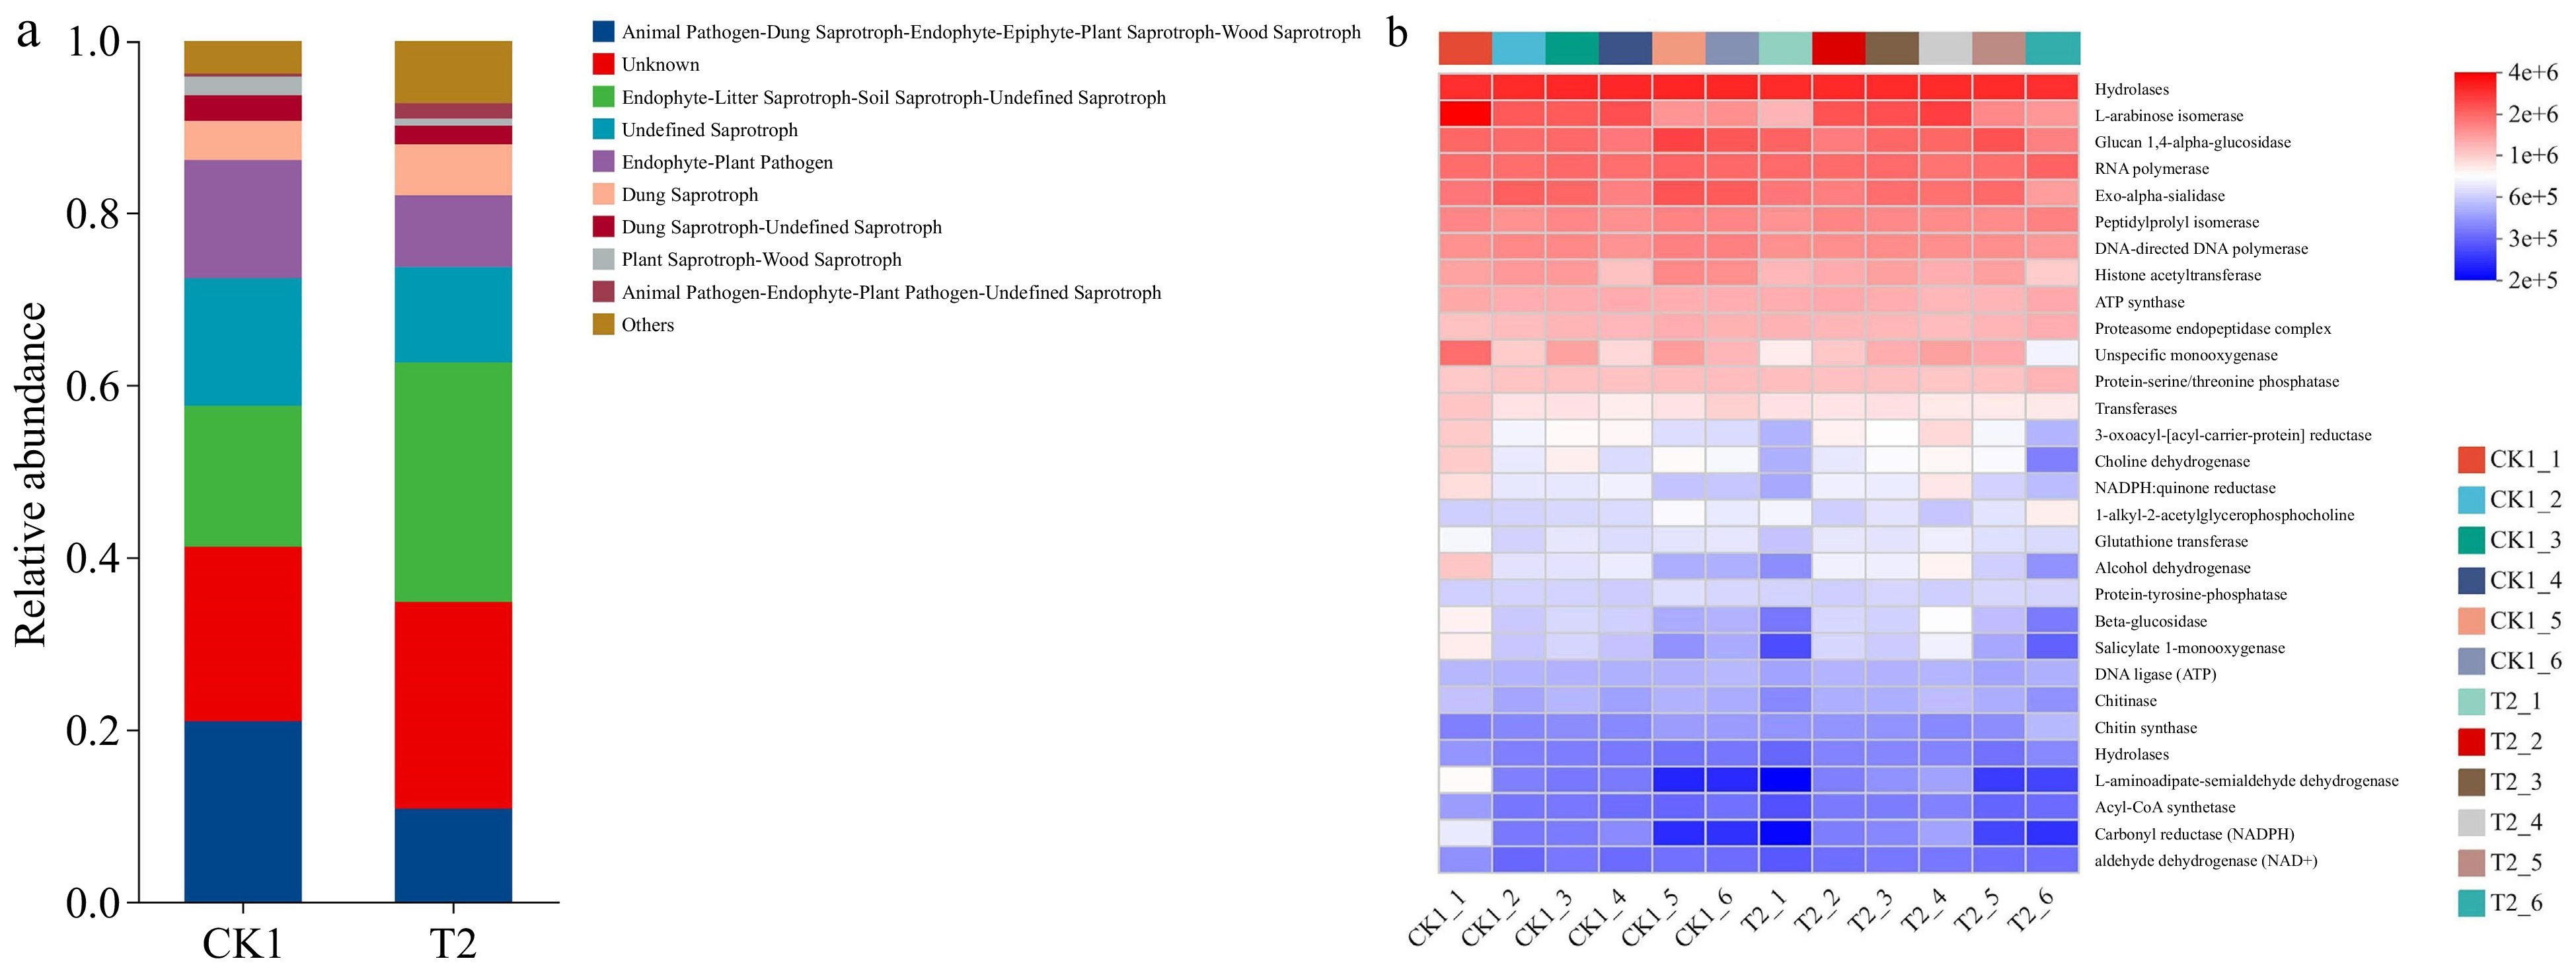
Figure 7.
Taxonomic analysis of fungal communities by microecological guilds (FUNGuild) (a) of CK1 and T2. The functional heatmap predicted by PICRUSt2 in (b) fungi in CK1 and T2.
-
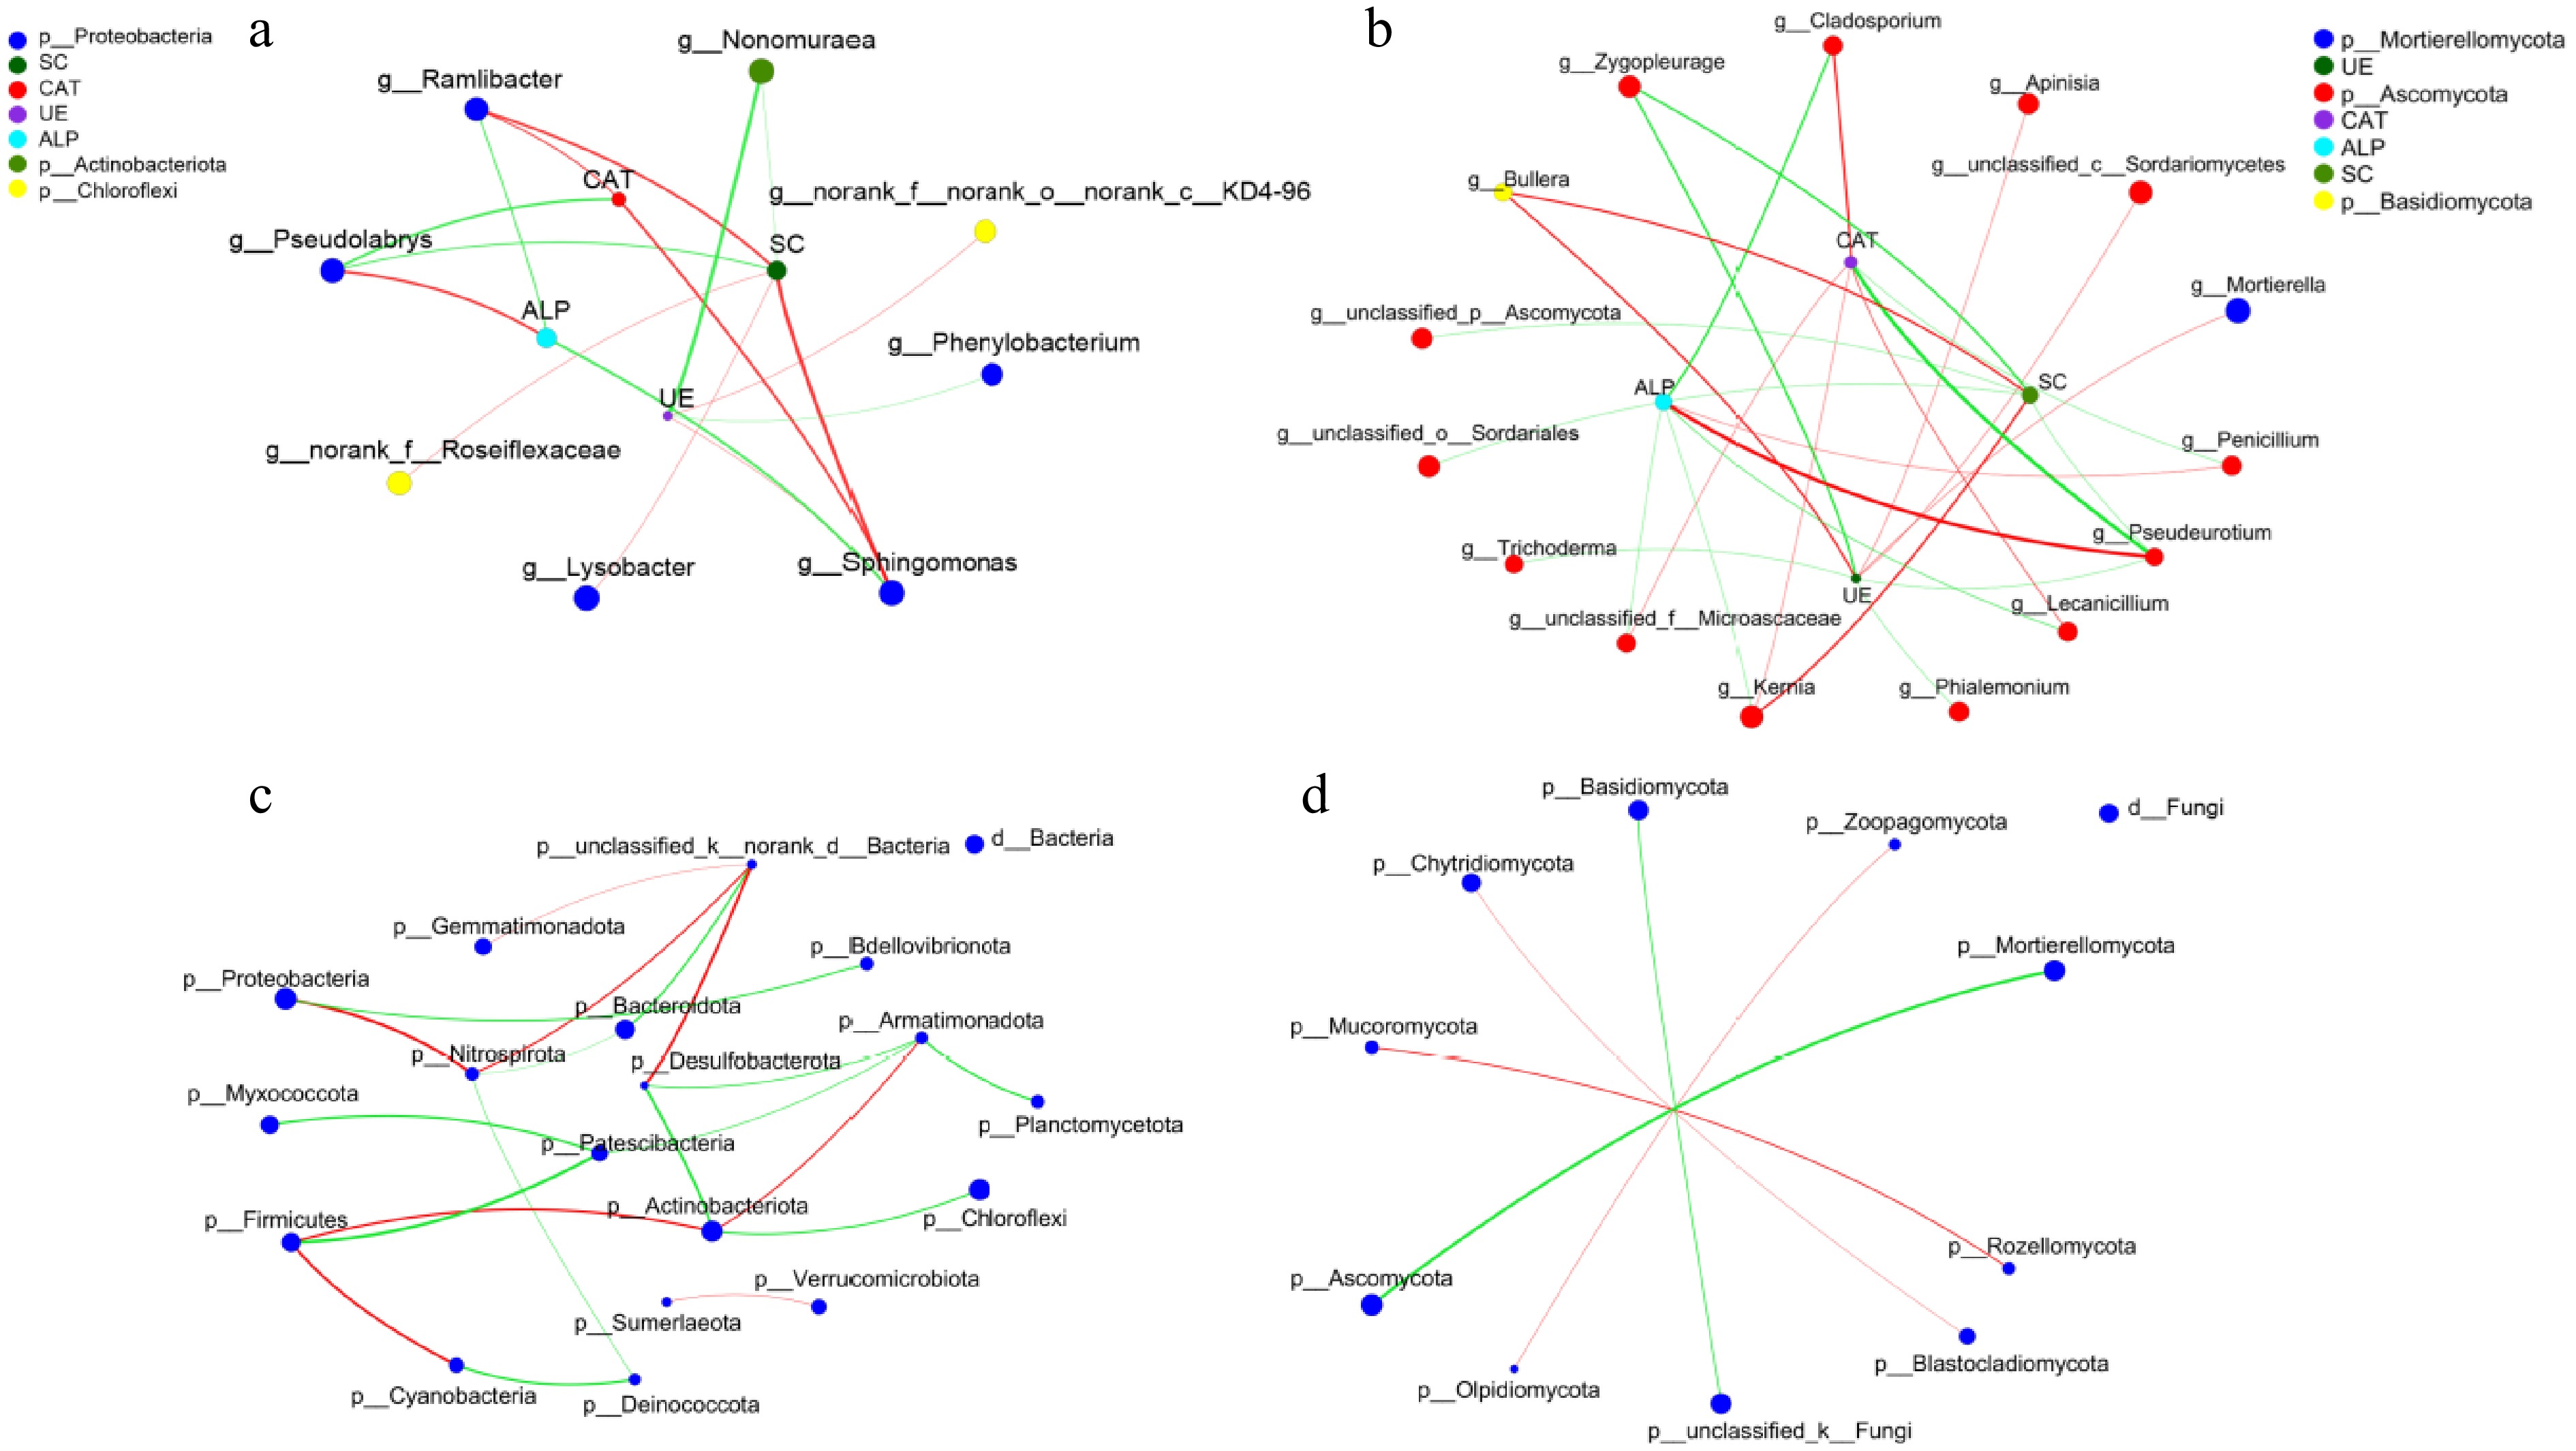
Figure 8.
The correlations between different (a) bacterial and (b) fungal genera with soil enzyme activities. The microbial interactions in different (c) bacterial and (d) fungal phylum.
-
Treatments Root dry weight (g·plant−1) Stem dry weight (g·plant−1) Leaf dry weight (g·plant−1) Fruit dry weight (g·plant−1) Yield
(kg·667m−2)Water use efficiency (kg·m−3) CK1 13.62 ± 0.21b 161.67 ± 4.74ab 328.07 ± 2.72a 516.46 ± 11.74c 19,331.50 ± 245.48d 50.85 ± 0.65c CK2 11.85 ± 0.29e 129.73 ± 4.15c 286.44 ± 8.05b 507.28 ± 6.61c 19,998.18 ± 429.97bc 52.60 ± 1.13bc T1 12.35 ± 0.40d 136.20 ± 9.40c 281.58 ± 5.23b 497.58 ± 10.12c 19,745.05 ± 179.73c 51.93 ± 0.47bc T2 13.03 ± 0.25c 164.47 ± 8.36a 328.23 ± 8.08a 564.22 ± 13.49a 21,696.72 ± 212.22a 57.07 ± 0.56a T3 15.73 ± 0.21a 151.97 ± 3.59b 320.40 ± 1.94a 538.22 ± 5.63b 20,531.81 ± 563.53b 54.00 ± 1.48b Note: Different letters (a, b, c) indicate significant differences between groups (p < 0.05). Table 1.
The effects of different irrigation frequencies on tomato dry weight, yield, and water use efficiency.
-
OTU name CK1 relative
abundancesT2 relative
abundancesVariation in abundance OTU1357 3.23 2.00 −0.38 OTU3611 2.57 1.71 −0.33 OTU2845 2.44 1.49 −0.39 OTU4326 1.68 1.32 −0.21 OTU3270 1.87 1.01 −0.46 OTU3092 2.00 0.74 −0.63 OTU6159 1.75 0.80 −0.54 OTU1634 1.12 1.43 0.28 OTU6356 1.16 1.31 0.13 OTU1899 1.35 0.98 −0.27 OTU2173 0.55 1.63 1.96 OTU858 0.41 1.72 3.20 OTU675 1.19 0.91 −0.24 OTU2748 1.30 0.47 −0.64 OTU2911 1.10 0.36 −0.67 Table 2.
The variations in relative abundances reflect the distribution of OTU-level dominant bacteria in CK1 and T2.
-
OTU name CK1 relative abundances T2 relative
abundancesVariation in abundance OTU1634 31.56 14.20 −0.55 OTU812 16.62 22.73 0.37 OTU1140 16.63 17.24 0.04 OTU1752 3.15 5.25 0.67 OTU1573 4.78 0.86 −0.82 OTU1308 0.84 4.28 4.10 OTU185 2.47 2.54 0.03 OTU1512 0.03 4.82 159.67 OTU80 1.40 1.91 0.36 OTU1227 0.14 2.83 19.21 OTU427 1.65 1.06 −0.36 OTU1007 0.18 2.34 12.00 OTU1749 0.68 1.66 1.44 OTU961 1.63 0.24 −0.85 OTU1585 1.21 0.10 −0.92 Table 3.
The variations in relative abundances reflect the distribution of OTU-level dominant fungi in CK1 and T2.
-
Root length Root surface area Root volume Shannon 0.956** 0.945** 0.817* Simpson −0.982** −0.988** −0.937** Ace 0.493 0.384 0.487 Chao1 0.699 0.696 0.785 Catalase 0.971** 0.954** 0.973** Urease 0.926** 0.904* 0.795 Alkaline phosphatase −0.875* −0.821* −0.877* Sucrase 0.775 0.693 0.726 ** significant correlation at the 0.01 level; * significant correlation at the 0.05 level (2-tailed). Table 4.
Correlation analysis between soil microbial diversity, enzyme activities, and the root system.
Figures
(8)
Tables
(4)