-
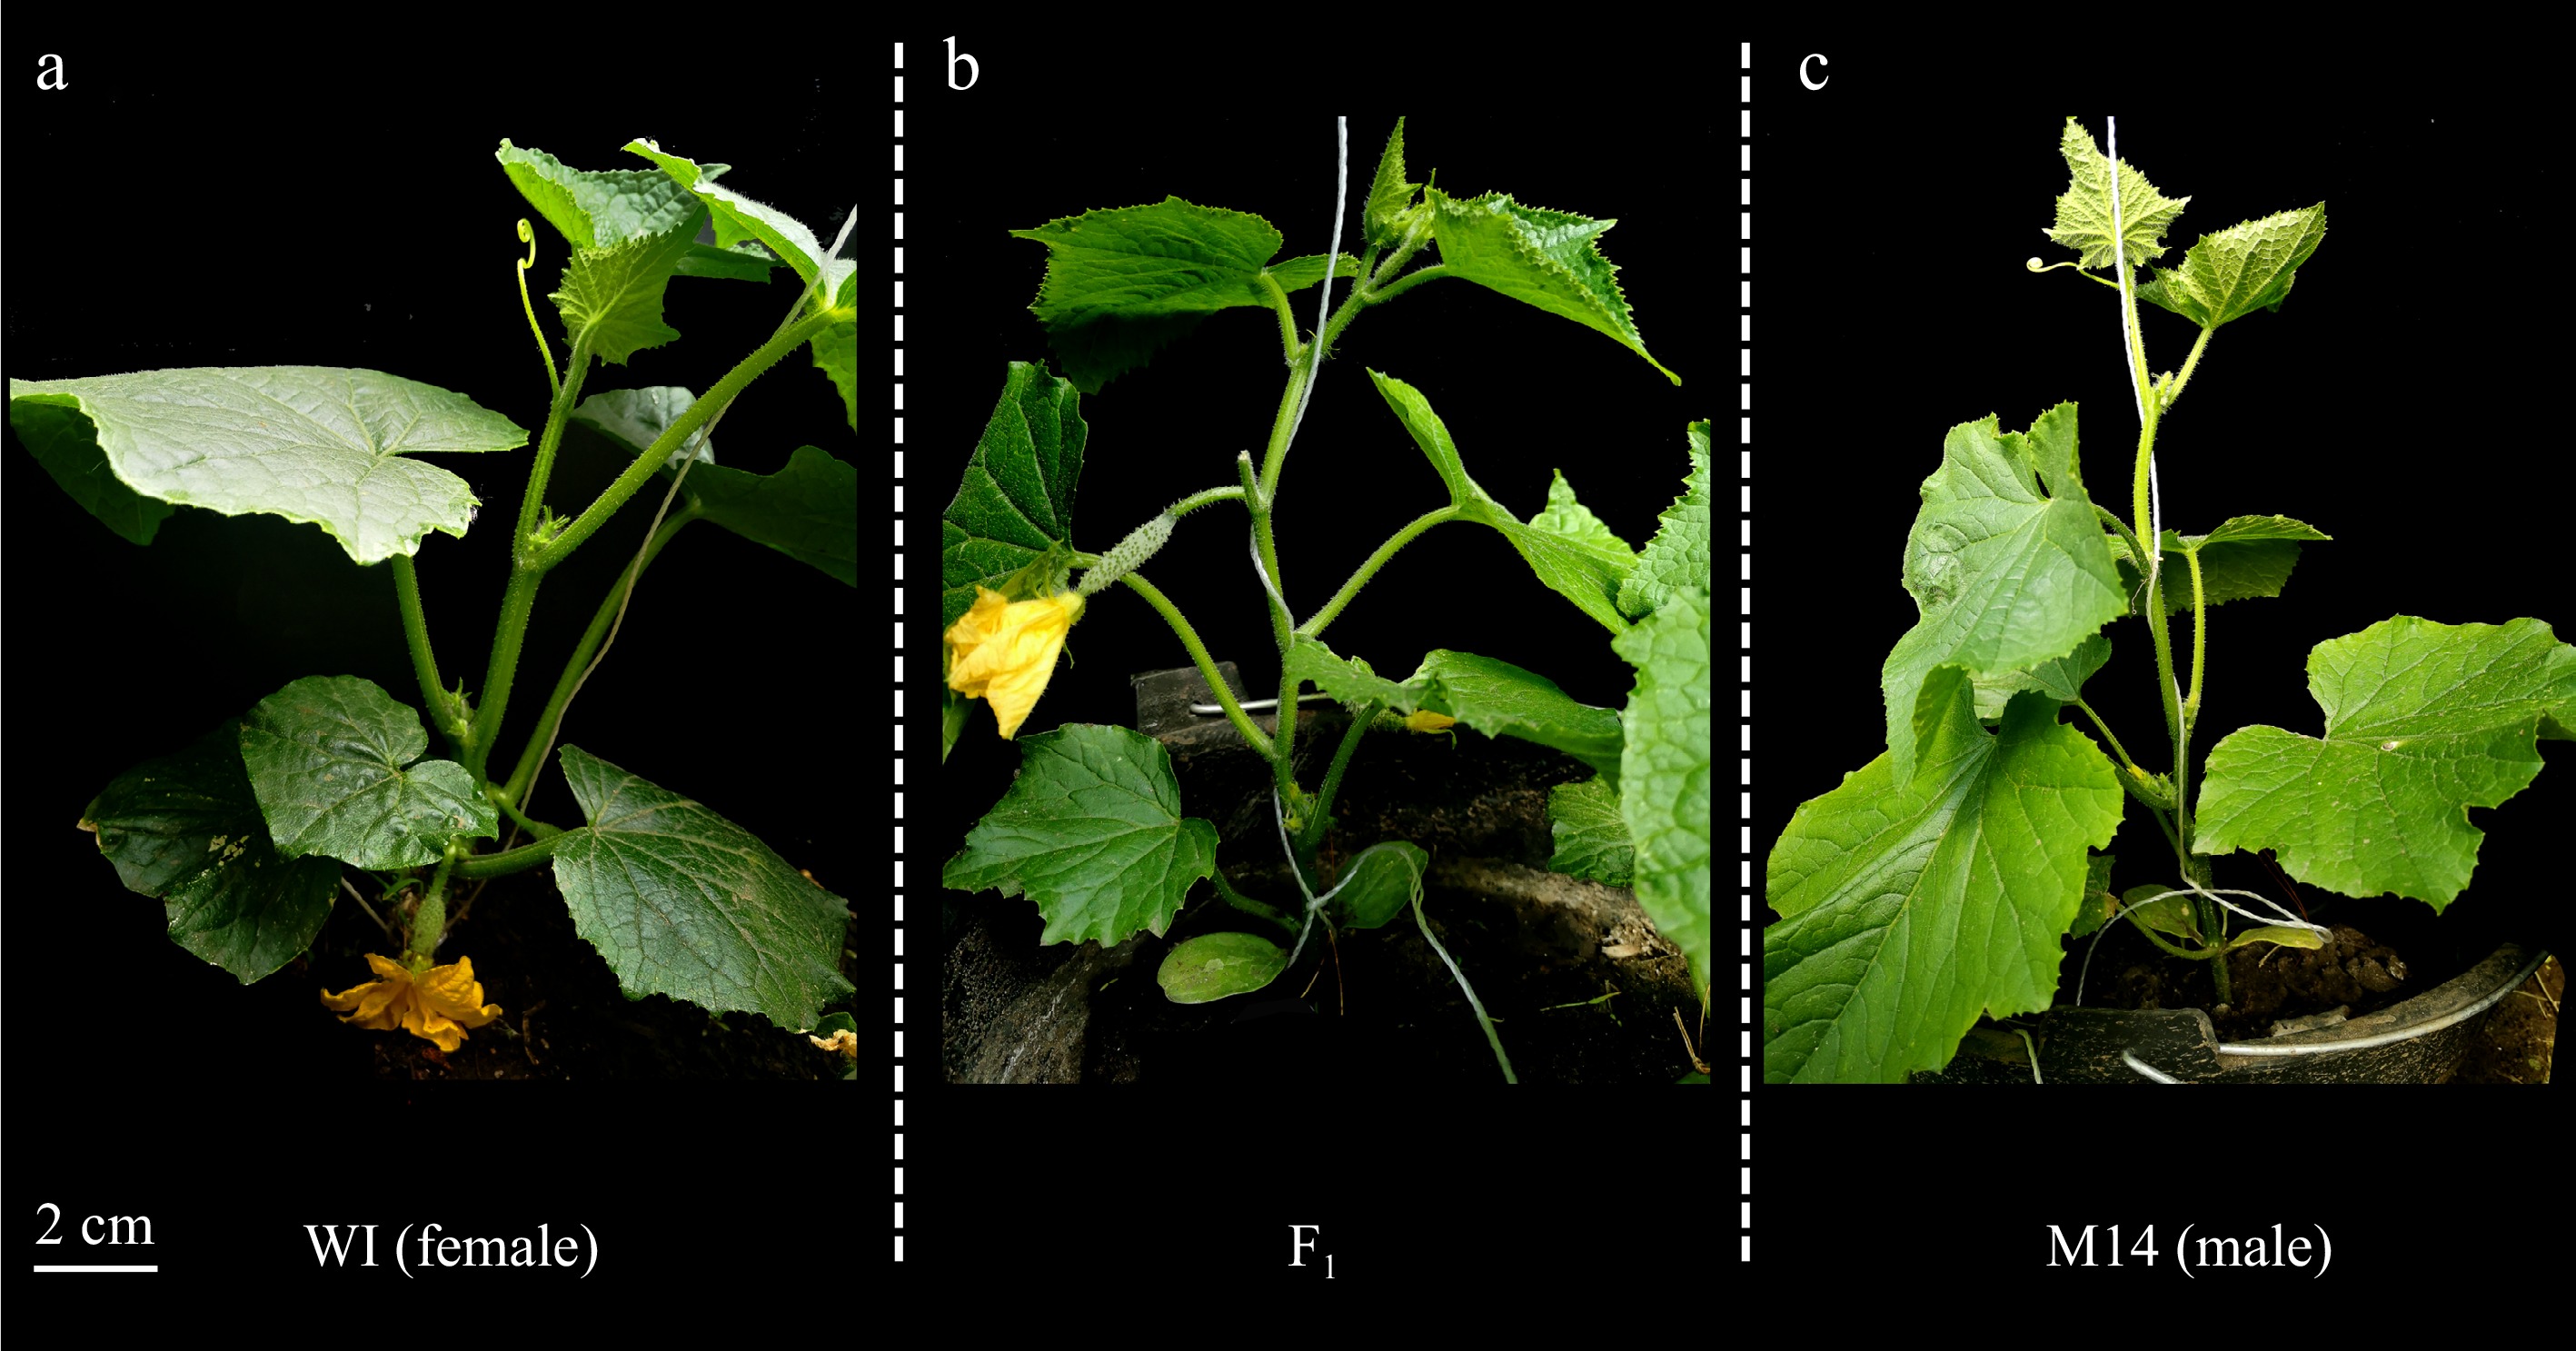
Figure 1.
Flowering phenotype of parents and their F1 plant under low-light stress.
-
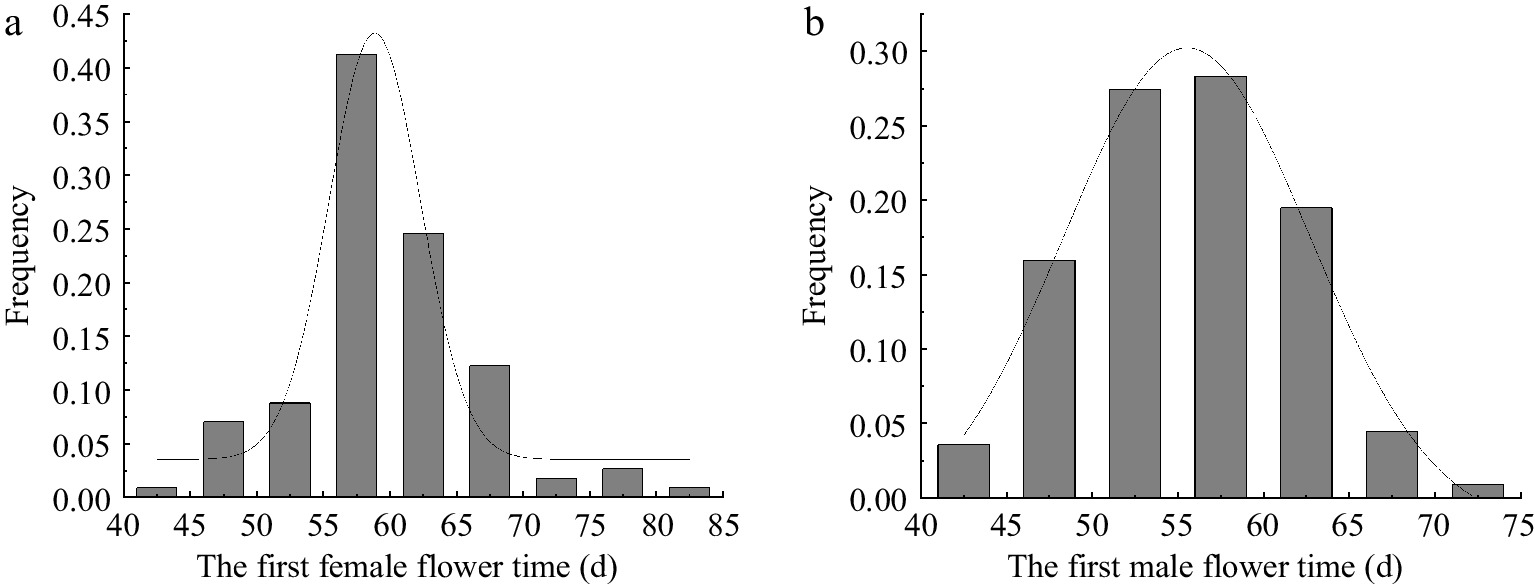
Figure 2.
Frequency distribution of (a) FFT and (b) FMT in the F2 population.
-
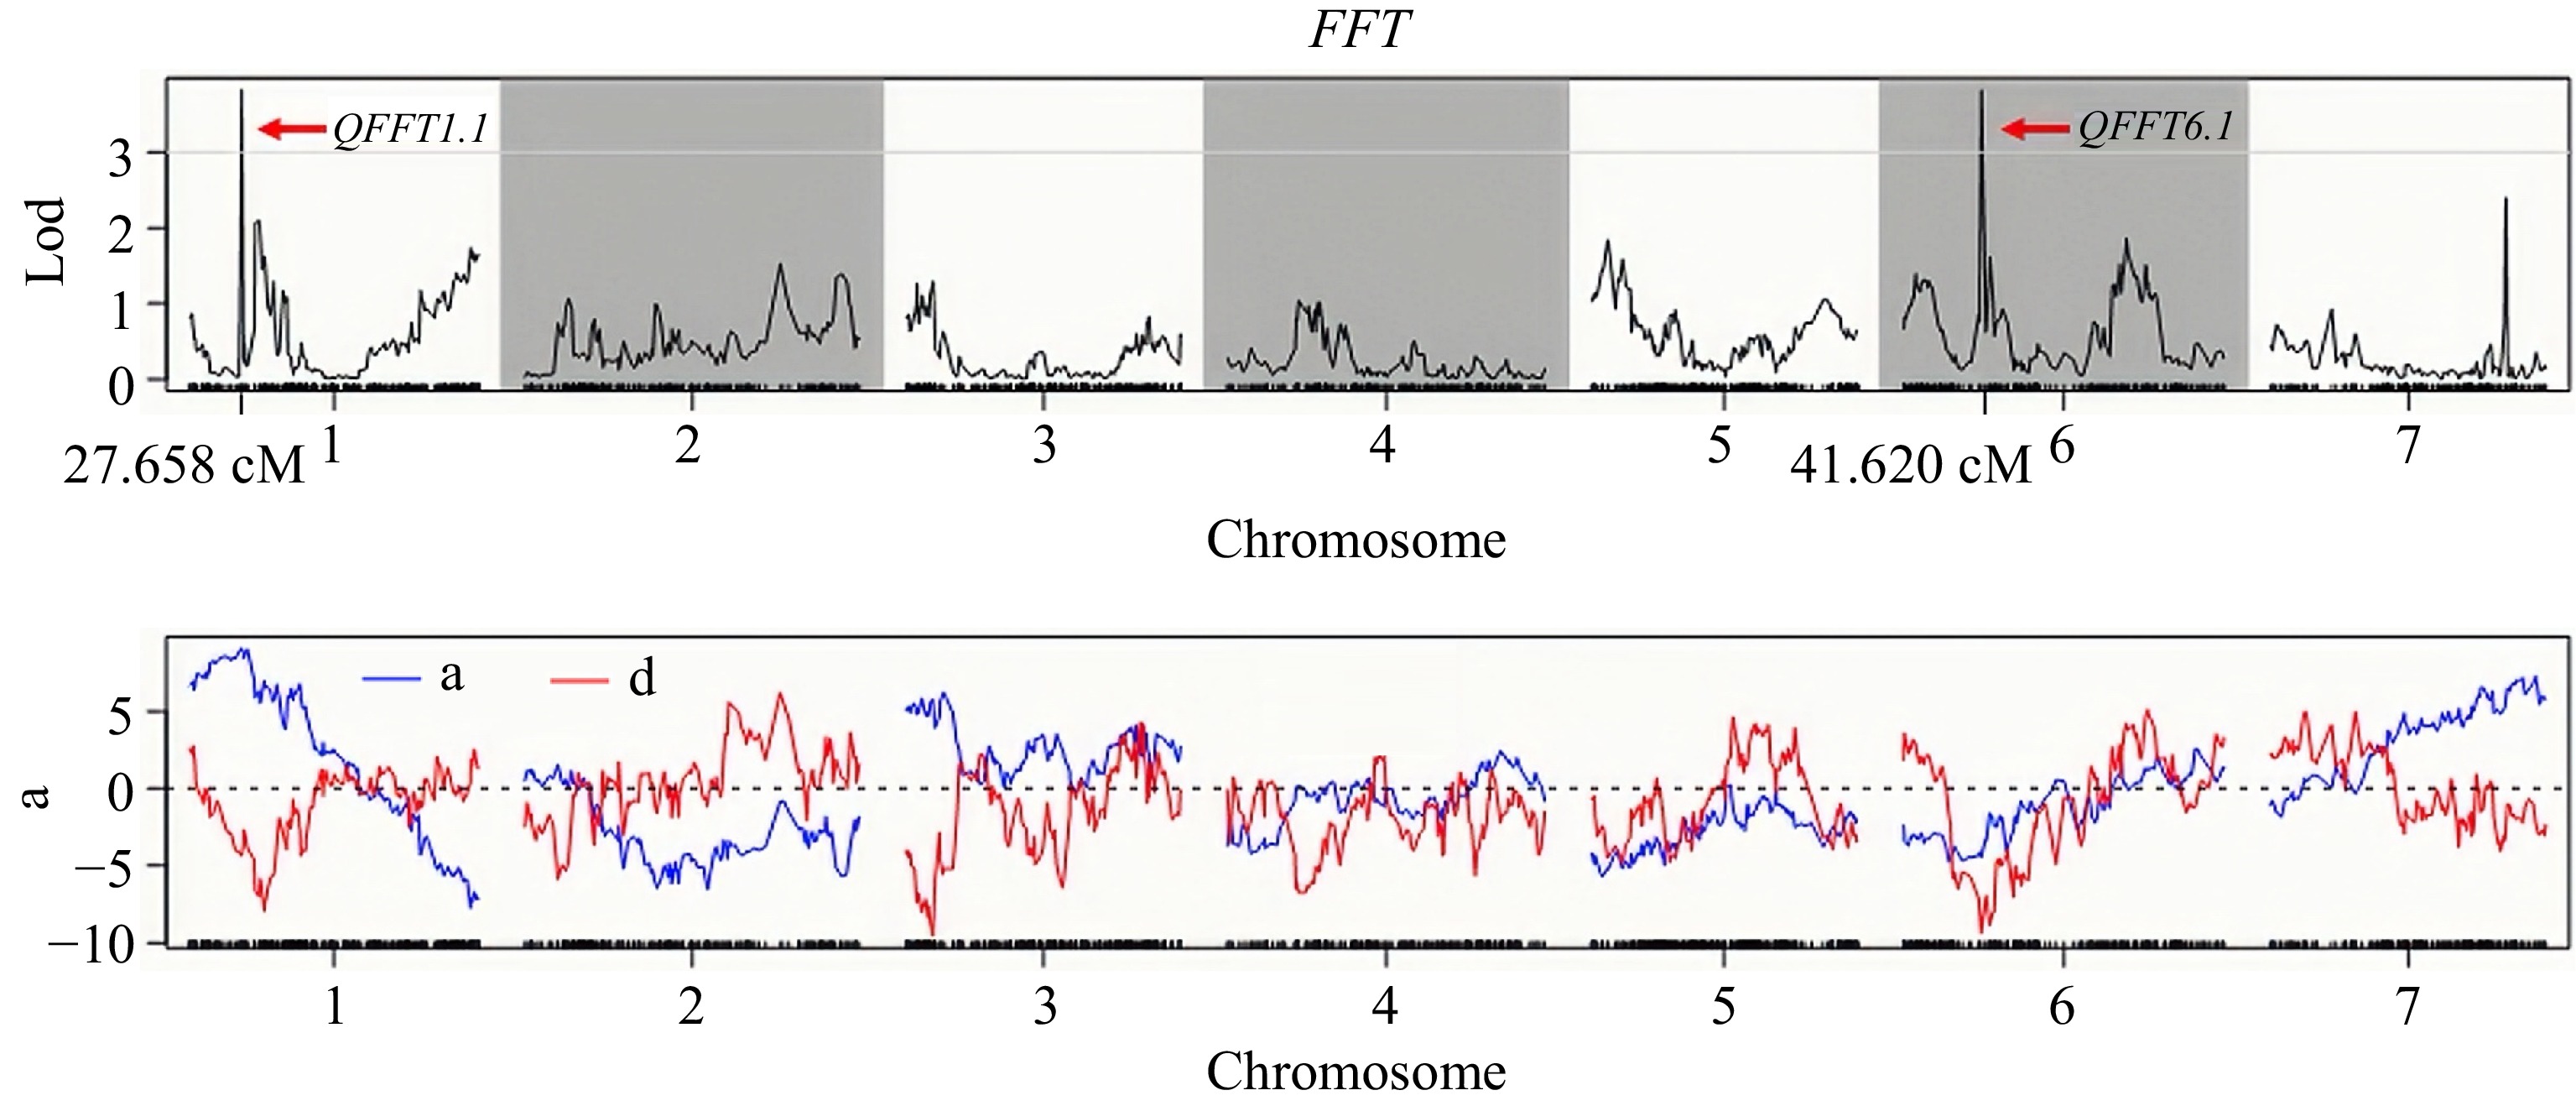
Figure 3.
The LOD value distribution of QTL loci for the FFT in the F2 population.
-
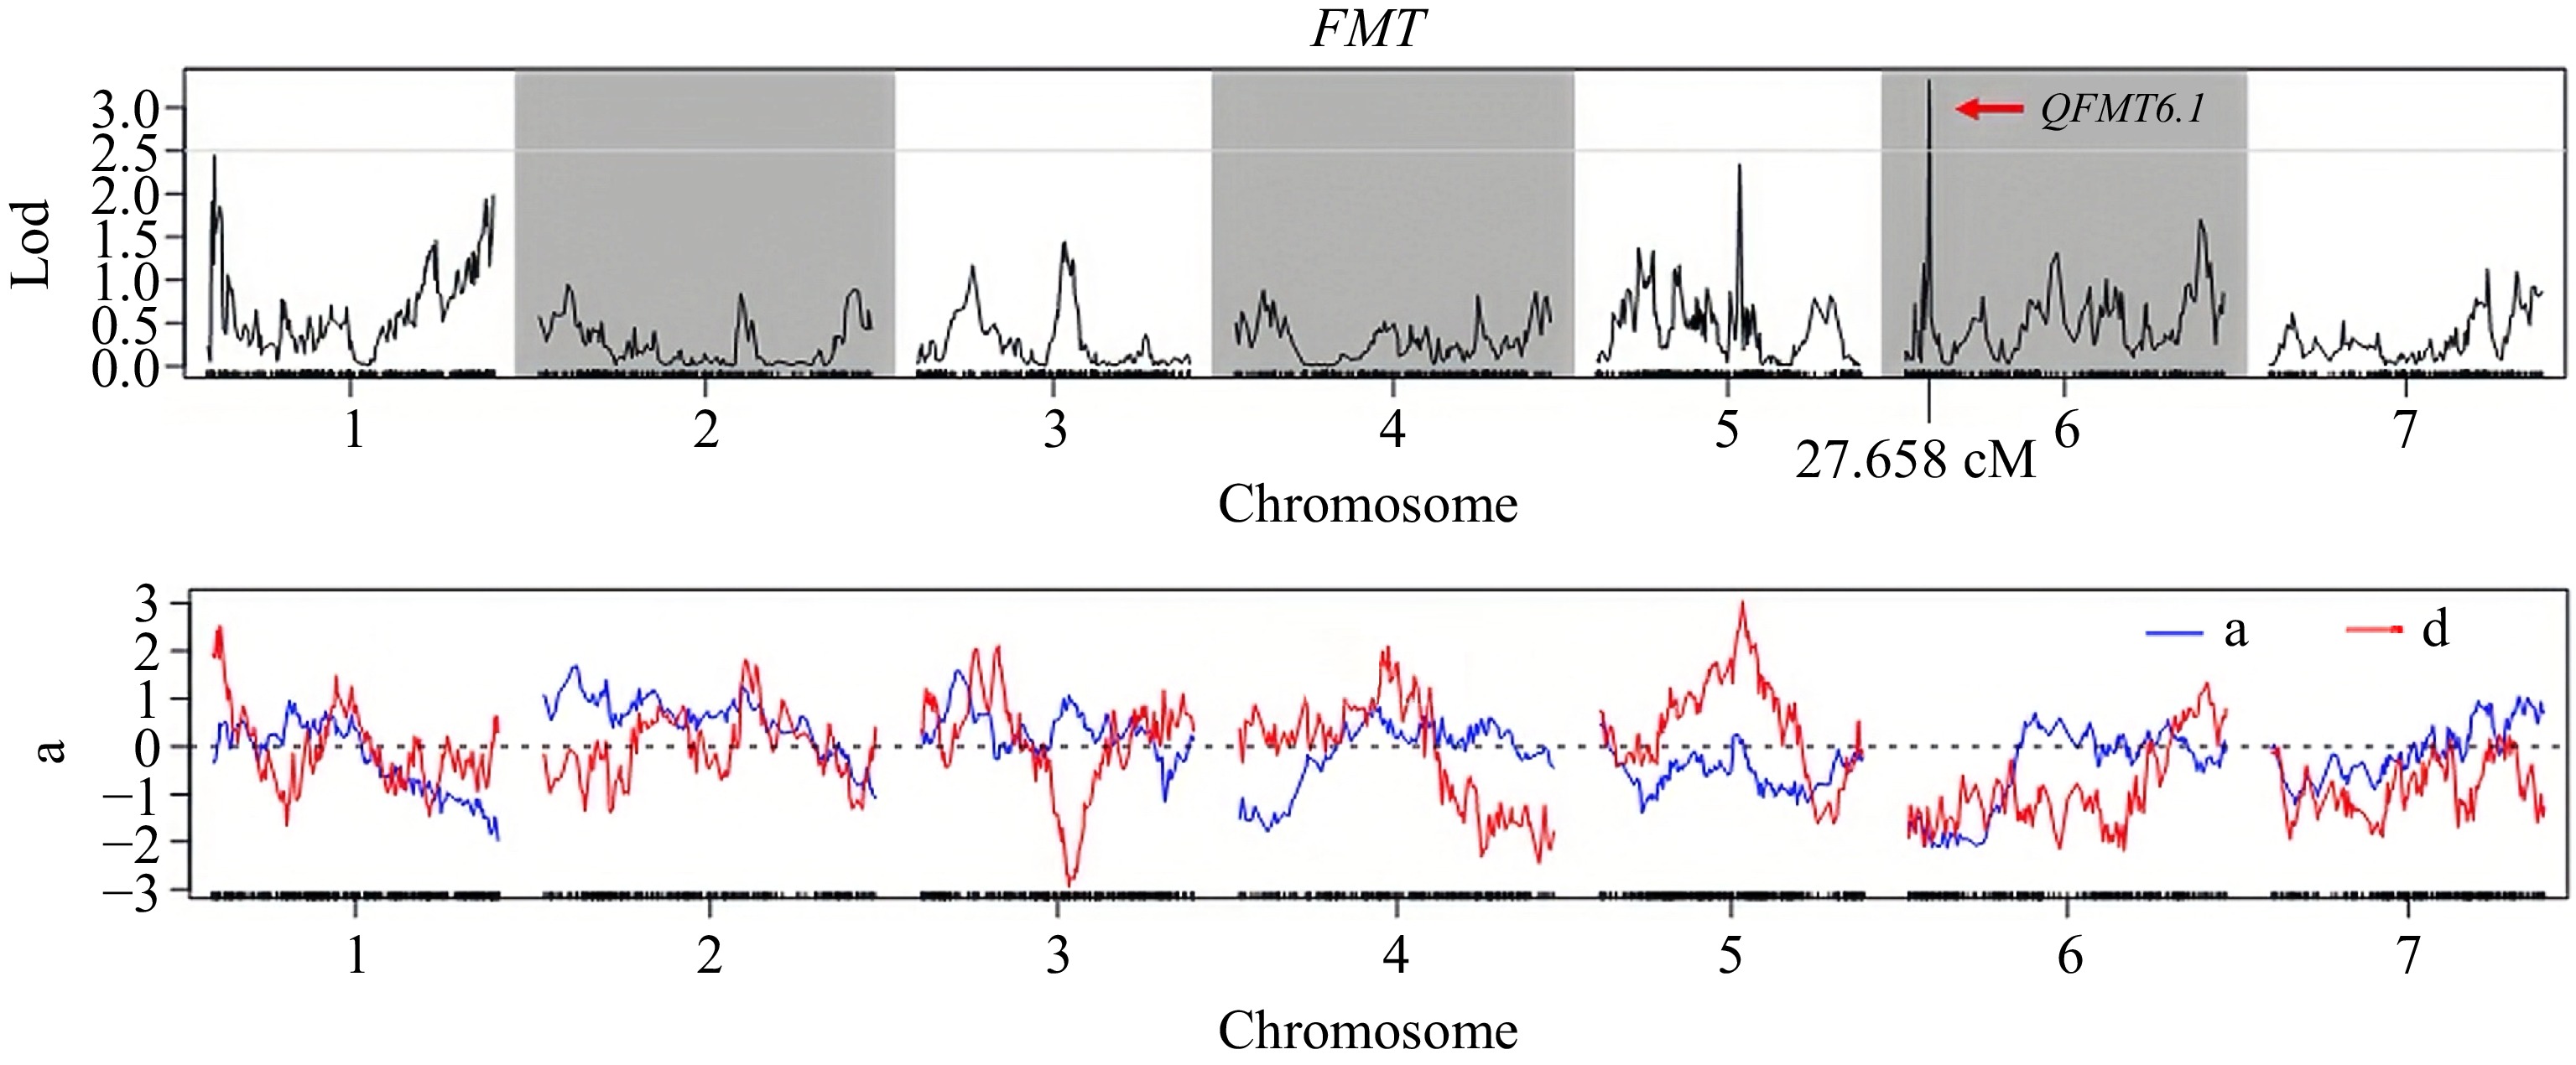
Figure 4.
The LOD value distribution curve of QTL site of the FMT in the F2 population.
-
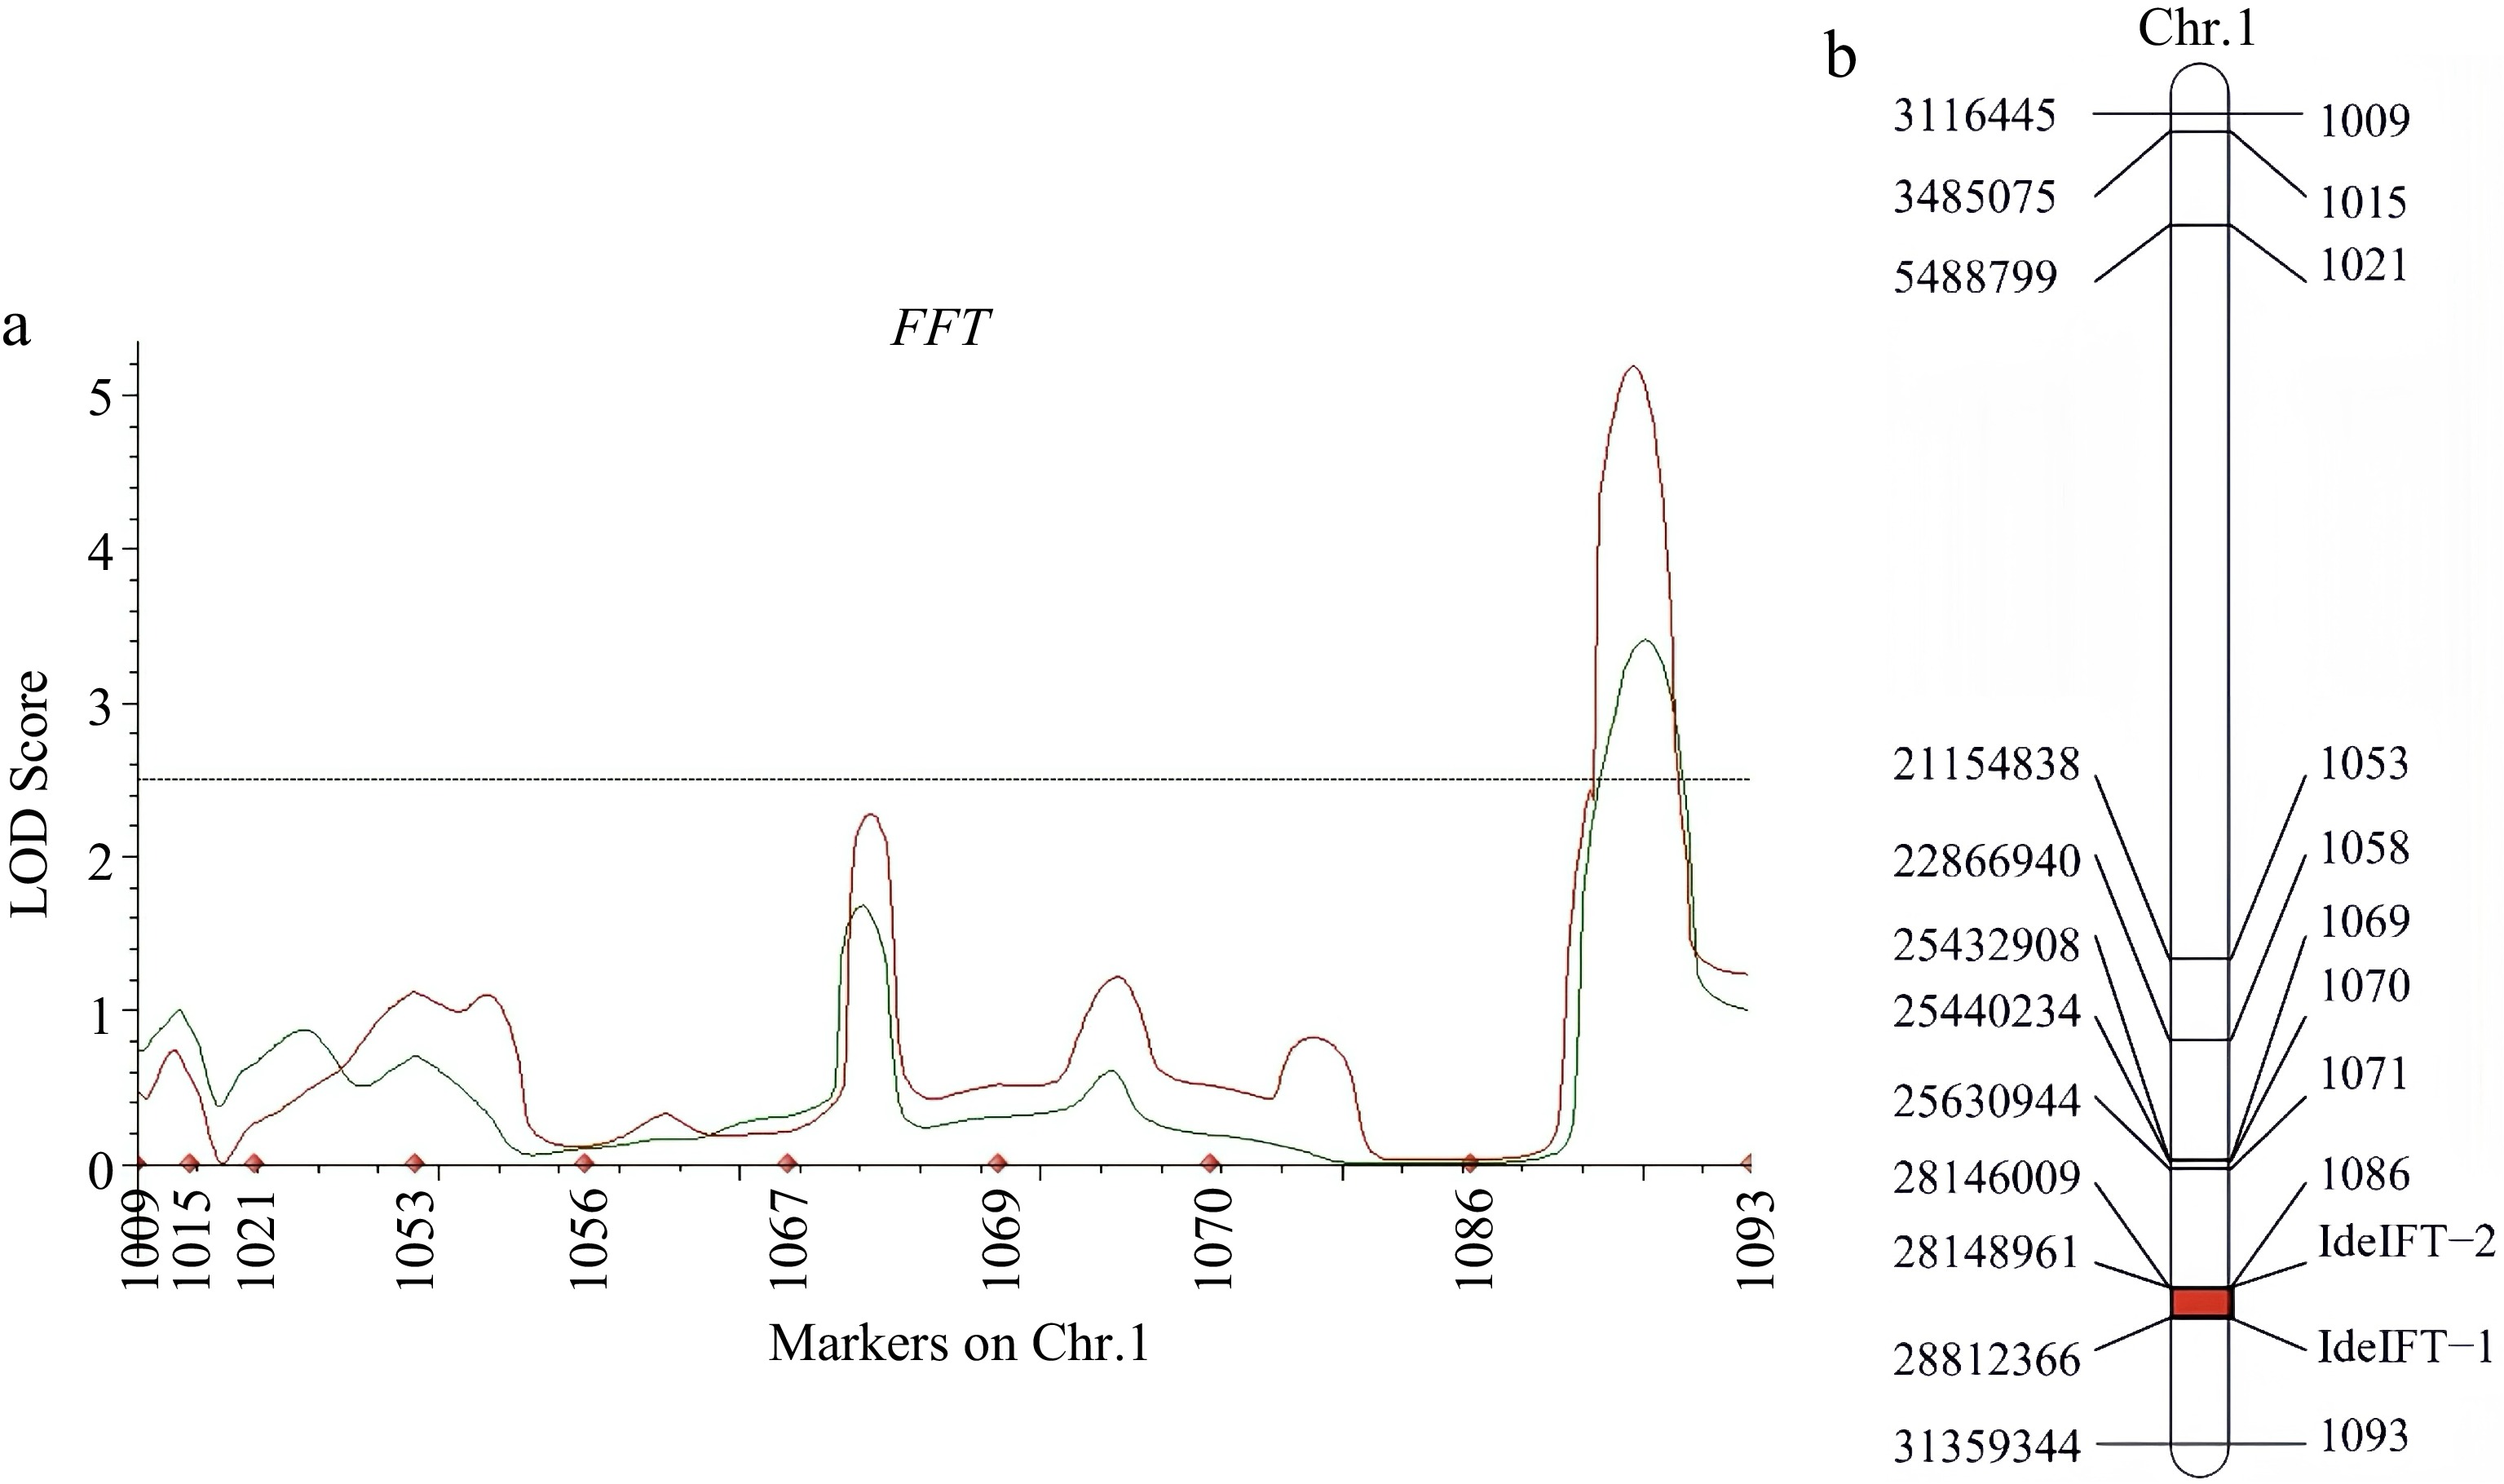
Figure 5.
(a) Quantitative trait loci curve for cucumber FFT in F2:3 populations (green) and F2 (red). The filtering threshold was set as logarithm of the odds > 2.5. (b) Linkage map of Chr.1 the final FFT mapping interval in cucumber genome based on F2:3 family populations.
-
Traits WI (P1) M14 (P2) F1 FFT (d) 55.0 ± 1.12c 68.0 ± 1.12a 60.0 ± 5.10b FMT (d) 46.0 ± 2.11c 61.0 ± 3.24a 54.0 ± 10.08b FFT: the first female flowering time; FMT: the first male flowering time; P1: parental line1; P2: parental line2. Table 1.
The flowering phenotype of different low-light tolerance cucumber lines under low-light stress.
-
Traits Range Mean (d) SD Kurtosis
(SEK)Skewness
(SES)CV FFT 49~90 60.1 ± 7.081 7.913 3.186 1.171 13.166 FMT 44~70 55.1 ± 6.005 6.213 0.521 0.413 11.285 SD: Standard deviation; CV, The coefficient of variation. CV = SD/Mean. Table 2.
Phenotype and variation analysis of cucumber flowering in the F2 population.
-
1st order
parametersEstimate 2nd order
parametersEstimate FFT FMT FFT FMT da 0.000 −13.063 σ2p 34.741 35.429 db 0.000 −10.178 σ2mg 20.678 10.090 ha 5.113 / σ2pg 0.000 20.661 hb 9.001 / h2mg (%) 59.5 2 28.48 i −5.113 / h2pg (%) 00.0 0 58.33 jab 4.160 / jba 0.000 / l −9.099 / [d] 9.529 26.828 [h] −6.797 13.262 [h]/[d] −0.713 0.450 da: Additive effect of the first pair of main genes; db: Additive effect of the second pair of main genes; ha: Dominant effect of the first pair of main genes; hb: Dominant effect of the second pair on the main gene; [d]: Polygenic additive effectivity; [h]: Multigene dominant effector value; [h]/[d]: Dominant potential-energy ratio; σ2p: Phenotypic variance; σ2mg: Main gene variance; σ2pg: Polygenic variance; h2mg (%): Main gene heritability rate; h2pg (%): polygenic inheritance rate. Table 3.
Estimates of the first- and second-order genetic parameters of flowering time.
-
QTLs Chr. Marker no. Start position (bp) End position (bp) Peak position (cM) Max LOD ADD DOM PVE (%) Gene no. QFFT1.1 1 4 4,094,997 4,101,608 27.658 3.825 9.087 −4.383 10.22 1 QFFT6.1 6 1 / / 41.620 3.817 −4.473 −9.388 10.03 / QFMT6.1 6 5 2,045,652 2,525,003 13.103 3.320 −2.123 −2.036 12.61 42 QTL, quantitative trait loci; LOD, Limit of detection; Chr., Chromosome; Max LOD, Maximum limit of detection; ADD, additive effect; DOM, dominance effect; PVE, the contribution rate. Table 4.
QTLs effect analysis and the number of candidate genes of FFT and FMT in cucumber under low-light stress.
-
FFT Gene ID Function annotation 1. CsGy1G030020 F-box protein 2. CsGy1G030030 Tyrosine N-monooxygenase 3. CsGy1G030040 Isoleucine N-monooxygenase 1-like 4. CsGy1G030050 Isoleucine N-monooxygenase 1-like 5. CsGy1G030060 Isoleucine N-monooxygenase 1-like 6. CsGy1G030070 Isoleucine N-monooxygenase 1-like 7. CsGy1G030120 Regulator of chromosome condensation (RCC1) family with FYVE zinc finger domain-containing protein 8. CsGy1G030160 Pectin lyase-like superfamily protein 9. CsGy1G030170 Polygalacturonase 10. CsGy1G030260 AT-hook motif nuclear-localized protein 11. CsGy1G030270 non-specific phospholipase C2 12. CsGy1G030290 Telomerase-binding protein EST1A 13. CsGy1G030300 Rho GTPase-activating protein 7 14. CsGy1G030350 Histone deacetylase 15. CsGy1G030360 Heat stress transcription factor B-4b-like Genes were blast in cucumber (Gy14) genome V2.1 ( http://cucurbitgenomics.org/v2 ).Table 5.
Functional annotation of candidate genes of FFT.
-
FMT Gene ID Function annotation 1. CsGy6G002770 Somatic embryogenesis receptor kinase 1(SERK1) 2. CsGy6G002910 Protein PRD1 isoform X1 3. CsGy6G002920 Protein TIC 22-like, chloroplastic isoform X1 4. CsGy6G002930 Histone-lysine N-methyltransferase 5. CsGy6G002980 MACPF domain-containing protein 6. CsGy6G002990 Chloroplastic 7. CsGy6G003000 Sn1-specific diacylglycerol lipase beta isoform X4 8. CsGy6G003020 Vesicle transport protein 9. CsGy6G003040 WW domain-containing protein 10. CsGy6G003050 Clathrin interactor EPSIN 3-like isoform X2 11. CsGy6G003060 STRUBBELIG-receptor family 5 Genes were blast in cucumber (Gy14) genome V2.1 ( http://cucurbitgenomics.org/v2 ).Table 6.
Functional annotation of candidate genes of FMT.
-
Gene ID Chr. Position WI M14 Effect type ALT proportion CsGy1G030350 Gy14Chr.1 28614154 C G Promoter 40.25% Gy14Chr.1 28615565 C T Promoter 40.00% Gy14Chr.1 28631912 G T Splice region variant and intron variant 38.00% Gy14Chr.1 28634739 T G Missense variant 38.00% Gy14Chr.1 28634748 G T Missense variant 40.00% CsGy1G030020 Gy14Chr.1 28181730 T C Splice region variant and intron variant 14.04% CsGy6G002770 Gy14Chr.6 2129884 CACATAG C Indel 10.75% Gy14Chr.6 2122291 A G Promoter 10.12% Gy14Chr.6 2129636 A G Splice region variant and intron variant 10.50% CsGy6G002920 Gy14Chr.6 2261766 G A Promoter 12.38% Table 7.
Analysis of parental variation sites and natural population gene diversity of four candidate genes.
Figures
(5)
Tables
(7)